THE DROUGHT SITUATION IN SOUTH AFRICA AND ACTIVITIES PRESENTATION BEING UNDERTAKEN
|
|
|
- Mavis Greene
- 5 years ago
- Views:
Transcription


1 THE DROUGHT SITUATION IN SOUTH AFRICA AND ACTIVITIES PRESENTATION BEING UNDERTAKEN TITLE Presented Presented by: by: Mr Kwazikwakhe Name Surname Majola Directorate: Directorate Water Information Programmes, Department of Water and Sanitation Date In collaboration with: Mr Andy Sambo and Ms Carey Rajah 18 April 2016 DHI-SA 2016 ANNUAL CONFERENCE, April 2016
2 CONTENT OUTLINE Background Drought situation in SA Drought Intervention / Mitigating Measures Drought Information Management - NIWIS
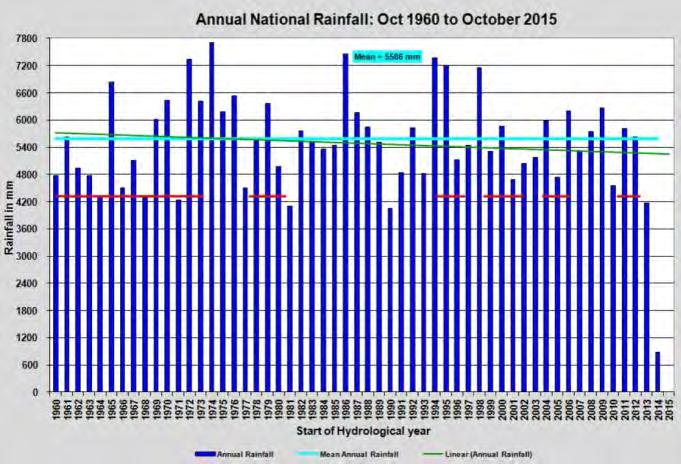
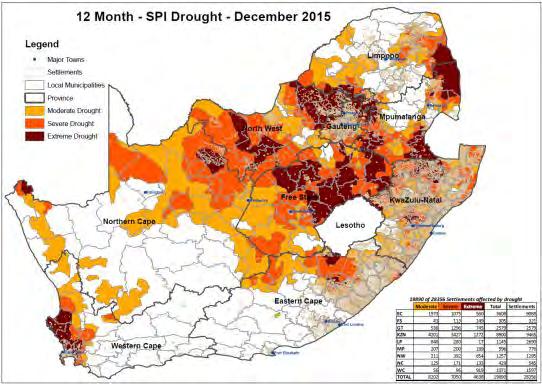
3 Background South Africa is a water scarce and arid country receiving ~495 mm/a which is less than the world average rainfall of 860 mm/a. Drought slowly began in 2014 and rapidly spread throughout the country It first affected the most eastern part of the country and specifically northern parts of KwaZulu-Natal and south eastern parts of Mpumalanga provinces At least 70% of South African settlements now affected by a seemingly 1-in-10 year drought Droughts have been declared in all provinces except Gauteng, through either provincial or district declarations (Ref: Drought Response Plan and Status, January 2016)

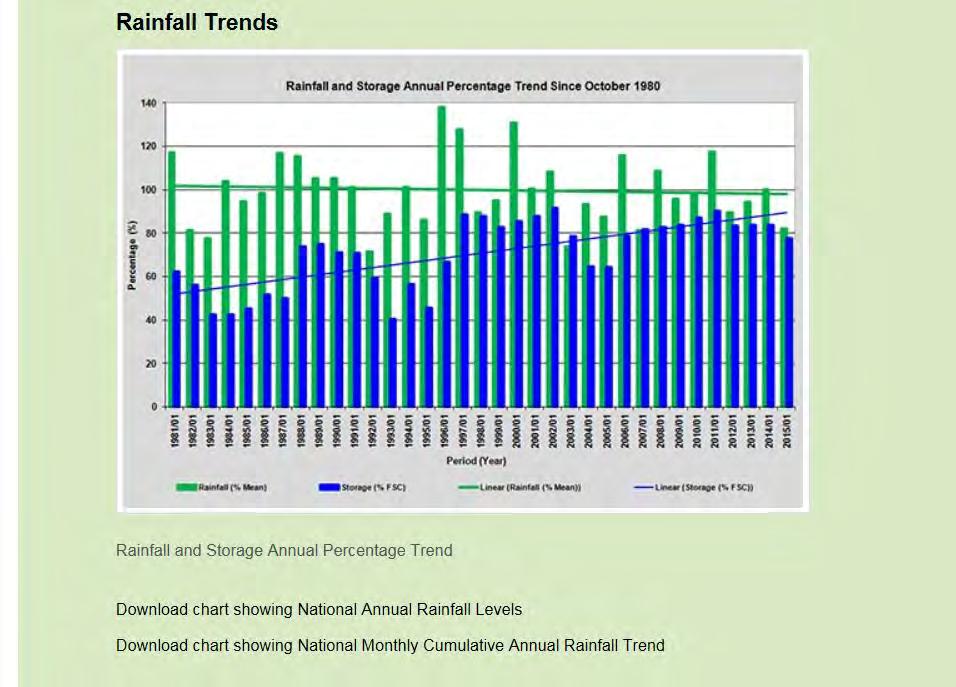
4 Rainfall Conditions fairly favorable for rainfall over the eastern and central areas during February 2016; overall less rain than in January. By comparison February 2016 had more rainfall than February mm across parts of Northern and Western Cape provinces mm across parts of KwaZulu- Natal and Mpumalanga provinces

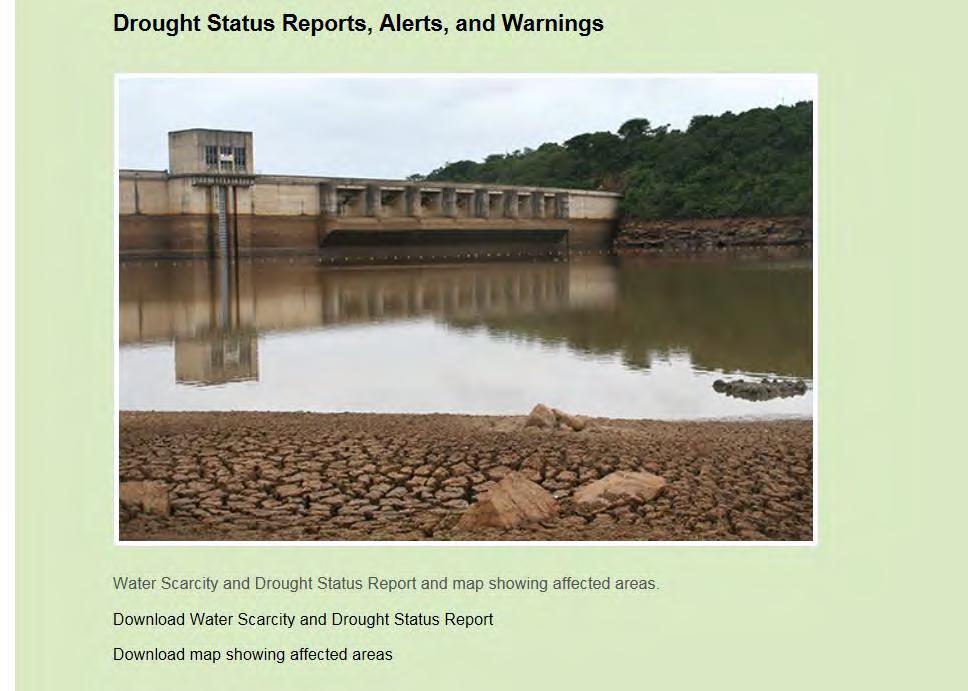
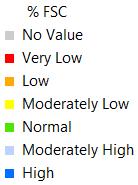
5 Severe to extreme drought conditions affected parts of all provinces. Mostly KwaZulu-Natal, Mpumalanga, Free State, and Limpopo.
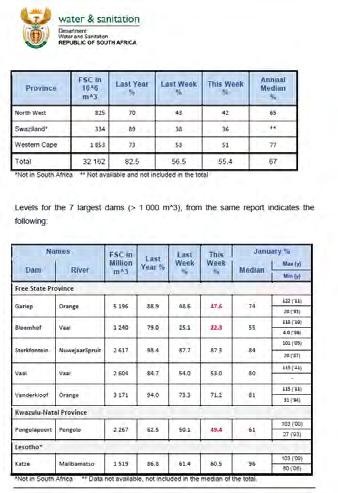
6 Current situation in SA - Water in Storage per Province Province FSC in 10 6 m^3 No of Dams Dams 40% Dams 100% 06/04/15 Last Year % 28/03/16 Last Week % 04/04/2016 This Week% Eastern Cape ,3 74,4 73,8 Free State ,7 53,4 53,3 Gauteng ,5 88,8 89,0 KwaZulu-Natal ,5 52,6 52,2 Lesotho* ,5 52,3 51,8 Limpopo ,9 62,5 62,3 Mpumalanga ,5 66,1 65,7 Northern Cape ,9 62,0 59,9 North West ,6 66,9 66,6 Swaziland* ,5 30,9 30,3 Western Cape ,2 32,1 31,1 Total ,3 54,9 54,6


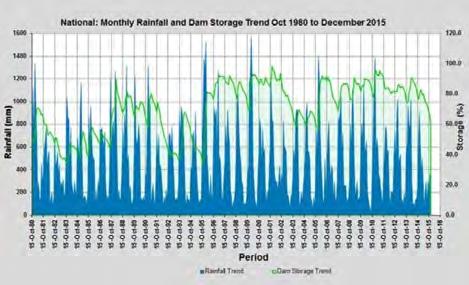
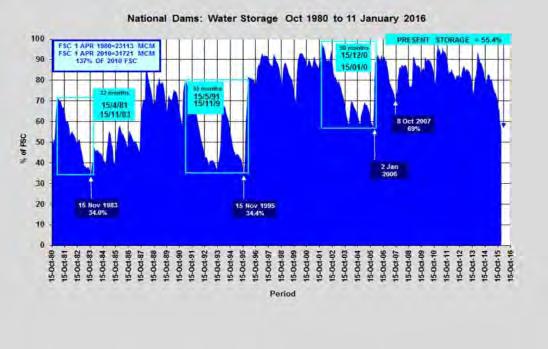
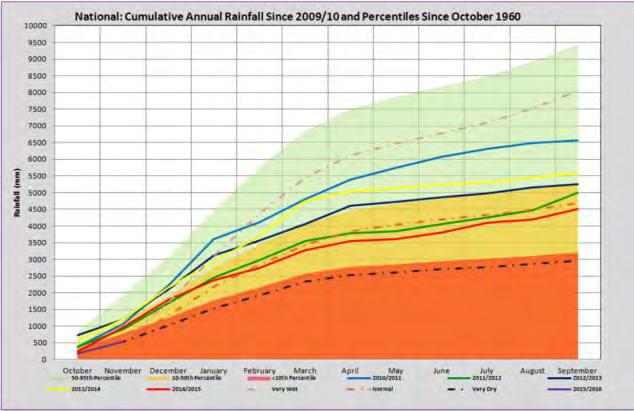
7 Reservoir storage trends in SA Annual storage trends since 2006/07 HC 2015/16 HC lowest in comparison National reservoir trend since December /16 HC - 13 th lowest by December 2015
8 Groundwater resource Groundwater is much slower to be affected by drought than surface water Proved to be a good buffer against drought it is essential to identify potentially drought resilient aquifers that can be targeted for water supply to sustain areas of few or no alternative water sources vandalism and a lack of maintenance of infrastructure a problem in SA Groundwater levels generally following a gradually declining trend in the country Drastic decline in local cases due to over-abstraction, irrigation, plantations, supply, lack of recharge, or a combination of factors Decline observed in parts of all provinces during drought but mainly stable with seasonal fluctuations.

9 Difference in groundwater levels

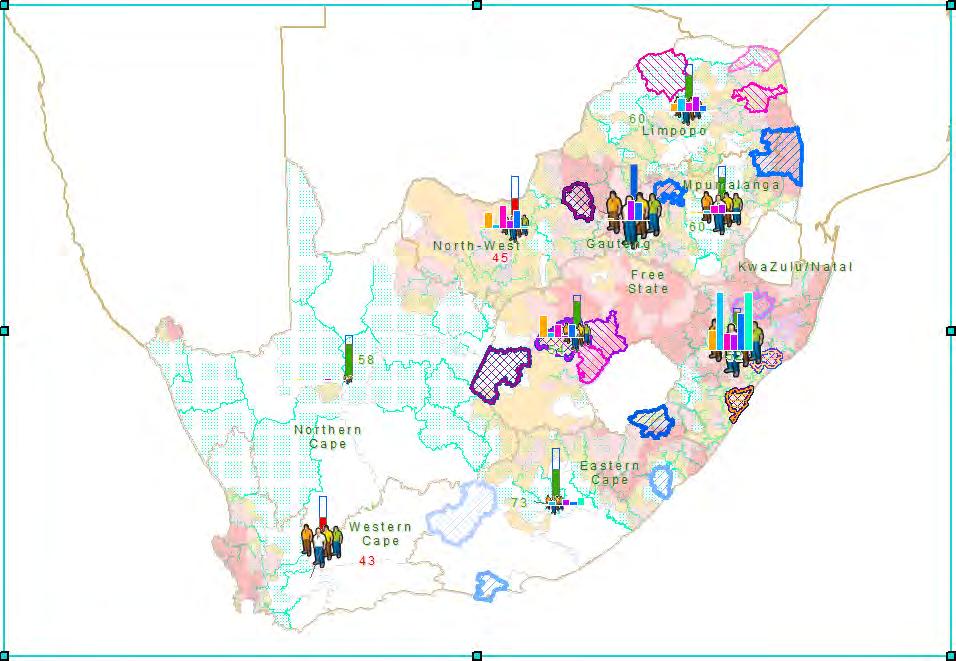
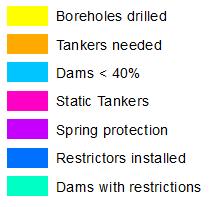
10 Settlements affected by drought
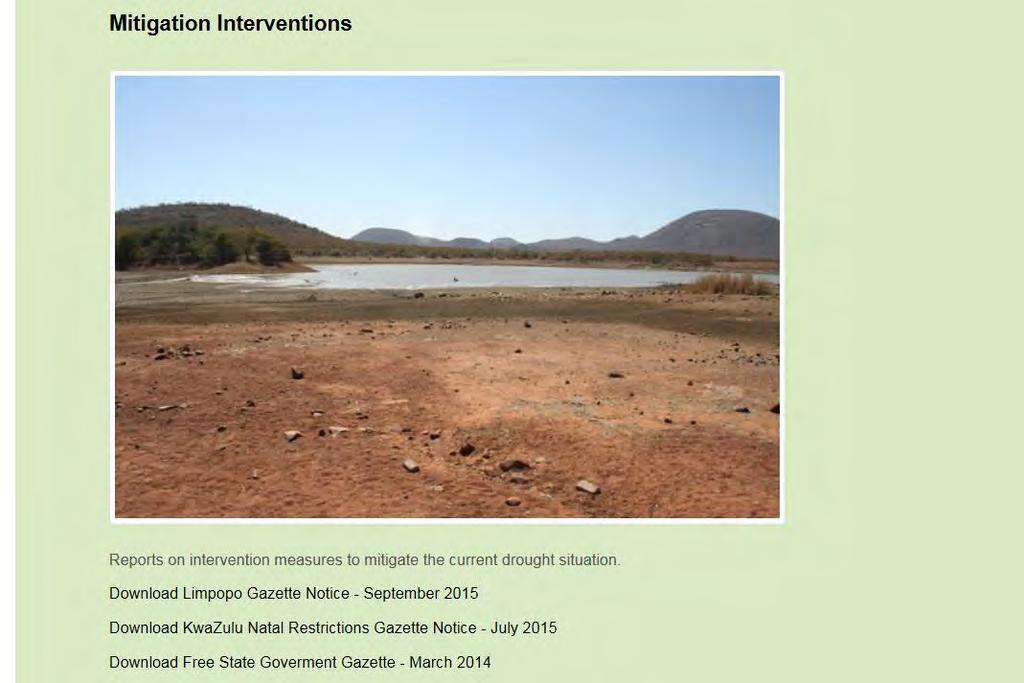
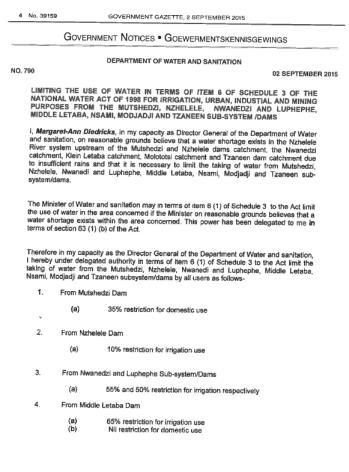
11 Interventions Hiring of interim water tankers Procurement of water tankers Refurbishment of existing Schemes Rehabilitation of existing boreholes and drilling of new ones Spring protection Installation of static tanks (589 in KZN) Implementation of restrictions & rationing WC/WDM e.g. rainwater harvest, war on leaks, etc. Water transfers e.g. othongathi to Hazelmere Dam in KZN Other projects e.g. installation of restrictors in ethekwini, Ugu, Zululand and Umzinyathi Communication platforms/campaigns, JOCs, Forums, etc.
12 Drought Intervention By Tankers Province Number of Tankers By DWS Municipalities Others Total KwaZulu-Natal hired 159 Free State GotGs 78 Limpopo 0 78 * 78 Mpumalanga 0 54 * 54 North West 40! * * 40 Eastern Cape * 57 Northern Cape 0 10 * 10 Western Cape 0 2 * 2 Gauteng 0 * * 0 TOTAL
13 Province Drought Intervention Boreholes Number of Boreholes Refurbished Newly Drilled Total Working KwaZulu-Natal Free State Limpopo Mpumalanga North West * * 0 Eastern Cape 30 * 30 Northern Cape * Western cape * * 0 Gauteng * * 0 TOTAL
14 Medium to Long term mitigating measures Medium term measures: domestic rain water harvesting, hydro-census on current groundwater utilization and possible future use, dolomitic aquifer abstraction and recharge. integrating groundwater and surface water use in the future, small scale emergency desalination, further water transfers, Long term measures: review all state owned reservoir operating rules, incorporate all municipal and privately owned dams into the management system for future, further transfer schemes to improve drought resilience, large scale desalination options, institutionalize the conjunctive use of surface and ground water, water quality management with initial focus on WWTW, construction of new dams/reservoirs, long term solution for AMD.
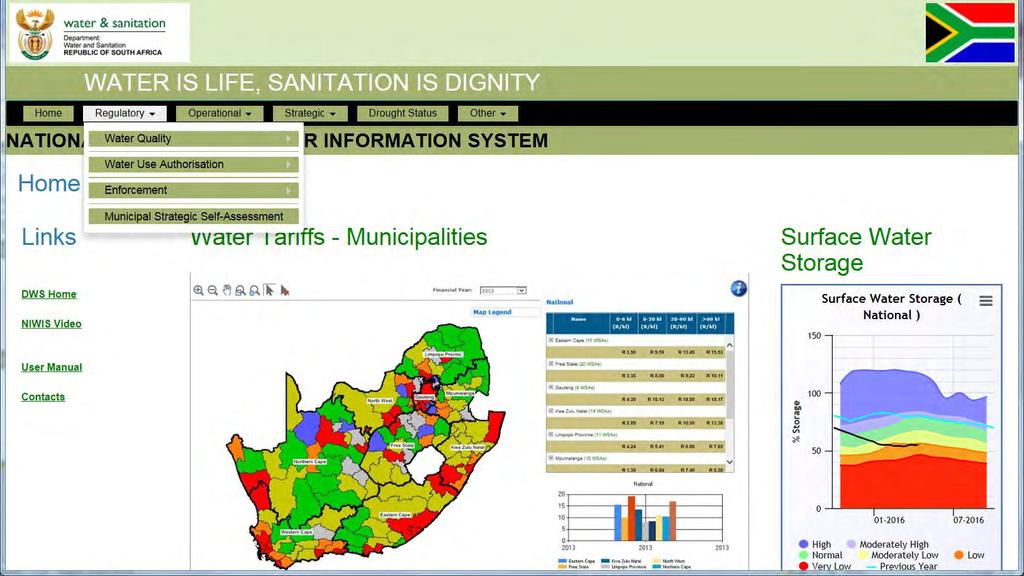
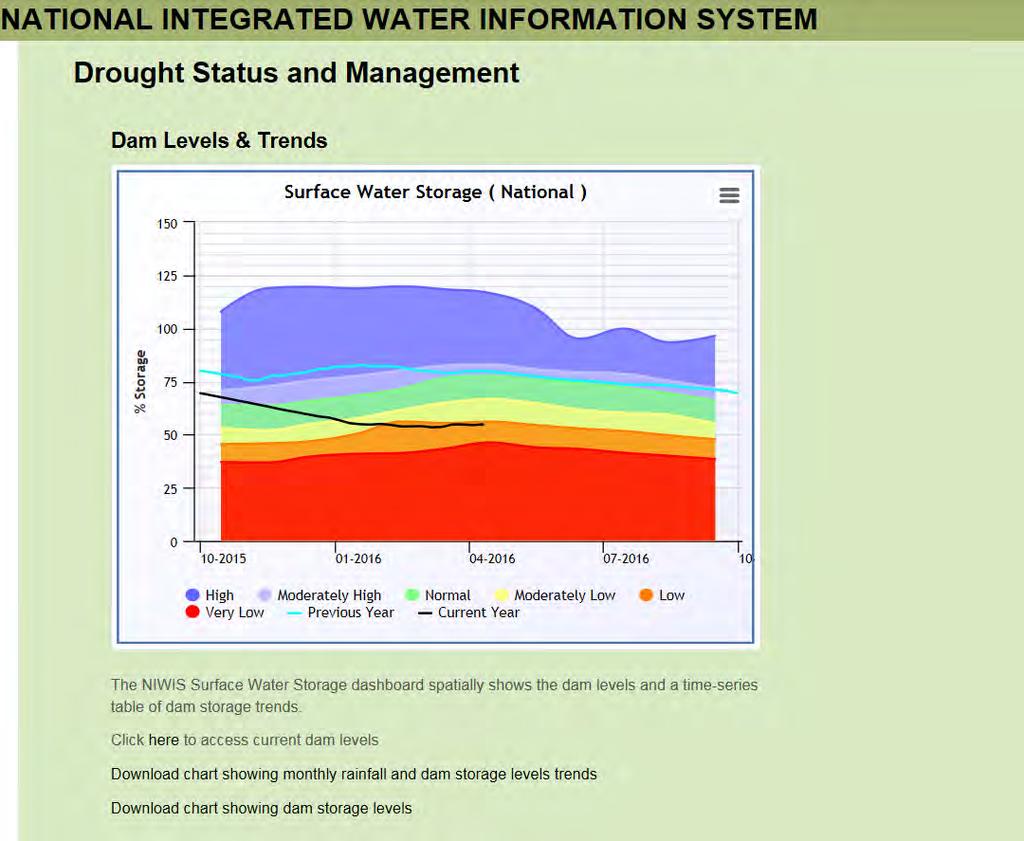
15 National Integrated Water Information System (NIWIS) NIWIS is a National Integrated Water Information System developed in response to the National Water Act in order to provide decision-makers with one source of information to make sound decisions to manage and protect SA water resources as well as to provide water to everyone and ensure the sustainability of water quality for the future. The system provide surface and groundwater availability as well as water scheme and access to reliable water supply information to be used in planning for infrastructure of new communities. Areas where reserves have been determined are displayed which ensure that our resources are protected for future use. Licensing, enforcement and reservoir supply risk information are available to ensure that resources are protected and the use is regulated and in order to provide enough clean water for now and in the future. Human Capital information is available to ensure that the department has the necessary resources to manage and protect our water resources and that sanitation is efficiently addressed. Monitoring Network information is provided to ensure that resources are regularly monitored not to deteriorate. By combining the availability of water and other climate information such as temperature and rainfall it is possible to show which areas will be affected by drought.


16
17

18
19
20

21

22

23 Thank You