Global flood inundation forecasting combining GloFAS and flood hazard maps: A case study of the 2017 Brahmaputra floods
|
|
|
- Nathan Thornton
- 5 years ago
- Views:
Transcription

1 Global flood inundation forecasting combining GloFAS and flood hazard maps: A case study of the 2017 Brahmaputra floods Hydrological Services for Business 8 th May 2018 John Bevington, Beatriz Revilla-Romero, Charles Allatson, Sally Dempsey, Elizabeth Wood

2 Flood Foresight Near real-time and forecast flood inundation maps for riverine flooding Enables flood early warning and improved targeting of mitigation and response activities Imagery Source: Esri, DigitalGlobe, GeoEye, Earthstar Geographics, CNES/Airbus DS, USDA, USGS, AeroGRID, IGN, and the GIS User Community


3 Exposure / Asset data Post-event maps and loss assessment Rainfall forecast Modelling and mapping Near real-time inundation maps Flood Forecast impact / loss estimation Forecast flood inundation maps Early warning

4 Mapping the full lifecycle of floods Demonstration


5 Dynamic, operational Static, pre-computed How it works Flood Mapping Generalised 2D hydraulic modelling with national coverage JBA Flood Maps Library of mapping model outputs Database of AEP to outline flood depth lookups 1. Real-time (gauged) or forecast (modelled) in-channel levels or flows 2. Lookup between in-river conditions and impact mapping 3. Select flood outline with closest match to forecast conditions 4. Intersect with flood receptors to derive impacts information


6 JBA Flood Hazard Maps 30m resolution undefended river flood and surface water hazard maps Indicative flood extent and depths for 6 return periods: 20-year 100-year 500-year 50-year 200-year 1,500-year DigitalGlobe, GeoEye
7 Dynamic, operational Static, pre-computed How it works Flood Mapping Generalised 2D hydraulic modelling with national coverage JBA Flood Maps Library of mapping model outputs Database of AEP to outline flood depth lookups 1. Real-time (gauged) or forecast (modelled) in-channel levels or flows 2. Lookup between in-river conditions and impact mapping 3. Select flood outline with closest match to forecast conditions 4. Intersect with flood receptors to derive impacts information

8 8 Brahmaputra pilot August 2017


9 Brahmaputra Pilot Project Brahmaputra river basin: 30 m resolution flood hazard maps Daily updates 0-10 day forecast Ensemble forecast (fluvial) allowing uncertainty and likelihood assessment Flood Foresight inundation footprint (16 August 2017)

10 Results flood peak animation Click image to animate
")

11 Ensemble-based flood likelihood Use of probabilistic footprints to assess the confidence of the forecasts at longer lead-times Higher probability (dark colours) shows greater agreement of the ensemble and therefore higher probability of flooding. It is essential to understand uncertainty when used in public alert systems. Preliminary data
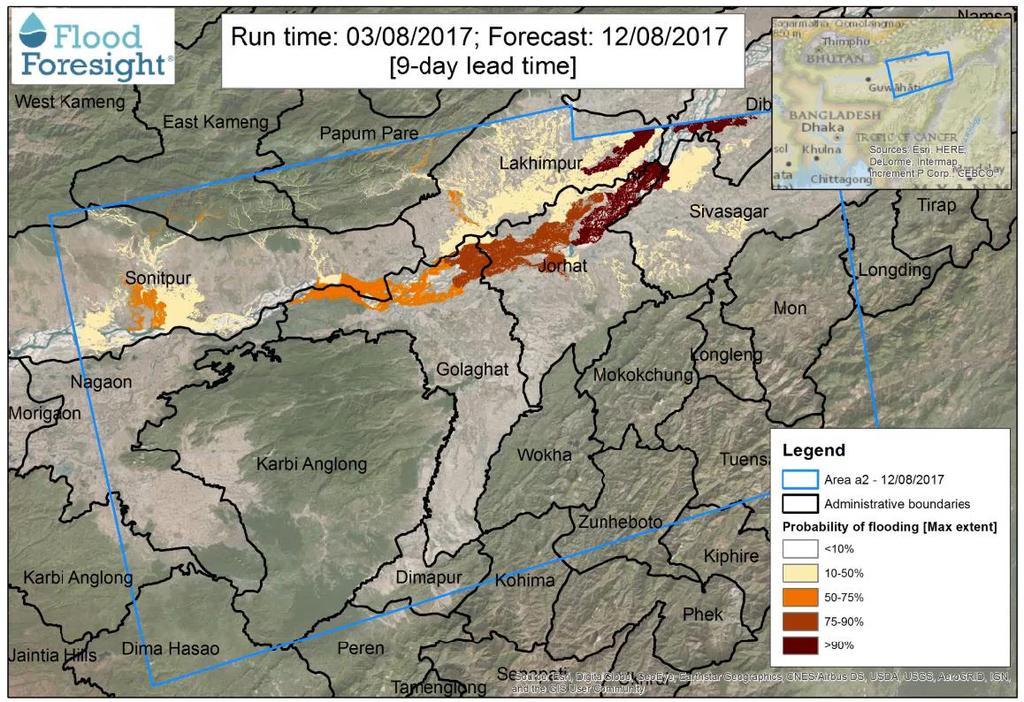
12 Probabilistic forecasting


13 Area flooded per District - Comparison Most potentially affected districts in the area: Sonitpur, Jorhat, Golaghat and Lakhimpur.
 1,200,000 1,000,000 800,000 600,000 400,000 200,000 0 t t-1 t-2 t-3 t-4 t-5 t-6 t-7 t-8 t-9 Flood Foresight - Lead time *t=0 no")
14 Population Potential population impacted by flooding- Comparison Input data: Sentinel 1 vs Flood Foresight 2,000,000 1,800,000 Potential population impacted by flooding on the 12th August - Area a2 1,600,000 1,400,000 Flood Foresight [90% Threshold] Sentinel 1 (t) 1,200,000 1,000, , , , ,000 0 t t-1 t-2 t-3 t-4 t-5 t-6 t-7 t-8 t-9 Flood Foresight - Lead time *t=0 no ensemble spread
15 Summary GloFAS + Flood Foresight: GloFAS allows us to scale Flood Foresight globally Supporting decision-making in several sectors Provides consistent methodologies and data for (trans)national flood and impact analysis Provides a framework for flood forecasting to make use of the best available data Flood maps, gauge data, forecast data, EO data Flexible integration Opportunities data providers and commercial evaluations
16 Thanks Contact: