ewater Source Australia s National Hydrological Modelling Platform
|
|
|
- Reginald McGee
- 5 years ago
- Views:
Transcription
1 ewater Source Australia s National Hydrological Modelling Platform
2 Guiding Principles for Modelling Adaptive Complexity. Matching models, data and outcomes (e.g. as study becomes more complex, use more complex models, evaluate uncertainty) Flexibility foster research and address uncertainty No one right solution multiple options (e.g. all models are approximations, additional uncertainty ) Openness and Community Collaborative approach to development and access (e.g. free, open development platform) Defensible Good/Best Practice - Tools and Applications (Good Practice Guidelines)

3 Multi-Function Hydrological Framework 7 catchment filter models 11 Catchment Runoff models 5 Catchment Export Methods 11 link routing models 3 link decay models


4 Flexible Structure Nodes representing points of interest, physical and management characteristics


5 Water Quality Catchment Load Generation Rainfall runoff model Constituent generation model Filter Model - The combination of processes produces an output for a particular landuse type within a subcatchment Node


6 Reservoirs and Dams Storage volume/area/level relationship Multiple types of outlets (spillway, gated spillway and valve) Multiple outlet paths Seepage Net evaporation Hydropower Ownership: Shares of volume and outlet capacity, internal spilling and ceding Order water from upstream storages to maintain targets

7 Demand Models Different demand models Time series Expression Irrigation Urban Environment Water user storage (on-farm or urban) Multiple extraction points including groundwater Multiple licences with priority setting Recharge to groundwater model Return flow to confluence
8 Ecosystem Services Flood/Fresh Rule What time of year is important? How often should it occur? Continuous flood, add up short floods or specify a number of floods How long should it last? Flow threshold? natural drought? If multiple small spells, is there a minimum duration? If multiple spells should there be a gap between them? Are there maximum rates of rise and fall restrictions? Days Rate (ML/D) Percentage daily percentage change
9 GWSWIT - Reach scale model that estimates the flux between a river and the connected aquifer Processes: Pumping from Unconfined Aquifer Pumping from Semi-Confined Aquifer Irrigation Recharge Floodplain Recharge Return Flows Quality (fixed conc)

10 Nash-Sutcliffe on Log Flows to focus on low flow performance

11 Canberra Water Supply

12 Demand Restriction Curves Modification of demand to reflect behaviour based on system state such as Climate-Based Demand Restrictions. Can be used to define desalinization trigger levels
13 NETLP Optimisation of Complex Demands and Sources.

14 Multiple Operational Configurations Inputs to Optimisation Strategy to provide 95% reliability of supply over forecast period High Demand Wet Weather Operations - 30% Probability High Demand Normal Operations 20% Probability High Demand Maintenance of Tanks 50% Probability

15 Built upon TIME a general purpose modelling system A software framework for developing eco-hydrological models based upon the Microsoft.NET framework. Designed to support the creation, testing and end-user delivery of environmental simulation models. Supports the management, manipulation and presentation of a variety of data types, as well as support for testing, integrating and calibrating simulation models. Underpins a range of spatial and temporal modelling systems including the toolkit models (

16 Adaptable Architecture - Plugins Plugins are compiled.net libraries which extend Source to perform custom behaviour Plugins allow third-parties to create modules which can be used to perform custom tasks Can be based on TIME Libraries Examples of ways plugins can be used to customise Source: New Nodes Custom User Interfaces Constituent Generation Models Constituent Filter Models Additional parameterisers Results Transformations Data Importing / Exporting
17 Incorporation of Water Management The 4 th Dimension


18 ewater Source IWRM supply and demand of water quantity and quality - local to basin scale Runoff = Supply Demand Energy Sector Groundwater = Supply But what about the policy dimension? DAMS & WEIRS Demand Fisheries and Wetlands IRRIGATION Demand CITIES
19 Transboundary IWRM Political, Legal & Agency Divisions Physical, Chemical, Economic & Social Municipality Sub-Catchment To identify and suggest approaches to resolve water management concerns, Province Governance Dimension is needed. Catchment State River Basin Sources: Surface, Groundwater, Desal, Recycled etc Sectors: Hydropower, Irrigation, Urban, Environmental, etc
20 Define Sectors as additional Governance layer Owners might include: Jurisdictions: States, Provinces etc. Sources: Surface, Groundwater, Desal, Recycled etc. Sectors: Hydropower, Irrigation, Urban, Environment etc. Social/Political: Social groupings, Economic Groupings
21 Define Water Accounts The user who has the right The to sector order under water which the The user share has for the this user as a status to portion use water of that available for the sector according to the agreements How to treat the Accounting rules like a financial system

22 Models focussed on management
23 Ordering Order Up! How much water to release from storage to meet downstream requirements. Taking into consideration: Deliver Down Delivery time The most efficient path Channel Supply constraints Reservoir Outlet constraints Different sources of supply (multireservoir, urban water sources etc)
24

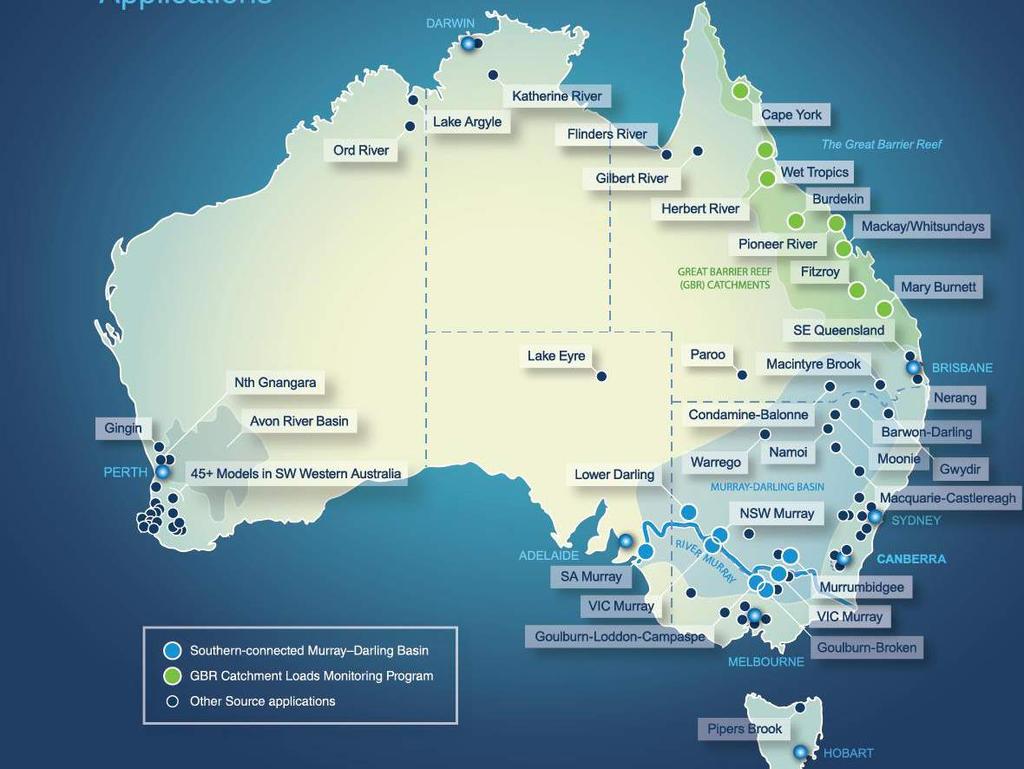
25 Murray-Darling - Southern Interconnected Basin
26 Modelling Modes Long Term Planning (100+ yrs) Short Term Planning (1-5 yrs) Flow forecasts (6 mths) Operational Management (weeks) Water Accounting ( now) representing changes in water management rules and policy over time.
27 Processes Modelled Water Sharing between States Water Resource Assessment Allocating Water to Users Irrigation Demands and Forecasting Environmental Rules & Demands Ordering water from storages Operation & Management Rules Flow and Salinity Routing Water Accounting
 (GL/Year) NSW")
28 Represented the Murray and Lower Darling River System in Source, including integration of water policy Currently understanding the transition from modelling the system at a monthly to daily timestep Adoption of Source model is dependent upon agreement by the Basin States as it represents the legal agreements Work in Progress AVERAGE ANNUAL Source MSM SYSTEM DIVERSIONS* (GL/Year) (GL/Year) NSW Murray Diversions 1,736 1,733 NSW Lower Darling Diversions VIC Diversions 1,724 1,662 SA Diversions Kiewa Diversions Ovens Diversion Total Diversions 4,206 4,158 * Work in Progress - example of comparison of models
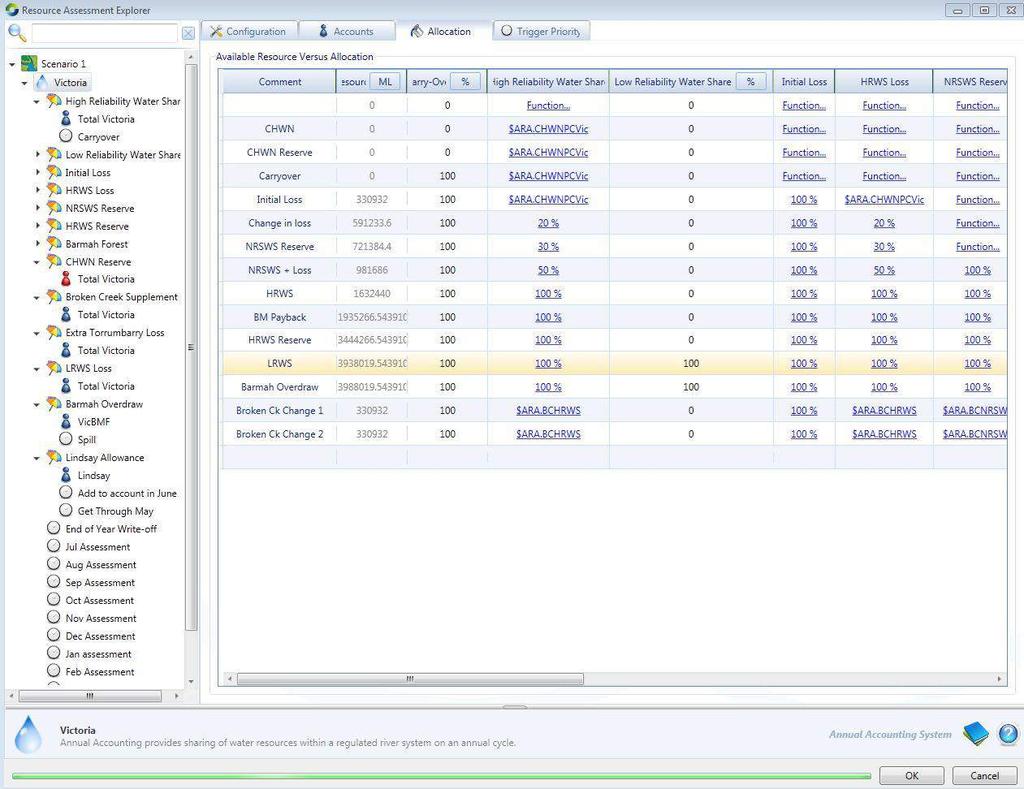
29 Water Allocation


30 Irrigation Demands Supply Point Irrigator Node Non-routing storage link
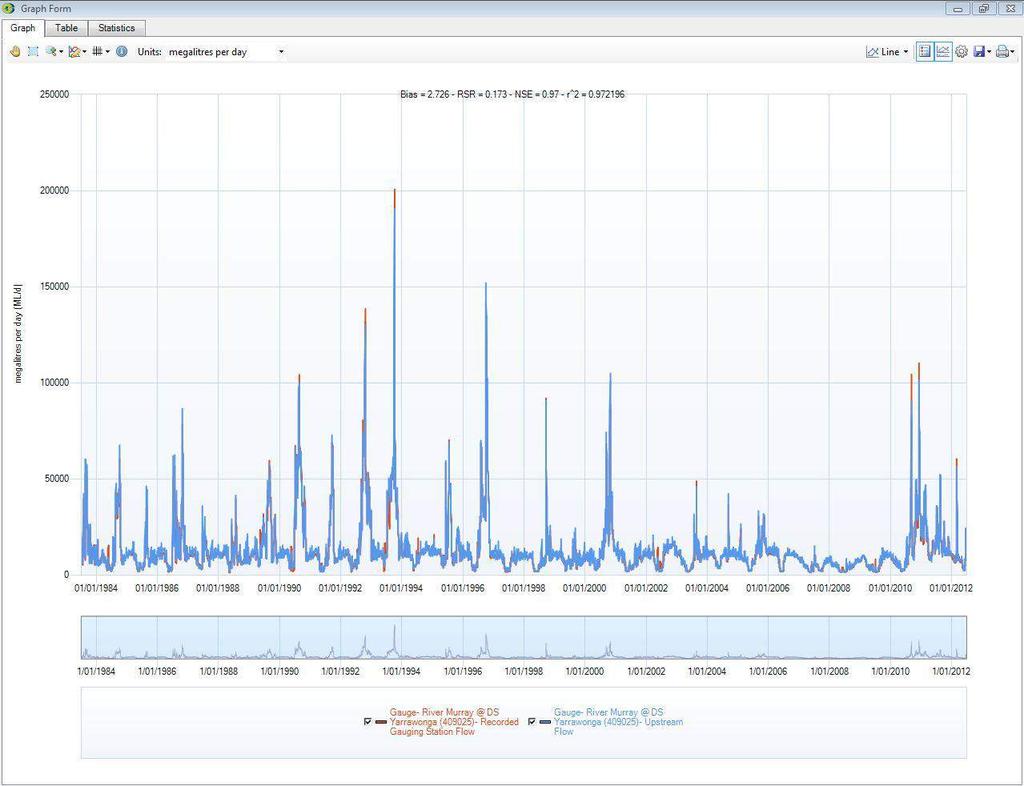
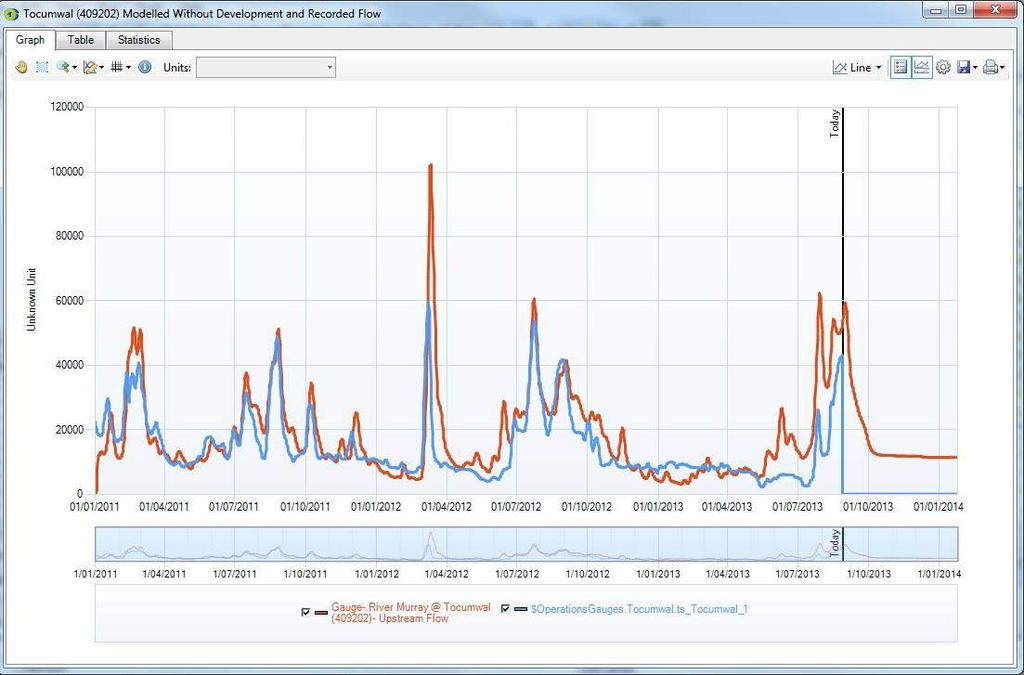
31 Flow Calibration

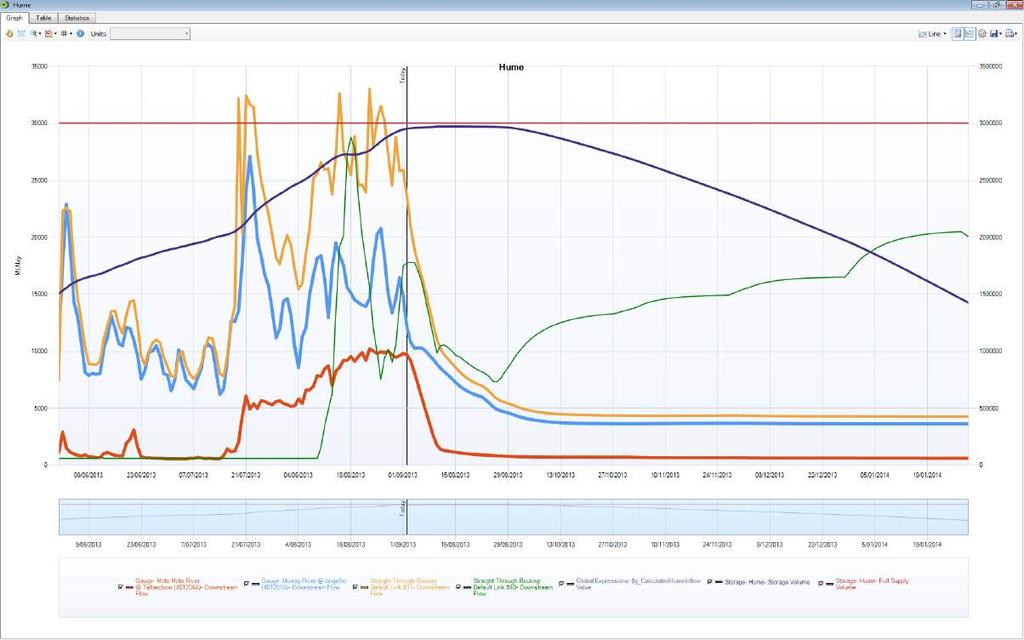
32 Management Calibration
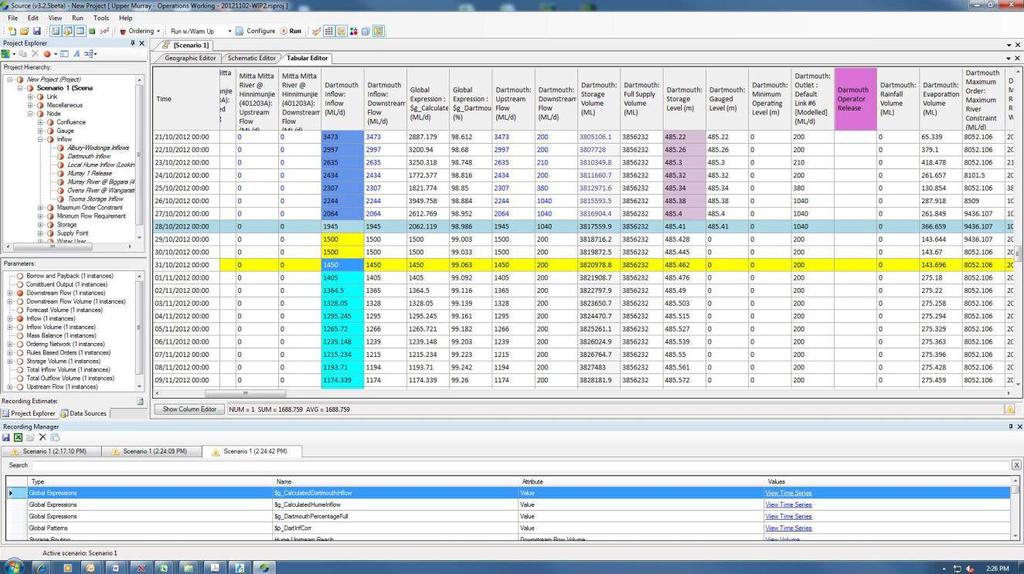
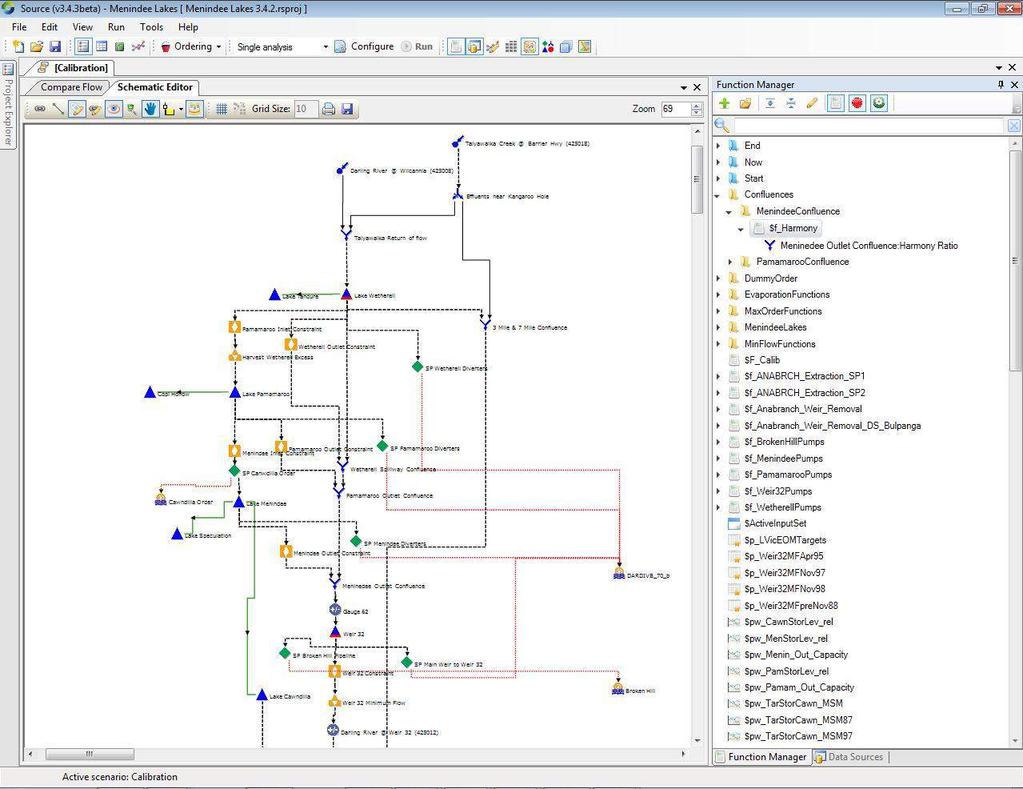
33 River Operations
34 Operation of irrigation nodes 1-2 Times/Year Annual At decision dates find out how much water is available (allocation) Pump surplus water from river to on-farm storage subject to constraints Pump water from (i) river or (ii) on farm storage subject to constraints Decide the area of crop to plant (farmers risk) Calculate volume of water needed to fill soil profile If water is still available in account: order water from storage
35 Calibration Procedure System Inflow Estimation In-stream Flow Irrigation Demands Planted Area Dam Behaviour
36 Annual Loop Simulation overview Daily Loop Start-up Resource Assessment Module + decides how much water is available to allocate Farmer Behaviour Module + determines total water available for crop watering + decides area to plant Ordering Module + considers crop water requirements & on-farm storage water + places order and sends it up to the storage Storage Module + considers dam inflows and orders + makes dam releases Flows Module + transports releases, spills & tributary inflows down river + considers losses Extractions Module + assesses supplementary available + diverts allocated and/or supplementary water End Water-Year
37 Namoi Area irrigated Results I RR 08 w ith OFS average area irrigated per year 01/07/1893 to 30/06/2008 I QQM Source ha Y ears date:23/11/11 tim e:10:00:46.70
38 Upper Namoi - results Results


39 Use of models to inform decision making Water accounting and forecasting Retrospective Forecasting Now
40 ewater Source combines IWRM water balance with governance Tracking of water through the system based on entitlements Resource assessment methods to allocate water between different competing uses within a jurisdiction Value of water is intrinsically embedded through incorporation of agreements Ability to create a water budget both by source and as a water accounting tool to support transparency and continuous improvement of policy/agreements
41 Source as Integration Framework One Interface 5 Catchment Export Methods 11 Catchment Runoff models SWAT SWAT 3 link decay models 11 link routing models SWAT
 Uncertainty analysis (in review) Storages and wetlands (draft) Environmental demands (draft) River operations (draft) River Losses (draft) http://ewater.com.")
42 Best Practice Guidelines High level guide released in September 2011 More specific guidelines at various stages of development Runoff generation (published) GW-SW Interactions (published) Water sharing rules (published) Uncertainty analysis (in review) Storages and wetlands (draft) Environmental demands (draft) River operations (draft) River Losses (draft)
43 Source Released as Two Versions Source (Public Version) is free upon registering with the ewater Toolkit. Source (Public Version) is a fully featured IWRM hydrological water balance tool including water quality and flow forecasting. The unrestricted release of Source has the additional capability of enabling advanced Governance to be added to the IWRM platform including Ownership, Resource Allocations, Operational Mode and Water Markets/Trading. Source is Australia s National Hydrological Modelling Platform.


44 1 ewater s commitment: Support the needs of our modelling community Provide Technology Transfer of information and tools to meet you needs 2 Work to remove or 3 minimise Support with obstacles community, capacity building, training and mentoring
45 Thank You! Dr Robert Carr