Natural Gas & CHP: State of the Market & Implications for the Future
|
|
|
- Annabella Stephens
- 6 years ago
- Views:
Transcription
1 Natural Gas & CHP: State of the Market & Implications for the Future Jennifer Kefer, Alliance for Industrial Efficiency Lisa Jacobson, Business Council for Sustainable Energy Richard Meyer, American Gas Association Tim Hade, ENER-G Rudox 1
2 Please Questions to 2
3 Who We Are The Alliance for Industrial Efficiency is a coalition of business, labor and environmental organizations that are committed to encouraging the use of CHP and WHP to enhance U.S. manufacturing competitiveness, increase energy efficiency, and improve the environment. Visit us at alliance4industrialefficiency.org Follow us on twitter

4 Current CHP Projects Source: CHP Installation Database, March

5 CHP Technical Potential 5
6 Capacity (MW) Remaining Potential for CHP 50,000 45,000 40,000 35,000 30,000 25,000 20,000 15,000 10,000 5,000 0 CHP Technical Potential Existing CHP Capacity 6


7 Natural Gas and CHP: State of the Market and Implications for the Future March 9, 2016 GET THE FACTS: #Factbook
8 About the BCSE The Business Council for Sustainable Energy (BCSE) is a coalition of companies and trade associations from the energy efficiency, natural gas and renewable energy sectors. The Council advocates for policies at state, national and international levels that: increase the use of commercially-available clean energy technologies, products and services support an affordable, reliable power system reduce air pollution & greenhouse gas emissions

9 2016 BCSE Members


10 Clean Energy Coast to Coast
11
12


13 Sponsored by:
14 About the Factbook (1 of 2): What is it and what s new Aims to augment existing, reputable sources of information on US energy Focuses on renewables, efficiency, natural gas Fills important data gaps in certain areas (eg, investment flows by sector, contribution of distributed energy) Contains data through the end of 2015 wherever possible Employs Bloomberg New Energy Finance data in most cases, augmented by EIA, FERC, ACEEE, ICF International, LBNL, and other sources where necessary Contains the very latest information on new energy technology costs Has been graciously underwritten by the Business Council for Sustainable Energy Is in its fourth edition (first published in January 2013) What is it? What s new? Format: This year s edition of the Factbook (this document) consists of Powerpoint slides showing updated charts. For those looking for more context on any sector, the 2014 edition (1) can continue to serve as a reference. The emphasis of this 2016 edition is to capture new developments that occurred in the past year. Updated analysis: Most charts have been extended by one year to capture the latest data developments: The text in the slides highlights major changes that occurred over the past year. New coverage: This report contains data shown for the first time in the Factbook, including analyses of US levelized costs of electricity, corporate renewables procurement, US transmission build, small-scale CHP generation and additional energy efficiency data. (1) The 2014 Factbook can be found here: Bloomberg Finance L.P Developed in partnership with The Business Council for Sustainable Energy. 14
15 2015: A YEAR OF MILESTONES
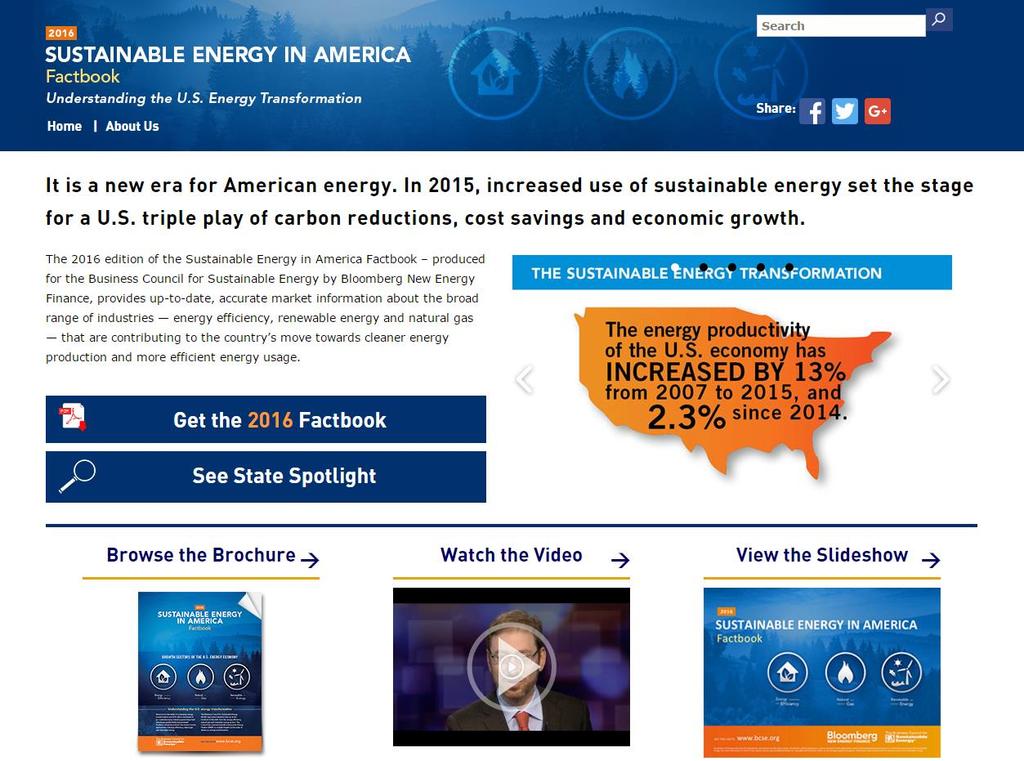
16 US energy overview: Economy s energy productivity: GDP and primary energy consumption (indexed to 1990 levels) GDP (indexed) Primary energy consumption (indexed) The US economy is increasingly energy productive, resulting in a decoupling between growth in GDP and growth in energy consumption. As US GDP expanded 83% over the last 25 years, energy consumption only ticked up 17%. By one measure (US GDP per unit of energy consumed), productivity has improved 56% since 1990, 13% since 2007, and 2.3% between 2014 and Source: US Energy Information Administration (EIA), Bureau of Economic Analysis, Bloomberg Terminal Notes: Values for 2015 energy consumption are projected, accounting for seasonality, based on latest monthly values from EIA (data available through September 2015). GDP is real and chained (2009 dollars); annual growth rate for GDP for 2015 is based on consensus of economic forecasts gathered on the Bloomberg Terminal as of January Bloomberg Finance L.P Developed in partnership with The Business Council for Sustainable Energy. 16
17 Financing: US utility energy efficiency spending and budgets ($bn) budget budget 6.2 budget Natural gas Electric From 2006 to 2011, US utility expenditure for energy efficiency grew 25% per year. The budgeted amount for 2014 would represent a 25% growth between 2013 and Maryland was the state with the largest increase in utility budgets for energy efficiency, with an increase from $119m in 2013 to $292m in In December 2015, US Congress renewed the energy-efficient commercial buildings tax deduction and nonbusiness (ie, residential) Energy-efficient Property Credit that retroactively reinstates tax credits for projects completed in 2015 and Source: CEE, ACEEE, Bloomberg New Energy Finance Bloomberg Finance L.P Developed in partnership with The Business Council for Sustainable Energy. 17
18 Deployment: US natural gas production and gasdirected rig count (Bcfd, rigs) Production (Bcfd) Shale Other lower 48 Rigs Number of rigs 1,800 1,600 1,400 1,200 1, Natural gas production in 2015 was up 7% from 2014 levels, 26% from 2007 levels. Shale production now accounts from almost half of total. Technological improvements in efficiencies (like pad drilling and longer laterals) and drilling in productive sweet spots has allowed production to increase even as rig counts drop. Source: Bloomberg New Energy Finance, EIA, Baker Hughes. Data up through the latest comprehensive numbers available (September 2015). Bloomberg Finance L.P Developed in partnership with The Business Council for Sustainable Energy. 18
19 Policy: US coal power plant retirements completed and announced by year (GW) EIA retired EIA announced 2015 saw the largest wave of coal retirements ever, with 11GW going offline through October 2015 and another 3GW of retirements announced. An additional, undetermined number of plants (likely less than 5GW in total) also converted from coal to burn natural gas and, in a few cases, biomass. Record low gas prices, old age, and increasing operating costs partly due to US Environmental Protection Agency (EPA) regulations covering sulfur, nitrogen, and mercury emissions from power plants have forced many coal plants to retire earlier than originally planned. Source: Bloomberg New Energy Finance Notes: Retirements does not include conversions from coal to natural gas or biomass; retirement numbers through end-october Bloomberg Finance L.P Developed in partnership with The Business Council for Sustainable Energy. 19
20 US ENERGY IN TRANSITION
21 US energy overview: US electricity generation by fuel type (%) 100% 80% 60% 8% 9% 11% 10% 13% 12% 13% 13% 13% 22% 22% 24% 24% 25% 31% 28% 28% 32% 40% 19% 20% 20% 20% 19% Renewables (including hydro) Natural gas 2% 1% 1% 1% 1% 19% 19% 19% 19% 1% 1% 1% 1% Nuclear 20% 49% 48% 44% 45% 42% 37% 39% 39% 34% Oil 0% Coal Generation from natural gas plants increased by 17% from 2014 to 2015, while coal generation fell by 11%. The US power sector is gradually decarbonizing. From 2007 to 2015, natural gas increased from 22% to 32% of electricity generation, and renewables climbed from 8% to 13%. Coal s share slipped from 49% in 2007 to only 34% in Source: EIA Notes: Values for 2015 are projected, accounting for seasonality, based on latest monthly values from EIA (data available through October 2015). In chart at left, contribution from Other is not shown; the amount is minimal and consists of miscellaneous technologies including hydrogen and non-renewable waste. The hydropower portion of Renewables includes negative generation from pumped storage. Bloomberg Finance L.P Developed in partnership with The Business Council for Sustainable Energy. 21
22 US energy overview: Renewable energy capacity build by technology (GW) Hydro Geothermal Biomass, biogas, wasteto-energy Solar Wind Solar experienced another year of strong build, adding 7.3GW of PV in 2015 a record. Small-scale solar continues to grow as the economics make it a viable alternative to retail rates in many regions of the country. Wind build surged to 8.5GW in 2015 as developers rushed to capture the Production Tax Credit (PTC) before it was due to expire at the end of Other sectors (biomass, biogas, waste-to-energy, geothermal, hydro) are idling without long-term policy support. Source: Bloomberg New Energy Finance, EIA Notes: Numbers include utility-scale (>1MW) projects of all types, rooftop solar, and small- and medium-sized wind. Bloomberg Finance L.P Developed in partnership with The Business Council for Sustainable Energy. 22
23 US energy overview: Greenhouse gas emissions from the power sector (MtCO2e) ,000 2,500 GHG emissions from power sector, e 2, levels 1,500 1,000 CPP target, In 2015, power-sector emissions sunk to their lowest levels (1,985Mt) since 1995 as cleaner-burning natural gas has displaced generation from coal-fired power plants. Emissions are 18% below 2005 levels. The Clean Power Plan targets a 32% cut from 2005 levels by Source: Bloomberg New Energy Finance, EIA, EPA Notes: Values for 2015 are projected, accounting for seasonality, based on latest monthly values from EIA (data available through September 2015). Bloomberg Finance L.P Developed in partnership with The Business Council for Sustainable Energy. 23
24 AN ERA OF LOW PRICES
25 US energy overview: Retail and wholesale power prices Wholesale power prices ($/MWh) Average retail power prices ($/MWh) NYISO ISONE CAISO PJM MISO ERCOT Northwest New York New England California PJM MISO ERCOT Northwest Florida Southwest Southeast Wholesale prices fell by about a third in 2015, as natural gas prices fell and more renewables connected to the grid. Retail power prices in most regions remain well below the peak prices seen in In 2015, retail electricity rates fell by 1.3% on average nationwide. New York (-5.8%) and Texas (-2.7%) saw the biggest year-on-year declines. Exceptions included California and New England where retail prices rose marginally (1.8% and 1.3%, respectively). Source: Bloomberg New Energy Finance, EIA, Bloomberg Terminal Notes: Data through end-november Wholesale prices taken from proxy power hubs in each ISO. Prices are in real 2014 dollars. Bloomberg Finance L.P Developed in partnership with The Business Council for Sustainable Energy. 25
26 OUTLOOK
27 Global context: Total new investment in clean energy by country or region ($bn) Other EMEA Other APAC Other AMER Europe Brazil India China United States Total Total new investment in clean energy set a new record high at $329bn in Investments climbed 8% in the US, mostly in wind and solar. The US currently makes up 17% of world investment in clean energy. China was #1 again, investing $111bn. Source: Bloomberg New Energy Finance Notes: For definition of clean energy, see slide in Section 2.2 of this report titled Finance: US clean energy investment (1 of 2) total new investment, all asset classes ($bn). AMER is Americas; APAC is Asia-Pacific; EMEA is Europe, Middle East, and Africa. Bloomberg Finance L.P Developed in partnership with The Business Council for Sustainable Energy. 27
28 Policy: Federal support of clean energy At the end of 2015, Congress enacted major subsidy extensions for clean energy projects. The Production Tax Credit (PTC) for wind projects was extended through the end of The credit is $23/MWh for projects beginning construction in 2015 and 2016, then steps down through The Investment Tax Credit (ITC) for solar projects was extended and now applies to projects beginning construction before The credit begins at 30% for projects breaking ground before 2020, then steps down gradually to 10%. Extensions were also granted for the production of second-generation biofuels and energy from geothermal, biomass and landfill gas, hydroelectric projects and ocean energy; however, the majority of these technologies received extensions of only two years, compared to five year for wind and solar. Deductions and credits were extended for energy efficiency building improvements and the construction of efficient homes. Bloomberg Finance L.P Developed in partnership with The Business Council for Sustainable Energy. 28
29 Policy: EPA Clean Power Plan AK Emissions reductions required by the Clean Power Plan between 2012 and 2030, HI under mass-based compliance -3% CA -10% OR -30% WA -13% NV -26.4% US +4% ID -26% UT -41% MT -37% WY -31% CO -38% ND -31% SD -33% NE -37% KS -35% MN -34% IA -29% MO -25% AZ -23% -28% OK -30% NM AR -25% TX -20% LA -34% WI -35% IL -8% MS -32% MI -31% IN -32% TN -25% AL -28% OH -32% KY -26% GA -29% WV -16% FL -25% PA -28% SC -23% VA -24% NC -10% NY VT +0% ME -14% NH -8% MA -6% RI +4% CT -14% NJ -15% DE -29% MD DC AL AZEPA CA finalized CT DE GA the ID Clean IN Power KS LAPlan MD (CPP), MI MSits MTregulation NV NJ NY on carbon ND OK emissions PA SC TNfrom UT the VA existing WV WY power fleet, in August 2015 The Plan could cut power-sector emissions 32% from 2005 levels by Source: Bloomberg New Energy Finance, based on analysis of EPA Clean Power Plan Notes: Darker colors indicate deeper emissions cuts. Yellow states may actually increase their overall emissions, while remaining in compliance with the EPA s Clean Power Plan. Data is not available for Alaska and Hawaii; Vermont and DC are not covered by the EPA s regulations. Data is based on EPA modelling and EPA historical emissions inventories. Bloomberg Finance L.P Developed in partnership with The Business Council for Sustainable Energy. 29
30 Policy: State policy barriers to net energy metering erected in 2015 NV: Regulators approved monthly charges and payment cuts on NEM customers. MN: State policy now allows publicly owned utilities to charge new NEM customers a "reasonable and appropriate" fee. WI: Regulators approved monthly demand-charge on NEM with intermittent generation. VT: State law changed default owner of RECs from generator to utility. MA: NEM generation cap reached. CA: Regulators proposed fees and monthly charges on new NEM customers. RI: State law requires regulators to consider net metering s impact on cost allocation in future rates. AZ: Regulators approved monthly charges on NEM customers. WV: State law prohibits intra-class crosssubsidies. TX: El Paso Electric proposed a monthly demand charge for NEM customers. OK: Regulators considering utility proposal for a demand charge on NEM customers. States across the country imposed policies against net energy metering (NEM), a practice key to the economics of distributed generation. For example, Nevada regulators approved higher fixed charges and lower compensation for surplus generation from NEM customers. In response, SolarCity and Sunrun announced plans to leave the state. State regulators are now considering grandfathering in existing NEM customers so that they are not subject to the new rule. New or higher monthly charges Pending barriers Cap on qualifying generation Reduced REC value Multiple barriers Bloomberg Finance L.P Developed in partnership with The Business Council for Sustainable Energy. 30
31 Policy: US emissions pledge in Paris 7,000 6,000 5,000 4,000 3,000 2,000 1, emissions 2025 emissions target (26% below 2005) Net emissions (Scenario 1) Net emissions (Scenario 2) 0 On March 31, 2015, the US released its official pledge for US emissions cuts as part of the United Nations climate negotiations: to reduce emissions to 26-28% below 2005 levels by An earlier target proposed by President Obama set a 2020 goal of 17% below 2005 levels. In 2013, the last year with complete data, net emissions (ie, including sinks) stood 10% below 2005 levels. The new pledge builds off existing and coming programs (eg, CAFE standards, EPA Clean Power Plan), but more policy may be needed to achieve the targets. Source: Bloomberg New Energy Finance, EIA, EPA, US Department of State Notes: Net GHG emissions include total emissions less sequestration. Full data only available through Scenarios 1 and 2 show two trajectories for US emissions growth, based on a combination of Bloomberg New Energy Finance (BNEF) forecasts and EPA, EIA and US Department of State analyses. Both scenarios use BNEF s forecast for US power-sector emissions, assuming full compliance with the EPA Clean Power Plan. Both scenarios assume transportation growth as per the EIA s AEO2015 reference case and assuming existing CAFE standards. Scenario 1 assumes residential, commercial and industrial sectors energy growth as per the EIA AEO2015 reference case; and agricultural, waste and forestry and land use sectors growth as per the 2014 US Climate Action report. Scenario 2 assumes the historical decline rate for the residential and commercial sectors; assumes the industrial, agricultural and waste sectors emissions level remain constant from 2013; and assumes forestry and land use emissions follow the high sequestration case in the 2014 US Climate Action report. Bloomberg Finance L.P Developed in partnership with The Business Council for Sustainable Energy. 31


32 4 November 2014 WRAP-UP
33 Wrap-up 2015 was a watershed year for sustainable energy in the US: GDP grew 2.4%, while energy consumption grew only 0.1% Record natural gas production and consumption Record coal retirements (14GW+) Record solar PV build (7.3GW) These changes are signs of a permanent shift: Natural gas has been displacing coal within the power sector Renewables (excluding hydro) provided 7.4% of power, up from 2.2% in 2005 Power sector emissions 18% below 2005 levels Hybrid vehicle sales fell and gasoline consumption rose, but long-term trend still positive Meanwhile, energy prices remain low: Natural gas prices hit lowest levels since 1999, allowing gas to outcompete coal Solar, wind costs continue to decline Retail power prices 6% below 2008 peak And the outlook is strong: US remains key destination for clean energy investment Critical policy developments (Paris, Clean Power Plan, tax credit extensions) Bloomberg Finance L.P Developed in partnership with The Business Council for Sustainable Energy. 33


34 March 2016 The Shifting Sands of Natural Gas Abundance
35 35
36 Natural Gas Records in 2015 Domestic Annual Production 27.1 Tcf Proved Reserves 368 Tcf (dry) Undiscovered Gas Resources more than 2,500 Tcf Domestic Natural Gas Consumption 27.4 Tcf Natural Gas Consumed for Power Gen 9.4 Tcf Working Gas in Underground Storage 4,009 Bcf Sources: Bentek Energy, Energy Information Administration, Potential Gas Committee 36

37 Despite falling rig counts, natural gas production continues to grow. Source: BNEF, BCSE US dry gas production record: February 19, Bcfd (Bentek) 37
38 Huge shale gas production begins to level Antrim (MI, IN, & OH) Bakken (ND) Woodford (OK) Barnett (TX) Fayetteville (AR) Eagle Ford (TX) Haynesville (LA & TX) Marcellus (PA & WV) Utica (OH, PA & WV) Rest of US 'shale' US Shale Gas Production 0 Source: US Department of Energy, Energy Information Administration. 38
39 Record annual production in 2015 New daily records already in 2016 Billion Cubic Feet per Day Daily Dry Natural Gas Production US Lower Four-Year Range Jan Feb Mar Apr May Jun Jul Aug Sep Oct Nov Dec Source: Bentek Energy LLC 39
40 Utica condy SW Marcellus super-rich Jonah Utica wet Wattenberg Hz high-gor Granite Wash Cana condy SW Marcellus wet SCOOP Core Condy Haynesville core choked Barnett liquids NE Marcellus core Pinedale Fayetteville core Utica dry Piceance Williams Fork Hz SW Marcellus dry Haynesville core unrestricted NE Marcellus fairway Greater Natural Buttes Cotton Valley liquids North Montney gassy Fayetteville Tier 2 Hoadley Glauconite Piceance Williams Fork Vt Barnett high-eur Central Marcellus Barnett core Kaybob Duvernay gassy Cleveland Horn River Vermillion Almond Cana gassy Haynesville Tier 2 PRB CBM SCOOP Core Gas Arkoma Woodford Hawkville (Eagle Ford) Wattenberg Vt Miss Lime Tier Gas Breakevens Before and After the Oil Rout ($/MMBtu Henry Hub) Median cost reduction for these plays = $0.66/MMBtu Average = $0.72/MMBtu Reduction 2018 breakeven -1-2 Reduction takes into account 18% drop in drilling costs and 25% drop in completion costs, and uses rather than forward 12-month - basis (to Henry Hub). Source: Bloomberg New Energy Finance
41 Relatively Low and Stable Natural Gas Prices Dollars per Million BTU 14 Natural Gas Prices Prompt-Month Futures at Henry Hub Price Range Jan Feb Mar Apr May Jun Jul Aug Sep Oct Nov Dec Source: Energy Information Administration 41

42 US Natural Gas Pipeline Infrastructure Source: Energy Information Administration.


43 US distribution expenditures reached nearly $10 billion in US gas utility construction expenditures AGA, BNEF 43
44 Change in Production, Canada +1.3 ROX +1.6 App Perm +1.4 MidCon +4.5 Barnett +0.1 F ville -0.4 H ville +4.3 All other -6.6 Eagle Ford +0.8 Source: Bloomberg New Energy Finance.
45 Change in Production, Canada +8.5 ROX +1.9 App +8.7 MidCon +4.1 F ville -0.9 All other -5.8 Permian -0.2 Barnett -1.9 Eagle Ford +2.1 H ville -3.8 Source: Bloomberg New Energy Finance.
46 BNEF Long-Range Henry Hub Gas Price (real 2015$/MMBtu) /H1 2017: Glut eases as ex-northeast supply drops/demand rises slightly H2 2017/H1 2019: Rapidly growing demand forces producers back into Haynesville, MidCon and Canada : Demand continues to grow, but at a calmer pace 2024+: More Canadian LNG exports, permanent declines in the Haynesville and the Marcellus plateauing push prices to a higher steady-state Price (monthly) Price (ann avg) Source: Bloomberg New Energy Finance.

47 CHP: State of the Market and Implications for the Future Alliance for Industrial Efficiency Webinar 9 March 2016

48 CHP Value Proposition 48
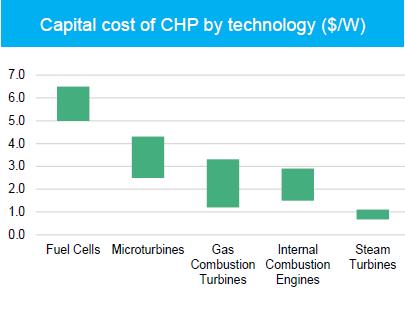
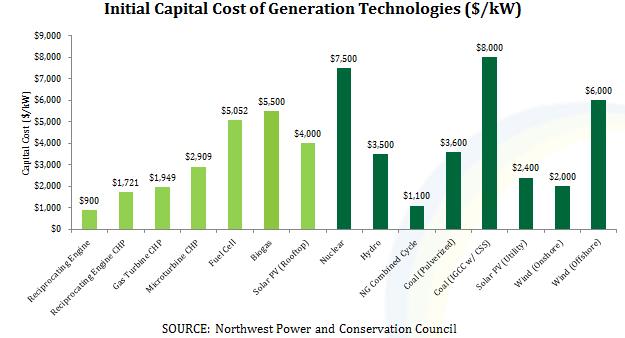
49 CHP: Attractive Capital Cost

50 Competitive LCOE but US lags Europe
51 New CHP Installations Down

52 Existing CHP Installations More Productive


53 Please Questions to Jennifer Kefer Executive Director The Alliance for Industrial Efficiency Lisa Jacobson President Business Council for Sustainable Energy Richard Meyer Manager, Energy Analysis & Standards American Gas Association Tim Hade VP of Integrated Energy Solutions ENER-G Rudox 53
Event Speaker Lisa Jacobson. President, The Business Council for Sustainable Energy
 Event Speaker Lisa Jacobson President, The Business Council for Sustainable Energy About the BCSE The Business Council for Sustainable Energy (BCSE) is a coalition of companies and trade associations from
SUSTAINABLE ENERGY IN AMERICA
 216 SUSTAINABLE ENERGY IN AMERICA Factbook GET THE FACTS www.bcse.org No portion of this document may be reproduced, scanned into an electronic system, distributed, publicly displayed or used as the basis
Oil and natural gas: market outlook and drivers
 Oil and natural gas: market outlook and drivers for American Foundry Society May 18, 216 Washington, DC by Howard Gruenspecht, Deputy Administrator U.S. Energy Information Administration Independent Statistics
What s Going on With Energy? How Unconventional Oil & Gas Development is Impacting Renewables, Efficiency, Power Markets and All That Other Stuff
 What s Going on With Energy? How Unconventional Oil & Gas Development is Impacting Renewables, Efficiency, Power Markets and All That Other Stuff Atlanta Economics Club Monthly Meeting December 10, 2012
CONTEXT AROUND RGGI DISCUSSIONS
 CONTEXT AROUND RGGI DISCUSSIONS RGGI STAKEHOLDER MEETING MICHEL DI CAPUA 19 SEPTEMBER 2011 PRESENTATION TO RGGI STAKEHOLDERS 19 SEPTEMBER 2011 1 CONTENTS Market size Power and renewables in RGGI territory
U.S. Energy Market Outlook
 U.S. Energy Market Outlook for Energy Policy Institute National Governor's Association Washington, DC by Howard Gruenspecht, Deputy Administrator U.S. Energy Information Administration Independent Statistics
Global energy markets
 For Woodrow Wilson Center Global Energy Forum September 21, 215 Washington, DC by Adam Sieminski, Administrator U.S. Energy Information Administration U.S. Energy Information Administration Independent
Combined Heat and Power in America March 16, 2017
 Combined Heat and Power in America March 16, 2017 A webinar produced in partnership between Alliance for Industrial Efficiency, the Business Council for Sustainable Energy, and CHP Association With participation
Colorado Energy & Environmental Issues. Chris Hansen, PhD Senior Advisor, Janys Analytics Candidate, Colorado House of Representatives
 Colorado Energy & Environmental Issues Chris Hansen, PhD Senior Advisor, Janys Analytics Candidate, Colorado House of Representatives Oil 2 Thousand Barrels per Day U.S. Crude Oil Production & Consumption,
Oil & The Economy: Boom-to-Bust and the Impact to States.
 Oil & The Economy: Boom-to-Bust and the Impact to States. Jesse Thompson Business Economist Houston Branch January, 2017 U.S. Oil U.S. Production & Rig Surged Count U.S. crude oil production Million barrels
Indiana Energy Status
 Indiana Energy Status presented to Indiana Chamber of Commerce Conference on Energy Management June 19, 2008 presented by Doug Gotham State Utility Forecasting Group Which sector uses the most electricity
The Future of Coal-fired Generation: Challenging the EPA
 Association Of Women In Energy Power Matters Conference The Future of Coal-fired Generation: Challenging the EPA MARK OURADA INDEPENDENT CONSULTANT Leadership A Leader is a Dealer in Hope Napoleon Power
Sustainable Energy In America
 2018 Sustainable Energy In America Factbook No portion of this document may be reproduced, scanned into an electronic system, distributed, publicly displayed or used as the basis of derivative works without
U.S. Shale Gas in Context
 U.S. Shale Gas in Context Overview of U.S. Natural Gas production and trends For National Conference of State Legislatures Natural Gas Policy Institute September 9, 215 Pittsburgh, Pennsylvania By Grant
Oil and gas outlook. For New York Energy Forum October 15, 2015 New York, NY. By Adam Sieminski, Administrator. U.S. Energy Information Administration
 Oil and gas outlook For New York Energy Forum New York, NY By Adam Sieminski, Administrator U.S. Energy Information Administration U.S. Energy Information Administration Independent Statistics & Analysis
Winter U.S. Natural Gas Production and Supply Outlook
 Winter 2010-11 U.S. Natural Gas Production and Supply Outlook Prepared for Natural Gas Supply Association by: ICF International Fairfax, Virginia September, 2010 Introduction This report presents ICF s
A New Market for Energy Regulation: Advancing the Clean Energy Revolution
 A New Market for Energy Regulation: Advancing the Clean Energy Revolution NCSL Task Force on Energy Supply December 5, 2012 David W. Cash Commissioner Massachusetts Department of Public Utilities 1 The
Winter U.S. Natural Gas Production and Supply Outlook
 Winter 2012-13 U.S. Natural Gas Production and Supply Outlook Prepared for Natural Gas Supply Association by: ICF International Fairfax, Virginia September, 2012 Introduction This report presents ICF s
US Energy What's next... and beyond? September 2013
 US Energy What's next... and beyond? September 2013 What will shape US energy policy? Technologies Maturity, costs Security of supply oil imports Environmental target GHG, SOx, NOx.. Availability of resources
Leading Insights into Solar
 Leading Insights into Solar Fong Wan Senior Vice President, Energy Procurement Pacific Gas and Electric Company CalSEIA - SolarTech Summit May 7, 2009 Agenda California s Clean Energy History Renewable
AIChE: Natural Gas Utilization Workshop Overcoming Hurdles of Technology Implementation
 AIChE: Natural Gas Utilization Workshop Overcoming Hurdles of Technology Implementation Natural Gas in the United States: An Overview of Resources and Factors Affecting the Market November 2, 216 Justin
24 September 2015 NORTH AMERICAN GAS OUTLOOK
 NORTH AMERICAN GAS OUTLOOK WORKING GAS STORAGE FORECAST (BCF) 4,5 4, 3,996 3,5 3, 2,5 2, 1,5 1, 5 1,93 Jan Feb Mar Apr May Jun Jul Aug Sep Oct Nov Dec 21-14 range 215 216 Source: Bloomberg New Energy Finance
PUBLIC POWER = + + LOCAL CONTROL LOW RATES HIGH RELIABILITY
 PUBLIC POWER = + + LOCAL CONTROL LOW RATES HIGH RELIABILITY WHAT IS PUBLIC POWER? Public power utilities are not-for-profit local institutions that provide electricity as an essential public service at
Annual Energy Outlook 2017
 Annual Energy Outlook 217 Valve Manufacturers Association of America VMA Technical Seminar 217 March 2, 217 Nashville, TN By, Director, Office of Integrated and International Energy Analysis U.S. Energy
The Shifting Sands of Natural Gas Abundance
 August 17, 2016 The Shifting Sands of Natural Gas Abundance Richard Meyer Manager, Energy Analysis & Standards Here s how global energy changed between 2014 and 2015. Winners were oil, natural gas, renewables.
Update on Energy Efficiency Opportunities in the Commonwealth
 Update on Energy Efficiency Opportunities in the Commonwealth Pertinent New England Energy Issues Energy Efficiency, Natural Gas Issues/Costs and Energy Outlook January 4, 2011 A forum sponsored by the
Electric Sector Restructuring and Utility GHG Emissions: Trends and Opportunities in the US
 Electric Sector Restructuring and Utility GHG Emissions: Trends and Opportunities in the US 50 State Street, Suite 3 Montpelier, Vermont USA 05602 Tel: 802.223.8199 Fax: 802.223.8172 7 th Chatham House
Discussion on the Threat of Electrification to Residential Natural Gas Demand
 Discussion on the Threat of Electrification to Residential Natural Gas Demand Prepared for the American Gas Association State Affairs Committee Tuesday, October 10 h, 2017 Mike Sloan Managing Director
Voluntary Renewable Energy Markets 101. Noah Bucon Senior Analyst, Policy & Certification Programs Center for Resource Solutions
 Voluntary Renewable Energy Markets 101 Noah Bucon Senior Analyst, Policy & Certification Programs Center for Resource Solutions 2 Outline Renewable Energy Basics What are RECs? Compliance and Voluntary
MA Perspectives on Building Priorities for Climate and Energy Policy
 Division of Energy Resources Creating A Greener Energy Future For the Commonwealth MA Perspectives on Building Priorities for Climate and Energy Policy Philip Giudice Commissioner Phil.Giudice@State.MA.US
Regional energy challenges in New England and Eastern Canada
 Regional energy challenges in New England and Eastern Canada For 39 th Annual Conference of New England Governors and Eastern Canadian Premiers () August 31, 2015 St. John s By Adam Sieminski Energy Information
UPDATE: RENEWABLE PORTFOLIO STANDARDS IN THE NORTHWEST - A renewable power struggle?
 UPDATE: RENEWABLE PORTFOLIO STANDARDS IN THE NORTHWEST - A renewable power struggle? Marlys Palumbo Van Ness Feldman, PC Seattle Small Hydropower Workshop September 22-23, 2011 RPS Policies www.dsireusa.org
Energy Markets. U.S. Energy Information Administration. for Center on Global Energy Policy, Columbia University November 20, 2015 New York, New York
 Energy Markets for Center on Global Energy Policy, Columbia University New York, New York by Adam Sieminski, Administrator U.S. Energy Information Administration U.S. Energy Information Administration
Energy: Global, National and Vermont Contexts
 Energy: Global, National and Vermont Contexts Leadership Champlain Richard Sedano February 14, 2006 50 State Street, Suite 3 Montpelier, Vermont USA 05602 Tel: 802.223.8199 Fax: 802.223.8172 The Regulatory
Energy Markets. U.S. Energy Information Administration. for. October 29, 2015 Golden, Colorado. by Adam Sieminski, Administrator
 Energy Markets for The Payne Institute for Earth Resources at the Colorado School of Mines Golden, Colorado by Adam Sieminski, Administrator U.S. Energy Information Administration U.S. Energy Information
NUCLEAR BY THE NUMBERS A PRIL
 NUCLEAR BY THE NUMBERS A PRIL 2 01 8 TABLE OF CONTENTS THE NUCLEAR ADVANTAGE US Nuclear Power Plants... 2 Nuclear Energy Creates and Sustains Jobs... 3 Nuclear Energy = Clean Air... 4 2017 US Emissions-Free
The American Clean Energy Security Act (ACES) Creates More American Jobs and Saves Americans Money
 Creates More American Jobs and Saves Americans Money") The American Clean Energy Security Act (ACES) Creates More American Jobs and Saves Americans Money State-by-state figures on job creation, electric bill reductions, and transportation savings from the
The American Clean Energy Security Act (ACES) Creates More American Jobs and Saves Americans Money State-by-state figures on job creation, electric bill reductions, and transportation savings from the
The Future of Greenhouse Gas Emissions Trading in North America
 The Future of Greenhouse Gas Emissions Trading in North America 14 th IEA-IETA-EPRI Annual Workshop on Greenhouse Gas Emission Trading Thursday October 9, 2014 Agenda California s AB 32 and Cap-and-Trade
World and U.S. Oil and Gas Production and Price Outlook: To Infinity (or at least 2050) and Beyond
 and Beyond") World and U.S. Oil and Gas Production and Price Outlook: To Infinity (or at least 25) and Beyond Energy and Environment Symposium April 18, 218 Rifle, Colorado by Troy Cook, Senior Global Upstream Analyst,
World and U.S. Oil and Gas Production and Price Outlook: To Infinity (or at least 25) and Beyond Energy and Environment Symposium April 18, 218 Rifle, Colorado by Troy Cook, Senior Global Upstream Analyst,
LCOEs and Renewables Victor Niemeyer Program Manager, Energy and Environmental Policy Analysis and Company Strategy Program
 LCOEs and Renewables Victor Niemeyer Program Manager, Energy and Environmental Policy Analysis and Company Strategy Program EIA LCOE/LACE Workshop July 25, 2013 EPRI Generation Options Report Provides
The Oklahoma First Energy Plan: A Pragmatic Path Forward
 Office of the Oklahoma Secretary of Energy The Oklahoma First Energy Plan: A Pragmatic Path Forward C. Michael Ming Secretary of Energy State of Oklahoma Southern States Energy Board Washington, DC February
REGIONAL ENERGY BASELINES AND MEASUREMENT AND VERIFICATION PROTOCOLS
 Total Energy Use per Capita (1 6 Btu) ESL-TR-9-2-1 REGIONAL ENERGY BASELINES AND MEASUREMENT AND VERIFICATION PROTOCOLS Subtask 3.1 for the Southern Energy Efficiency Center Cooperative Agreement #: DE-PS26-7NT43185
2011 State Average Electricity Prices (cents/kwh)
") Retail Rates Indiana has a relative price advantage on electric retail rates. Retail pricing is the average price for all rate classes, including residential, commercial, and industrial customers. Indiana
Retail Rates Indiana has a relative price advantage on electric retail rates. Retail pricing is the average price for all rate classes, including residential, commercial, and industrial customers. Indiana
Indiana Energy Landscape
 Indiana Energy Landscape presented to WIndiana 2008 June 17-18, 2008 presented by David Nderitu / Doug Gotham State Utility Forecasting Group Outline Characteristics of Indiana s existing generation Emissions
U.S. Historical and Projected Shale Gas Production
 U.S. Historical and Projected Shale Gas Production Phyllis Martin Phyllis Martin, Senior Energy Analyst Office of Petroleum, Gas and Biofuels Analysis U.S. Energy Information Administration phyllis.martin@eia.doe.gov
Voluntary & Compliance Markets. Renewable Energy Markets 2010
 Voluntary & Compliance Markets Renewable Energy Markets 2010 Renewable Energy Certificate A commodity that represents the environmental attributes of electricity generated from renewable resources like
US Energy A Place for Bioenergy
 US Energy A Place for Bioenergy Harry S. Baumes, Ph. D. Director North Central Sustainable Agricultural Research & Education Michigan State University W. K. Kellogg Biological Station Hickory Corners,
Scott Prestidge Metro Denver EDC Energy Industry Manager
 Scott Prestidge Metro Denver EDC Energy Industry Manager Metro Denver EDC Energy Trade Association 140 Members 70 Companies/Organizations Diverse: Vestas, RES Americas, Anadarko, Xcel, Tri-State, COGA,
Renewable Energy 101. National Renewable Energy Marketing Conference Portland, Oregon October 20, 2010
 Renewable Energy 101 National Renewable Energy Marketing Conference Portland, Oregon October 20, 2010 Agenda 1. Introductions 2. Green Power Basics 3. Purchasing Green Power 4. Green Power Markets 5. Question
The Role of the Regulator in the Promotion and Development of Renewable Energy
 The Role of the Regulator in the Promotion and Development of Renewable Energy USA / Ohio Guatemala Renewable Energy Forum November 10, 2011 Tim Burgener, Public Utilities Commission of Ohio U.S. Generation
Today s Propane. National Propane Gas Association
 Today s Propane National Propane Gas Association Today s Propane 2 Today s Propane 1 Clean, Local, and Reliable Propane has been providing the energy we rely on for more than 100 years. Today, propane
United States Intended Nationally Determined Contribution (INDC)
") United States Intended Nationally Determined Contribution (INDC) September 29, 2015 Judith Greenwald U.S. Department of Energy US Intended Nationally Determined Contribution INDC (Submitted March 31, 2015):
United States Intended Nationally Determined Contribution (INDC) September 29, 2015 Judith Greenwald U.S. Department of Energy US Intended Nationally Determined Contribution INDC (Submitted March 31, 2015):
U.S. natural gas and LNG exports
 U.S. natural gas and LNG exports For Hudson Institute Washington DC April 6, 216 By Victoria Zaretskaya Office of Petroleum, Natural Gas, and Biofuels Analysis U.S. Energy Information Administration Independent
Renewable Portfolio Standards U.S. Overview
 Renewable Portfolio Standards U.S. Overview David Mooney May 6, 2016 ACKNOWLEDGMENTS Jenny Heeter, Trieu Mai, Lori Bird, Alberta Carpenter, Garvin Heath, David Keyser, Jordan Macknick Ryan Wiser, Galen
Gas and Crude Oil Production Outlook
 Gas and Crude Oil Production Outlook COQA/CCQTA Joint meeting October 3-31, 214 San Francisco, California By John Powell Office of Petroleum, Natural Gas, and Biofuels Analysis U.S. Energy Information
Today s Energy Landscape:
 Today s Energy Landscape: Exploring economic, environmental and technological trends October 11, 2010 Presentation to the PJM Board Sue Tierney Managing Principal BOSTON CHICAGO DALLAS DENVER LOS ANGELES
New York CES: Renewable Energy Standard Underlying Fundamentals
 New York CES: Renewable Energy Standard Underlying Fundamentals Roman Kramarchuk EMA Roundtable Managing Director Global Power, Emissions & Clean Energy February 2, 2017 Why we re different WE TAKE THE
Geothermal Energy Utilization: REC Markets and Tax Credits
 Geothermal Energy Utilization: REC Markets and Tax Credits Presented by Tim Smith June 12, 2007 1 Overview of the Presentation About Element Markets What is a Renewable Energy Credit (REC)? REC markets
Potatoes Summary. September United States Department of Agriculture. National Agricultural Statistics Service.
 United States Department of Agriculture National Agricultural Statistics Service Potatoes 00 Summary September 00 Pot 6 (0) Contents Page Introduction... Comments... Utilization, U. S., 99-00... 4 Area,
Making Sense of U.S. Energy Markets
 Making Sense of U.S. Energy Markets Task Force on Energy Supply National Conference of State Legislators Richard McMahon Vice President, Energy Supply and Finance January 14, 2017 Wholesale Markets RTO/ISO
Renewable Energy Buyers Alliance (REBA): Accelerating GHG reductions through a buyer-led movement
: Accelerating GHG reductions through a buyer-led movement") Renewable Energy Buyers Alliance (REBA): Accelerating GHG reductions through a buyer-led movement Presentation to RE-Users Summit Tokyo, February 2019 1 REBA s Theory of Change Large energy consumers have
Renewable Energy Buyers Alliance (REBA): Accelerating GHG reductions through a buyer-led movement Presentation to RE-Users Summit Tokyo, February 2019 1 REBA s Theory of Change Large energy consumers have
Outline. Introduction to Wisconsin. Barriers to Generating Electricity from. Incentives and Regulations Intended to
 Experience of the United States in the Application of Incentives and Regulations for the Supply of Renewable Energy Chairperson Eric J. Callisto Public Service Commission of Wisconsin 20 May 2010 Outline
Net metering and rate reforms for distributed solar
 Net metering and rate reforms for distributed solar Galen Barbose NCSL & NASEO Solar Workshop and Lab San Antonio, TX June 9, 2017 This analysis was funded by the Solar Energy Technologies Office, Office
Renewables Portfolio Standards in the United States: A Status Update
 Renewables Portfolio Standards in the United States: A Status Update Galen Barbose Lawrence Berkeley National Laboratory Renewable Energy Markets 214 December 4, 214 This analysis was funded by the National
Electric Power Industry Trends and the Role of Renewable Energy. Chuck Levey Vice President Pratt & Whitney Power Systems
 Electric Power Industry Trends and the Role of Renewable Energy Chuck Levey Vice President Pratt & Whitney Power Systems Product Portfolio Large Engines ORC Heat to Power Power Systems After market Wind
Source Energy and Emission Factors for Building Energy Consumption
 Source Energy and Emission Factors for Building Energy Consumption Copyright 2009 American Gas Association All Rights Reserved Prepared for Natural Gas Codes and Standards Research Consortium 400 N. Capitol
Prepared for Greenpeace. September 25, 2009
 An Evaluation of Potential Demand for Renewable Generation H.R. 2454 (Waxman-Markey) Renewable Electricity Standard vs. Existing State Renewable Portfolio Standards Prepared for Greenpeace September 25,
Overview EPA s Proposed Clean Power Plan and Impacts for Louisiana
 Overview EPA s Proposed Clean Power Plan and Impacts for Louisiana Clean Cities Coalition Meeting November 5, 2014 David E. Dismukes, Ph.D. Center for Energy Studies Louisiana State University CAVEAT:
APS Renewable Energy. Overall Commitment and Distributive Energy Program. Arvin Trujillo 4CPP-Government Relations
 APS Renewable Energy Overall Commitment and Distributive Energy Program DOE Tribal Energy Summit December 20, 2011 Arvin Trujillo 4CPP-Government Relations About Arizona Public Service Co. APS APS has
RENEWABLE ENERGY IN AMERICA
 RENEWABLE ENERGY IN AMERICA Utility Workers Union of America Power for America Conference Las Vegas April 22, 2009 Michael Eckhart American Council On Renewable Energy (ACORE) www.acore.org 1 Topics Washington
Committees on Energy Resources and the Environment and Electricity
 Committees on Energy Resources and the Environment and Electricity Real World, Real Progress, Real Challenges: Evolving to Align Electricity Planning Approaches NARUC-NASEO Task Force on Comprehensive
Natural Gas Issues and Emerging Trends for the Upcoming Winter and Beyond
 Natural Gas Issues and Emerging Trends for the Upcoming Winter and Beyond 2013 NASEO WINTER ENERGY OUTLOOK CONFERENCE November 1, 2013 Kevin Petak Vice President, ICF International Kevin.Petak@icfi.com
Agenda. Natural gas and power markets overview. Generation retirements and in developments. Future resource mix including large hydro
 Agenda Natural gas and power markets overview Generation retirements and in developments Future resource mix including large hydro Balancing environmental, reliability and cost impacts 1 Northeast Utilities
North American Natural Gas Market Outlook
 North American Natural Gas Market Outlook Energy Trends & Impacts On Gas Infrastructure Prepared For: Gas/Electric Partnership, Conference XVIII Darryl Rogers February 10, 2010 Agenda Introduction to Purvin
EPA Carbon Regulations Stakeholder Meeting
 EPA Carbon Regulations Stakeholder Meeting Arkansas DEQ/PSC August 28, 2014 Dan Byers Senior Director - Policy Institute for 21st Century Energy U.S. Chamber of Commerce Average U.S. Retail Electricity
The Impact of Energy-Efficiency and Renewable Energy on Natural Gas Markets
 The Impact of Energy-Efficiency and Renewable Energy on Natural Gas Markets 24 th Annual North American Conference of the USAEE/IAEE Anna Monis Shipley ACEEE Washington, D.C. July 9, 2004 The American
Adding Thermal Energy to State Renewable Energy Standards: Opportunity, Status, and Challenges
 Adding Thermal Energy to State Renewable Energy Standards: Opportunity, Status, and Challenges Charlie Niebling Partner, Innovative Natural Resource Solutions LLC, Concord NH REV 2017 October 2, 2017 America
Energizing America: Facts for Addressing Energy Policy. Rayola Dougher API Senior Economic Advisor,
 Energizing America: Facts for Addressing Energy Policy Rayola Dougher API Senior Economic Advisor, dougherr@api.org 1970 1975 1980 1985 1990 1995 2000 2005 2010 2015 1970 1975 1980 1985 1990 1995 2000
Value Proposition of Solar Photovoltaics and Fuel Cells in California
 Value Proposition of Solar Photovoltaics and Fuel Cells in California National Congress of American Indians 65 th Annual Convention Phoenix, Arizona October 21, 2008 Lori Smith Schell, Ph.D. www.empoweredenergy.com
Assessing the Potential Economic and Distributional Impacts of a Tighter Ozone NAAQS
 Assessing the Potential Economic and Distributional Impacts of a Tighter Ozone NAAQS TCEQ Independent Workshop on Ozone NAAQS Science and Policy Austin, TX April 7-9, 2015 Anne E. Smith, Ph.D. NERA Economic
Natural Gas The Natural Choice Now.
 Natural Gas The Natural Choice Now. About ANGA ANGA is dedicated to increasing the understanding of the environmental, economic and national security benefits of clean, abundant, dependable and efficient
Risk Mitigation Benefits of Energy Efficiency
 Risk Mitigation Benefits of Energy Efficiency 2013 ACEEE Conference on Energy Efficiency as a Resource Dan Bakal, Ceres Sept 24, 2013 Nashville, TN Ceres " Ceres mobilizes a powerful network of investors,
Sustainable Energy in America
 219 Sustainable Energy in America Factbook GET THE FACTS www.bcse.org No portion of this document may be reproduced, scanned into an electronic system, distributed, publicly displayed or used as the basis
Natural Gas Abundance: The Development of Shale Resource in North America
 Natural Gas Abundance: The Development of Shale Resource in North America EBA Brown Bag Luncheon Bracewell & Giuliani Washington, D.C. February 6, 2013 Bruce B. Henning Vice President, Energy Regulatory
Natural Gas Market Update
 Natural Gas Market Update John Jicha - MGE Director - Energy Supply and Trading Madison Gas and Electric Company Agenda What a difference ten years can make Low prices Fundamental factors impacting the
Energy Efficiency as a Resource Time for Action
 Energy Efficiency as a Resource Time for Action Kathleen Hogan Director Climate Protection Partnerships Division U.S. Environmental Protection Agency American Council for an Energy-Efficient Economy Energy
Trends, Issues and Market Changes for Crude Oil and Natural Gas
 Trends, Issues and Market Changes for Crude Oil and Natural Gas East Iberville Community Advisory Panel Meeting Syngenta September 26, 2012 Center for Energy Studies David E. Dismukes, Ph.D. Center for
The story of renewable energy
 The story of renewable energy International clean energy projects 27 June 2011 Our renewable energy team of 15 years Dedicated renewable energy team based in Toronto, servicing Canada and the North American
State Renewable Portfolio Standards
 State Renewable Portfolio Standards Current Status and Trends April 16, 2018 Warren Leon Executive Director Clean Energy States Alliance CESA is a national, nonprofit coalition of public agencies and organizations
Creating A Greener Energy Future For the Commonwealth MA Energy Future
 MA Energy Future Frank Gorke Director, Division of Energy Efficiency Frank.Gorke@state.ma.us October 15, 2009 DOER Mission Creating a Greener Energy Future, economically and environmentally: Achieving
Vision An expanding role for wind energy in an electricity grid being transformed to power a low-carbon future
 Vision A Wind Energy An expanding role for wind energy in an electricity grid being transformed to power a low-carbon future for Canada January 2019 1 Executive Summary A Canadian Success Story. Wind energy
Generating New Funding for Renewable Energy
 Generating New Funding for Renewable Energy Monday, April 26, 2010; 9:30 10:45 AM Moderator: Paul Deninger, Vice Chairman, Jefferies & Company Speakers: Rex Northen, Executive Director, Cleantech Open
ENERGY SLIDESHOW. Federal Reserve Bank of Dallas
 ENERGY SLIDESHOW Updated: July 5, 2018 ENERGY PRICES www.dallasfed.org/research/energy Brent & WTI & Crude Brent Oil Crude Oil Dollars per barrel 140 120 Brent (Jun 29 = $75.24) WTI (Jun 29 = $74.03) 95%
Wind Energy Update. Larry Flowers National Wind Technology Center, NREL Arizona - September, 2009
 Wind Energy Update Larry Flowers National Wind Technology Center, NREL Arizona - September, 2009 Installed Wind Capacities ( 99 09) *Preliminary data 1981 1982 1983 1984 1985 1986 1987 1988 1989 1990
OF PIPEDREAMS AND PIPELINES
 OF PIPEDREAMS AND PIPELINES 2007 GASIFICATION TECHNOLOGIES CONFERENCE OCTOBER 4 7, 2007 SAN FRANCISCO, CA KLAUS LAMBECK JASON CROSS OHIO POWER SITING BOARD WHAT WOULD ENABLE A VIABLE MIDWEST MARKET Multiple
ENERGY SLIDESHOW. Federal Reserve Bank of Dallas
 ENERGY SLIDESHOW Updated: February 14, 2018 ENERGY PRICES www.dallasfed.org/research/energy Brent & WTI & Crude Brent Oil Crude Oil Dollars per barrel 140 Brent (Feb 9 = $65.50) WTI (Feb 9 = $62.01) 120
Transportation Worker Identification Credential (TWIC) Program. American Association of Port Authorities 2013 Security Seminar July 17, 2013
 Program. American Association of Port Authorities 2013 Security Seminar July 17, 2013") Transportation Worker Identification Credential (TWIC) Program American Association of Port Authorities 2013 Security Seminar July 17, 2013 Current Program Statistics 2.6M. Total Enrollments 2.4M. Total
Transportation Worker Identification Credential (TWIC) Program American Association of Port Authorities 2013 Security Seminar July 17, 2013 Current Program Statistics 2.6M. Total Enrollments 2.4M. Total
6th Annual Forum of the California Biomass Collaborative
 Presentation to 6th Annual Forum of the California Biomass Collaborative May 12, 2009 by Frederick R. Skillman, Jr. Supervising Project Manager Generation Interconnection Services Pacific Gas & Electric
Consumer-Friendly and Environmentally-Sound Electricity
 Consumer-Friendly and Environmentally-Sound Electricity Rates for the Twenty-First Century By Lee S. Friedman Goldman School of Public Policy 2607 Hearst Avenue University of California, Berkeley Berkeley,
Power Sector Transition: GHG Policy and Other Key Drivers
 Power Sector Transition: GHG Policy and Other Key Drivers JENNIFER MACEDONIA ARKANSAS 111(D) STAKEHOLDER MEETING MAY 28, 214 5/23/14 POWER SECTOR TRANSITION: GHG POLICY AND OTHER KEY DRIVERS 2 Purpose