Supplementary appendix
|
|
|
- Fay Strickland
- 6 years ago
- Views:
Transcription
1 Supplementary appendix This appendix formed part of the original submission and has been peer reviewed. We post it as supplied by the authors. Supplement to: Watts N, Amann M, Ayeb-Karlsson S, et al. The Lancet Countdown on health and climate change: from 25 years of inaction to a global transformation for public health. Lancet 2017; published online Oct 30.
2 Appendix 1 - s from other Monitoring Programmes Relevant to the Lancet Countdown Lancet Countdown Thematic Working Group 1. Climate Change Impacts, Exposures and Vulnerabilities Lancet Countdown 1.1. Health effects of temperature change Sustainable Development Goals 1 Carbon Transparency Initiative WHO Climate and Health Country Profiles Warmer and/or fewer cold days and nights over most land areas. Warmer and/or more frequent hot days and nights over most land areas. Heat-related mortality Health effects of heatwaves Warm spells/heatwaves. Frequency and/or duration increases over most land areas. Heat-related mortality Change in labour capacity Heat stress and work productivity. Sendai Framework for Disaster Risk Reduction A-1. Number of deaths and missing due to hazardous events per 100,000. A-2. Number of deaths due to hazardous events. A-3. Number of missing due to hazardous events. B-1. Number of affected people per 100,000. B-2. Number of injured or ill people due to hazardous events. B-3. Number of people who left their places of residence due to hazardous events. B-3a. Number of evacuated people due to hazardous events. B-3b. Number of
3 Lancet Countdown Thematic Working Group Lancet Countdown Sustainable Development Goals Carbon Transparency Initiative WHO Climate and Health Country Profiles Sendai Framework for Disaster Risk Reduction relocated people due to hazardous events. B-4. Number of people whose houses were damaged due to hazardous events. B-5. Number of people whose houses were destroyed due to hazardous events Lethality of weather-related disasters 1.5. Global health trends in climate-sensitive diseases 1.6. Climate-sensitive infectious diseases 1.7. Food security and undernutrition Vulnerability to undernutrition Number of deaths, missing persons and directly affected persons attributed to disasters per 100,000 population Malaria incidence per 1,000 population Malaria incidence per 1,000 population Prevalence of undernourishment. Populations at risk of infectious and vectorborne diseases for malaria and dengue fever. B-6. Number of people who received food relief aid due to hazardous events. C-2. Direct agricultural loss due to hazardous events. 2
4 Lancet Countdown Thematic Working Group Lancet Countdown Marine primary production Sustainable Development Goals Prevalence of moderate or severe food insecurity in the population, based on the Food Insecurity Experience Scale (FIES). Carbon Transparency Initiative WHO Climate and Health Country Profiles Sendai Framework for Disaster Risk Reduction Prevalence of stunting (height for age <-2 standard deviation from the median of the World Health Organization (WHO) Child Growth Standards) among children under 5 years of age Prevalence of malnutrition (weight for height >+2 or <-2 standard deviation from the median of the WHO Child Growth Standards) among children under 5 years of age, by type (wasting and overweight) Volume of production per labour unit by classes of farming/pastoral/forestry enterprise size. 3
5 Lancet Countdown Thematic Working Group Lancet Countdown Sustainable Development Goals Average income of small-scale food producers, by sex and indigenous status. Carbon Transparency Initiative WHO Climate and Health Country Profiles Sendai Framework for Disaster Risk Reduction Proportion of agricultural area under productive and sustainable agriculture. 2.a.1 The agriculture orientation index for government expenditures. 2.b.1 Agricultural export subsidies. 2.c.1 of food price anomalies Global food loss index Index of coastal eutrophication and floating plastic debris density Average marine acidity (ph) measured at agreed suite of representative sampling stations. 4
6 Lancet Countdown Thematic Working Group Lancet Countdown Sustainable Development Goals Carbon Transparency Initiative WHO Climate and Health Country Profiles Sendai Framework for Disaster Risk Reduction 2. Adaptation Planning and Resilience for Health 1.8. Migration and population displacement 2.1. National adaptation plans for health 2.2. City-level climate change risk assessments 2.3. Detection, preparedness, and response to health emergencies 2.4. Climate information services for health 2.5. National assessment of vulnerability, impacts and adaptation for health 2.6. Climate-resilient health infrastructure Proportion of fish stocks within biologically sustainable levels Number of countries that adopt and implement national disaster risk reduction strategies in line with the Sendai Framework for Disaster Risk Reduction Proportion of local governments that adopt and implement local disaster risk reduction strategies in line with national disaster risk reduction strategies. 3.d.1 International Health Regulations (IHR) capacity and health emergency preparedness. Governance and policy. Vulnerability, impact and adaptation (health) assessments. Health adaptation strategies and action plans. Preparedness, risk management and integrated risk monitoring. Awareness raising and capacity building. E-3. Number of countries that integrate climate and disaster risk into development planning Number of countries that have communicated the establishment or operationalization of an 5
7 Lancet Countdown Thematic Working Group Lancet Countdown Sustainable Development Goals integrated policy/strategy/plan which increases their ability to adapt to the adverse impacts of climate change. Carbon Transparency Initiative WHO Climate and Health Country Profiles Sendai Framework for Disaster Risk Reduction 3. Mitigation Actions and Health Co- Benefits Number of countries that have communicated the strengthening of institutional, systemic and individual capacity-building to implement adaptation, mitigation and technology transfer, and development actions Carbon intensity of the energy system 3.2. Coal phase-out Share amount of coal in total final energy consumption that is, the share of an economy s energy derived from coal Zero-carbon emission electricity Proportion of population with primary reliance on clean fuels and technology. Share of electricity from coal generation. Share amount of renewable energy in total final energy consumption that is, an economy s share of 6
8 Lancet Countdown Thematic Working Group Lancet Countdown Sustainable Development Goals Renewable energy share in the total final energy consumption Energy intensity measured in terms of primary energy and GDP Access to clean energy Proportion of population living in households with access to basic services. Carbon Transparency Initiative energy derived from renewable sources. Share of electricity from renewable energy generation. WHO Climate and Health Country Profiles Sendai Framework for Disaster Risk Reduction 3.5. Exposure to ambient air pollution Exposure to air pollution in cities Sectoral contributions to air pollution Premature mortality from ambient air pollution by sector Proportion of population with access to electricity Mortality rate attributed to household and ambient air pollution Annual mean levels of fine particulate matter (e.g. PM2.5 and PM10) in cities population weighted) Clean fuel use for transport Share of new vehicles in a particular geography that are electric drive rather than internal combustion engine Current exposures and health risks due to air pollution, including outdoor air pollution exposure, short-lived climate pollutants, and household air pollution. 7
9 Lancet Countdown Thematic Working Group Lancet Countdown Sustainable Development Goals Carbon Transparency Initiative vehicles. WHO Climate and Health Country Profiles Sendai Framework for Disaster Risk Reduction 3.7. Sustainable travel infrastructure and uptake Share of electric drive vehicles for the light-duty fleet in a particular year. Total terrestrial passenger km, meaning the total number of km that a population travels, including on private, public, and passenger rail. Number of km travelled in terrestrial modes private, public, and rail on a per capita basis. Total number of km travelled in private modes light-duty vehicles, two-wheelers, and three-wheelers. Total number of km travelled in 6 private modes light-duty vehicles, two-wheelers, and three-wheelers on a per capita basis. Total number of km 8
10 Lancet Countdown Thematic Working Group Lancet Countdown Sustainable Development Goals Carbon Transparency Initiative travelled in public modes bus and rail. WHO Climate and Health Country Profiles Sendai Framework for Disaster Risk Reduction Total number of km travelled in public modes bus and rail on a per capita basis. Total number of vehicle km travelled in private modes light-duty vehicles, two-wheelers, and three-wheelers. Share of passenger km associated with public transport bus and rail. Total share of electricity in the energy mix for all terrestrial transport private, public, and freight modes. Share of km associated with private modes of transport light-duty, two-wheelers, and threewheelers. 9
11 Lancet Countdown Thematic Working Group Lancet Countdown 3.8. Ruminant meat for human consumption Sustainable Development Goals Carbon Transparency Initiative Total amount of greenhouse gas emissions associated with the Agriculture Sector. WHO Climate and Health Country Profiles Sendai Framework for Disaster Risk Reduction Total amount of greenhouse gas emissions associated with the Agriculture Sector from direct sources in production and onsite energy use. Total amount of greenhouse gas emissions associated with the Agriculture Sector from electricity. Size of a herd of cattle in a given geography and year on a per capita basis. This metric does not include dairy cattle. Share of agricultural emissions associated with non-dairy cattle. 10 Share of agricultural emissions associated with fertilizers. Greenhouse gas emissions intensity associated with agriculture on a per
12 Lancet Countdown Thematic Working Group 4. Economics and Finance Lancet Countdown 3.9. Healthcare sector emissions 4.1. Investments in zero-carbon energy and energy efficiency 4.2. Investment in coal capacity 4.3. Funds divested from fossil fuels 4.4. Economic losses due to climate-related extreme events Sustainable Development Goals Direct economic loss attributed to disasters in relation to global gross domestic product (GDP). Carbon Transparency Initiative WHO Climate and Health Country Profiles Sendai Framework for Disaster Risk Reduction Direct economic loss in relation to global GDP, damage to critical infrastructure and number of disruptions to basic services, attributed to disasters Employment in low-carbon and high-carbon industries 4.6. Fossil fuel subsidies 12.c.1 Amount of fossilfuel subsidies per unit of GDP (production and consumption) and as a proportion of total national expenditure on fossil fuels Coverage and strength of carbon pricing 4.8. Use of carbon pricing revenues 11
13 Lancet Countdown Thematic Working Group Lancet Countdown 4.9. Spending on adaptation for health and health-related activities Health adaptation funding from global climate financing mechanisms Sustainable Development Goals 3.b.2 Total net official development assistance to medical research and basic health sectors. 13.a.1 Mobilized amount of United States dollars per year between 2020 and 2025 accountable towards the $100 billion commitment. Carbon Transparency Initiative WHO Climate and Health Country Profiles Financing Sendai Framework for Disaster Risk Reduction 5. Public and Political Engagement 5.1. Media coverage of health and climate change Global newspaper reporting on health and 13.b.1 Number of least developed countries and small island developing States that are receiving specialized support, and amount of support, including finance, technology and capacitybuilding, for mechanisms for raising capacities for effective climate changerelated planning and management, including focusing on women, youth and local and marginalized communities. 12
14 Lancet Countdown Thematic Working Group Lancet Countdown climate change In-depth analysis of newspaper coverage on health and climate change 5.2. Health and climate change in scientific journals 5.3. Health and climate change in the United Nations General Assembly Sustainable Development Goals Carbon Transparency Initiative WHO Climate and Health Country Profiles Governance and policy. Sendai Framework for Disaster Risk Reduction 13
15 Appendix 2 Climate Change Impacts, Exposures and Vulnerability A number of challenges associated with choosing indicators to track the health impacts of climate change are recognised, specifically: dealing with signal-to-noise ratios; attribution to climate change; and the role of institutions and policies in determining the impact of a climate hazard on labour productivity, food security, nutrition, and migration. Signal-to-noise ratios are of particular concern here for two reasons. First, with respect to climate warming and climate hazards, annual natural climate variability introduces noise into the system, whereas an important signal is the long-term climate trend. 17 Attribution, the process of establishing the most likely causes for a detected change with some level of confidence 18, thus becomes important when selecting indicators. Second, with respect to identifying the impact of a climate hazard on human wellbeing and health, as reflected in disease, nutrition, and migration, the ultimate impacts on health are heavily mediated by institutions and policies, such that the signal-to-noise ratio between climate hazard and health impact decreases. Working 1. Climate Change Impacts, Exposures and Vulnerability Group Health effects of temperature change Methods Firstly, temperature change relative to mean was calculated for The summer months for each hemisphere were selected (June-July-August for northern hemisphere, December, January, February for southern). Maps of temperature change were plotted and an area-weighted mean was calculated for the temperature change grid. The area weighting was calculated by multiplying the value for each grid location by the cosine of the location latitude, to account for the projection of the rectangular grid onto the spherical globe. Area-weighting is the normal way to define global warming, and is relevant to the 2oC and 1.5oC limits discussed in the Paris Agreement (note however that Figure 1.1 shows changes relative to rather than relative to pre-industrial). The concept of weighting by exposure was introduced in the 2015 Lancet Commission report, to better represent the exposure of vulnerable parts of the population to changes in mean climate and in climate extremes.4 Exposure-weighting can be seen as a mean of vulnerable heads, while area-weighting is a mean over areas of the Earth s surface. Secondly, temperature changes were projected onto a world population grid and the population-weighted mean for each year was calculated to produce a time series. Note that since the weighting for each year was performed using the population for that year, this cancels out population growth effects. This is true for indicators

16 Data The European Centre for Medium-Range Weather Forecasts (ECMWF) provided weather data for this indicator. ERA-Interim climate reanalysis data was used, as well as a climatology derived from ERA. ( Population gridded data was obtained from the NASA Gridded Population of the World (GPW) v4 using UN-adjusted population grid data ( at 5-year intervals from , with yearly population interpolated from these values was used as a mid-point for the time series. Future Form of Additional Informatio n This indicator may readily be updated with new data each year. Additionally, it would be interesting to project it further into the past to obtain a longer term overview of the progression of this indicator. a) C b) Map showing a) the trend in mean summer temperatures between 2000 and 2016 and b) population density change from 2000 to 2016, relative to the recent past average. 15
17 Working Group Methods 1. Climate Change Impacts, Exposures and Vulnerability 1.2. Health effects of heatwaves A heatwave was defined as a period of 4 or more days at a given location where the minimum daily temperature was greater than the 99 th percentile of the distribution of minimum daily temperature at that location over the reference period, for the summer months. The number and length of heatwaves was calculated for over the weather grid. The mean number and length was calculated for The summer months for each hemisphere were selected as in 1.1. The change in number and length of heatwaves was then calculated for each year from 2000 to 2016 for each location and the global area weighted means calculated for each year. Yearly population grids were used as described in 1.1 The population over 65 count was calculated by matching demographic data the fraction of people over 65 for each year from the UN WPP with country area definitions, and projecting this onto the population grid. This effectively assumed that over 65 fraction is constant across a given country s area. The number and length of heatwaves grid was projected onto the population over 65. A population weighted mean length was calculated and a number of exposures (heatwaves x persons) were calculated for each year. Data For weather and population data, see 1.1 Demographic data was obtained from the UN World Population Prospects (WPP) project ( Country borders and identifiers (GIS shapefiles) were obtained from the Natural Earth Data repository ( Caveats Future Form of Heatwave length was calculated as the total period above the threshold, for periods of 4 or more days, the minimum heatwave length is therefore 4 days. As for 1.1, this indicator may be updated every year with new climate data Working Group Methods 1. Climate Change Impacts, Exposures and Vulnerability 1.3. Labour productivity loss The labour capacity was defined as labour capacity= max(0, WBGT 25) 2/3 where WBGT is the Wet Bulb Globe Temperature, which is a 16
18 function of the dew point temperature (see Dunne et al. 2013). WBGT and labour capacity were calculated for The difference for each year between labour capacity and the mean labour capacity for was then calculated. Yearly population grids were used as described in 1.1 Using a method similar to 1.2, the fraction of the population living in rural areas from WPP was associated with each country and projected onto the population grid. This was used to calculate the population weighted change in labour capacity for each year to produce the labour capacity time series. Data For weather and population data, see 1.1 For demographic and country border data, see 1.2 Caveats The rural population was defined as a simple fraction of the population for each country, rather than identifying whether a given population grid location was within an urban or rural area. Future Form of As for 1.1, this indicator may be updated every year with new climate data Working Group Methods Data Caveats 1. Climate Change Impacts, Exposures and Vulnerability 1.4. Lethality of weather-related disasters This indicator is based on the generic formulation from a climate change perspective of disasters as a function of hazard, exposure and vulnerability. Year to year variation was measured, showing the number of people killed as a proportion of those affected by different hazard type, normalised by the strength of the individual hazards as a measure of adaptive (or maladaptive) changes in national health care services and the associated disaster preparedness and response. Here, deaths are defined as the number of people who lost their life because the disaster happened, and people affected as those requiring immediate assistance during a period of emergency; hence requiring basic survival needs such as food, water, shelter, sanitation and immediate medical assistance. EM-DAT at the Centre for Research on the Epidemiology of Disasters (CRED) at the Université Catholique de Louvain, Belgium ( One underlying assumption is that the normalised number of people killed by climate related disasters is an accurate proxy for measuring health impacts of the climate. Clearly this measure ignores the longer causal chains involving the interaction of climate and health. Finally, a further limitation is that this measure ignores the longer causal chains involving the interactions of weather, climate, disasters, health and health services. To date, there is no international consensus regarding best practices for collecting disaster impact data. However, EM-DAT represents one of the most 17
19 widely used datasets in this area and is used here for a number of reasons: it is updated on a daily basis; includes information from over 21,000 disasters since 1900; the data entries are reviewed and validated for completeness and consistency; and the data comes from a wide range of sources including UN organisations, local NGOs, insurance companies, research institutes and media/press. The validity of the deaths-to-affected ratio as an indicator rests on the assumption that it reflects disaster management and health system capacity. A key challenge for this indicator is in estimating those affected and those exposed, and distinguishing the two; a difficult task in the context of disasters. An important caveat is that while the number of people affected in a disaster is often reported, the operational definition of who is affected varies across countries, as do the methods of estimation. Additionally, some of the most severe droughts are related to water management issues, not to weather, and yet the cause of the drought is not differentiated here. Similarly, the cause of landslides is often difficult to determine, and so these events are not included in the data here. Future Form of Future efforts will include a comparison of estimates of those exposed with those affected. Additionally, the impact of replacing the number of people killed with the number requiring assistance will also be explored. A subsidiary indicator will come from the online Sendai Framework Monitor. Here countries will start reporting against the Sendai Framework indicators and the DRR related indicators of the SDGs. The first Sendai Framework and SDG progress report will be released in This indicator therefore aims to expand to include country specific progress in vulnerability levels of health service systems to climate risks in relation to this monitoring data. Additional Information Yearly change over time in the percentage of people killed, as a proportion of those affected globally by different climate- and weather-related disasters, as compared to the average for
20 Yearly change over time in the percentage of people killed as a proportion of those affected globally by drought related disasters, as compared to the average for a) b) 19
21 a) Nationally disaggregated ratio of the average number of deaths: to numbers affected for drought, flood and storm related disasters for the period compared to b) The normalised difference in the ratio of the average deaths to numbers affected for compared to against the average number of deaths per climate and weather related disaster for The normalised difference comprise the difference of the deaths: affected ratio between and normalised by the sum of these ratios. Positive values indicate and increase in the numbers of deaths per affected. Working Group Methods Data 1. Climate Change Impacts, Exposures and Vulnerability 1.5 Global health trends in climate-sensitive diseases This indicator displays generally unprocessed descriptive trends for selected diseases retrieved from The Global Burden of Disease (GBD) project database (1) over the period The derivation of estimates within the GBD study relies on modelling, rather than analysing direct observations, and the GBD methodology has already been described (1). The trends are aggregated and presented by WHO region as mortality rates per 100,000 individuals per year over the period. We provide also annual estimates by country in the supplement. As far as we can ascertain from the GBD documentation, climate change and weather are not part of the covariates included in the estimates, making it valid to examine GBD outputs in the light of climate and weather data to formulate coherent inter-country comparisons. Trends are described for: all causes of death, malaria, dengue, diarrhoeal diseases, protein-energy malnutrition, heat and cold exposure, malignant melanoma and forces of nature. Deaths directly related to forces of nature have been adjusted for the effects of the most severe seismic events. Of the ten highest countryyear mortality estimates due to forces of nature, seven were directly due to specific seismic activity, and these have been discounted by replacing with the same countries force of nature mortality for the following year. 1. Global Burden of Disease Study Global Burden of Disease Study 2015 (GBD 2015) Results. Seattle, United States: Institute for 20
22 Caveats Future Form of Health Metrics and Evaluation (IHME), Available from tool. This is not a direct measure of the impact of climate change on death and disease. Rather, it presents mortality figures for those diseases which are none to be influenced by climate. The trends presented therefore do not show detection and attribution of climate change to death. They do show the impact of climate relevant and climate sensitive diseases on mortality rates globally since GBD estimates are now revised annually. Future versions of this indicator may include additional health conditions, may include morbidity as well as mortality, and may extend to national and subnational scales. Increased interest in geo-spatial disease analyses is likely to lead to additional information, such as fringe zone trends and outbreaks, and associate patterns of diseases to climate anomalies, such as those driven by the ENSO circulation. Future disease trends in the GBD estimates will be linked to direct measurements in resource poor areas in Africa and Asia, for example using longitudinal mortality registers from the INDEPTH network. 15 Working Group Methods 1. Climate Change Impacts, Exposures and Vulnerability 1.6 Climate-sensitive infectious diseases Methods for the analysis on publication on climate-sensitive infectious diseases follow Liang and Gong (2017), updated to the most recent complete year for which data were available (2016). Briefly, we conducted a systematic review of the literature using bibliographic databases including the ISI Web of Science, Scopus, ScienceDirect, and PubMed. We used a multi-step approach, first searching abstract/title/keywords using strings of [( climate change or climate ) and infectious disease ], followed by retention of articles focussing on disease in humans, then a second round of searching using further keywords describing more specific climate-disease elements, and finally a manual screen according to specific rules (namely, we removed duplicated, non-english, non-peer reviewed, nonhuman related articles and those that did not report a health outcome related to climate change, such as review, editorial, or commentary articles). Essential article information was extracted from each paper for the summary, including: 1) direct information including the title, journal, publishing year, authors; 2) place name and spatial scale of the study area; 3) study period; 4) research methods used; 5) types of infectious disease studied; 6) types of climatic variable studied; and 7) the conclusions made about the impacts of climate change on human infectious disease. The final dataset included 339 papers. Methods for calculating Vectorial Capacity (VC) follow Liu-Helmersson et al. (2016) and Liu-Helmersson et al. (2014). VC refers to a vector's ability to transmit disease to humans. It incorporates interactions between host, virus, and vector, assuming that all three of these elements are present. Specifically, VC represents the average daily number of secondary cases generated by one primary case introduced into a fully susceptible population, and is expressed as: 21
23 Where a is the average vector biting rate, bh is the probability of vector to human transmission per bite, bm is the probability of human to vector infection per bite, n is the duration of the extrinsic incubation period EIP, μm is the vector mortality rate, and m is the female vector-to-human population ratio. In our application, the time unit is one day and each of the vector parameters depends on temperature, with parameter values derived from the literature, typically from experimental data, as described in Liu-Helmersson et al., (2014). Diurnal temperature range (DTR) was reconstructed using a representative daily temperature through a piecewise sinusoidal function based on the monthly average of daily minimum, maximum, and mean observations. We extracted the annual average VC values per grid cell to Aedes aegypti presence points provided in Kraemer et al., (2015) and averaged these values by country to get country specific trends in VC at a yearly time step from Data Climate data were taken from the Climate Research Unit Time Series (CRU-TS 3.22) online database of gridded ( degrees) monthly averages of daily temperature observations (minimums, maximum, and mean) for the period January 1, 1950 to December 31, 2015 (the latest year available). Caveats Key caveats and limitations of the model and its parameterisation are described in Future Form of Liu-Helmersson et al., (2014, 2016). It is difficult to extrapolate the trend in publication effort and trends to 2030 given the very recent near exponential increase in publications meeting the systematic search criteria and the dynamic nature of representativeness of both disease types and geographical spread through time. However, in the near term, we can expect an ongoing increase in the volume of publications exploring climate change infectious disease associations, covering increasingly more dynamic and complex disease systems with increasing taxonomic and geographic representativeness. We might expect an ongoing decline or flattening off in the proportion of publications reporting positive associations (i.e., increases in risk) as more and increasingly complex systems are addressed more robustly with increasing potential to address confounding and interacting factors. Climate change is not expected to be a universal driver of increasing disease risk and many disease systems may exhibit overall declines in risk as changes in climatic factors could similarly drive components of disease transmission systems beyond environmental optima (Lafferty and Mordecai, 2016). Understanding this broader range of responses is critical to tailor research and management efforts on disease systems and populations. There has been a clear and consistent increase in globally averaged VC since the late 1970s. For Aedes aegypti, VC was an average of 9.4% higher in 2015 relative to a 1950 baseline. Extrapolating the strong linear increase in VC for Aedes aegypti since 1950 (R 2 = 0.784) suggests that VC could increase by a further 1.6% by 2030 (i.e., ~11% overall increase relative to the 1950 baseline). This extrapolation is based only on the observed increase in VC to date and does not take into account actual projections of climate change from global circulation models. 22

24 Additional Information Number of infectious disease and climate change publications in 2016 by country, with select case studies shown in boxes around edge illustrating the diversity of study systems and direction of responses detected Working Group Sub- Methods 1. Climate Change Impacts, Exposures and Vulnerability 1.7. Food security and undernutrition Vulnerability to undernutrition In an increasingly connected world, food security is equally a globalised concern. The link between agricultural production, health and nutrition, and climate is complex. Thus identifying a single climate and under-nutrition indicator to track, requires compromises and an understanding that only certain aspects of this relationship can be addressed. This methods section explores the logic and rationale behind the specific indicator selected to track climate, food insecurity, and health. In doing so, a number of additional potential indicators are discussed, to contextualise the chosen indicator. First a rapid review of the literature was undertaken to explore indicators of food security, under-nutrition, and climate, and the pathways under which climate change affects under-nutrition. This creates the narrative behind the chosen indicator and its evolution, and is used to identify the critical parameters that need to be taken account of when choosing how to construct the indicator. Second, informed by this review, relevant country-level data were collected that address food production-related vulnerability and exposure to global warming. Third, an indicator was constructed. Fourth, looking forward, a more nuanced indicator is considered that will build on real time data that incorporates temperature in addition to vulnerability and exposure. Whilst the indicator explored here focuses on climate and under-nutrition, it is recognised that food insecurity has long been closely linked to poverty (for example, Reutlinger, 1985; Maxwell, 1996), whether low yields for farmers, low purchasing power for consumers, or a high proportion of income spent on food. 23
25 Thus, irrespective of climate, there are many approaches to enhancing food security and nutrition. Literature and narrative Food security has been defined by the FAO as a situation that exists when all people, at all times, have physical, social and economic access to sufficient, safe and nutritious food that meets their dietary needs and food preferences for an active and healthy life (FAO The State of Food Insecurity in the World Rome). Thus food security requires there to be enough food, in the right place, and for people to be able afford to purchase it. If an individual is not food secure, implicitly they are at risk of under-nourishment and ill-health. Most of the world s food insecure are located in African countries by proportion (27% undernourished) and South Asian countries by absolute numbers (300m undernourished) ( At a global level, total food availability in any one year depends on stocks and current year harvest. Governments and individuals hold grain reserves. Whereas public storage has stabilising impact on food price volatility and therefore a positive impact on food security, grain held by private sector corporations tends to be for speculation (d Amour, 2016) and thus plays a much smaller role with respect to food security. Carry-over stocks of grain have been described by Lester Brown, president of the Earth Policy Institute, as the most basic indicator of food security. Thus the number of days worth of grain held in storage can be considered to provide one real time indicator of global food security. Globally, over the past three decades, stocks have been falling, due variously to liberalization of grain markets, the high costs of storage, and governments being increasingly willing to rely on markets rather than storage in times of localized shortages (Figure 1). Whilst this could suggest a reduction in global food security, the accompanying increased trade in grains can substitute for storage, mitigating the impacts of idiosyncratic food production stocks across space, whereas storage mitigates across time. 24
26 140 Days of consumption Grain in storage, expressed as the length of time in days that time the world s food reserves would feed the global population (source: Compiled by Earth Policy Institute from United States Department of Agriculture, Production, Supply & Distribution) Lower-income countries are vulnerable to climate change, whether they highly dependent on grain imports, or on domestic production, but in different ways. The food system is increasingly globalised, and countries that are highly dependent on food imports are particularly vulnerable to non-localised agricultural productivity shocks that originate in other countries and are propagated through international food markets (Ahmed et al., 2009; d Amour et al., 2016), suggesting that increased trade may not be able to fully substitute for reduced food stocks. This was clearly demonstrated in the 2008 food crisis. Droughts in Australia affecting the wheat harvest triggered speculation, hording, and several countries introducing export restrictions, which all combined to drive up the price of staples and increase food insecurity (Headey and Fan, 2008), resulting in an extreme spike in the price of rice, and even triggering food riots in Haiti. Indeed, cereals imports dependency ratio is a key FAO food security indicator, reflecting the importance of the global food system to individual country food security. Such systemic crises, in which shocks that originate in one country affecting one specific crop trigger instability and crisis in other countries, crops, or sectors, occur with low probability but have a high impact on food security and under-nutrition. They are not the focus here, in part because the pathway from initial climate hazard in one location to undernutrition in another is complex, tricky to predict, and highly mediated by human systems, thus diluting the climate signal considerably. In part in reaction to the 2008 food crisis, countries may increase their efforts to be food self-sufficient. Yet perhaps paradoxically, some countries that increase their dependence on domestic production rather than imports (i.e. an emphasis on food security through self-sufficiency rather than increased ability to purchase 25
27 imported foods) will remain vulnerable to climate change, though under different conditions. This is particularly so for countries located in latitudes where greater temperature increases are predicted, and where yields of key staples have been found to be particularly sensitive to temperature increases. Greater variability in climate in regions where there are already high levels of under-nourishment has been recognized as a consequence of global warming and a key issue for undernourishment (Schmidhuber and Tubiello, 2007) due to instability in food production (Bruinsma, 2003). Disentangling the impact of climate can be tricky as farming practices and technologies are also changing over time. Candidates for indicator selection Given the complex links between climate, food production, food security and under-nutrition, several options for a suitable indicator were considered. For each of these potential options commonalities exist. The first is a focus on countries and regions where there are already high levels of under-nutrition, thus their populations are particularly vulnerable to negative food shocks. The second is a focus on those countries that are most reliant on domestic production, and thus most likely to be directly harmed by location-specific climate hazards. Though yields will be affected differentially depending on the particular crop and location, there is clear evidence from global studies covering over 20 years of research, that crop yields are more negatively affected across most tropical areas than at higher latitudes, and typically countries with a current high hunger levels will experience the highest yield declines due to climate change (Wheeler and von Braun, 2013). The third focus is on locations where climate change is predicted to have a particularly negative impact on yields. The IPCC reports with medium to high confidence that increasing global temperatures will have an overall negative impact on key staple yields, particularly for wheat and maize, whilst the impacts on rice and soybean are smaller. The impacts are not evenly spread across the globe. Higher latitude countries typically are currently benefiting from increasing temperatures, with yields in some more temperate countries predicted to increase in response to climate change. At lower temperature increases, positive feedbacks have been identified for spring wheat and soybean, which have been predicted to improve globally due to CO2 fertilisation effects. Increasing CO2 concentrations enhance water use efficiency and yields but can be accompanied by elevated levels of O3 that can harm yields. Overall, increases in temperature up to 3 degrees Celsius may enhance average global crop yields (Deryng et al., 2014). Thus globally, shifts north and CO2 fertilisation may increase food security in higher latitudes, and mitigate against loss of yield elsewhere at the level of the global food system. Given the decision to focus on countries that are currently experiencing high levels of under-nutrition, that are particularly dependent on domestic production of staple foods, and that are in locations where global warming will have a negative impact on yields, several potential indicators were considered that link to temperature, drought, and vulnerability. Temperature, climate, and under-nutrition 26
28 Overall crop yields for staples (excluding rice for which no overall change is predicted) are predicted to decline on average by 8% by the 2050s in South Asia (- 16% maize, -11% sorghum) and Africa (-17% wheat, -5% maize, -15% sorghum, - 10% millet), currently the most food insecure regions (Wheeler and von Braun, 2013), as a result of increasing temperatures. Recognising the well documented linkages between temperature and yield loss, one option considered was to monitor temperature. Such a temperature-oriented indicator would provide a strong climate signal, but weaker food availability and nutrition signal; is highly data intensive, with the required data being time, location, and crop and variety specific; and with important interactions between temperature and precipitation (Jones and Thornton, 2003). For example, the effects of extreme temperature or precipitation events within any particular growing season can have disproportionately large impacts on final yields. Daytime warming has been found particularly harmful to maize in African countries whereas night time warming is particularly harmful for rice (Lobell et al., 2011). Drought, climate, and under-nutrition The second option considered was to monitor the number of households affected by droughts, particularly those in countries already experiencing under-nutrition. Climatic hazards, in the form of droughts, and to a lesser extent floods, have been identified as causing localised and relatively sudden onset of extreme food insecurity (Devereux, 2007) and accompanying health problems in vulnerable communities that are highly dependent on agriculture. Such climate hazards are predicted to increase as a consequence of global warming (Easterling et al., 2000), and are particularly tricky to adapt to in the shorter and longer term. One of the most comprehensive databases of negative harvest shocks caused by drought can be found on reliefweb.org. Reliefweb tracks disasters that can be categorized using various search terms. Searching for drought within the database allows one to count the number of drought events that have resulted in a sufficiently severe localised weather-induced harvest failure to cause significant increases in hunger in the country where the drought occurred. For example, in 2016, Sri Lanka drought led to the loss of two consecutive harvest losses that resulted in 900,000 people being severely food insecure and requiring immediate support to mitigate the impact (Reliefweb.org). However, isolating the climate warming signal from cyclical processes such as El Nino events, given the relatively short time series for which data are available, is not possible and so this option is not pursued. Yield, climate, and under-nutrition There is considerable evidence that climate change will have a negative impact on yields in lower latitudes, suggesting the possibility of an indicator that links to realised yields in countries already experiencing high levels of under-nutrition. Average yield data can be obtained from FAOSTAT for the key staple grains for each country, and divergences from regional and global trends calculated. However, even measuring yield differentials rather than absolute yields, given the myriad of adaptation opportunities in the short to medium term that can be adopted to prevent yields from falling, the climate-yield reduction signal is 27
29 weakened and thus too the climate health signal. Thus this option is therefore not pursued. Vulnerability, climate, and under-nutrition The fourth option is to focus on vulnerability and exposure of populations in locations where the literature is confident that temperature increases will affect yields negatively. Two key dimensions are considered: reliance on domestic production in lower-latitude countries most likely to be affected negatively by climate change; and existing prevalence of under-nourishment. Countries with low cereal import dependence ratios (high domestic production dependence) are countries most vulnerable to localised weather shocks. This is the option that is followed, and detailed in the section below, though it is recognized that as presented, the climate-health signal remains weak. The indicator currently combines data on vulnerability, as proxied by current levels of under-nutrition, with exposure, as proxied by dependence of the population on locally produced climate-sensitive crops. Data The FAO dataset reveals 5 countries with very high (>35%) levels of undernourishment; 15 countries with high (>25%) levels; and 18 countries with moderately high (>15%) levels ( Details are provided in Table 1 for current under-nourishment prevalence. These countries were then categorised according to the extent to which they are dependent on domestic production, the key cause of their levels of under-nourishment, and their vulnerability to climate-related falls in yield, based on location. At a more aggregated level, five regions with under-nourishment prevalence rates of over 15% stand out. These are Southern Africa (excluding South Africa), Middle Africa, Eastern Africa, Southern Asia, and Western Africa. Regional details Countries in southern Africa are highly dependent on food production in the region. Therefore, though individually some countries have a low domestic production indicator (for example, Swaziland, 26.8%), the regional domestic production indictor is 91%, implying that the region only imports 9% of its food requirements. Thus any localised drought or general fall in production affects the region broadly, though these countries are less vulnerable to the low-probability high-impact systemic crises precipitated by harvest shocks in different parts of the globe. Reflecting the risk of high dependence on local food production, in 2003, 14.5 million people were reported to be at risk of starving in Malawi, Mozambique, Lesotho, Swaziland, Zambia and Zimbabwe, precipitated by a twoyear drought in the region. Compounding this high dependence on domestic production is a high dependence on individual crops. For example, Zambia has an 88% maize dependency, and Mozambique 64%. Crop simulations moreover suggest maize yields in this region are highly sensitive to climate change. South African maize yields are predicted to fall between -8%, -25%, and -42% for high, medium, and low-productivity outcomes; with equivalent numbers for Malawi, Mozambique, and Zambia of 2%, -10%, and -22% (Hertel et al., 2010; Schlenker 28
30 and Lovell, 2010). Given these data, southern Africa is a key region to monitor exposure and vulnerability as reflected in current undernutrition and reliance on domestic production. Figure 1 demonstrates clearly that countries in southern Africa remain persistently food insecure, and vulnerable to localised climate hazards % Regional production Zambia Namibia Zimbabwe Swaziland Mozambique Botswana Under-nutrition in key southern African countries, and % regional production (source: FAOSTAT) In the following figure, which provides additional detail for the indicator presented in the main text, the first panel in Figure 1.11 shows where countries with the highest prevalence of under-nourishment are located. The following five panels present average prevalence of under-nutrition for the thirty countries, which has been falling in each region; the total number under-nourished (TUN), which is stable or increasing in each region; and the TUN weighted by dependence on regional production of grains, which gives a measure of how exposed already under-nourished populations are to localized climate hazards. Under-nourishment Red=prevalence >30% Orange = prevalence >15% 30.0 '000,000 people Southern Africa (7 countries) Total undernourished TUN (Mn) TUN*Dependency Prevalence x * 29
31 '000,000 people Western Africa (5 countries) Prevalence x * '000,000 people Middle Africa (3 countries) Prevalence x * '000,000 people/% Eastern Africa (10 countries) Prevalence 0.0 '000,000 people * * Southern Asia (5 countries) Prevalence x 10 Figure: (a) Food under-nourishment prevalence by country (red>30%, orange >15%); and (b-f) vulnerability-exposure indicator for five regions Source: FAOSTAT Caveats The chosen indicator focuses on the extent to which populations already experiencing moderate to high levels of under-nutrition are vulnerable to localized climate shocks that will compromise their health further. At present, the climate hazard itself has not been incorporated directly, though it is indirectly acknowledged through the choice of locations where climate change is predicted, with confidence, to have a large and negative impact on yields, and where populations are highly dependent on local production. Ultimately this indicator will aim to combine critical temperatures that are known to reduce maize yields in lower latitudes, with vulnerability as measured by existing levels of under-nutrition, and local exposure as manifested in regional dependence on maize. The data will be initially collected for the particular case of southern Africa. This exercise will be repeated for the other key regions, and the total population-vulnerability-exposure-weighted indicator presented. The next iteration aims to produce the full suite of indicators addressed above. Our selection of indicator is designed to address food insecurity in the context of the direct impact of climate change on crop production. We do however recognise that this is one element of food security and under-nutrition, and that poverty and 30
32 conflict have been found to be the key drivers of hunger (Misselhorn, 2005; Margulis, 2013). % Undernourished Cereal domestic dependency ratio Countries Haiti Zambia Central African Republic Namibia DPR Korea Chad Zimbabwe Tajikistan Madagascar UR of Tanzania Ethiopia Liberia Rwanda Congo Timor-Leste Swaziland Afghanistan Yemen Uganda Mozambique Botswana Iraq Sierra Leone Sri Lanka Pakistan Kenya Guinea-Bissau Burkina Faso Malawi Mongolia Lao PDR Nicaragua Guinea Bangladesh Djibouti Bolivia (Plurinational State of) Guatemala
33 India Undernourishment prevalence and cereal domestic production dependency (higher number equals greater reliance on domestic production) (source: FAO) Future Form of Given the importance of temperature, the aim is to incorporate temperature into the indicator from next year, with the focus on lower-latitude areas which are highly dependent on maize. This approach will be piloted using data for southern Africa, for which maize is the dominant staple, the region is highly dependent on local production, and climate change is predicted to result in high crop losses. Key climate-oriented parameters for yield include heat stress at anthesis, and accumulated thermal time over the growing season. For example, in African countries, each degree day spent above 30 C during the growing season has been shown to reduce final yield by 1% under optimal rain-fed conditions, and by 1.7% under drought conditions (Lobell et al., 2011). These findings emphasise the importance also of precipitation. For example, water deficits during the two critical days of tasselling or pollination have been found to result in yield losses of up to 22% (Hall et al., 1971). Exactly which temperatures should be tracked, and where, will be addressed in detail during the following year. Working Group Sub- Methods 1. Climate Change Impacts, Exposures and Vulnerability 1.7. Vulnerability of food systems and under-nutrition Marine primary productivity Eleven marine fishery locations which are important in terms of projected impacts and vulnerabilities associated with climate change were selected as determined by FAO (10) (Fig. S1). Moreover, since a mini case study on the impact of changing marine primary productivity on commercial fish catch and human health in the Persian Gulf is presented herein, therefore, Persian Gulf (i.e., location 12) was also included among the locations under investigation. February and August, representing cold and warm periods, were considered for data acquisition. The databanks used for extracting the data related to the A-biotic and Biotic indexes are tabulated in Table S1. 32

 has also been included as it was")
34 Data Fig. S1. Important Marine fishery locations in terms of projected impacts and vulnerabilities associated with climate change as determined by FAO. Persian Gulf (i.e., location 12) has also been included as it was considered for the case study presented in this report. 33
35 Fig. S2. Location of the Reference Basins. Caveats Future Form of Additional Informati on As presented in Table S1, there exist some spatial and temporal limitations. More specifically, some of the databases do not present a clear data trend while some other databases only include recently-collected data and there is a lack of log-term data required to interpret the variations in some index groups. It would be ideal to observe and monitor the A-biotic index group defined under the Marine Primary Productivity for a period of 3-5 years at the locations of important fishing sites and sensitive marine costal ecosystems especially coral reefs (Fig. S1). These could be found in the databases introduced herein (Table S1). Simultaneously, Biotic index group parameters including density and abundance of important commercial fish stocks (i.e., biomass of commercial fish stocks) and their respective ichthyoplankton community shall also be assessed during the same time period and at the same locations. It is also suggested to investigate the diversity and density of phytoplankton community at the same locations and over similar time frame too. Such findings could assist in assessing the human health-related unfavourable consequences of climate change through jeopardizing marine primary production or in another word, marine-based food security and nutrition. Moreover, the resultant implications could serve as guidelines for the policy makers and the authorities of the marine environment departments to strive to engage NGOs and local communities to contribute to conservation, management, and sustainable utilization of the marine resources and ecosystems. Finally, in locations where commercial fish catch has been negatively affected leading to decreased fish consumption, necessary measures should be taken in order to induce public awareness regarding the associated negative health impacts while trying to change the pattern of consumption in favour of other available marine products. Analysing the sea surface temperature (SST) data for twelve marine fishery locations revealed approximately 1oC increase from 1985 (22.74 o C) to 2016 (22.73 o C) (11). Analysing sea surface salinity (SSS) data for the twelve marine fishery locations obtained from the NASA Earth Observatory databank (Table above) revealed 0.43 PSU increase from 1985 (34.98 PSU) to 2014 (35.41 PSU). Coral reed ecosystems are seen to have deteriorated between 2009 and 2016 (12), and the occurrence of Alert 2 has significantly increased. For instance, in February 2016, the incidence of Alert 1 in the Great Barrier Reef compared with February 2009 confirms the severity of its bleaching status (Figure S3). 34
 products, from 2009 to 2016 (Source: NOAA Coral Reef Watch).")
 is the 12-week accumulation of HotSpot values that are at least 1 o C.")
36 Fig. S3. Coral bleaching thermal stress levels based on the NOAA CRW operational 50- km Coral Bleaching HotSpot and Degree Heating Week (DHW) products, from 2009 to 2016 (Source: NOAA Coral Reef Watch). Note: As quoted from the NOAA Coral Reef Watch Operational Near-real-time Twiceweekly Global 50 km Satellite Coral Bleaching Thermal Stress Monitoring Product Suite, Bleaching Degree Heating Weeks (DHW) is the 12-week accumulation of HotSpot values that are at least 1 o C. A DHW value of one is equivalent to one week of HotSpot at 1 o C and a DHW of two is equivalent to two weeks of HotSpot at 1 o C or one week of HotSpot at 2 o C. The Bleaching HotSpot is a special type of SST anomaly showing the difference between the nighttime SST and the maximum monthly mean (MMM) SST climatology. The HotSpot data contain only the positive values for identifying potential thermal stress conducive to coral bleaching. 35

37 Fig. S4. Changes in SST in the western (top) and eastern (bottom) regions of the Persian Gulf ( ) vs. the coral reefs bleaching threshold of 35oC.43 (Source: NOAA Coral Reef Watch - Heron, SF, Liu, G, Rauenzahn, JL, Christensen, TRL, Skirving, WJ, Burgess, TFR, Eakin, CM, Morgan, JA. Improvements to and Continuity of Operational Global Thermal Stress Monitoring for Coral Bleaching. Journal of Operational Oceanography 2014; 7(2): ). Fig. S5. Annual fish consumption per capita in Bushehr Province (main Iranian fishing site) from (Source: Iranian Fisheries Organization (IFO), IFO Statistical Report) Food Security and Fish Stocks in the Persian Gulf One basin in which fish stocks are an important source of food is the Persian Gulf. Fish stocks have been declining in the Persian Gulf since the 1970s, with food security concerns arising for the populations here dependent on fish for food.86 Human activities, including industrial activity (including petroleum production that exacerbates climate change when later burned), dredging and land reclamation are influencing fish stocks here.87 Furthermore, recent studies of fishing show that actual fish catch quantities in this region are up to six times higher than the reported quantities given to the UN, and therefore likely to be at unsustainable levels.88 These factors are compounding to increase the pressure on fish stocks and reduce marine populations, which many people in the area are dependent on as a primary source of food. For fish populations already under pressure from human activities, climate change 36
38 presents a further challenge to fish stocks in this region by altering the ecosystems in which they live. Thus, the ability of fish populations to withstand and recover from direct human impacts is compromised and threatens the future maintenance and even survival of fish populations in the Persian Gulf. This in turn has implications for human health. Food security in the southern Persian Gulf is already a concern and fish consumption is an important source of protein, accounting for up to 10% of the population s protein consumption. Although innovations in aquaculture have helped address some food security concerns inland, marine fish populations are still declining and so food insecurity is still problematic for coastal communities in the Persian Gulf.89 Considering existing declines in marine fish populations and food security concerns in the Persian Gulf, it is important to understand the implications of climate change in this region, for these current risks could be further exacerbated by ecosystem changes associated with a changing climate. Changes to SST and SSS, key proxies for measuring the influence of climate change on fish stocks, have been found to have been negatively impacting the coral reefs in the Persian Gulf, which fish populations are dependent upon for their survival; for example, there were mass coral bleaching events in the Persian Gulf in 1996 and 1998, which caused a decline in fish.87 SST has risen since 2013, but also exceeded the coral bleaching threshold of 33 C in the summer months across both regions throughout the period 2013 to 2017 (see Appendix 2 Figure S4).90 Rising SST and associated coral stress is likely to have contributed to lower fish populations and associated decreases in the total catch of major commercial fish species in the Iranian waters in the Persian Gulf, including tiger tooth croaker (Otolithes ruber), threadfin (Polynemus spp.), and silver pomfret (Pampus argenteus). Bushehr Province, the main Iranian fish catching site, has experienced a decrease in the total catch of the major commercial fish species, leading to a sharp decline in annual fish consumption per capita, from 46.8 kg in 2009 to 24.7 kg in 2016 (see Appendix 2 Figure S5).91 This decline is most likely a combination of human stressores, including climate change and overfishing, but nonetheless the consequences for human health are clear reduced fish stocks increases food insecurity and risks undernutrition in the region, as protein from fish becomes increasingly unavailable. Working Group Methods 1. Climate Change Impacts, Exposures and Vulnerability 1.8. Migration and population displacement The presumed link between climate change and migration is now firmly embedded in academic and public consciences. Yet critical voices continue to highlight both the lack of evidence linking climate change directly to migration through linear causality and the multitude of factors which influence any connections between the two. These criticisms do not deny interactions between climate change and migration, nor the possibility of future occurrences of large-scale migration linked to climate change. They simply point out the truisms from migration research which are often bypassed that: 1. Migration is and always has been part of humanity. 2. Many factors, including climate-related, influence and have always influenced human migration and non-migration decisions. 3. Where people are forced to migrate or not to migrate when they would prefer otherwise, in many circumstances, it is lack of support mechanisms to deal with environmental changes, rather than the environmental changes themselves, which are the root cause of the migration. 37
39 Point 3 is not about removing environmental influences. When houses fall off eroding cliffs in California or lava starts flowing through settlements, little option exists but to migrate, since few support mechanisms exist which would prevent the environmental changes. The key for this indicator is determining when climate change is the only environmental change for which support mechanisms might be needed. For instance, the Californian cliffs have always been prone to erosion, even if climate change influences the rates. Similarly, any influences which climate change is having or might have on volcanic activity (McGuire, 2010) do not change the fact that the settlements were vulnerable to lava flows anyway. Nonetheless, Table 1 provides key ways which are not covered in this indicator in which climate change might be a factor in people being forced to migrate. Each factor in Table 1 has listed a root cause and a possible intervention mechanism which has the potential for precluding the forced migration or making the migration somewhat forced and somewhat not forced. As such, being a factor does not mean being the cause (and an intervention might also cause further problems). Consequently, this indicator highlights the phrasing due to climate change only to understand where forced migration is truly occurring due to climate change with no other possibilities and to avoid climate change being used as a scapegoat because it is easier to blame climate change than to tackle the real causes of the migration. Table 1: How climate change might be a factor in forced migration. Factor Root cause Possible intervention mechanism Extreme weather Vulnerability, not Reduce root causes of including floods, hazard. vulnerability to extreme droughts, and weather. storms. Increased air Climate change. Invest resources to temperatures (averages and mechanise the outdoor labour and train workers peaks, especially with the skills needed, over extended rather than relying on periods of time) poor people to provide making it cheap work in challenging dangerous to circumstances without work outdoors. training. Limited food or Climate change can be Improved resource freshwater. a root cause, such as management. salination from sealevel rise, but more typically it is human mismanagement and overconsumption. In terms of migration due to only climate change impacts, where intervention mechanisms still exist but the success possibility is low, the main factors are likely to be: 38
40 1. Sea-level rise, with three sources (Table 2): (i) slow melting of ice (glaciers, ice sheets, and permafrost) leading to centimetres of sea-level rise over years and undermining of traditional ice-based livelihoods; (ii) thermal expansion of water bodies leading to metres of sea-level rise over decades, and (iii) ice sheet collapse (Greenland and Antarctica) possibly leading to tens of metres of sea-level rise but likely over centuries. 2. Changing Arctic ice conditions which cause coastal erosion sometimes metres per year because lack of sea ice leads to wave, storm, and current action on coastlines. 3. Ocean acidification which could lead to shingle beach erosion or, coupled with elevated sea-surface temperatures, could lead to major coral mortality through bleaching which would expose coastlines to the full oceanic power of waves, storms, and currents without a protective reef. It is important to be cautious regarding attribution of witnessed changes and attribution of migration to climate change. Yet what is observed now does not necessarily indicate the only future possibilities. People might later need to migrate due to climate change only, such as if accelerated sea-level rise occurs or if places around the Arctic Ocean become ice free. Therefore, a hierarchy evolves: 1. People in locations migrating now due to climate change only. 2. People in locations which might possibly need to migrate due to climate change only, most likely due to thermal expansion, lack of sea ice, or ocean acidification (possibly coupled with other climate change impacts), because these factors tend to be localised (thermal expansion is global, but as noted in the caveats, displays regional and local variations). Melting land ice might contribute to this category through additions to sea-level rise and destabilisation of land and infrastructure as permafrost melts. 3. People in locations which might possibly to need to migrate due to climate change only, if ice sheet collapse occurs, because this factor would be a major step change in global conditions, with regional and local variations, but with a global baseline. The people in these three sets of locations can be quantified by the population in them, leading to the indicator being the number of migrants and the number of communities (as distinct values) migrating only due to climate change according to the three categories. Only material from peer-reviewed literature is considered. The robustness of each category is: 1. The number of people in locations migrating now due to climate change only has high robustness. Nonetheless, new evidence could remove locations from this category. Around 2010, it became evident that the sea was encroaching so extensively onto the atoll of Takuu, PNG that migration would likely be inevitable. While some coastal management had exacerbated the situation, the main explanation based on available data although not published in peer-reviewed literature appeared to be sea-level rise associated with climate change. Mann et al. s (2016) analysis agreed that sea-level rise is measurable around the atoll, but not that the shoreline changes are due to sea-level rise. Consequently, had this indicator been developed in 2015 including Takuu, then Takuu would have been removed in This situation is a further argument for focusing on peer-reviewed literature rather than on non-peer reviewed reports of local observations. 2. The number of people in locations who might possibly need to migrate due to climate change only has medium robustness. Due to lead-time available for this indicator, strong possibilities exist for taking measures to prevent inevitable 39
41 migration. In most locations, the need for such measures has been known over the past few decades with little action resulting. The current political climate is also not amenable to large-scale action for some time. Consequently, action is feasible to prevent migration, but does not seem likely before thermal expansion s impacts become apparent. 3. The number of people in locations who might possibly need to migrate due to ice sheet collapse has low robustness. Uncertainties are high while manifestation of ice sheet collapse on the century scale means that numerous other factors could influence possibilities for, preparation for, and reactions to migration related to ice sheet collapse. Data Table 2. Quantification of sea-level rise Citation Sea-level rise Amount of sealevel rise component Brown et All m over al levels (2016) by the 2090s (the Clarke et al. (2016) DeConto et al. (2016) Dieng et al. (2017) Jevrejeva et al. (2014) Jevrejeva et al. (2016) Mengel et al. (2016) van den Broeke et al. (2016) All Antarctica melt ice mean is 0.36 m) m over the next 10,000 years 1 m by 2100 > 15 m by 2500 All ± 0.19 mm/yr All. The maximum possible sea-level rise over 2000 by 2100 is 1.90 m with a more realistic upper limit being 1.80 m. All. 0.9 m median projected rise by 2100 All m m m by 2100 compared to Greenland ice melt ~0.47±0.23 mm/yr on average from ; max. 1.2 mm in 2012 Notes Nine different models used. Reported by time period, component, and emissions scenario. Based on a current emissions rate. Reported by time period and component. Based on current emissions rate. Depends on emissions scenario. Reported by component. Table 3. Locations potentially seeing forced migration due to climate change (Kelman, 40
42 Caveats I., 2018, Islandness within climate change narratives of small island developing states (SIDS), Island Studies Journal, 13, 1 (publication approved)) Reference Locations studied Results Albert et al. 33 reef islands of the Island responses range from entire (2016) Auerbach et al., 2015 Solomon Islands. An island in southwestern Bangladesh. Ballu et al. (2011) Torres Islands, Vanuatu. Biribo et al. (2013) Reef islands of Tarawa Atoll, Kiribati. Ford (2012) Majuro, Marshall Islands Ford and Kench (2015) Kench et al. (2015) Mann et al. (2016) McLean and Kench (2015) Eight islands of the Marshall Islands. 29 islands of Funafuti Atoll, Tuvalu. Takú Atoll, Papua New Guinea. Over 200 Pacific islands. Rankey (2011) 17 atolls across Kiribati. Webb and Kench 27 atoll islands across (2010) the Federated States of Micronesia, Kiribati, and Tuvalu. Yates et al. (2013) 47 atolls of Manihi and Manuae, French Polynesia. disappearance to minor accretion. Worsening flooding from the ocean was attributed more to human deforestation and use of structural defences than to sea-level changes. Tectonic subsidence is dominating sea-level rise as the reason for ocean encroachment. Significant erosion and accretion are observed, but mainly due to local human activities. Sea-level rise is measurable, but atoll changes are mainly from local human activities. Where human activities are less noticeable, some shorelines are eroding and some are accreting. Sea-level rise is measurable, but all the islands show net accretion. Sea-level rise is measurable, with island responses ranging from severe erosion to significant land gain. Sea-level rise is measurable, but is not dominating natural shoreline dynamics. Despite measurable sea-level rise, little evidence exists of island sizes being reduced, with both local human activities and wider environmental cycles dominating sea-level rise. Increased rates of change for both erosion and accretion. Sea-level rise is measurable, but the islands showed a mixture of erosion, accretion, and stability, with only a few islands losing area overall. Despite measurable sea-level rise, most island areas are expanding or remaining stable, although major localised changes are seen. Two atolls showed local human activities influencing the changes. Caveats from the literature regarding sea-level rise estimates: (a) Sea-level rise will not be the same everywhere, with significant regional variations from the global mean (Carson et al. 2016; Clarke et al. 2016). (b) The rate of sea-level rise is expected to accelerate in coming years (Fasllo et al. 2016; Watson 2016). 41
43 (c) Sea-level rise is 0.71 ± 0.20 mm/y slower than expected because the climate is driving increasing water storage on land (Reager et al., 2016). (d) Sea level might have natural, multi-decadal oscillations (Serazin et al., 2016). People from many locations are assumed to be migrating due to the possibilities given as being climate change only, but analysis shows that the assumptions are not always supported (Table 3). In fact, no outcome is certain. Even for coral reefs, Perry et al. (2015) postulate that coral growth under some scenarios could keep up with sea-level rise and other ecosystem changes. Corals ability to flourish under rapid sea-level changes was demonstrated empirically in the Solomon Islands by Saunders et al. (2016) after sudden tectonic subsidence. Similarly, mangroves so far are demonstrating robustness to sea-level changes while nevertheless being damaged by human activity (Woodroffe et al. 2010). In summary, a linear cause-effect assumption is made of: climate change (impacts) migration health impacts Each step has nuances, subtleties, and provisos. For the first step, migration due to climate change (impacts) only is hard to discern because migration has always happened throughout human history for multiple reasons, some climate- and environment- related; some not linked at all to climate or environmental factors; and most often due to a combination of factors. Many assumptions behind migration potentially linked to climate change are hard to prove as being climate change only or are challenging to differentiate from many other environmental factors, such as specific natural hazards or changes to food, water, and/or livelihood conditions which manifest for multiple reasons. For the second step, migration itself, no matter how or why migration occurs, does not necessarily induce specific health outcomes. Migrant and host health could be improved, worsened, or not affected, depending on how the migration is handled. Future Form of Consequently, the main caveats for this indicator is that no linear cause-effect sequence happens, mainly because the outcomes from a situation depends much more on how a situation is dealt with than on climate change or migration per se. Two main prospects exist for this indicator s future. The first is observational. As estimates and observations of sea-level rise, ocean acidification, sea ice, and coastal erosion continue, the indicator s thresholds might change. The second is how the indicator is constructed. Consideration could be given to how managing migration affects health in order to overcome a principal caveat. Irrespective, this caveat can never be fully overcome because health impacts can be managed, if we choose to do so, irrespective of climate change or migration scenarios or realities. In later iterations of this indicator, descriptions can be provided of locations which have switched categories, been removed entirely, or been added as new. As these iterations approach 2030, the tables given for each indicator are likely to expand substantially because the number of studies is expanding immensely on (i) observed climate change impacts with confirmed attribution, (ii) projecting such impacts into the future; and (iii) migration linked to climate change. Consequently, the potential impacts of climate change on migration are likely to become much clearer towards 2030, including possible case studies where such migration has occurred. Caution is still needed regarding numerous cases where attribution is stated with confidence, but the link upon closer examination is not robust. While the indicator here is presented in 42
44 a highly focused and rigid manner, in order to keep it scientifically precise and robust, expanding knowledge and observations might permit the indicator in 2030 to be much more comprehensive and less narrow without losing robustness. Suppleme ntary Informatio n Given the complexity of the observational science and the challenges articulated by the caveats, the ideal form of this indicator given adequate time and resource would be a map of all potential migration location origins under different climate change scenarios, animated over time to Although climate change projections are published for the next 10,000 years (Clarke et al., 2016), social and technological changes will be immense over such time scales, making it difficult to provide any confidence for suggestions regarding how and where people will live and be responding to environmental stimuli long into the future. If people choose to settle other planets, solar systems, or galaxies over the next several millennia in order to escape a dying Earth as much science fiction (not peer reviewed) has postulated would they be climate (change) migrants? Such questions are beyond the scope of Lancet Countdown. Consequently, to achieve this proposed map with scientific value, it should not go beyond 2100 and at least one dedicated post-doctoral researcher would be needed, preferably with a GIS and migration specialty because the number of caveats, provisos, uncertainties, and attribution challenges would lead to multiple layers and indicators on a map. Locations possibly needing to migrate due to climate change only The proviso possibly in this title refers to technical solutions being developed to help the people stay in or near their current locations, irrespective of the climate change factors mentioned. These schemes include artificial settlements floating above or built directly on the current locations (Yamamoto et al., 2014), whether above an island being submerged, an eroding coastline, or destabilised permafrost. Financing for these technical proposals has so far been absent and does not seem likely in the near future, plus technical challenges remain. Nonetheless, they are possibilities and it is difficult to project the social and political make-up of the world over the coming decades. The range of possibilities covers shifting the trillions of dollars per year in military spending and fossil fuel subsidies to tackling climate change all the way through to abandoning anyone affected by climate change through refusing to permit them entry into other countries. The most likely outcomes are somewhere in between such extremes. Consequently, the migration of these territories remains possibly rather than definitely. Additionally, defining migrating for this category is not straightforward. Does it mean moving house, street, municipality, island, or country? Would it include moving 5 m, 50 m, 500 m, or 5 km? For example Pingelap atoll in the Federated States of Micronesia has significant area above 15 m above sea level but all land is within 300 m of the coast. If the people of Pingelap move their houses or move to different houses due to sea-level rise, is that migration, because they are still living in effectively the same location? If so, then a street-by-street census would be needed of Pingelap and every other coastline in the world to determine exactly who would need to migrate, due to regional and local variations in how sea-level rise manifests. Consequently, a country rather than community level is presented (Table 4), identifying the countries which might (not definitely) not be able to remain as countries under thermal expansion. Apart from those people already migrating due to 43
45 climate change, this indicator yields four countries totalling a population of 584,000 people possibly needing to migrate due to thermal expansion. All four are small island developing states (SIDS), but this is coincidental; all countries have been considered. Table 4. Locations possibly needing to migrate due to thermal expansion Location Population Notes Kiribati 106,925 Has plenty of high ground above 10 m above sea level, but little is habitable or viable for large populations. Maldives 392,960 Highest point is 2.4 m above sea level. Marshall 73,376 Highest point is 10 m above sea level. Islands Tuvalu 10,959 Highest point is 5 m above sea level. As a guess, the countries in Table 4 would need to migrate between 2040 and This statement is a guess, because the decision to migrate will most likely be political strongly influenced by specific extreme events rather than a strategic analysis of possible futures and outcomes from those futures. This statement is made on the basis of history and how societies have typically dealt with disasters and creeping environmental changes. As well, other countries could rapidly be added to Table 4. If coral reefs around Fiji or Seychelles experience high mortality, then near-coastal areas could potentially experience rapid erosion. Two provisos preclude large numbers of people in each country, or significant parts thereof, from being forced to migrate. First, while far from an ideal approach, extensive coastal engineering (which both countries already implement) could forestay major coastal erosion. Second, plenty of land is available in those countries which could theoretically take migrants although with practical problems regarding access, ownership, and heritage protection and few people would necessarily need to migrate far in theory, leading to the problem of defining migration mentioned above. If land tenure or ecosystem protection precludes settling in areas, is the root cause of migration farther afield climate change or local human decisions regarding land? All these factors emphasise the possibly word in this indicator s title. They also highlight that this indicator s value is a minimum, but many more possibilities for migrants exist under this category most notably erosion linked to sea ice disappearance. Locations which might possibly need to migrate only due to climate change, if ice sheet collapse occurs In the coming decades, the numbers of people migrating due to ice sheet collapse is likely to be near zero. The reason is that the collapse process itself followed by ice melt and sea-level rise takes a minimum of decades and possibly up to centuries. As we move from the decade scale to the century scale, it is impossible to project social and technological developments. It is too simplistic and it would be indefensible to just calculate the number of people living within a certain elevation above sea level especially since over the coming decades, these population numbers will change. Nonetheless, some websites host data on population in coastal zones such as Columbia University and the World Bank but these are not part of the 44
46 peer-reviewed literature. The UN has also developed the indicator Percentage of Total Population Living in Coastal Areas _coasts/pop_coastal_areas.pdf into which the World Bank and Columbia University data input, but again, it is not published in the peer-reviewed literature. Instead, peerreviewed publications provide the following analyses: In 1990, 450 million people lived within 20 km coast and below 20 m above sea level (Small and Nicholls, 2003). The provided plots permit higher resolution estimates to be obtained with reasonable precision, but accuracy is questionable. In 1994, 1.88 billion people (33.5% of the global population) lived below 100 m above sea level (Cohen and Small, 1998), which was the highest vertical resolution investigated. In 2000, 634 million (10% of the global population), of whom 360 million are urban, lived below 10 m above sea level (McGranahan et al., 2007), which was the highest vertical resolution investigated. With 2000 as a baseline, the population living below 10 m above sea level and connected to the ocean will change from 638 million to, depending on the societal scenario chosen, 1,005-1,091 million by 2050 and 830-1,184 million by 2100 (Merkins et al., 2016). With 2000 as a baseline, the population living below 10 m above sea level on contiguous land which borders a major body of water will change from million to, depending on the societal scenario chosen, , million by 2100 (Jones and O Neill, 2016). The number of people living below 5 m above sea level is calculated to be 290 million (5.4%) in 1990, 380 million (5.6%) in 2010, and 460 million (5.5%) in 2030 (Kummu et al. 2016). For , million people live below 1 m above sea level; million people live below 5 m above sea level; and million people live below 10 m above sea level (values are also available for below 2, 3, and 4 m above sea level) depending on the models used (Lichter et al. 2011). This paper also provides a review of similar literature to date, which plenty of further estimates of the coastal population. Consequently, this indicator yields zero extra people migrating due to ice sheet collapse by 2100; that is, no one would need to migrate who is not already migrating. After 2100 and in ensuing centuries without appropriate action based on the above literature, as an order of magnitude, perhaps over one billion people +/- 50% might need to migrate due to ice sheet collapse. This estimate is based on ice sheet collapse only; as noted above, has low robustness because it is mainly guesswork with large errors; and has no relation to the estimates of climate migrants and climate change refugees which have been debunked by Gemenne (2011) and Hartmann (2010). Instead, it simply states that if ice sheets collapse and in the absence of major social and technological changes (an unlikely situation by 2100), then in the decades and centuries after 2100, over one billion people +/- 50% might need to migrate due to climate change only. 45
47 Appendix 3 Adaptation Planning and Resilience for Health Working Group Methods 2: Adaptation Planning and Resilience for Health 2.1 National adaptation plans for health In May 2008, the 193 Member States of WHO passed a World Health Assembly (WHA) Resolution 61.19, calling for stronger action to address the health risks associated with climate change both through adaptation and mitigation responses. In addition, the WHO work plan on Climate Change and Health EB136/16 calls for promotion and development of tools for more systematic provision of countryspecific information and monitoring of progress. As part of the fulfilment of this mandate, WHO is actively engaged in the United Nations framework Convention on Climate Change and together, WHO and the UNFCCC collaborated on the development of climate and health country profiles to provide ministers of health and health decision-makers with national estimates of the climate hazards, health impacts, potential health co-benefits of mitigation actions and status of national policy response in their countries. The collection of data for this exercise includes a biennial national survey, entitled the WHO Climate and Health Country Survey, which is sent to all WHO member states and is completed by ministry of health focal points. Results from the country survey together with 46
48 the WHO Climate and Health Country Profiles form the basis of WHO s global monitoring of national progress on climate and health action. The data presented in this report reflect the responses of 40 countries that participated in the 2015 baseline WHO Climate and Health Country Survey. Validation of the 2015 country reported data was undertaken as part of the development and review of the WHO UNFCCC Climate and Health Country Profiles. Key climate and health stakeholders including the ministry of health and other related government bodies were invited to review country specific findings. The validated data presented in this report are for 40 countries, including; Algeria, Bangladesh, Bhutan, Botswana, Brazil, Brunei Darussalam, Cambodia, China, Colombia, Egypt, Ethiopia, Fiji, France, Germany, Ghana, Indonesia, Iran (Islamic Republic of), Jordan, Kenya, Lao People's Democratic Republic, Madagascar, Malaysia, Maldives, Mexico, Morocco, Myanmar, Nepal, Nigeria, Oman, Pakistan, Peru, Philippines, Sri Lanka, Tanzania (United Republic of), Thailand, Timor- Leste, Tunisia, Uganda, the United Kingdom and the United States of America. Data Caveats Future Form of WHO Climate and Health Country Survey The survey sample may not be representative of all countries as this survey was voluntary, and the baseline sample tended to include countries that had active climate and health projects or countries that were working directly with WHO on climate and health projects. As such the overall results may tend to be positively biased but still provide valuable insights into the status of national policy response for participating countries from all WHO regions and representing a diverse range of low, middle and high income nations with varying population sizes, climatic and geographic characteristics and different vulnerabilities to the impacts of climate change. The WHO Climate and Health Country Survey will be conducted biennially and will aim to gather data from all WHO member States, with the specific goal of doubling the number of survey respondents to 80 participating member states in the next iteration of the survey (2017). Working Group Methods 2: Adaptation Planning and Resilience for Health 2.2 City-level climate change risk assessments CDP serves as an official reporting platform for the Compact of Mayors, and administrates, collects and analyses a global survey of city based environmental and climate change data on an annual basis. In 2016, 553 cities participated in the survey, with 449 reporting publically that included questions on emissions, adaptation assessments and plans. Respondents to the surveys to describe the magnitude of the 47
49 impact of climate based hazards (extremely serious, serious, less serious) and identify three critical assets or services that may be most impacted. Data Caveats Future Form of Supplement ary Information Based on this data two indicators can be developed. The first is a global cities based indicator of government areas that have undertaken a climate change risk or vulnerability assessment. The second is global cities based indicator of the perceived vulnerability of health infrastructure to climate change. CDP data cities This is a sample survey of 449 public results, are self-reported. As such, the results are not representative and are not necessarily reliable, owing to their being based on self-reporting cities. In future, this indicator will aim to expand the number of cities included in the survey and to have a more regionally representative sample. Also, the quality of the climate change risk assessments and implementation rate of any associated plans would be important to analyse. Cities that noted that Health & Community are threatened by Climate change Number Percentage Yes % No % Cities by WB Country Income Category that noted that their Health & Community Assets are threatened by Climate change World Bank income Category High Income Upper Middle Income Lower Middle Income Low Income Freq. % Freq Freq % Freq. %.. % Yes % 61 48% 11 46% 29 48% No % 67 52% 13 54% 32 52% Total Cities Working Group Methods 2: Adaptation Planning and Resilience for Health 2.3 Detection, preparedness, and response to health emergencies Under the International Health Regulations (IHR (2005)) all States Parties are required to have or to develop minimum core public health capacities to implement the IHR (2005) effectively. IHR (2005) also states that all States Parties should report 48
50 Data Caveats Future Form of to the World Health Assembly annually on the implementation of IHR (2005). In order to facilitate this process, WHO developed an IHR Monitoring questionnaire 2, interpreting the Core Capacity Requirements in Annex 1 of IHR (2005) into 20 indicators for 13 capacities. Since 2010, this self-reporting IHR monitoring questionnaire is sent annually to National IHR Focal Points (NFPs) for data collection. It contains a checklist of 20 indicators specifically developed for monitoring the development and implementation of 13 IHR capacities. The method of estimation calculates the proportion/percentage of attributes (a set of specific elements or functions which reflect the level of performance or achievement of a specific indicator) reported to be in place in a country. The core capacities to implement the International Health Regulations (2005) have been established by a technical group of experts, as those capacities required to detect, assess, notify and report events, and to respond to public health risks and emergencies of national and international concern. To assess the development and strengthening of core capacities, a set of components are measured for each of the core capacities, by considering a set of one to three indicators that measure the status and progress in developing and strengthening the IHR core capacities. Each indicator is assessed by using a group of specific elements referred to as attributes that represents a complex set of activities or elements required to carry out this component. As it is difficult to measure these indicators with a simple question that requires one yes or no answer, one to three questions are derived from each attribute, and these are administered through a questionnaire. The status of performance for an indicator, component and core capacity is determined by the presence of attributes. If a country does not indicate a particular attribute as absent or present, it is counted as absent for scoring purposes. The annual questionnaire has been conducted since 2010 with a response rate of 72% in 2012, 66% in 2016, and 99% of countries reporting at least once since Annual reporting results are complemented by after action reviews, simulation exercises, and joint external evaluation (JEE). International Health Regulations (2005) Annual Reporting This indicator does not show the implementation status of IHR core capacities for all countries it only reports on those countries who reported. In future, this indicator would hope to consider additional data sources beyond the IHR Reporting Questionnaires and expand the number of countries included in the results, to strengthen the global picture of the available human resources to prepare, respond and adapt to climate-related health impacts. Closer alignment will be sought with the monitoring of SDG 3D, Strengthen the capacity of all countries, in particular developing countries, for early warning, risk reduction and management of national and global health risks. 3.D.1 is also measured by: International Health Regulations (IHR) capacity and health emergency preparedness. The indicator may be expanded to include more detailed information provided through the complementary IHR joint external evaluation instruments; or the monitoring systems for the Sendai Framework 3, including data from WHO s reports on country capacities for health emergency and disaster risk management, which may in the future provide a complementary system to track health outcomes, effects on health services and the community and national capacities to manage the health risks of climate related emergencies and disasters. Furthermore, this indicator could
51 Supplement ary Information in the future look to include more details of the achieved capacities in relation to health system capacity. currently also measured by IHR indicators. IHR Core Capacity 7: Human Resources. Capacity score (%) of human resources available to implement the IHR (2005), by WHO Region. (IHR 7.1.1) WHO region Africa Americas Eastern Mediterranean Europe South-east Asia Western Pacific Source: IHR Core Capacity 3: Surveillance. Combined capacity score for (%) based, surveillance includes an early warning function for the early detection of a public health event (IHR 3.1.1); Event-Based Surveillance is established and functioning (IHR 3.2.1), by WHO Region. Africa Americas South-East Asia Europe Eastern Mediterranean Western Pacific Global Source: IHR Core Capacity 4: Response. Combined capacity score for (%) Public health emergency response mechanisms are established and functioning. (IHR 4.1.1); and (%) Infection Prevention and Control (IPC) is established and functioning at national and hospital levels (IHR 4.2.1), by WHO Region. WHO region Africa Americas South-East Asia Europe Eastern Mediterranean Western Pacific
52 Source: IHR Core Capacity 5: Preparedness. Combined capacity score for (%) A Multi-hazard National Public Health Emergency Preparedness and Response Plan is developed and implemented. (IHR 5.1.1); and (%) Priority public health risks and resources are mapped and utilized (IHR 5.2.1), by WHO Region. WHO region Africa Americas South-East Asia Europe Eastern Mediterranea n Western Pacific Source: Working Group 2: Adaptation Planning and Resilience for Health 2.4 Climate information services for health Methods In 2015, the most recent year for which data are available, a total of 104 Members (54%) provided survey results. Response rates were 53% for Africa, 44% for Asia, 75% for South America, 68% North America, Central America and the Caribbean, 29% for the South-West Pacific, and 63% for Europe. This indicator measures the number of members (NHMS) who report to provide targeted/tailored climate information, products, and services to support user requirements in their countries for adaptation and climate risk management in key socio-economic sectors. Data were processed by WHO to focus on the proportion of countries that report providing tailored climate information, products and services to their public health sector. Data World Meteorological Organization. Caveats WMO (2016). Monitoring and Evaluation Report, January 2012 December P FinalReport_ pdf These are self-reported results, they do not capture the type, source, quality or utility of data provided to the health sector, and nor do they do not capture the use of the data by the health sector. They do not reflect whether data is national or resulting from regional or global products. They do not reflect the potential use of all-sector forecasts or outlooks which are accessed and used by the health sector, nor climate services which may be provided by other sources than the NHMS. Analyses have been structured according to WHO regional definitions and some differences between WHO and WMO member states exist. WMO Members which are not WHO members, or are represented through different classifications were excluded from the analyses and include Macao, Hong Kong, Curaçao and St. Maarten, Dominica and British Caribbean Territories. 51
53 Future Form of Future WMO surveys are currently being planned which are more specific to evaluate they type of products, user satisfaction, and application. These figures should be complemented by WHO Surveys of countries reporting to partner with their meteorological service and use climate information in routine ways for risk management. Working Group Methods Data Caveats Future Form of 2: Adaptation Planning and Resilience for Health 2.5 National assessment of vulnerability, impacts and adaptation for health See description of methods provided for indicator 2.1 above. WHO Climate and Health Country Survey See description of caveats provided for indicator 2.1 above. The WHO Climate and Health Country Survey will be conducted biennially and will aim to gather data from all WHO member States, with the specific goal of doubling the number of survey respondents to 80 participating member states in the next iteration of the survey (2017). The 2017 country survey will not only gather data on the number of countries that have conducted a national assessment, but also on the use of assessment outcomes to inform policy and the allocation of financial and human resources in the health sector. Furthermore, this indicator could in future look to include more details of these national assessments, including how regularly they are updated; if there has been any action resulting from these assessments to address problems identified; and the involvement of health professionals in developing, undertaking and understanding these assessments. Working Group Methods Data Caveats Future Form of 2: Adaptation Planning and Resilience for Health 2.6 Climate-resilient health infrastructure See description of methods provided for indicator 2.1 above. WHO Climate and Health Country Survey See description of caveats provided for indicator 2.1 above. The WHO Climate and Health Country Survey will be conducted biennially and will aim to gather data from all WHO member States, with the specific goal of doubling the number of survey respondents to 80 participating member states in the next iteration of the survey (2017). Future iterations of the WHO Climate and Health Country Survey will aim to collect data on whether national assessments of the climate resilience of health infrastructure and technology have been conducted and to what extent. Additionally, countries will be asked to report on the specific measures that have been taken to increase climate resilience of health infrastructure including the development of contingency plans to ensure access to and evacuation of hospital sites and the equipment of critical technologies, systems and services to continue functioning despite extreme climate-related events. 52
54 Additional s Working Group Methods Data Caveats Future Form of 2: Adaptation Planning and Resilience for Health Number of countries using climate information in integrated disease surveillance and response systems See description of methods provided for indicator 2.1 above WHO Climate and Health Country Survey See description of caveats provided for indicator 2.1 above The WHO Climate and Health Country Survey will be conducted biennially and will aim to gather data from all WHO member States, with the specific goal of doubling the number of survey respondents to 80 participating member states in the next iteration of the survey (2017). The WHO Climate and Health Country Survey will also aim to investigate more closely the use of climate information in the health sector. Countries will be asked to report whether climate information (short-term, seasonal or long-term data) is currently being used in surveillance, early warning and communication systems for specific climate-sensitive diseases and health outcomes, such as thermal stress, vector-borne diseases and air pollution. 53
55 Appendix 4 Mitigation Actions and Health Co-Benefits Working Group Methods 3. Mitigation Actions and Health Co-Benefits 3.1: Carbon intensity of the energy system Technical definition is the tonnes of CO₂ emitted for each unit (TJ) of primary energy supplied. The rationale for the indicator choice is that carbon intensity of the energy system will provide information on the level of fossil fuel use, which have associated air pollution impacts. Higher intensity values indicate a more fossil dominated system, and one that is likely to have a higher coal share. As countries pursue climate mitigation goals, the carbon intensity is likely to reduce with benefits for air pollution. The indicator is calculated based on total CO 2 emissions from fossil fuel combustion divided by Total Primary Energy Supply (TPES). TPES reflects the total amount of primary energy used in a specific country, accounting for the flow of energy imports and exports. Data Caveats The data are available for most countries of the world, for the period This indicator is based on based on the energy balances from the International Energy Agency. The source reference is: International Energy Agency (2016): CO2 Emissions From Fuel Combustion: CO2 s (Data downloaded: 10 March 2017). UK Data Service. The indicator does not provide information on the share of different fossil fuels, their use in different sectors, and the absolute levels of usage. These are all important elements in understanding the air pollution emissions, 54
56 Future Form of and their impacts. Therefore, additional indicators (3.2 & 3.3) provide additional complimentary information. This indicator will need to be updated to provide the data for the most recent years, which have seen important shifts in the use of fossil fuels, particularly coal. Working Group 3. Mitigation Actions and Health Co-Benefits 3.2. Coal phase-out. Methods Two indicators are used here; i) Total primary coal supply by region / country (in EJ units), and ii) Share of electricity generation from coal (% of total generation from coal). These indicators are important for enable a tracking of change in coal consumption at a regional and country level. Due to the level of coal used for power generation, a second indicator tracks the contribution to electricity generation from coal power plants in selected countries. As countries pursue climate mitigation goals, the use of coal is likely to reduce with benefits for air pollution. The indicator on primary energy coal supply is an aggregation of all coal types used across all sectors (from the IEA energy balances). The indicator on the share of electricity generation from coal is estimated based on electricity generated from coal plant as a percentage of total electricity generated. Data The data are available for most countries of the world, for the period Only the period from 1990 has been used, due to data gaps for selected countries prior to Countries with large levels of coal use (as a share of generation, or in absolute terms), have been selected. This indicator is based on based on the energy balances from the International Energy Agency. The source reference is: For total primary coal supply - International Energy Agency (2015): Coal Information: World Coal Supply, (Data downloaded: 11 November 2015). UK Data Service. Caveats Future Form of For data to compile share of electricity from coal generation - International Energy Agency (2015): World Energy Balances: Extended Energy Balances, (Data downloaded: 15 October 2015). UK Data Service. These indicators provides a proxy for air quality emissions associated with the combustion of coal. Further work is required to convert coal use by sector and type into emissions of different air quality pollutants. In the future, this indicator set could be developed to also estimate the actual air pollutant emissions associated with coal use. This will require sectoral use, coal type (both of which are available) and appropriate emission factors. As per 3.1, this indicator will need to be updated to provide the data for the most recent years, which have seen important shifts in the use of coal. 55
57 Working Group Methods 3. Mitigation Actions and Health Co-Benefits 3.3. Zero-carbon emission electricity. Two indicators are used here, and presented in two ways; i) Total low carbon electricity generation, in absolute terms (TWh) and as a % share of total electricity generated (to include nuclear, and all renewables), and ii) Total renewable generation (excluding hydro), in TWh, and as a % share of total electricity generated. The increase in the use of low carbon and renewable energy for electricity generation will push other fossil fuels, such as coal, out of the mix over time, resulting in an improvement in air quality, with benefits to health. The renewables (excluding hydro) indicator has been used to allow for the tracking of rapidly emergent renewable technologies. For both indicators, generation, rather than capacity, has been chosen as a metric as the electricity generated from these technologies is what actually displaces fossil-based generation. Countries with large levels of low carbon generation (as shares, or in absolute terms), or with higher fossil dependency, have been selected. The data are again taken from the IEA energy balances. The absolute level indicators are total gross electricity generated aggregated from the relevant technology types. The share indicators are estimated as the low carbon or renewable generation as a % of total generation. Data The data are available for most countries of the world, for the period Only the period from 1990 has been used, due to data gaps for selected countries prior to This indicator is based on based on the energy balances from the International Energy Agency. The source reference is: For specific renewable and nuclear generation levels - International Energy Agency (2015): World Energy Balances: Extended Energy Balances, (Data downloaded: 15 October 2015). UK Data Service, Caveats Future Form of For total electricity generated - International Energy Agency (2015): Electricity Information: World Electricity and Heat Supply and Consumption, (Data downloaded: 11 November 2015). This indicator set does not provide information on the air pollutant emissions displaced due to the increasing share of RE generation. This set should be developed to include an indicator to assess the direct impact on air quality emissions from additional low carbon generation, one approach being to compare the emission intensity of the current system with a counterfactual case, which does not have the additional share of RE generation. Working Group Methods 3. Mitigation Actions and Health Co-Benefits 3.4. Access to clean energy Definition: The proportion of population with primary reliance on clean fuels and technology is calculated as the number of people using clean 56
58 fuels and technologies for cooking, heating and lighting divided by total population reporting that any cooking, heating or lighting, expressed as percentage. Clean is defined by the emission rate targets and specific fuel recommendations (i.e. against unprocessed coal and kerosene) included in the normative guidance WHO guidelines for indoor air quality: household fuel combustion. [Above definition from SDG Metadata] Data The indicator is modelled with household survey data compiled by WHO. Estimates of primary cooking energy for the total, urban and rural population for a given year are obtained separately using a multilevel model (Bonjour et al., 2013)[1]. This is done at the country level. Estimates of fuel use are derived from WHO household survey data from ~800 nationally representative survey and censuses, including Demographic and Health Surveys (DHS) and Living Standards Measurement Surveys (LSMS), Multi- Cluster Surveys (MICS), the World Health Survey (WHS), and others. For cooking fuels, coverage of 157 countries is available through the WHO Global Household Energy Database. For lighting fuels, the WHO database includes data for 76 countries. For heating fuels, the WHO database includes data for 16 countries. Time series: Caveats Future Form of From 1980 to 2014 The indicator is based on the main type of fuel and technology used for cooking as cooking occupies the largest share of overall household energy needs. However, this will not reflect household fuel use activities when multiple fuels are used through the day or year. There is also a lack of data on the type of fuel and technologies used for home heating and lighting. An ideal indicator going forward be further details on the fuel mix used by households for different demands (heating, cooling, cooking, hot water, lighting and other plug loads) for a range of income groupings within the country. The pressures of interest are the GHG and air pollution emissions that contribute to climate change and health outcomes, but also the increased access to energy use, which has broader socio-economic benefits. Working group Sub- Methods 3. Mitigation Actions and Health Co-Benefits 3.5 Exposure to ambient air pollution Exposure to air pollution in cities This indicator measures urban background annual average concentration of fine particulate (PM 2.5 ) air pollution in selected cities. Measurements are 57
59 Data from monitoring stations located in urban background, residential, commercial, and mixed areas. Data on annual average concentration of fine particulate (PM 2.5 ) air pollution in urban areas was compiled from the latest version of the WHO s Urban Ambient Air Pollution Database (2016 update). The database assembled air pollution data from public data sources including national/subnational reports and websites, regional networks, agencies (e.g. UN), and academic publications. The database contains estimated annual mean PM 10 and PM 2.5 concentrations in almost 3,000 cities in 103 countries covering the period 2008 to The cities included in this indicator are 143 cities from the Sustainable Healthy Urban Environments (SHUE) database for which there was an air pollution estimate in the WHO data. SHUE is an initiative, funded by the Wellcome Trust, to support policy development in areas relating to environmental and health challenges and opportunities in cities. It aims to test the feasibility and methods of assembling data about the characteristics of a globally distributed sample of cities, and the populations within them, for comparative analyses, and to use such data to assess how policies may contribute to sustainable urban development and human health. Data on city-level GDP for SHUE cities were compiled from various sources, including the Brookings Institute, Organisation for Economic Co-operation and Development (OECD), and World Bank. Where city-level data was unavailable, regional or national data was used. Caveats Data covers urban areas only (cities with >100,000 population). Variations in the number of monitoring stations used in each city and their locations could influence levels. There is poor coverage in some regions (esp. Africa). Updating of the database is sporadic. Future development of indicator Data are not specifically a measure of the health co-benefits of climate action (see below). An ideal indicator would provide a marker of benefits for air quality and/or health that are directly attributable to climate change mitigation action (the WHO data represent only the levels of air pollution to which urban populations are currently exposed). Working group Sub- Methods 3. Mitigation Actions and Health Co-Benefits 3.5 Exposure to ambient air pollution Sectoral contributions to air pollution This indicator quantifies contributions of each portion of the energy sector to key types of primary air pollution including sulfur dioxide (SO 2 ), nitrogen oxides (NO x ), particulate matter (PM 2.5 ), carbon monoxide (CO), volatile organic compounds (VOCs), and ammonia (NH 3 ). 58
60 Data Data and figures are from the International Energy Agency (IEA), which used data from the International Institute for Applied Systems Analysis (IIASA) as collected for their Greenhouse Gas and Air Pollution Interactions and Synergies (GAINS) model. Caveats This indicator focuses specifically on the links between the energy sector and primary air pollution production, with data, analysis and projections in the report including energy production, transformation and use (i.e. the entire energy value chain, from extraction to final use). This coverage includes both combustion and non-combustion emissions (e.g. process emissions in industry, non-tailpipe emissions in transport) Data are broadly only specific to countries/regions (United States, Latin America, European Union, Middle East Africa, Russia, China, India, Southeast Asia) Updating of the data outputs is sporadic the IEA publication was a special report and not a routine publication. Future development of indicator Data are not specifically a measure of the health co-benefits of climate action (see below). An ideal indicator would directly map sources of primary air pollution to exposures and attributable health impacts on a country-level or more granularly. Furthermore, it would disaggregate air pollution sources by type (e.g. coal-fired power plant, cars) and include sources outside of the energy sector. In turn, it would be able to quantify the co-impacts on air quality and human health directly resulting from climate change mitigation efforts both in and outside of the energy sector. Working group Sub- Methods Data 3. Mitigation Actions and Health Co-Benefits 3.5 Exposure to ambient air pollution Premature mortality from ambient air pollution This indicator quantifies contributions of individual source sectors to ambient PM 2.5 exposure and its health impacts. Estimates of sectoral source contributions to annual mean exposure to ambient PM 2.5 were calculated using the GAINS model (Amann et al., 2011), which combines bottom-up emission calculations with atmospheric chemistry and dispersion coefficients. Atmospheric transfer coefficients are based on full year simulations with the EMEP Chemistry Transport Model (Simpson et al. 2012) at resolution using meteorology of 2015 and include a downscaling to capture sub-grid urban concentration gradients. Calculated ambient PM 2.5 concentrations have been validated against in-situ observations from the latest version of the WHO s Urban Ambient Air Pollution Database (2016 update), and other sources where available (e.g. Chinese statistical yearbook). Premature deaths from total ambient PM 2.5 are calculated using the methodology of the WHO (2016) assessment on the burden of disease from ambient air pollution, which relies on integrated exposure response relationships (IERs) developed within the Global Burden of Disease
61 study (Forouzanfar et al., 2015). Disease and age specific baseline mortality rates are taken from the GBD Results database ( Attribution of estimated premature deaths from AAP to polluting sectors was done proportional to the contributions of individual sectors to population-weighted mean PM 2.5 in each country. Caveats The indicator relies on model calculations which are currently available for a limited set of countries (Europe, South Asia, East Asia) uncertainty in the shape of integrated exposure-response relationships (IERs) make the quantification of health burden inherently uncertain Future development of indicator The non-linearity of the IERs used complicates the translation between the mortality burden attributed to an individual source, which is calculated proportional to the source contribution to ambient PM 2.5, and the effect of mitigating this source. While a reduction of emissions would lead to a (roughly) proportional reduction of ambient PM 2.5, this would not result in a proportional reduction of the health burden. In highly polluted environments, the health benefits of a marginal reduction of emissions would be disproportionately smaller than the relative change in concentrations. An ideal indicator would provide a marker of benefits for air quality and/or health that are directly attributable to climate change mitigation action, which requires scenario analysis. Going beyond a sectoral split, a more explicit quantification of effects of fossil-fuel versus non-fossil fuel based activities should be undertaken. The spatial coverage should be expanded to global coverage, and other health indicators than premature deaths should be included for a more complete assessment of the health burden, particularly Years of Life Lost (YLLs) and Years Lived with Disability (YLDs). Working Group Methods Data 3. Mitigation Actions and Health Co-Benefits 3.6. Clean fuel use for transport Fuel use data (by fuel type) from the IEA datasets are divided by corresponding population statistics from the World Bank. International Energy Agency (2015): World Energy Balances: Extended Energy Balances, (Data downloaded: 15 October 2015). UK Data Service, DOI: and World Bank, World Development s, Version: 27 April The IEA dataset contains annual time series data for over the 30 OECD Member countries and 105 non-oecd countries world-wide. In OECD Member Countries, data are collected by official bodies (most often the national statistics office in each country) from firms, government agencies and industry organisations and are then reported to the IEA using questionnaires to ensure international comparability. In non-oecd countries the data are collected directly from government and industry 60
62 contacts and from national publications. Caveats Future Form of The World Bank dataset is updated quarterly and contains data compiled from officially-recognized international sources including the (1) United Nations Population Division. World Population Prospects, (2) census reports and other statistical publications from national statistical offices, (3) Eurostat: Demographic Statistics, (4) United Nations Statistical Division. Population and Vital Statistics Report, (5) U.S. Census Bureau: International Database, and (6) Secretariat of the Pacific Community: Statistics and Demography Programme. It includes national, regional and global estimates. This indicator does not explicitly quantify the impact associated with transitioning to transport fuels that are less polluting, though it does provide trends that can be used as a proxy. It also cannot, at this time, be disaggregated to the urban level. An ideal indicator would capture the direct health impacts of the use of transport fuels, with country- and urban-level specificity within the global coverage. In turn, the co-benefits of transitioning to less-polluting fuels would be quantified directly in terms of reduced exposures to air pollution and their corresponding health impact. Working group Methods Data 3. Mitigation Actions and Health Co-Benefits 3.7. Sustainable travel infrastructure and uptake This indicator measures the proportion of journeys by travel mode (private transport, public transport, walking and cycling) in selected cities. An additional figure examines trends in modal share over time. T This indicator compiles data from an initial scoping of published proportions from travel surveys and census data. Data on modal share in select cities was collated in LTA Academy (2014) Passenger Transport in World Cities. Journeys. Original data sources are: Tokyo: Tokyo Metropolitan Area Travel Survey 2008 (in Japanese only, 東京都市圏パーソントリップ調査 ( 交通実態調査 ) 平成 20 年, Japan) Osaka: Osaka 5th Travel Survey Report 2012 (in Japanese, 平成 22 年第 5 回近畿圏パーソントリップ調査集計結果から ) Paris: Travel survey report (in French, La mobilité des Français, panorama issu de l enquête nationale transports et déplacements 2008) Vienna: Vienna Wiener Linien Facts and Figures 2013 Dehli: RITES Transport Demand Forecast Study for Dept. of Transport, GNCTD, 2010 Shanghai: Shanghai Construction and Transport Commission 2009 Sao Paulo: San Paulo Household Mobility Survey 2012 Main Result (in Portuguese, PESQUISA DE MOBILIDADE DA REGIÃO METROPOLITANA DE SÃO PAULO, PRINCIPAIS RESULTADOS PESQUISA DOMICILIAR, DEZEMBRO 61
63 DE 2013) Berlin: Berlin Mobility in the City 2013 Bogota: National Administrative Department of Statistics DANE Demand for transportation in Bogota 2010 (in Spanish, Cámara de Comercio de Bogotá Observatorio de Movilidad) Singapore: Household Interview Travel Survey 2012 Prague: Prague Transportation Yearbook 2013, Prague London: London Travel Demand Survey (LTDS) 2013, Transport for London Bangalore: Bangalore Mobility s ( ) Study Draft Final Report New York: New York State 2009 NHTS Comparison Report Stockholm: Facts about SL and the metropolitan area in 2012 Taipei: Travel Survey 2013 ( in Chinese, 102 年民眾日常使用運具 狀況調查 ) Ahmedabad: Indian Cities Transport s Chicago: Chicago Regional Household Travel Inventory: Mode Choice and Trip Purpose for the 2008 and 1990 Surveys, Chicago Metropolitan Agency for Planning Melbourne: Victorian Integrated Survey of Travel and Activity 2007 Caveats Data on trends in modal share comes from: Berlin: Institute for Mobility Research (2016) Mobility trends in cutting edge cities London: Transport for London (2016) Travel in London Report 9 Sydney: NSW Department of Transport (1996) Public transport travel patterns in the greater Sydney Metropolitan area ; NSW Department of Transport (2003) Household Travel Survey Summary Report 2002; NSW Department of Transport (2009) Household Travel Survey Summary Report 2007; NSW Department of Transport (2017) Key Transport s- How do people travel Tokyo: Institute for Mobility Research (2016) Mobility trends in cutting edge cities Vancouver: Translink (2012) 2011 Metro Vancouver Regional Trip Diary Survey Briefing Paper #1 Santiago: Institute for Mobility Research (2016) Mobility trends in cutting edge cities; Dictuc S.A. (1992) Estudio Encuesta origen destino de viajes del Gran Santiago, 1991 This indicator provides information on sustainable travel uptake using available data on the proportion of all journeys in world cities made by private transport, public transport, walking and cycling. Both single year estimates of modal share and trends in modal share have a number of 62
64 Future development of indicator caveats. Data on modal share in cities: The data presented in this indicator include the most recent data available for a particular city. Transport surveys in different cities and countries have different methods, which may limit comparability. Transport surveys also tend to undercount short trips (particularly those made by foot), with the amount of bias likely to vary between surveys. Data on modal share classifies journeys by the main mode of travel. The main mode of travel is typically the mode that covers the most distance. This way of classifying journeys misses some sustainable travel that takes place as part of longer journeys with multiple stages. For instance, driving to a public transport station near the edge of the city and continuing the journey by public transport. Data does not take into account distance travelled Data on trends in modal share has the additional caveat: The methodology of transport surveys changes over time, which may limit comparability even within one city. The data currently included in this indicator come from an initial scoping of available data. An ideal indicator would include data from a systematic search of travel data in all selected cities and countries. This may involve contacting survey teams in different countries to provide estimates or access to the desired data. To more fully capture sustainable uptake a future indicator could collate data on the proportion of total distance travelled made by different modes of transport. Other data on sustainable travel infrastructure, for instance, the presence of cycle schemes would be useful. Working group Methods Data Caveats 3. Mitigation Actions and Health Co-Benefits 3.8. Ruminant meat for human consumption Total amount of ruminant meat available for consumption (kg/capita/year) and proportion of energy available from ruminant meat for human consumption (%) compared to all sources of energy, aggregated by WHO region from country-specific data over Data comes from UN Food and Agriculture Organization (FAO) Food Balance Sheets. The country-specific data was compiled by the statistics division of the FAO from the national supply and utilization accounts of primary foods and processed commodities, adding food imports, subtracting food exports, food fed to animals, and waste/losses (assumed as 10%), adjusting for changes in food stocks, and dividing country population (mostly mid-year population estimates). All sources of data have some notable limitations. Estimates from each country use different calculation methods and include different elements, limiting comparability. In the UK, there have been changes in the method of 63

65 estimating emissions over time. Although we used the amount and proportion of energy from ruminant meat as a proxy indicator for food groups with some of the highest levels of GHG emissions, it is important to note that emissions are also high for other food groups, especially from other meat and dairy products. The graphs below show the proportion of energy available from animal products and the proportion of protein available from animal products. The proportion of energy available from animal products is highest in the Americas, where trends suggest a slight increase, and Europe, where trends suggest a slight decrease. Proportions are notably low in South East Asia. Trends suggest proportion of energy from animal products is increasing most rapidly in the Western Pacific with slower increases apparent in the Eastern Mediterranean and South East Asia. The proportion of protein avaialbe from animal products follows similar trends to the proportion of energy from animal products: highest in the Americas and Europe, lowest in South East Asia, and growing most rapidly in the Western Pacific. These measures on animal product availability may be useful for tracking progress on shifting away from animal intensive products to more a more plant based diets. However, since the evidence relating consumption of non-red meat and dairy products to adverse health outcomes is currently less clear than for consumption of red meat, we did not include any measure of animal product availability in the core indicators. 64

66 Future development of indicator An ideal method for tracking progress would use a set of indicators reflecting climate and health progress at each level of the DPSEEA framework. For the development of such indicators, considerable effort is required in terms of systematic data collection (e.g. emission and actual food intake data) and methodological developments for context-sensitive data collection, monitoring, and definition of targets for sustainable food production and consumption, particularly in terms of GHG-intensity and health impact. Working group Methods Data source Caveats 3. Mitigation Actions and Health Co-Benefits 3.9. Healthcare sector emissions This indicator collects data on the MtCO2e attributable to the health care sector from published reports. Data from the UK comes from published reports from the Sustainable Development Unit (NHS). Estimates of GHG emissions include emissions from building energy use, travel to and from sites, and goods and services purchased from the health care sector. Data from the US comes from an article by Eckelman & Sherman (2016) [3]. Estimates are modelled using data on health care expenditures. Data from Australia comes from a published report from the Department of Health in Victoria. Estimates take into account GHG associated with products and food purchased by one municipality (Southern Health), waste, and transportation. To extrapolate to the whole Victorian Health system estimates from Southern Health were scaled up to all of Victoria using separations (as a measure of activity) and floor area. All sources of data have some notable limitations. Estimates from each country use different calculation methods and include different elements, limiting comparability. In the UK, there have been changes in the method of estimating emissions over time. Finally, the indicator does not adjust for 65
67 The future (ideal) indicators the size (or changes in the size) of the health care system. A future set of indicators would reflect country-wide GHG emissions of health care systems with denominators of the system size and volume of health care service provision. s should be available at each level of policy and managerial decision-making to inform choices and facilitate selection of policies and organizational operations with lowest GHG emission levels. Additionally, efficiency of health care system performance in relation to climate change can be evaluated by modelling global health risks attributed to the GHG emissions of each health care system as a proportion of their contribution to the health of the population. Mitigation strategies could be designed in collaboration with relevant sectors, such as the insurance sector or health care commissioners and providers. References [1] Rehfuess, E.A., Mishra, V., Smith, K.R., Solid Fuel Use for Household Cooking: Country and Regional Estimates for Environ. Health Perspect. 121, doi: /ehp [2] Hawkesworth S, Dangour AD, Johnston D, Lock K, Poole N, Rushton J, et al. Feeding the world healthily: the challenge of measuring the effects of agriculture on health. Philos Trans R Soc B Biol Sci 2010;365: doi: /rstb [3] Eckelman MJ, Sherman J. Environmental impacts of the U.S. health care system and effects on public health. PLoS One 2016;11:1 14. doi: /journal.pone
68 DPSEEA framework - adapted for processes that produce health-co-benefits of climate change mitigation Framework Explanation examples purpose A: Level of action 67
69 elements D: Driving force mediators P: Pressure mediators S: State mediators E: Exposure mediators E: Effect Key macro-scale factors driving processes that lead to GHG emissions and consequences for human health, i.e., root causes of the problems Factors determining the extent to which driving forces are translated into pressures Rate of specific activities (often part of production, consumption), which exert unfavourable pressure on natural social and human environment Intensity of the pressure exerted by specific activities and permeability of the environmental media to these pressures Extent to which the atmosphere, natural social and human environment (e.g., infrastructure) and behaviour, are changed as a result of the exerted pressures People s activities, behaviour patterns The extent of the change in the state of the environment that humans come into with in such manner that it can affect their physiological or mental functioning (health) Individual susceptibility Attributable human health and wellbeing outcomes Population growth rate, GDP per capita and growth rate, annual energy consumption levels Policy context, social attitudes, economic infrastructure Domestic consumption of gas, coal, etc., road traffic volume and density, source-specific GHG emissions, meat production GHG-intensity of electricity supply, vehicle pollution-intensity, pollution control strategies, resilience of the environment GHG concentration in the atmosphere, pollution levels, food environments and typical diets Time spent indoors/outdoors, actual food consumption External exposure, absorbed dose, target organ dose Baseline health status, genetic make-up, sex Attributable morbidity and mortality specification Overall Sectorspecific and overall Sectorspecific Sectorspecific Sectorspecific Macro-level progress relevant to climate change and health Sustainability of human activities Early warning with short lead-times Exposure level assessment Impact evaluation Macro-level policies (trade, fiscal, energy, agricultural policy) Sector-specific policies regulating relevant activities Immediate responseaction by local government authorities and individuals Exposure mitigation, therapeutic treatment provision Individual-level medication Preventative curative 68

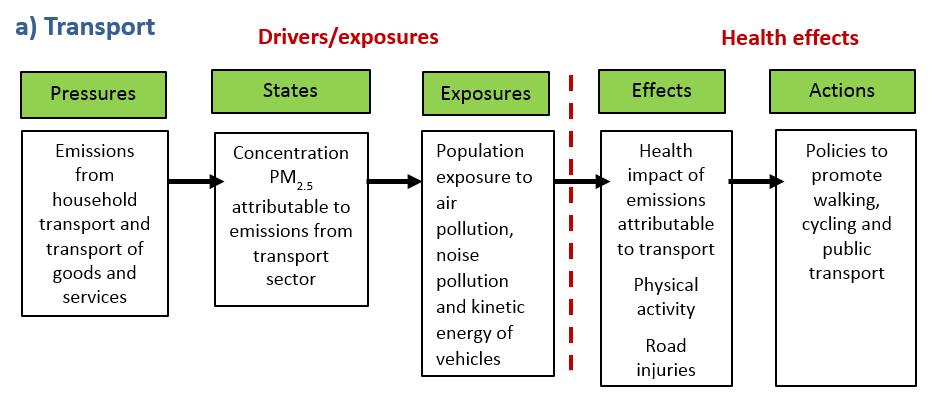
70 DPSEEA Framework applied to Energy Sector DPSEEA Framework applied to Transport Sector DPSEEA Framework applied to Food Sector 69

71 DPSEEA Framework applied to Health Sector 70
72 Appendix 5 Economics and Finance Working Group Methods 4. Economics and Finance 4.1. Investments in Zero-Carbon Energy and Energy Efficiency The data for this indicator are sourced from the annual IEA World Energy Investment publication. Four categories of investment are defined: Renewables & Nuclear investment in all renewable and nuclear electricity generation, and renewable transport and heating (including biofuels and solar thermal heating) Energy Efficiency See below. Electricity Networks investment in electricity transmission and distribution infrastructure. Fossil Fuels including oil, gas and coal, upstream mining, drilling and pipeline infrastructure, and coal, gas and oil power and other energy generation capacity. For most sectors, investment is defined as overnight capital expenditures on new assets. For some sectors, such as power generation, this investment is attributed to the year in which a new plant or the upgrade of an existing one becomes operational. For other sources, such as upstream oil and gas and LNG projects, where sufficient data are available, investment reflects the capital spending incurred over time as production from a new source ramps up to maintain output from an existing asset. For energy efficiency, investment is defined as incremental spending by companies, governments and individuals to acquire equipment that consumes less energy than that which they would otherwise have bought. Other areas of expenditure, including operation and maintenance, research and development, financing costs, mergers and acquisitions or public markets transactions, are not included. Investment estimates are derived from IEA data for energy demand, supply and trade, and estimates of unit capacity costs, For more information, see IEA (2016 i,2017 ii ). Here, renewables and nuclear includes investment in all renewable and nuclear electricity generation capacity, and renewable transport and heating (including biofuels and solar thermal heating). Electricity networks includes investment in electricity transmission and distribution infrastructure. Investment in fossil fuels includes upstream mining, drilling and pipeline infrastructure for oil, gas and coal, and power and other energy generation capacity for the use of these fuels. For these categories, investment is defined as overnight capital expenditures on new assets. For energy efficiency, investment is defined as incremental spending by companies, governments and individuals to acquire equipment that consumes less energy than that which they would otherwise have bought. Data 71
73 Values presented below are in US$2016, billion. Caveats Future Form of Renewables & Nuclear $ Energy Efficiency $ Electricity Networks $ Fossil Fuels $ Total $1,827 $1,675 See Methods It is not envisaged that the form of this indicator will change over time. Working Group 4. Economics and Finance 4.2. Investments in Coal Capacity Methods See indicator 4.1 Data Index (100 = 2006) Caveats See indicator 4.1 Future Form of It is not envisaged that the form of this indicator will change over time. Working Group Methods 4. Economics and Finance 4.3. Funds Divested from Fossil Fuels The data for this indicator are collected and provided by 350.org. iii They represent the total assets (or assets under management, AUM) for institutions that have publicly committed to divest in 2016 (for which data is available), with non-us$ values converted using the market exchange rate when the commitment was made, and thus do not directly represent the actual sums divested from fossil fuel companies. A company is committed to divestment if it falls into any of the following five categories: - Fossil Free - An institution or corporation that does not have any investments (direct ownership, shares, commingled mutual funds containing shares, corporate bonds) in fossil fuel companies (coal, oil, natural gas) and committed to avoid any fossil fuel investments in the future - Full - An institution or corporation that made a binding commitment to divest (direct ownership, shares, commingled mutual funds containing 72
74 shares, corporate bonds) from any fossil fuel company (coal, oil, natural gas). - Partial - An institution or corporation that made a binding commitment to divest across asset classes from some fossil fuel companies (coal, oil, natural gas), or to divest from all fossil fuel companies (coal, oil, natural gas), but only in specific asset classes (e.g. direct investments, domestic equity). - Coal and Tar Sands - An institution or corporation that made a binding commitment to divest (direct ownership, shares, commingled mutual funds containing shares, corporate bonds) from any coal and tar sands companies. Data Caveats Future Form of Additional Information - Coal only - An institution or corporation that made a binding commitment to divest (direct ownership, shares, commingled mutual funds containing shares, corporate bonds) from any coal companies. Due to confidentiality issue, the full dataset is not available for publication. However, interested readers may visit the 350.org website for further information. I See Methods. The ideal future form of this indicator would have two elements. The first element would track the value of institutional investments in fossil fuels assets, both in absolute terms and as a proportion of their total portfolios. This would also allow for tracking of associated funds that are moved out of fossil fuels, but are not explicitly advertised as divesting. However, such data is unlikely to be available. As such, an indicator that aligns with the data compiled by Bouvet, L and Kirjanas, P. (2017) iv will be investigated. The second element of this indicator would more explicitly track the value of funds divested from fossil fuels by healthcare institutions. The data provided for the indicator in this paper may be improved upon through, for example, the issuance of annual surveys either as part of other data collection efforts from healthcare institutions, or independently. The feasibility of each option will be investigated for future publications. Just 17 organisations recorded as committed to divestment above are forprofit corporations (however, these account for $3.16 trillion (58%) of the total asset value presented above). Pension funds and other institutional investors (for example, insurance companies), which in 2013 held assets under management worth $93 trillion in the OECD alone (larger than the sum of global economic output in that year - $76.8 trillion), also account for a small proportion of the organisations committed to divestment (12% at the end of 2016). 232,233 Institutional investors are substantial investors in fossil fuel companies, due to the historically sizable, yet stable returns generated. Policy makers are increasingly keen to encourage (or require) institutional investors to properly assess and disclose their exposure to climate-related risk. In December 2015, the Financial Stability Board established the Task Force on Climate-Related Finance Disclosures, with the aim of developing financial risk assessment and disclosure approaches related to the physical, liability and transition risks associated with climate change. In June 2017, the Task Force published their final report on recommendations to achieve this objective. 234,235 In January 2017, the European Union (EU) introduced 73
75 the recast IORP ( Institutions for occupational retirement provision ) Directive, which states that IORPs (pension funds) as part of their risk management system should include risks related to climate change [and] to the depreciation of assets due to regulatory change ( stranded assets ). 236 Working Group Methods 4. Economics and Finance 4.4. Economic Losses due to Climate-Related Events Munch Re NatCatSERVICE provided the data for this indicator. The NatCatSERVICE is a global database of natural catastrophe ( nat cat ) data. Munich Re has been systematically recording information on natural catastrophe loss events from around the world since This has developed into one of the world s most comprehensive databases for information on natural catastrophe loss events. Data suitable for systematic and analytical evaluation on a worldwide scale are available from 1980 onwards. For this paper, a base year of 1990 was chosen in order to align with the base year against which GHG emission reduction targets are commonly set. NatCatSERVICE collect a range of information for around 1,200 events each year. For this paper, aside from descriptive and locational information, only data on direct economic loss (physical/tangible losses, expressed in US$2016), insured losses (all paid-out insured physical/tangible losses) and fatalities are used. Please refer to the online NatCatSERVICE Methodology document, which may be found online ( The Table below illustrates the peril classification provided by NatCatSERVICE. Perils classified as Meteorological, Hydrological and Climatological have been included in the analysis. Geophysical perils are excluded, due to their general independence from climate change. Family Main Event Sub-Peril Geophysical Meteorological Hydrological Earthquake Volcanic Eruption Mass Movement (Dry) Tropical Storm Extra-Tropical Storm Convective Storm Local Windstorm Flood Mass Movement (Wet) Earthquake (ground shaking) Fire Following Tsunami Volcanic Eruption Ash Cloud Subsidence Rockfall Landslide (Dry) Winter Storm (extra-tropical cyclone) Hail Storm Lightning Tornado Local Windstorm Sand/dust storm Blizzard/Snowstorm Storm Surge General Flood Flash Flood Glacial Lake Outburst 74
76 Climatological Extreme Temperature Drought Wildfire Subsidence Avalanche Landslide (Wet) Heat Wave Cold Wave/Frost Extreme Winter Conditions Wildfire Drought Each natural catastrophe event recorded is assigned a direct economic loss, and where applicable, an insured loss, expressed in nominal US$ values. Where these are available, data are taken from official institutions, but where not, estimates are calculated. The process for estimation calculation depends on what data is available. For example, if loss estimates from insurance market data is available, this data may be combined with data on insurance penetration and other eventspecific information to estimate total economic losses. If only low-quality information is available, such as a description of the number of homes damaged or destroyed, assumptions on value and costs are made. Loss values are presented in US$, or if initially expressed in local currency, converted to US$ using the market exchange rates at the end of the month when the event occurred. Values are converted to US$2016 using country-specific Consume Price Indices (CPI). Once the data was received from the NatCatSERVICE, further analysis was undertaken. Firstly, each country was assigned to its income group as defined by the World Bank. Secondly, to allow intensity calculations as illustrated in Figure 2, economic losses (insured and uninsured) were divided by annual GDP values for each income grouping, sourced from the World Bank Database and deflated to US$2016 using data sourced from the US Department of Commerce Bureau of Economic Analysis. v 2016 data for GDP is estimated by multiplying the 2015 value by the average annual the growth rate from the previous 5 years. Fatality data were divided by the relevant annual population of each income grouping, also sourced from the World Bank Database (with 2016 data estimated using same approach as for GDP). Values presented in the paper text are rounded to the nearest Data Low Income Lower- Middle Upper- Middle High Income Low Income Lower- Middle Upper- Middle Number of Events Total Fatalities Overall Losses US$m (adjusted to 2016 values based on Country CPI) Insured Losses US$m (adjusted to 2016 values based on Country CPI) Insured Losses/$1000 GDP (US$2016) Uninsured Losses/$1000 GDP (US$2016) Fatalities/Million Population $219 $0 $0.00 $ ,244 $3,777 $0 $0.00 $ ,064 $8,660 $126 $0.03 $ ,013 $52,929 $22,696 $0.72 $ ,769 $417 $0 $0.00 $ ,998 $10,652 $357 $0.26 $ ,826 $20,712 $1,005 $0.21 $
77 High Income $44,147 $20,693 $0.65 $ Low Income 8 1,055 $513 $0 $0.00 $ Lower- Middle 86 6,438 $6,660 $0 $0.00 $ Upper- Middle 109 2,332 $14,769 $37 $0.01 $ High Income $88,707 $45,412 $1.34 $ Low Income 24 1,858 $678 $0 $0.00 $ Lower- Middle 118 6,040 $20,940 $0 $0.00 $ Upper- Middle 151 4,051 $20,813 $163 $0.03 $ High Income 203 1,142 $67,250 $17,375 $0.52 $ Low Income 24 1,933 $221 $0 $0.00 $ Lower- Middle 106 5,004 $4,501 $0 $0.00 $ Upper- Middle 125 3,385 $23,341 $208 $0.04 $ High Income $39,474 $10,976 $0.31 $ Low Income $23,702 $0 $0.00 $ Lower- Middle 104 5,864 $4,974 $97 $0.06 $ Upper- Middle 136 4,044 $19,923 $802 $0.14 $ High Income 209 1,349 $42,864 $20,103 $0.53 $ Low Income $3,688 $0 $0.00 $ Lower- Middle 99 6,509 $8,211 $73 $0.04 $ Upper- Middle 141 4,086 $25,643 $654 $0.11 $ High Income $47,523 $17,882 $0.47 $ Low Income 29 2,860 $373 $0 $0.00 $ Lower- Middle 83 4,292 $5,162 $13 $0.01 $ Upper- Middle 121 3,196 $16,291 $552 $0.09 $ High Income $36,012 $7,806 $0.21 $ Low Income $517 $0 $0.00 $ Lower- Middle ,054 $31,114 $1,073 $0.66 $ Upper- Middle 125 9,197 $45,755 $1,263 $0.21 $ High Income 227 1,731 $65,158 $24,960 $0.69 $ Low Income $505 $3 $0.02 $ Lower- Middle ,148 $6,662 $221 $0.13 $ Upper- Middle 133 3,866 $26,725 $772 $0.14 $ High Income 212 1,532 $71,883 $37,429 $0.99 $ Low Income 57 1,546 $1,193 $1 $0.01 $ Lower- Middle 122 4,952 $8,896 $49 $0.03 $ Upper- Middle 136 1,919 $7,504 $87 $0.01 $ High Income $42,374 $13,942 $0.37 $ Low Income 40 1,086 $340 $0 $0.00 $ Lower- Middle 116 3,398 $2,518 $0 $0.00 $ Upper ,246 $7,541 $495 $0.08 $
78 Middle High Income Low Income Lower- Middle Upper- Middle High Income Low Income Lower- Middle Upper- Middle High Income Low Income Lower- Middle Upper- Middle High Income Low Income Lower- Middle Upper- Middle High Income Low Income Lower- Middle Upper- Middle High Income Low Income Lower- Middle Upper- Middle High Income Low Income Lower- Middle Upper- Middle High Income Low Income Lower- Middle Upper- Middle High Income Low Income Lower- Middle Upper- Middle High Income Low Income Lower- Middle $29,286 $15,168 $0.42 $ $372 $0 $0.00 $ ,118 $4,676 $552 $0.29 $ ,169 $17,996 $583 $0.10 $ $75,757 $22,684 $0.61 $ $324 $0 $0.00 $ ,802 $1,618 $0 $0.00 $ ,987 $22,792 $78 $0.01 $ ,038 $59,677 $23,084 $0.56 $ ,000 $1,083 $0 $0.00 $ ,146 $8,673 $0 $0.00 $ ,695 $28,429 $614 $0.08 $ $105,799 $53,263 $1.20 $ ,193 $985 $0 $0.00 $ ,389 $11,864 $1,242 $0.47 $ ,123 $28,810 $2,327 $0.26 $ ,447 $227,268 $114,541 $2.51 $ ,274 $509 $0 $0.00 $ ,701 $14,726 $600 $0.20 $ ,724 $15,925 $443 $0.04 $ ,926 $38,246 $18,232 $0.39 $ ,936 $980 $0 $0.00 $ ,134 $16,875 $674 $0.19 $ ,441 $27,932 $2,402 $0.19 $ ,388 $49,095 $24,703 $0.50 $ ,145 $647 $0 $0.00 $ ,552 $9,758 $1 $0.00 $ ,011 $46,260 $2,065 $0.14 $ $89,096 $45,700 $0.88 $ $791 $7 $0.02 $ ,495 $10,313 $519 $0.13 $ ,169 $13,054 $368 $0.03 $ ,176 $46,221 $23,182 $0.48 $ ,246 $498 $0 $0.00 $ ,917 $17,094 $201 $0.04 $ ,982 $43,587 $1,591 $0.09 $ $54,515 $29,614 $0.59 $ $1,038 $0 $0.00 $ ,097 $8,850 $37 $0.01 $
79 Caveats Future Form of Upper- Middle High Income Low Income Lower- Middle Upper- Middle High Income Low Income Lower- Middle Upper- Middle High Income Low Income Lower- Middle Upper- Middle High Income Low Income Lower- Middle Upper- Middle High Income Low Income Lower- Middle Upper- Middle High Income 141 3,438 $56,665 $15,240 $0.75 $ ,227 $95,613 $54,807 $1.04 $ ,409 $1,153 $0 $0.00 $ ,596 $7,026 $633 $0.11 $ ,396 $24,690 $1,005 $0.05 $ ,097 $128,763 $63,385 $1.23 $ ,014 $210 $0 $0.00 $ ,390 $19,442 $1,808 $0.31 $ ,880 $43,806 $2,881 $0.13 $ ,346 $63,286 $31,593 $0.61 $ ,472 $331 $13 $0.03 $ ,539 $14,986 $772 $0.13 $ ,415 $31,803 $1,672 $0.07 $ $49,987 $28,698 $0.56 $ ,518 $1,473 $7 $0.02 $ ,939 $15,267 $1,649 $0.28 $ ,680 $27,580 $1,083 $0.05 $ ,684 $51,650 $29,165 $0.61 $ ,864 $2,358 $25 $0.06 $ ,013 $7,552 $370 $0.06 $ ,631 $49,754 $2,628 $0.12 $ $69,753 $37,193 $0.78 $ See Method. An ideal form of this indicator would allow attribution of fatalities and economic losses to events induced by climate change. However, such attribution is unlikely to be feasible over the course of the Lancet Countdown. As such, it is not envisaged that this indicator will significantly alter. Working Group Methods 4. Economics and Finance 4.5. Employment in Low-Carbon and High-Carbon Sectors The data for this indicator is sourced from IRENA (2017) vi (renewables) and IBISWorld (2016 vii ; 2017 viii ) (fossil fuel extraction). Bioenergy includes liquid biofuels, solid biomass and biogas. Other technologies includes geothermal energy, small hydropower, concentrated solar power, municipal and industrial waste, and ocean energy. Fossil fuel extraction values include direct employment, whereas renewable energy jobs include direct and indirect employment (e.g. equipment manufacturing). 78
80 Data Million Jobs Large Hydropower Other Technologies Solar Heating/Cooling Wind Energy Bioenergy Solar Photovoltaic Fossil Fuel Extraction Caveats Future Form of The data for this indictor is sourced from IRENA (renewables) and IBIS World (fossil fuel extraction). 25,26, 27 Bioenergy includes liquid biofuels, soil biomass and biogas. Other technologies includes geothermal energy, small hydropower, concentrated solar power, municipal and industrial waste, and ocean energy. Fossil fuel extraction values include direct employment, whereas renewable energy jobs include direct and indirect employment (e.g. equipment manufacturing). Fossil fuel extraction values include direct employment, whereas renewable energy jobs include direct and indirect employment (e.g. equipment manufacturing). An ideal future form of this indicator would track both direct and indirect employment from the renewables and fossil fuel extraction industries, along with the geographical distribution in their change over time. This would allow for an assessment of substitution. However, at present such data is unavailable, and impractical to collect for the purposes of the Lancet Countdown alone. Working Group Methods Data 4. Economics and Finance 4.6. Fossil Fuel Subsidies The data for this indicator are taken from the International Energy Agency (IEA), and is calculated using the price-gap approach, for 42 mostly non- OECD countries (see data below). The price-gap approach is the most commonly applied methodology for quantifying consumption subsidies. It compares average end-user prices paid by consumers with reference prices that correspond to the full cost of supply. The price gap is the amount by which an end-use price falls short of the reference price and its existence indicates the presence of a subsidy. Prices are converted to US2016 using data sourced from the US Department of Commerce Bureau of Economic Analysis. v To view the original data, a full description of the price-gap approach and the data employed to calculate it, please see IEA (2017) ix IEA Data (US$2016) Country Product Oil $12,926 $11,251 $10,970 $9,409 Algeria Electricity $2,606 $2,408 $2,393 $2,676 Natural $4,274 $3,017 $2,549 $2,326 79
81 Angola Argentina Azerbaijan Bahrain Bangladesh Bolivia Brunei China Chinese Taipei Gas Coal $0 $0 $0 $0 Total $19,910 $16,676 $15,912 $14,411 Oil $1,772 $1,520 $1,778 $208 Electricity $417 $354 $174 $233 Natural Gas $0 $0 $0 $0 Coal $0 $0 $0 $0 Total $2,189 $1,874 $1,952 $441 Oil $1,042 $1,308 $2,358 $1,586 Electricity $4,795 $6,162 $7,272 $5,494 Natural Gas $4,378 $5,415 $5,041 $3,541 Coal $0 $0 $0 $0 Total $10,215 $12,885 $14,671 $10,621 Oil $938 $816 $215 $30 Electricity $625 $504 $361 $533 Natural Gas $938 $705 $478 $495 Coal $0 $0 $0 $0 Total $2,502 $2,025 $1,054 $1,058 Oil $938 $759 $712 $455 Electricity $1,564 $1,443 $1,305 $1,238 Natural Gas $0 $0 $0 $0 Coal $0 $0 $0 $0 Total $2,397 $2,203 $2,016 $1,694 Oil $938 $645 $247 $252 Electricity $4,378 $1,909 $961 $587 Natural Gas $3,544 $2,692 $2,071 $1,701 Coal $0 $0 $0 $0 Total $8,965 $5,246 $3,278 $2,541 Oil $1,251 $1,637 $1,525 $1,160 Electricity $104 $181 $156 $67 Natural Gas $208 $230 $175 $118 Coal $0 $0 $0 $0 Total $1,564 $2,047 $1,856 $1,345 Oil $417 $255 $236 $165 Electricity $104 $40 $21 $16 Natural Gas $0 $0 $0 $0 Coal $0 $0 $0 $0 Total $521 $296 $257 $181 Oil $17,199 $12,702 $12,613 $12,354 Electricity $13,655 $14,765 $11,357 $7,167 Natural Gas $1,251 $2,015 $2,680 $0 Coal $0 $0 $0 $0 Total $32,001 $29,482 $26,650 $19,521 Oil $104 $325 $162 $0 Electricity $0 $75 $0 $0 Natural Gas $0 $0 $0 $0 80
82 Colombia Ecuador Egypt El Salvador Gabon Ghana India Indonesia Iraq Coal $0 $106 $0 $0 Total $104 $506 $162 $3 Oil $6,567 $1 $0 $0 Electricity $313 $0 $0 $0 Natural Gas $0 $0 $0 $0 Coal $0 $0 $0 $0 Total $6,880 $1 $0 $0 Oil $22,724 $5,739 $5,019 $2,270 Electricity $6,776 $577 $541 $0 Natural Gas $2,085 $0 $0 $6 Coal $0 $0 $0 $0 Total $31,480 $6,316 $5,560 $2,276 Oil $104 $21,061 $17,221 $8,604 Electricity $417 $7,109 $5,596 $4,816 Natural Gas $0 $2,641 $1,749 $234 Coal $0 $0 $0 $0 Total $521 $30,811 $24,565 $13,654 Oil $0 $1 $2 $4 Electricity $0 $526 $457 $238 Natural Gas $0 $0 $0 $0 Coal $0 $0 $0 $0 Total $0 $528 $459 $242 Oil $0 $53 $47 $152 Electricity $0 $6 $0 $0 Natural Gas $0 $0 $1 $1 Coal $0 $0 $0 $0 Total $0 $59 $47 $153 Oil $41,070 $56 $40 $16 Electricity $3,336 $0 $0 $0 Natural Gas $2,814 $0 $0 $0 Coal $0 $0 $0 $0 Total $47,220 $56 $40 $16 Oil $23,975 $36,104 $28,015 $14,699 Electricity $5,942 $5,377 $3,432 $2,520 Natural Gas $0 $4,257 $4,614 $2,277 Coal $0 $0 $0 $0 Total $29,917 $45,737 $36,061 $19,496 Oil $15,219 $19,986 $19,904 $9,205 Electricity $2,085 $8,713 $13,433 $6,335 Natural Gas $104 $0 $0 $0 Coal $0 $0 $0 $0 Total $17,408 $28,698 $33,337 $15,540 Oil $24,705 $9,423 $7,815 $3,818 Electricity $11,154 $1,730 $1,428 $1,807 Natural Gas $20,327 $83 $70 $385 Coal $0 $0 $0 $0 81
83 Iran Kazakhstan Korea Kuwait Libya Malaysia Mexico Nigeria Oman Total $56,185 $11,235 $9,313 $6,009 Oil $1,668 $30,851 $38,073 $21,217 Electricity $2,293 $11,134 $14,766 $13,756 Natural Gas $730 $18,565 $21,168 $18,202 Coal $2,606 $0 $0 $0 Total $7,297 $60,550 $74,008 $53,174 Oil $0 $1,631 $2,060 $842 Electricity $0 $490 $403 $612 Natural Gas $0 $508 $406 $676 Coal $208 $1,580 $1,371 $1,079 Total $208 $4,209 $4,241 $3,209 Oil $4,170 $0 $0 $0 Electricity $3,857 $0 $0 $0 Natural Gas $1,876 $0 $0 $0 Coal $0 $190 $192 $117 Total $9,903 $190 $192 $117 Oil $5,212 $2,732 $2,496 $1,458 Electricity $938 $2,880 $2,793 $3,734 Natural Gas $104 $1,120 $931 $919 Coal $0 $0 $0 $0 Total $6,254 $6,731 $6,221 $6,111 Oil $5,733 $5,994 $6,166 $3,726 Electricity $208 $820 $702 $519 Natural Gas $1,042 $82 $74 $10 Coal $0 $0 $0 $0 Total $6,984 $6,896 $6,942 $4,256 Oil $17,616 $7,146 $4,460 $1,090 Electricity $1,355 $94 $0 $0 Natural Gas $1,042 $77 $0 $0 Coal $0 $0 $0 $0 Total $19,910 $7,317 $4,460 $1,090 Oil $7,401 $8,088 $2,516 $21 Electricity $104 $6,001 $5,358 $5,459 Natural Gas $521 $1,429 $582 $581 Coal $0 $0 $0 $0 Total $8,026 $15,517 $8,457 $6,062 Oil $0 $5,059 $4,120 $2,884 Electricity $0 $214 $0 $0 Natural Gas $0 $398 $97 $49 Coal $0 $0 $0 $0 Total $0 $5,672 $4,217 $2,933 Oil $730 $0 $2,121 $89 Electricity $3,127 $0 $1,132 $0 Natural Gas $8,131 $0 $1,856 $0 Coal $0 $0 $0 $0 Total $11,987 $0 $5,109 $89 82
84 Pakistan Qatar Russia Saudi Arabia South Africa Sri Lanka Thailand Trinidad and Tobago Turkmenistan Oil $2,606 $105 $164 $118 Electricity $2,189 $2,679 $2,394 $743 Natural Gas $1,668 $6,079 $4,931 $2,630 Coal $0 $0 $0 $0 Total $6,463 $8,864 $7,489 $3,492 Oil $0 $2,596 $1,954 $944 Electricity $20,327 $1,744 $2,034 $1,506 Natural Gas $21,056 $1,373 $1,428 $971 Coal $0 $0 $0 $0 Total $41,383 $5,713 $5,416 $3,421 Oil $48,158 $0 $0 $0 Electricity $15,740 $15,569 $15,388 $15,578 Natural Gas $12,717 $15,207 $14,020 $15,202 Coal $0 $0 $0 $0 Total $76,511 $30,776 $29,408 $30,780 Oil $313 $42,070 $41,929 $29,914 Electricity $313 $12,278 $11,699 $12,653 Natural Gas $0 $8,218 $7,029 $6,794 Coal $0 $0 $0 $0 Total $625 $62,567 $60,656 $49,361 Oil $417 $0 $0 $0 Electricity $625 $0 $0 $2,628 Natural Gas $0 $0 $0 $0 Coal $208 $0 $0 $0 Total $1,251 $0 $0 $2,628 Oil $3,023 $208 $199 $58 Electricity $3,961 $86 $157 $88 Natural Gas $1,564 $0 $0 $0 Coal $834 $0 $0 $0 Total $9,382 $295 $357 $145 Oil $313 $2,193 $1,625 $719 Electricity $417 $331 $0 $0 Natural Gas $0 $637 $369 $191 Coal $0 $163 $79 $0 Total $730 $3,324 $2,073 $909 Oil $4,274 $616 $544 $365 Electricity $1,251 $496 $414 $321 Natural Gas $4,899 $0 $0 $0 Coal $0 $0 $0 $0 Total $10,424 $1,112 $958 $686 Oil $0 $2,741 $2,552 $2,204 Electricity $4,378 $913 $804 $928 Natural Gas $10,424 $3,200 $2,393 $2,439 Coal $0 $0 $0 $0 Total $14,698 $6,853 $5,750 $5,571 Ukraine Oil $4,795 $0 $0 $0 83
85 Caveats Future Form of Electricity $6,671 $2,314 $2,956 $3,194 Natural Gas $13,655 $4,225 $3,350 $3,120 Coal $0 $0 $0 $0 Total $25,122 $6,539 $6,305 $6,314 Oil $730 $5,180 $3,875 $1,181 Electricity $2,606 $3,661 $3,076 $1,993 UAE Natural Gas $10,632 $9,208 $7,949 $6,883 Coal $0 $0 $0 $0 Total $13,968 $18,049 $14,900 $10,057 Oil $18,033 $529 $458 $216 Electricity $3,544 $1,955 $1,339 $1,084 Uzbekistan Natural Gas $2,814 $7,951 $6,983 $5,248 Coal $0 $0 $0 $0 Total $24,288 $10,435 $8,780 $6,548 Oil $417 $25,985 $21,632 $14,847 Electricity $4,482 $9,567 $7,113 $3,144 Venezuela Natural Gas $730 $4,702 $3,361 $2,230 Coal $0 $0 $0 $0 Total $5,629 $40,253 $32,107 $20,221 Oil $0 $17 $0 $0 Electricity $0 $1,309 $795 $36 Vietnam Natural Gas $0 $502 $250 $175 Coal $0 $6 $3 $3 Total $0 $1,834 $1,049 $214 The data for this indicator is provided by the IEA, and calculated using the price-gap approach, for 42 mostly non-oecd countries (see Appendix 5 for further details). Fossil fuel production subsidies and consumption subsidies for most OECD countries are not included, due to the lack of consistent data. However, the vast majority of fossil fuel subsidies are consumer subsidies in non-oecd countries. In 2014, consumer subsidies in OECD countries were worth less than 14% of the non-oecd value, with producer subsidies worth around 4%. 248 As such, the indicator presented provides a broad overview of global trends in fossil fuel subsidies. An ideal future form of this indicator would have two key elements. The first element would be the consistent inclusion of production and consumption subsidies for all countries, available on an annual basis. The second element would be the use of this data, along with that of carbon pricing data (see 4.9), to create a since net carbon price indicator. The future practicality of this indicator will depend on the availability of data at the appropriate level of granularity. Working Group 4. Economics and Finance 4.7. Coverage and Strength of Carbon Pricing 84
86 Methods The World Bank provides the data for this indicator, through the interactive Carbon Pricing Dashboard. x Prices for 2016 and 2017 are those as of 1 st August 2016 and 1 st April 2017, respectively. For 2017, the indicator includes only instruments that had been introduced by 1 st April Baseline-and-credit systems are excluded from the analysis. GHG coverage data is presented as a proportion of 2012 global anthropogenic GHG emissions (53, 937 MTCO 2 e) as calculated by EDGAR (Emissions Database for Global Atmospheric Research) xi. Monetary values are presented in US$, in current prices. Data Instrument Emissions % Global Price (1 st Emissions % Global Price (1 st April Covered Emissions August Covered Emissions 2017) (MtCO 2e) Covered 2017) (MtCO 2e) Covered Alberta SGER Alberta carbon tax BC carbon tax Beijing pilot ETS California CaT Chile carbon tax Chongqing pilot ETS Colombia carbon tax Denmark carbon tax EU ETS Estonia carbon tax E E Finland carbon tax France carbon tax Fujian pilot ETS Guangdong pilot ETS Hubei pilot ETS Iceland carbon tax E E Ireland carbon tax Japan carbon tax Korea ETS Latvia carbon tax E E Liechtenstein carbon tax E E Mexico carbon tax New Zealand ETS Norway carbon tax Ontario CaT Poland carbon tax Portugal carbon tax Quebec CaT RGGI
87 Caveats Future Form of Saitama ETS Shanghai pilot ETS Shenzhen pilot ETS Slovenia carbon tax E E Sweden carbon tax Switzerland ETS Switzerland carbon tax Tianjin pilot ETS Tokyo CaT UK carbon price floor Ukraine carbon tax Instrument coverage of GHG emissions, in both absolute and proportional term, are based on total anthropogenic GHG emissions in 2012 the last year in which consistent data was available. Baseline and Credit instruments are not included due to a lack of price data. Some instruments experience an overlap in coverage. For example, the UK Carbon Price Floor applies to the power sector in the UK, which is also subject to carbon pricing under the EU ETS. Other instruments experience only partial overlap. As such, total emissions coverage is likely to be overestimated (ceteris paribus), although this effect is likely to be minor. The price used to calculate the weighted average prices are the prevailing prices on a single day. The prices for many instruments (particularly ETS instruments) are likely to alter of the course of a year, however the effect on the final value is likely to be minor. Prices are presented in current values. See 4.7. Fossil Fuel Subsidies. Working Group Methods 4. Economics and Finance 4.8. Use of Carbon Pricing Revenues Data on revenue generated is provided by the World Bank s interactive Carbon Pricing Dashboard. Error! Bookmark not defined. Data for the division into the four categories of revenue expenditure are provided largely by Carl and Fedor (2016), supplemented by external sources (as described below). The method of revenue expenditure classification is also adapted from Carl and Fedor (2016) xii. Definitions and assumptions regarding the categories as applied in this paper are as follows: Climate Change Mitigation revenues are explicitly allocated to activities or infrastructure that seeks to reduce, or enable the reduction, of greenhouse gas emissions, from any source, within or outside of the sectors or jurisdiction in which the carbon price is applied. Climate Change Adaptation as above, but for adaptation activities or infrastructure. Environmental Tax Reform (ETR) revenues are explicitly returned to some broad 86
88 portion of the population through individual or business tax rate cuts, tax eliminations, or rebates in order to achieve broad revenue neutrality. Revenue returned to directly compensate for the cost of GHG emissions (through free permit allocation or targeted assistance for energy-intensive, trade-exposed firms) are not included). General Funds revenues are explicitly used for purposes other than those described above, or the use of revenues is unspecified or information is unavailable. Only revenue that may be considered government income is included. For example, revenue generated by sale of permits issued to utilities under the Californian cap and trade instrument, which much then be used to finance discounts on household energy bills through carbon credits, are not considered, as this revenue does not pass through the State government. Instruments for which price data is not available, either due to the type of instrument or simply lack of data, are not included. Other assumptions as applied to individual instruments are described below. Data Alberta SGER Revenue (US$2016 million) Quebec CaT Switzerland ETS Fujian Pilot ETS Guangdong Pilot ETS EU ETS 4, New Zealand ETS RGGI California CaT BC Carbon Tax Switzerland Carbon Tax Denmark Carbon Tax Estonia Carbon Tax Finland Carbon Tax France Carbon Tax Ireland Carbon Tax Iceland Carbon Tax Japan Carbon Tax Lichtenstein Carbon Tax Latvia Carbon Tax , , , , Revenue Allocation Mitigation Adaptation Environmental General Tax Reform Funds (ETR) % 93.5% 2.0% 0.0% 4.5% $ $95.3 $2.0 $0.0 $4.6 % 94.4% 0.0% 0.0% 5.6% $ $317.2 $0.0 $0.0 $18.8 % 0.0% 0.0% 0.0% 100.0% $ $0.0 $0.0 $0.0 $4.0 % 0.0% 0.0% 0.0% 100.0% $ $0.0 $0.0 $0.0 $0.5 % 0.0% 0.0% 0.0% 100.0% $ $0.0 $0.0 $0.0 $1.6 % 64.8% 21.0% 0.0% 14.2% $ $2,731.1 $885.1 $0.0 $598.5 % 0.0% 0.0% 0.0% 100.0% $ $0.0 $0.0 $0.0 $0.0 % 80.0% 0.0% 15.0% 5.0% $ $213.2 $0.0 $40.0 $13.3 % 97.8% 1.0% 0.0% 1.2% $ $881.3 $9.0 $0.0 $10.8 % 0.0% 0.0% 100.0% 0.0% $ $0.0 $0.0 $902.3 $0.0 % 35.8% 0.0% 64.2% 0.0% $ $359.1 $0.0 $643.0 $0.0 % 0.0% 0.0% 50% 50% $ $0.0 $0.0 $265.9 $265.9 % $ $0.0 $0.0 $0.0 $2.7 % 0.0% 0.0% 50.0% 50.0% $ $0.0 $0.0 $631.1 $631.1 % 38.0% 0.0% 0.0% 62.0% $ $1,543.8 $0.0 $0.0 $2,518.8 % 11.9% 0.0% 0.0% 88.1% $ $55.3 $0.0 $0.0 $409.7 % $ $0.0 $0.0 $0.0 $31.6 % 100.0% 0.0% 0.0% 0.0% $ $2,340.9 $0.0 $0.0 $0.0 % 0.0% 0.0% 0.0% 100.0% $ $0.0 $0.0 $0.0 $4.8 % 40.0% 0.0% 0.0% 60.0% $ $2.5 $0.0 $0.0 $3.8 Note (3) (4) (1) (1) (1) (5) (1) (6) (7) (8) (9) (2) (1) (2) (2) (2) (2) (2) (1) (10) 87
89 Mexico Carbon Tax Norway Carbon Tax Poland Carbon Tax Portugal Carbon Tax Sweden Carbon Tax Slovenia Carbon Tax Ukraine Carbon Tax UK Carbon Price Floor , , , Total 22, % 0.0% 0.0% 0.0% 100.0% $ $0.0 $0.0 $0.0 $440.4 % 30.0% 0.0% 30.0% 40.0% $ $446.1 $0.0 $446.1 $594.8 % 0.0% 0.0% 0.0% 100.0% $ $0.0 $0.0 $0.0 $1.1 % 0.0% 0.0% 100.0% 0.0% $ $0.0 $0.0 $133.1 $0.0 % 0.0% 0.0% 50.0% 50.0% $ $0.0 $0.0 $1,278.0 $1,278.0 % 33.3% 0.0% 0.0% 66.7% $ $26.4 $0.0 $0.0 $52.7 % 0.0% 0.0% 0.0% 100.0% $ $0.0 $0.0 $0.0 $3.2 % 0.0% 0.0% 0.0% 100.0% $ $0.0 $0.0 $0.0 $1,168.9 % 40.4% 4.0% 19.5% 36.1% $ $9,012.1 $896.1 $4,339.4 $8,059.6 (1) (11) (1) (12) (2) (2) (1) (13) (1) No Data Available (2) Carl and Fedor (2016) (3) CAN$312.8 million total revenue allocated so far (excluding admin costs), CAN$7 million (2.2%) to adaptation with remainder to mitigation. Around CAN$6 million operating costs in 2016 (US$ 4.5 million). It is assumed these proportions apply to 2016 revenue allocations. Source: CCEMC (2016) xiii (4) All programs thus far are mitigation-related (despite objective that funds are for both mitigation and adaptation). CAN$25 million operating costs for fund in 2015/2016 (~US$19,000), with this proportion assumed to remain constant. Source: Fondsvert (2016) Comptes Du Fonds Vert, Ministére Du Développement Durable, De L Environment et de La Lutte Contre Les Changements Climatiques, Québec (5) Based on Figure 5 in Velten et al (2016) xiv. It is assumed that revenue allocation proportions remain constant. It is also assumed that 'cross-cutting action', 'Other' and 'non-specified' funding channels are 50% mitigation, 50% adaptation. All 'non-climate' spending is assumed to go to general funds. (6) Based on Chart 4 in RGGI (2016) xv. It is assumed that revenue allocation proportions remain constant. (7) All funds listed as allocated to programs listed in Appendix B of CCI (2017) xvi are considered to be mitigation allocations, except for the 'Urban Greening Program', for which the value allocated to adaptation is assumed at 10%. Cumulative budget allocations are assumed to remain constant. The cumulative value for program support are allocated as general funds and assumed to be spread equally across years. (8) BCMOF (2015) Carbon Tax, [online] Available at: (9) For , two thirds of revenue (to a cap of CHF 300 million) is to be spent on building sector emission reduction efforts. CHF 25 million per year also allocated to loan guarantee 'Technology Fund' (CHF1 roughly equal to US$1). Remainder recycled through various means. Values assumed to remain constant across the period. Source: Carl and Fedor (2016). (10) 40% for 'climate change measures in 2016', assumed to be mitigation. Remainder unknown. Source: World Bank (2017). (11) Assumed all green subsidies as allocated in Carl and Fedor (2016) are for climate change mitigation. (12) Pereira et al (2015) xvii (13) Ares and Delebarre (2016) xviii Caveats Future Form of See Methods and Data sections An ideal form of this indicator would also measure the extent to which revenues are allocated to health-related measures. The availability of such data, or the possibility to collect it, will be investigated for future publications. Working Group Methods 4. Economics and Finance 4.9 Spending on adaptation for health and health-related activities The Adaptation and Resilience to Climate Change dataset measures spending on economic activities related to adaptation and resilience to climate change. It was developed by data research firm kmatrix in partnership with numerous stakeholders, and includes the key adaptation measures identified by the IPCC. This classification of adaptation activities was originally developed from attempts by the UK Department for Environment, Food and Rural Affairs to 88
90 measure adaptation in 2009/2010. The definition of adaptation activities was extended through collaboration with the Greater London Authority in In 2017, the definition of adaptation and resilience activities has been updated through a project with Climate-KIC, which has added several new industrial sectors as well as significantly expanding the activities under health and healthcare. The methodology used for data acquisition and analysis is based on a system called as profiling, which was originally developed at Harvard Business School to track and analyse technical and industrial change. This is the basis for building taxonomies of economic activities and value chains, which can then be populated with estimates of key economic metrics like sales value and employment by triangulating transactional and operational business data to estimate economic values. This methodology is particularly valuable in areas where government statistics and standard industry classifications are not available. When measuring an industry or sector, the new taxonomy is populated from the bottom up, searching for evidence for the ideal definition and including only economic activities where sufficient evidence is available. For each transaction listed in the adaptation economy data, a minimum of seven separate sources must independently record the transaction for it to be confirmed and included in our database. Triangulating data from multiple sources permits large volumes of unsorted, fragmented data of different types from different sources to be processed to arrive at more accurate estimates of transactional value that would not be possible using a single source. For the adaptation economy, data are produced to a confidence level of around 80%. Accessing and analysing multiple types of data is also key to identifying the purpose behind an economic activity, which is key for accurately assigning economic activities to the adaptation dataset. Developing the new definition of adaptation and resilience to climate change involved the top-down taxonomy of the entire `make and mend' economy, and then adaptation and resilience in all forms. Then these categories were filtered to isolate economic activities that can be strictly identified as being relevant to adaptation and resilience to climate change. The taxonomy of A&RCC is drawn from 11 sectors of the economy at-large: Agriculture & Forestry, Built Environment, Disaster-Preparedness, Energy, Health, ICT, Natural Environment, Professional Services, Transport, Waste and Water. From across the entire adaptation and resilience to climate change dataset, it was seen that there are a number of activities across different sectors that are health-related, outside of the strictly-defined healthcare sector. Part of the design of the indicator therefore required the definition of those activities from the other 10 sectors of the A&RCC data that can be clearly related to health, and thus should be included in a definition of health-related adaptation spending. An initial exploration of the A&RCC dataset had yielded a three-tier approach for the categorization of health-related adaptation activities; 1) adaptation activities with direct, important health impacts, that clearly and directly protect health in substantial ways, or address major contributors to 89
91 burdens of disease 2) those with less direct or more minor health impacts, that indirectly benefit human health, or prevent minor impacts of burdens of disease 3) activities that primarily protect infrastructure and investment, those with no health impact or an impact on human health that is too circuitous or indirect. A robust interim approach was adopted for this year s Lancet Countdown. A 'health-related definition of activities that would be assigned to category 1 of the proposed categorisation was used, consisting the activities of the Healthcare/Health Sector, Disaster Preparedness and Agriculture adaptation activities from the kmatrix dataset. Although these may be revised in future research to define the full health-related adaptation definition, it was determined with a fairly high degree of certainty that there would be very little that is currently measured in these three sectors that would not be included the most direct impacts category of our categorisation. Further detail can be found in Future Form of on the future development of the indicator. A methodology is already under development to define a full health-related adaptation definition across the entire A&RCC dataset. Researchers from University College London, kmatrix and the University of Washington will collaborate on leading a consultation exercise on the creation of the full health-related adaptation definition in order to provide this as input to the next iteration of the Lancet Countdown. Comparison Data Population and nominal GDP data from 2015 and 2016 from the IMF s World Economic Outlook (April 2017) were used to estimate 2015/2016 Financial Year values for population and nominal GDP. Categorization of countries into the regions defined by the WHO s regional classification was conducted using metadata from the WHO. Geographical Coverage Data The indicator has global coverage for 226 countries and territories. Data has not been reported for all 226 countries and territories as the accompanying comparison data is not available for all, therefore the data reports a subset of countries for whom adaptation spending data, GDP estimates and population estimates are available, which totals over 180 countries. Spending data was available for 226 countries and territories, but due to missing data (principally population and GDP data) for 46 of these, we report on 180 countries. Data Sources: Adaptation and Resilience to Climate Change dataset: kmatrix Ltd, in partnership with University College London Population and nominal GDP data: IMF World Economic Outlook Data on national population and GDP for FY were taken from the 90
92 International Monetary Fund s World Economic Outlook (April 2017 update) ( Caveats Regional classification: World Health Organization Due to the nature of the methodology, transactions are only measured where there is an economic footprint, i.e. where there is transactional/financial data available to be measured. Therefore, public sector spending with economic footprint (government spending on salaries, for example), cannot be measured. It also not possible to directly identify what percentage of measured spending is public versus private. Values are not currently adjusted for inflation. Values of sales generated are not directly comparable with values derived from national statistics. The reference period is financial year 2015/16 (including annual growth in %). Unfortunately, it was not possible to process all of the historical data to provide trend data back to 2010/11 in time for the 2017 report deadline, but it is highly likely that this will be available in the future. This is, however, partly because significant effort was devoted to extended and updating the definitions of adaptation activities, which should make for a more comprehensive dataset (20% of the value in the new dataset represents new activities, so it is a significant step change). The health-related adaptation measure is based on Health, Agriculture and Disaster Preparedness for this year s report, but in future years it will also include health activities from a wider spread of the economy, as well as have another tier of measurement. Future Form of Given differences in data collection methods between transactional triangulation and GDP, comparisons as a percentage of GDP should be treated as indicative. GDP (nominal) data was used and transactional data, in this case, has not been adjusted for differences in purchasing power parity, and this should be considered when consulting the data. There will be three major developments in the future form of the indicator. The first will be the development of the three-tier definition of; 1) adaptation activities with direct, important health impacts 2) those with less direct or more minor health impacts 3) those with no health impact or too tenuous a health impact. Further details of how this will be developed are available in the Methods section of this appendix. Secondly, in the future it will possible to present historical data for the indicator (back to 2010/2011), in order to provide trend data on change in spend over time. It would also be ideal to provide a comparison of health sector and healthrelated adaptation spend as a percentage of overall transactional spend in the health sector. As noted above, in future reports it should be possible to include historical trend data, along with an annual update to the latest available data. It 91


93 may also be possible within this time frame (2018+), depending on funding, to develop the full health sector model for measurement as previously discussed. Supplementary Information Finally, in future iterations, it will be possible to provide an indicator of adaptation spending as a percentage of the overall health sector spend and health-related spend as a percentage of the entire economy (represented by 24 industries), compiled using transactional data. This should be available within the next few years. Health and health-related adaptation funding classified by WHO region Health and health-related adaptation funding classified by income grouping 92
94 Working Group Methods Data Caveats Future Form of 4. Economics and Finance 4.10 Health adaptation funding from global climate financing mechanisms This indicator used the Climate Funds Update (CFU 20 data on total gross flows of all multilaterally governed funds focused on climate change since The data also includes funds from bilateral organisations, but excludes funding from bilateral to multinational organisations, to avoid double counting of funds. For this indicator, the CFU data selected was for adaptation only and the approved funding figure was used to calculate adaptation funding. To calculate the adaptation funding that has been allocated to health, the following sectors were selected: basic health, health and health, general. Although it is recognised that other adaptation measures can have important health co-benefits, drawing out how effectively adaptation projects benefitted and accounted for health is complex and developing a consistent methodology for doing so would require more resource. Therefore, only those projects earmarked specifically as health were included in the analysis here. Climate Funds Update Some of the data was incomplete and so those adaptation projects that did not have the year noted could not be included, as it would then not be possible to accurately show the annual funding for adaptation and health adaptation, or changes in funding over time. To counter this, project documents were searched for and, where available, the project approval date updated in the CFU data. However, this was not possible for all projects. Furthermore, these results show funding through global climate financing mechanisms only and do not show the additional funding support given to these adaptation projects (for example, from UN agencies or national governments). The funding mechanisms included in the CFU data are shown in Web Table 1. Climate funding from Canada, the US, Japan and Denmark is not included in the CFU data; as such the figures presented here are likely to be underestimates. Additionally, the data presented in Figure 1 is not cumulative. Although most projects run for more than one year, there was insufficient information in the CFU data detailing the allocated spending for each project year and so only the total approved adaptation funding in each given year was shown. In future, this indicator could show all funding streams that fund adaptation generally and health adaptation specifically. The contributions of different funding streams could then be analysed and new funding streams (such as national governments) shown. 93
95 Appendix 6 Public and Political Engagement Working Group Sub- Methods 5. Public and Political Engagement 5.1. Media coverage of health and climate change Global newspaper reporting on health and climate change In this portion of the project, we identify intersecting trends in coverage in eighteen selected sources across six regions Asia, Oceania, North America, South America, Middle East, and Europe between climate change and health from January 2007 through December We assemble the data by accessing archives through the Lexis Nexis, Proquest and Factiva databases via the University of Colorado libraries. These sources are selected through a decision processes involving weighting of four main factors: (1) geographical diversity (favouring a greater geographical range), (2) circulation (favouring higher circulating publications), (3) national sources (rather than local/regional), and (4) reliable access to archives over time (favouring those accessible consistently for longer periods). The following Boolean searches in English and Spanish, respectively, were used: malaria or diarrhoea or infection or disease or sars or measles or 94
96 pneumonia or epidemic or pandemic or public health or healthcare or epidemiology or health care or health or mortality or morbidity or nutrition or illness or infectious or NCD or non-communicable disease or communicable disease or air pollution or nutrition or malnutrition or mental disorder or stunting AND climate change or global warming or green house or temperature or extreme weather or global environmental change or climate variability or greenhouse or low carbon or ghge or renewable energy or carbon emissions or co2 emissions or climate pollutants malaria or diarrea or infección or enfermedad or sars or sarampión or neumonía or epidemia or pandemia or salud pública or salud or epidemiología or salud or salud or mortalidad or morbilidad or nutrición or enfermedad or enfermedad infecciosa or NCD or no transmisible or enfermedad contagiosa or transmisible or contaminación del aire or nutrición or desnutrición or trastorno mental or retraso del crecimiento AND cambio climático or calentamiento global or temperatura or clima extremo or cambio ambiental global or variabilidad climática or invernadero or bajo carbono or ghge or energía renovable or emisiones de carbono or emisiones de CO2 or contaminantes climáticos Data ASIA: Times of India (India), Hindustan Times (India), Jakarta Post (Indonesia), Manila Bulletin (Philippines), Philippine Daily Inquirer (Philippines), Straits Times (Malaysia) MIDDLE EAST: Daily Star (Lebanon) EUROPE: El País (Spain), Daily Mail/Mail on Sunday (UK), The Sun (UK) SOUTH AMERICA: El Nacional (Venezuela) NORTH AMERICA: Toronto Star (Canada), Globe and Mail (Canada), USA Today (USA), Wall Street Journal (USA) OCEANIA: The Australian (Australia), Dominion Post (New Zealand), Sydney Morning Herald (Australia) Caveats There are some cautions with these findings. With this extensive Boolean string, there may be some returns that do not centrally address climate change and health together. For example, the search term "temperature" often generates a hit, but articles may be addressing a fever related to some illness, rather than climate change or global warming. As another example, there may be some overlap between articles discussing climate change legislation and health care legislation without meaningfully linking climate change and health. Also, in working with newspapers, rather than, for example, UN communications/documents, a narrower or more tailored approach might more effectively reduce the possibilities for false positives in the dataset. However, for consistency with the other groups and collaborators in the Lancet Countdown project, we have agreed to carry out the searches with the established terms above and we therefore are committed to the search results and trends Future Form of generated. In future, more newspaper will be included in the analysis, with improved representation of different regions. Further details on how health and climate change is reported on will also be sought, including the demonstration of how marginal health is to the wider coverage of/debates about climate change. There will also be an effort to match the newspaper included in and to allow for better comparison and analysis of newspaper reporting on health and climate change. 95
. Working Group Sub- Methods 5. Public and Political Engagement 5.1. Media coverage of health and climate change 5.")
97 Additional Information Number of articles reporting on health and climate change in the 18 newspapers analysed, including the global total (2007 to 2016). Number of articles reporting on health and climate change in the 18 newspapers analysed ( ). Working Group Sub- Methods 5. Public and Political Engagement 5.1. Media coverage of health and climate change In-depth analysis of newspaper coverage on health and climate change The analysis used online databases, holding both printed and online versions of Le Monde and FAZ, and was conducted in two stages. Potential articles related to health and climate change were captured through an initial search, a more detailed keyword search within each text then identified articles linking health and climate change. This second stage also collected information on the framing of health and climate change (for instance, as an environmental or economic issue), potential policy responses and co-benefits. The tracking analysis relied on a consistent set of search terms for the two newspapers, but this may have introduced a linguistic bias. Furthermore, only two newspapers were analysed, so the findings cannot be used to indicate the broader nature of newspaper coverage on health and climate change. The methodology of our analysis is based on and has been developed by the 4C- Health research group, set up by the Centre Virchow-Villermé in Paris and Berlin, to analyse how the health-climate nexus was addressed in the media. We used a 96
98 detailed strategy to search the online database of the French newspaper Le Monde and the German newspaper Frankfurter Allgemeine Zeitung (FAZ). Specific inclusion and exclusion criteria were applied in order to capture the most relevant literature in the timeframe chosen. The search was conducted in two stages, the first one with broad term aiming to capture most articles on the subject. The second stage consisted in a keyword search within text to collect only the articles linking climate change and health. To filter the valuable articles in the online data bases we have a two-stage-process. In the first step, we have applied a quantitative approach by choosing keywords which would specify the topic climate change and health in order to exclude the unrelated articles. Therefore we looked for the most obvious keywords climate change and health and climate-change-related as well as health-related keywords. These keywords have been deductively defined, meaning, while reading the articles we have noticed the reoccurrence of particular climate-change-related or healthrelated terms, which have then been added to our keyword group. In practice we have searched for the following keywords in Le Monde and the FAZ (see Table 1). German English French Keywords stage 1 climate Klimaerwärmung climate warming réchauffement climatique Klimaveränderun g climate change changement climatique klimawandel climate change changement climatique erderwärmung climate disruptions/ climate disturbances global warming/ climate warming dérèglement climatique réchauffement climatique Boolean operator AND Keywords stage 1 health gesundheit health santé krankheit disease maladie Erkrankung disease maladie 97
99 gesundheitsschäd en health damages atteintes à la santé Boolean Operator AND /OR Keywords stage 2 infektionskrankhe it infectious disease maladie infectieuse atemwegserkrank ung respiratory disease maladie respiratoire herz-kreislauf- Erkrankung cardivascular disease maldie cardiovaculaire herzerkrankung cardivascular disease maldie cardiovaculaire psychische Erkrankung mental illness maladie mentale Vorteile co benefits co-bénéfices Todesfall case of death décès unterernährung malnutrition malnutrition hungerkatastroph e famine famine hungersnot famine famine zugang zu Wasser acces to water accès à l'eau wassermangel lack of water verfügbarkeit von wasser availability of water disponibilite en eau konflikt conflict conflit wetterextrem weather extreme évènement climatique extrême überschwemmun g flooding inondation Überflutung flooding inondation 98
100 Flut flooding inondation hochwasser high water inondation hitzewelle heat wave vague de chaleur Dürre drought sécheresse luftverschmutzun g air pollution pollution de l'air temperaturanstie g Meeresspiegelans tieg temperature rise sea level rise augmentation de la température élèvation du niveau de la mer Table 1 : Keywords and Boolean operator ; stage 1 ; stage 2 As the Table indicates, the first stage keyword search for the FAZ was more elaborated than the one for Le Monde. This was due to the fact that the online data base of the FAZ showed only a small number of articles that included health as a health-related term. By adding more health-related keywords to the list, it allowed us to have a greater total number of relevant articles to progress to the secondstage-process. Articles were only accepted for the second-stage-process if they included a health-related and a climate-change-related term. For the second stage of the analysis, a qualitative screening of the articles was undertaken to categorize them according to a predefined grid. - Context: This category distinguishes whether the article was about an international summit (COP, G8, etc.), the publication of a study/scientific report (IPCC, lancet commission) or an extreme weather event (flooding, heat waves). - Recommendations: we identified whether the dominant recommendation (if there was one) was about mitigation, adaptation, or co-benefits. - Tone: we have categorized the tone of the article into four classes: neutral, positive, mixed and negative. Tone Negativ e Neutral Definition Urgent matter, something must be done immediately, pessimism about the future, description of a dramatic situation Plain facts and numbers without any specific comment 99
101 Mixed Positive Worrisome situation with a remaining chance for it to get better or still acceptable situation but progressively degrading There is still time to counter climate change, there is hope but we have to start now Number of Articles FAZ Le Monde Year Newspaper articles on health and climate change in Le Monde and FAZ ( ). Context and content of publications addressing the climate-health nexus The context was often related to international events such as climate conferences or scientific discoveries (see table below). Health crises seldom led to articles pointing out the role of climate change. Le Monde FAZ International event 43 % 31% Scientific announcement 15% 21% Health crisis 12% 7% Extreme climate event 5% 7% Media event 2% - Agricultural crisis 1% - Undefined 22% 28% Articles mentioning health impacts were a small proportion of the total of articles about climate change: out of 4031 articles about climate change in Le Monde, only 168 mentioned a link between climate change and health. The share was even smaller in FAZ: 67 articles mention the linkages between climate change and health of The climate-health nexus is addressed purely as an environmental issue in France, while it is more likely to be treated as an economic and/or social issue in Germany (see box below). 100
102 Le Monde : Planète (Earth) (70%), Idées (Ideas) (16%), Economie (Economy) (6,5%), A la Une (Front-page news) (2,5%), Vous («Opinion») (1,5) International (International), Santé (Health), Science (Science), Société (Society), Culture (Culture), Sport (Sport), Techno (Innovation) (0,5%). FAZ. : Wirtschaft (Economy) (23%), Rhein-Main Zeitung (Local news) (20 %), Politik (Politics) (17%), Natur-und-Wissenshaft (Natural sciences) (15%), FAZ.net (Online news) (15%), Feuilleton (Culture) (6%), Verlagsbeilage (Print Supplement), Sonntagszeitung (Week end edition) (4%). Another difference between Le Monde and FAZ was the solutions that were recommended to address the health impacts of climate change: while Le Monde focused on the adaptation strategies to deploy, FAZ put more emphasis on the mitigation of greenhouse gas emissions. The co-benefits that public health policies can represent for mitigation, however, are barely mentioned in either of the papers. The table below summarises the share of articles where the dominant recommendation was about mitigation, adaptation, or co-benefits. Le Monde FAZ Mitigation dominant 12% 40% Adaptation dominant 41% 21% Co-benefits dominant 17% 9% No recommendation 30% 30% Comparison of the dominant recommendation in the articles considered. Le Monde FAZ Neutral 44 % 49 % Positive 4 % 16 % Negative 32 % 19 % Mixed 20 % 16 % The tone of the articles. Data Caveats Future Form of The databases are online databases from Le Monde and the Frankfurter Allgemeine Zeitung. We used a combination of quantitative and qualitative methods (see methods above). Articles were searched in the online search databases using specific search syntax. Articles were then screened, identified and categorised according to specified criteria (type of article, studied health impact, geographical focus, etc). This analysis considers only a narrow range of search terms, which can induce a strong linguistic bias. French articles addressing health will almost always mention the term santé ( health in French), whereas the German equivalent Gesundheit is less often mentioned in articles addressing public health. In order to provide a similar basis for comparison, we had to use the same protocol to analyse articles in both Le Monde and FAZ, but we need to be aware that some terms ( health in particular) were more frequently used in a language than in the other. In the future, we aim to compare and contrast our analysis of coverage in Le Monde and FAZ with other newspapers, such as The Guardian or The New York Times, in order to account for perspectives of other older industrialised countries, and with newspapers from developing countries, where the health impacts of climate change are most marked. Our longer- term goal is a series of international newspapers analyses. The analysis will include both the global North and the global South. 101
103 Working Group Methods 5. Public and Political Engagement 5.2. Health and climate change in scientific journals We tracked the use of climate-related terms and their co-occurrence with health terms using a bibliometric search in both PubMed and Web of Science databases. The search terms were the following and adapted according to the database: Climate change related terms Climate Change Global warming Climate variability Greenhouse effect GHGE Health related terms Health Disease - Non-Communicable - NCD - Communicable Epidemiology Lifestyle Co-Benefits Mortality Morbidity Nutrition Malnutrition Dehydration Migration Mental disorders This list of search terms were found to be exhaustive and appropriate for scientific databases. A more detailed search syntax, including the diseases of poverty used by indicator 5.3 was not necessary as with the use of medical subject headings (MeSH- Terms) for instance in PubMed those diseases are covered through the MeSH Term Communicable diseases. Different search syntaxes were applied and the final number of overall publications did not show to vary significantly underlining that the search strategy was robust and able to capture most relevant articles. Titles and abstracts of identified papers for relevance to the topic were screened three times. The results were then merged using the Endnote reference manager software and duplicates removed. Conflicts were resolved within the research team and a final selection of articles was prepared for analysis. The stepwise process of the selection of articles is presented in the flow chart below. 102
104 Numbers indicate the article count retained at each step of the process. With the applied search terms more than 8000 scientific articles on climate change and health were identified for the period of After the screening process only 4% (27 of 2282) were retained and found to be relevant. Indeed, a majority just mentioned climate change in the abstract and did not focus on the link between climate change and health. Other articles explored ecological health or animal health but not human health and were therefore excluded. A minority of papers were excluded as these were book chapters or conference proceedings referenced in both databases. After the screening process, data were extracted, categorized and coded to allow for statistical analysis of the results. Geographically, the majority of publications address the impact of climate change and health in Europe and the Americas (Figure S5.1 below). This is particularly concerning given that countries in the Global South will bear the greatest health burden. Figure S

105 Figure S5.2 shows the proportion of scientific papers published between 2007 and 2016 per world region. The distribution varied significantly; from 84 for the Eastern Mediterranean Region to almost 700 articles with a European focus. Indeed, more than half of identified papers focused on Europe and the Americas. The Eastern Mediterranean Region was less represented followed by papers focussing on the African continent. 104
Tuesday 21 November 2017 Macmillan Room, Portcullis House. Co-hosted by:
 Tuesday 21 November 2017 Macmillan Room, Portcullis House Co-hosted by: The Lancet Countdown 2 Strategic Partners 3 Lancet Countdown Partners 4 The Lancet Countdown s Working Groups Climate Change Impacts,
ICCG Think Tank Map: a worldwide observatory on climate think tanks Arctic, Energy Poverty and Health in the Second Volume of IPCC s AR 5
 ICCG Think Tank Map: a worldwide observatory on climate think tanks Arctic, Energy Poverty and Health in the Second Volume of IPCC s AR 5 Alice Favero, ICCG Arctic, Energy Poverty and Health Alice Favero
Climate Change and Health in Small Island Developing States:
 Climate Change and Health in Small Island Developing States: WHO Special Initiative in partnership with UNFCCC Secretariat and Fijian Presidency of COP-23 Contents The Challenge... 2 1. Health impacts
Effects of Climate Change on Human Health
 Effects of Climate Change on Human Health World Health Organization estimates that climate change already kills 150,000 people annually - death rates are greatest in Africa 1 WHO estimates that climate
Climate Change Country Profile: Viet Nam
 Climate Change Country Profile: Viet Nam 1. Country description 1.1 Geography Located in South-East Asia Borders China, Lao People s Democratic Republic, Cambodia and East Sea Coastline: 3260 km Total
National Integrated Food Security and Nutrition Policy (NIFSNP) Manoj Thibbotuwawa, Research Economist
 Manoj Thibbotuwawa, Research Economist") National Integrated Food Security and Nutrition Policy (NIFSNP) Manoj Thibbotuwawa, Research Economist Food Security When all people, at all times, have physical and economic access to sufficient, safe
National Integrated Food Security and Nutrition Policy (NIFSNP) Manoj Thibbotuwawa, Research Economist Food Security When all people, at all times, have physical and economic access to sufficient, safe
Food Insecurity in the World
 The State of Food Insecurity in the World Strengthening the enabling environment to improve food security and nutrition Food and Agriculture Organization of the United Nations European Commission Brussels,
El Nino Impacts in Southern Africa: highlights from the 2015/16 Season
 El Nino Impacts in Southern Africa: highlights from the 2015/16 Season Presentation at the Southern Africa Regional Climate Services Workshop (29 November to 2 December 2016) Vhusomuzi B. Sithole Introduction
Food Security, Nutrition and Price Stability
 Food Security, Nutrition and Price Stability EGM on Post-2015 UN Development Agenda New York, 27-29 Feb 2012 Mark Smulders Senior Economist Agricultural Economic Development Division Economic and Social
The Fourth United Nations Conference on the Least Developed Countries Istanbul, 9-13 May Concept Note
 The Fourth United Nations Conference on the Least Developed Countries Istanbul, 9-13 May 2011 Concept Note Reducing vulnerabilities, responding to emerging challenges and enhancing food security in the
VIET NAM EMPLOYMENT AND ENVIRONMENTAL SUSTAINABILITY FACT SHEETS 2017
 VIET NAM EMPLOYMENT AND ENVIRONMENTAL SUSTAINABILITY FACT SHEETS 17 The Employment and Environmental Sustainability Fact Sheets series provides key features of employment and environmental sustainability
NEPAL EMPLOYMENT AND ENVIRONMENTAL SUSTAINABILITY FACT SHEETS 2017
 NEPAL EMPLOYMENT AND ENVIRONMENTAL SUSTAINABILITY FACT SHEETS 217 The Employment and Environmental Sustainability Fact Sheets series provides key features of employment and environmental sustainability
Chapter 3: How Climate Change will Affect People Around the World. Lawrence Tse Chris Whitehouse
 Chapter 3: How Climate Change will Affect People Around the World Lawrence Tse Chris Whitehouse Outline 3.1 Introduction 1 C 3.2 Water 2 C 3.3 Food 3 C 3.4 Health 4 C 3.5 Land + 3.6 Infrastructure 5 C
CFS contribution to the 2018 High Level Political Forum on Sustainable Development global review
 CFS contribution to the 2018 High Level Political Forum on Sustainable Development global review Transformation towards sustainable and resilient societies In depth-review of SDGs 6, 7, 11, 12, 15, 17
Montessori Model United Nations. Distr.: Upper Elementary Eleventh Session XX September Second Committee Economic and Financial
 Montessori Model United Nations A/C.2/11/BG-26 General Assembly Distr.: Upper Elementary Eleventh Session XX September 2016 Original: English Second Committee Economic and Financial This group wants to
PART 6 MONITORING THE FOOD SECURITY SITUATION IN SADC
 PART 6 MONITORING THE FOOD SECURITY SITUATION IN SADC SADC food security situation 1. Introduction Point 6 of the terms of reference of the Food Price Monitoring Committee is To monitor the regional SADC
PAKISTAN EMPLOYMENT AND ENVIRONMENTAL SUSTAINABILITY FACT SHEETS 2017
 PAKISTAN EMPLOYMENT AND ENVIRONMENTAL SUSTAINABILITY FACT SHEETS 217 The Employment and Environmental Sustainability Fact Sheets series provides key features of employment and environmental sustainability
FOOD SECURITY MONITORING, TAJIKISTAN
 Fighting Hunger Worldwide BULLETIN July 2017 ISSUE 19 Tajikistan Food Security Monitoring FOOD SECURITY MONITORING, TAJIKISTAN July 2017 - ISSUE 19 Fighting Hunger Worldwide BULLETIN July 2017 ISSUE 19
Public Health Concerns Southern Arizona Regional Climate Summit for Municipal Leaders
 Public Health Concerns Southern Arizona Regional Climate Summit for Municipal Leaders Sharon L. Harlan Arizona State University November 14, 2013 GEO-0816168 BCS-1026865 How Climate Change Affects Human
CFS contribution to the 2018 High Level Political Forum on Sustainable Development global review
 CFS contribution to the 2018 High Level Political Forum on Sustainable Development global review Transformation towards sustainable and resilient societies In depth-review of SDGs 6, 7, 11, 12, 15, 17
AFGHANISTAN EMPLOYMENT AND ENVIRONMENTAL SUSTAINABILITY FACT SHEETS 2017
 AFGHANISTAN EMPLOYMENT AND ENVIRONMENTAL SUSTAINABILITY FACT SHEETS 217 The Employment and Environmental Sustainability Fact Sheets series provides key features of employment and environmental sustainability
Economic and Social Council
 United Nations [E/2016/75] Economic and Social Council Distr.: General English only ` ` ` ` ` ` ` ` ` ` ` ` ` 2016 session 24 July 2015-27 July 2016 Agenda items 5, 6 and 18 (a) High-level segment High-level
Dr. Buruhani Nyenzi Managing Director Climate Consult (T) Ltd
 Ltd") Climate Change and Its Impacts Zanzibar, Tanzania 17 May 2011 Dr. Buruhani Nyenzi Managing Director Climate Consult (T) Ltd Email: bnyenzi@yahoo.co.uk bnyenzi@gmail.com Climate Variability and Change
Climate Change and Its Impacts Zanzibar, Tanzania 17 May 2011 Dr. Buruhani Nyenzi Managing Director Climate Consult (T) Ltd Email: bnyenzi@yahoo.co.uk bnyenzi@gmail.com Climate Variability and Change
Food Security Information for Action. Food Security Concepts and Frameworks. Lesson 1. What is Food Security? Learner s Notes
 Food Security Information for Action Food Security Concepts and Frameworks Lesson 1 What is Food Security? Learner s Notes This course is funded by the European Union and developed by the Food and Agriculture
Nearly one-quarter of the population lives on less than USD 1 per day
 Nearly one-quarter of the population lives on less than USD 1 per day 32 Nepal Background Nepal suffers from chronic food insecurity, severe and recurrent natural disasters, poor health and sanitation
October 2018 CL 160/10 COUNCIL. Hundred and Sixtieth Session. Rome, 3-7 December Proposal for an International Year of Fruits and Vegetables
 October 2018 CL 160/10 E COUNCIL Hundred and Sixtieth Session Rome, 3-7 December 2018 Proposal for an International Year of Fruits and Vegetables This document can be accessed using the Quick Response
How to Feed the World in 2050
 How to Feed the World in 2050 Insights from an expert meeting at FAO, 24-26 June 2009 Keith Wiebe, FAO OECD Global Forum on Agriculture Paris, 30 June 2009 millions of hungry people 1.02 billion hungry
Food and Agriculture in Agenda 2030: 8 points +
 Food and Agriculture in Agenda 2030: 8 points + OECD Global Forum on Agriculture Michael T. Clark, Senior Coordinator, Governance and Policy Tuesday, 2 February 2016 Agenda 2030 for Sustainable Development
Impacts of Climate Change on Food Security
 Climate Change and Food Security Impacts of Climate Change on Food Security Learners Notes This course is funded by the European Union's Food Security Thematic Programme and implemented by the Food and
Web Annex 1: Results Framework Strategic and Functional Objectives
 Web Annex 1: Results Framework 2018-19 Strategic and Functional Objectives STRATEGIC OBJECTIVE 1 CONTRIBUTE TO THE ERADICATION OF HUNGER, FOOD INSECURITY AND MALNUTRITION -By 2030 access by all to safe
Climate and Agriculture Key Challenges and Opportunities
 Climate and Agriculture Key Challenges and Opportunities Yahya Abawi, University of Southern Queensland, AUSTRALIA Regional Consultation on Climate Services for the Third Pole and other High Mountain Regions
Climate Change and Poverty Vulnerability
 Climate Change and Poverty Vulnerability Amer Ahmed The Poverty and Distributional Impacts of Climate Change PREM Knowledge and Learning Forum April 26, 2010 Based on findings from the DECAR project Climate
WFP CORPORATE RESULTS FRAMEWORK ( )
") WFP CORPORATE RESULTS FRAMEWORK (2017 2021) SECOND DRAFT Informal Consultation 9 May 2016 World Food Programme Rome, Italy INTRODUCTION 1. WFP is committed to attaining the highest standards of accountability.
WFP CORPORATE RESULTS FRAMEWORK (2017 2021) SECOND DRAFT Informal Consultation 9 May 2016 World Food Programme Rome, Italy INTRODUCTION 1. WFP is committed to attaining the highest standards of accountability.
Ethiopia. July Eritrea. Sudan. Djbouti. Somalia. Kenya ETHIOPIA. at a glance. summary. Tigray. Region. Amhara. Region. Somali. Oromiya.
 EMERGENCY UPDATE Ethiopia July 2000 Sudan Wolayita Eritrea Tigray Amhara Addis Ababa ETHIOPIA Konso N. Wollo S. Wollo Djbouti East Haraghe Jijiga Oromiya Fik Red Sea Somali Gode Kenya Somalia at a glance
BACKGROUND NOTE IMPROVING FOOD SECURITY AND NUTRITION IN PROTRACTED CRISES
 BACKGROUND NOTE IMPROVING FOOD SECURITY AND NUTRITION IN PROTRACTED CRISES Guidance to implement the Framework for Action for Food Security and Nutrition in Protracted Crises (CFS-FFA) The designations
Climate Change: The Impact on Human Health in the SADC Region. James van Hasselt 28 th Feb 2011 ICLEI Cape Town
 Climate Change: The Impact on Human Health in the SADC Region James van Hasselt 28 th Feb 2011 ICLEI Cape Town Regional Climate Change Programme (RCCP) -The purpose of RCCP is to enable trans boundary
LAO PEOPLE S DEMOCRATIC REPUBLIC
 LAO PEOPLE S DEMOCRATIC REPUBLIC EMPLOYMENT AND ENVIRONMENTAL SUSTAINABILITY FACT SHEETS 217 The Employment and Environmental Sustainability Fact Sheets series provides key features of employment and environmental
COUNTRY LEVEL IMPACTS OF CLIMATE CHANGE (CLICC) PILOT PROJECT- GHANA
 PILOT PROJECT- GHANA") COUNTRY LEVEL IMPACTS OF CLIMATE CHANGE (CLICC) PILOT PROJECT- GHANA National Circumstances: Major Developments Since 2006 Ghana s population has tripled, from 6.7million in 1960 to 24.9million in 2010
COUNTRY LEVEL IMPACTS OF CLIMATE CHANGE (CLICC) PILOT PROJECT- GHANA National Circumstances: Major Developments Since 2006 Ghana s population has tripled, from 6.7million in 1960 to 24.9million in 2010
Climate Change and Sustainable Development in Botswana
 Session : Adaptation and Development Climate Change and Sustainable Development in Botswana Opha Pauline Dube University of Botswana Climate change is the strongest signal ever that the global economic
Open Working Group, February 2014: Australia, the Netherlands, United Kingdom Constituency Statement. Oceans and Seas, Forests and Biodiversity
 Open Working Group, February 2014: Australia, the Netherlands, United Kingdom Constituency Statement Oceans and Seas, Forests and Biodiversity Healthy ecosystems, biological diversity (biodiversity) and
14554/18 YML/ik 1 RELEX.1.B
 Council of the European Union Brussels, 26 November 2018 (OR. en) 14554/18 OUTCOME OF PROCEEDINGS From: General Secretariat of the Council On: 26 November 2018 To: Delegations No. prev. doc.: 14283/18
Water and Climate Change. David Coates Secretariat of the Convention on Biological Diversity Montreal Canada
 Water and Climate Change David Coates Secretariat of the Convention on Biological Diversity Montreal Canada Water and climate change How important is water? What do ecosystems have to do with it? How important
Organisation Embassy of the Kingdom of the Netherlands, Dhaka, Bangladesh June Date
 Food and Nutrition Organisation Embassy of the Kingdom of the Netherlands, Dhaka, Bangladesh June 2016 2015 Date Reporting period 2015 ActivityImplemented Result by area Rio marker Gender marker Number
Toward World Food Security
 Toward World Food Security PRESENTED BY Greg Traxler Monday, July 20, 2009 1 IFMA7 Conference, Bloomington, Illinois Food Security when all people, at all times, have physical, social and economic access
Socio-economic Indicators for Vulnerability Assessment in the Arab Region
 Socio-economic Indicators for Vulnerability Assessment in the Arab Region Tarek Sadek Water Resources Section Sustainable Development & Productivity Division-ESCWA Presentation outline Concepts of vulnerability
Climate change and Vulnerability Assessment: Water-borne disease
 Climate change and Vulnerability Assessment: Water-borne disease AVEC Summer School Peyresq September 2003 Mike Ahern Research Fellow London School of Hygiene and Tropical Medicine AIM OF LECTURE Provide
Contributions to the 2030 Agenda for Sustainable Development
 Contributions to the 2030 Agenda for Sustainable Development ECOSOC functional commissions and other intergovernmental bodies and forums, are invited to share relevant input and deliberations as to how
Monthly Regional Food Price Update - July & August 2017
 e Monthly Regional Food Price Update - July & August 2017 h Highlights: Southern Africa Improved maize supplies drove national maize and maize meal prices further down in July in all the monitored countries
Southern Africa The Rainfall Season
 Southern Africa The 2014-2015 Rainfall Season SOUTHERN AFRICA SEASONAL ANALYSIS 2014/2015 HIGHLIGHTS The 2014-2015 growing season is coming to a close in Southern Africa and further rainfall will not significantly
FOOD CONSUMPTION AND NUTRITIONAL STATUS OF VULNERABLE PEOPLE REARING LIVESTOCK IN BANGLADESH
 Bangladesh J. Agric. Econs, XXXIII, 1 & 2(2010) 41-56 FOOD CONSUMPTION AND NUTRITIONAL STATUS OF VULNERABLE PEOPLE REARING LIVESTOCK IN BANGLADESH K. M. M. Rahman 1 A. Sousa-Poza 2 ABSTRACT This study
FRAMEWORK FOR PUBLIC HEALTH ADAPTATION TO CLIMATE CHANGE IN THE AFRICAN REGION. Report of the Secretariat CONTENTS
 22 June 2011 REGIONAL COMMITTEE FOR AFRICA ORIGINAL: ENGLISH Sixty-first session Yamoussoukro, Côte d Ivoire, 29 August 2 September 2011 Provisional agenda item 15 FRAMEWORK FOR PUBLIC HEALTH ADAPTATION
Global Action Programme on Food Security and Nutrition in Small Island Developing States SUPPORTING THE IMPLEMENTATION OF THE SAMOA PATHWAY
 Global Action Programme on Food Security and Nutrition in Small Island Developing States SUPPORTING THE IMPLEMENTATION OF THE SAMOA PATHWAY Unique Challenges to Food Security and Nutrition The Small Island
Protecting health in Europe from climate change
 Protecting health in Europe from climate change World Health Day 2008 World Health Day 2008 1 reenhouse gas emissions are warming the earth GHG emissions have increased by 70% over the last four decades
Price Shocks, Volatility and Household Welfare: A Cross-Country Inquiry
 Understanding and coping with food markets volatility towards more stable World and EU food systems. POLICY BRIEFING No 05 April 2015 Objectives 1. Measuring the welfare consequences of price changes and
Southern Africa Growing Season : Recovery After Two Years of Drought?
 Southern Africa Growing Season 2016-2017: Recovery After Two Years of Drought? HIGHLIGHTS Good performance of the current growing season (October 2016 - April 2017) is critical for Southern Africa after
END OF SOWING WINDOW REPORT SOUTHERN AFRICA (2017/18 SEASON)
") This End-of-Planting Season Report is a publication by the African Risk Capacity (ARC). This report discusses the performance of the planting window, which stretches from October to January for most of
This End-of-Planting Season Report is a publication by the African Risk Capacity (ARC). This report discusses the performance of the planting window, which stretches from October to January for most of
Global work on climate change indicators
 Global work on climate change indicators Final Workshop on Environment Statistics for the East African Community Region Arusha, Tanzania 23-27 October 2017 Climate change statistics: where are we? Demand
within a country's borders in a specific time.
 PAMUN XIII RESEARCH REPORT QUESTION OF: MEASURES TO REDUCE FOOD INSECURITY IN LEDCs I. Introduction of Topic: With over 925 million people facing food and nutrition insecurity, and malnutrition causing
COMMITTEE ON AGRICULTURE
 July 2014 COAG/2014/7 E COMMITTEE ON AGRICULTURE Twenty-fourth Session Rome, 29 September - 3 October 2014 New Data for Monitoring Investment in Agriculture Executive Summary Investing in agriculture is
Climate Change and Health: Impacts, Vulnerability and Mitigation
 () Climate Change and Health: Impacts, Vulnerability and Mitigation Jamal Hisham Hashim, PhD, MCIEH Professor of Environmental Health & Research Fellow United Nations University Presented at the Seminar
Synthesis of Discussions
 Synthesis of Discussions Africa Regional Meeting Addis Ababa June 24, 2010 Suresh Babu IFPRI INTERNATIONAL FOOD POLICY RESEARCH INSTITUTE Why talk about 2007-08 food crisis now? Food crisis is not new
Health, environment and climate change
 EXECUTIVE BOARD EB144/16 144th session 11 December 2018 Provisional agenda item 5.6 Health, environment and climate change Draft global plan of action on climate change and health in small island developing
LIST OF POSSIBLE APPLICATIONS OF DECADAL PREDICTION
 LIST OF POSSIBLE APPLICATIONS OF DECADAL PREDICTION Document prepared for CLIVAR Pacific Panel by: William Crawford, Rodney Martinez and Toshio Suga. October 2006 The decadal time period falls between
NATIONAL AND REGIONAL IMPACTS OF CLIMATE CHANGE ON THE INDIAN ECONOMY
 NATIONAL AND REGIONAL IMPACTS OF CLIMATE CHANGE ON THE INDIAN ECONOMY PARTHA SEN and SHREEKANT GUPTA Delhi School of Economics University of Delhi sgupta@econdse.org Climate Change and Developing Countries
Climate Change and Human Health
 Climate Change and Human Health Lesley Jantarasami EPA Office of Air and Radiation Office of Atmospheric Programs June 24, 2015 ITEP Webinar: Impacts of Climate Change on Tribal Health US Global Change
Minimum Core Data Set
 Global Strategy IMPROVING AGRICULTURAL AND RURAL STATISTICS IN ASIA PACIFIC Minimum Core Data Set Regional Office for the Asia-Pacific Regional Action Plan to Improve Agricultural and Rural Statistics
2018 HLPF Thematic Review: Transformation towards sustainable and resilient societies - Building resilience
 2018 HLPF Thematic Review: Transformation towards sustainable and resilient societies - Building resilience Background The term resilience in General Assembly Resolution 71/276 describes the ability of
End poverty in all its forms everywhere
 End poverty in all its forms everywhere 1.1 By 2030, eradicate extreme poverty for all people everywhere, currently measured as people living on less than $1.25 a day 1.2 By 2030, reduce at least by half
IPCC Fourth Assessment Report: the science behind the impacts
 IPCC Fourth Assessment Report: the science behind the impacts R Sari Kovats Climate change and challenges for public health priorities for EU action Brussels, 2 October 2007 Health topics in AR4 Heat and
The New Face of Hunger
 The New Face of Hunger Josette Sheeran Executive Director, World Food Programme a revolution in food aid Not your grandmother s food aid : WFP is transforming the way it does business Needs assessments
PAPUA NEW GUINEA EMPLOYMENT AND ENVIRONMENTAL SUSTAINABILITY FACT SHEETS 2017
 PAPUA NEW GUINEA EMPLOYMENT AND ENVIRONMENTAL SUSTAINABILITY FACT SHEETS 217 The Employment and Environmental Sustainability Fact Sheets series provides key features of employment and environmental sustainability
Climate impacts. Main Impacts of Climate Change CO2 fertilization effect Heat stress Water availability sea-level rise. Climate impacts.
 By Sokuntheary Ath Precipitation Human Activity Food Shortage Main Impacts of Climate Change CO2 fertilization effect Heat stress Water availability sea-level rise The Poor s Summary Projected Annual Average
Web Annex 1: Results Framework Strategic and Functional Objectives
 Web Annex 1: Results Framework 2018-19 Strategic and Functional Objectives STRATEGIC OBJECTIVE 1 CONTRIBUTE TO THE ERADICATION OF HUNGER, FOOD INSECURITY AND MALNUTRITION -By 2030 access by all to safe
From Protection to Production: Breaking the Cycle of Rural Poverty
 FAO Economic and Social Development Department From Protection to Production: Breaking the Cycle of Rural Poverty Benjamin Davis Deputy Director Agricultural Development Economics Division World Food Day,
What does IPCC AR5 say? IPCC as a radical inside the closet
 What does IPCC AR5 say? IPCC as a radical inside the closet What does IPCC AR5 say? Plan: * What is IPCC? * The Fifth Assessment Report (AR5) - WR1: The physical basis - WR2: Impacts, adaptation and vulnerability
The Regional Coordination Mechanism Arab States. Working Group on Food Security and Nutrition
 The Regional Coordination Mechanism Arab States Working Group on Food Security and Nutrition Food security in the Arab region is part of a complex food system and has long been a concern for a number of
The IPCC Special Report on global warming of 1.5 C
 The IPCC Special Report on global warming of 1.5 C Jean-Pascal van Ypersele Former IPCC Vice-Chair (2008-2015) Prof UCLouvain, Earth & Life Institute Twitter: @JPvanYpersele, «Outlook to COP24 in Katowice»,
Current Food Security and Nutrition Challenges and the role of agriculture and food systems
 Current Food Security and Nutrition Challenges and the role of agriculture and food systems Sumiter Singh BROCA Policy Officer, FAO Regional Office for Asia and the Pacific Briefing on ICN2 Jakarta 29
Global Strategy. Session 1.2: Minimum Set of Core Data Items. Module 1: Sampling in the Context of the Global Minimum Set of Core Data Items
 Global Strategy IMPROVING AGRICULTURAL AND RURAL STATISTICS IN ASIA PACIFIC Module 1: Sampling in the Context of the Global Minimum Set of Core Data Items Session 1.2: Minimum Set of Core Data Items 13
AGENDA FOR FOOD SECURITY AND RESILIENCE
 AGENDA FOR FOOD SECURITY AND RESILIENCE Twenty-six international development agencies encourage Canada to demonstrate global leadership by re-investing in food security for vulnerable people in developing
Food Security and World Changes and Trends since 1992
 Food Security and World Changes and Trends since 1992 Julian Adams Asia Coordinator, Program for Biosafety Systems University of Michigan Ann Arbor MI USA Bangkok January 10 2012 1 Demographic Changes
F E A T U R E V O L U M E 8 I S S U E 3 A M B E R WAV E S E C O N O M I C R E S E A R C H S E R V I C E / U S D A. WFP/Tom Haskell
 A M B E R WAV E S V O L U M E 8 I S S U E 3 16 WFP/Tom Haskell E C O N O M I C R E S E A R C H S E R V I C E / U S D A A Positive Path for Food Security in Sub-Saharan Africa Options and Challenges Stacey
Theme: Ending hunger, securing food supplies and promoting good health and sustainable fisheries
 Theme: Ending hunger, securing food supplies and promoting good health and sustainable fisheries Building safe & resilient communities The UN s Sustainable Development Goal 2 seeks sustainable solutions
Agriculture in China - Successes, Challenges, and Prospects. Prof. Zhihao Zheng College of Economics & Management China Agricultural University
 Agriculture in China - Successes, Challenges, and Prospects Prof. Zhihao Zheng College of Economics & Management China Agricultural University I. Success 1. For the past three decades (1978-2010), China
Lao People s Democratic Republic
 Climate Change Country Profile: Lao People s Democratic Republic 1. Country description 1.1 Geography Area: 236 800 km 2 Borders China, Viet Nam, Cambodia, Thailand and Myanmar Consists of northern region
Disaster Risk Programme to strengthen resilience in the Dry Corridor in Central America
 Disaster Risk Programme to strengthen resilience in the Dry Corridor in Central America El Salvador-Guatemala Honduras-Nicaragua 2015-2018 FAO/Orlando Sierra CONTEXT Central America is one of the regions
City Growth in Poor Countries: Urban Dwellers Face Climate-Related Risks
 in Poor Countries: Urban Dwellers Face Climate-Related Risks Mark R. Stony Brook University and Population Council April 9, 2010 Three Trends Will Shape the 21st Century: Urbanization in Poor Countries
Agriculture is the main source of livelihood for more than two-thirds of the population.
 Agriculture is the main source of livelihood for more than two-thirds of the population. Background YEMEN Yemen has suffered from internal conflicts and clashes for several years, resulting in severe disruptions
Food Prices, Agricultural Development and Poverty
 Food Prices, Agricultural Development and Poverty Presentation to the Conference The immoral biofuel? Royal Swedish Academy for Agriculture and Forestry Stockholm, 23 October 2008 Alan Matthews Professor
ECONOMIC AND SOCIAL COUNCIL
 ECONOMIC AND SOCIAL COUNCIL Sofía Rodríguez Secretary General José Araiza Director General Marcela Treviño Crisis Director Rebeca Ponce Subsecretary of Committees Elena García Chief of Crisis Héctor Cruz
The global impacts of climate change under a 1.5 o C pathway: supplement to assessment of impacts under 2, 3 and 4 o C pathways
 The global impacts of climate change under a 1.5 o C pathway: supplement to assessment of impacts under 2, 3 and 4 o C pathways June 2016 N.W. Arnell 1, J.A. Lowe 2, S. Brown 3, D. Lincke 4, J.T. Price
Food Security, Farming, and Climate Change to 2050 Scenarios, Results, Policy Options
 Food Security, Farming, and Climate Change to 2050 Scenarios, Results, Policy Options Gerald C. Nelson Senior Research Fellow, IFPRI Theme Leader, CCAFS National Academy of Sciences May 2, 2011 Page 1
The role of agriculture in improving nutrition in Africa. Kalle Hirvonen (IFPRI ESSP, Addis Ababa)
") The role of agriculture in improving nutrition in Africa Kalle Hirvonen (IFPRI ESSP, Addis Ababa) Under-nutrition remains a problem Sub-Saharan Africa, Children under 5 years of age: 40 % are stunted 21
The role of agriculture in improving nutrition in Africa Kalle Hirvonen (IFPRI ESSP, Addis Ababa) Under-nutrition remains a problem Sub-Saharan Africa, Children under 5 years of age: 40 % are stunted 21
Space based information for health and SDGs
 Space based information for health and SDGs Expectations and needs of decision makers Bettina Menne with contributions from Marie-Eve Hereux, Pierpaolo Mudu and Tanja Wolf WHO Regional Office for Europe,
YEMEN PLAN OF ACTION. Towards Resilient and Sustainable Livelihoods for Agriculture and Food and Nutrition Security SUMMARY
 YEMEN PLAN OF ACTION Towards Resilient and Sustainable Livelihoods for Agriculture and Food and Nutrition Security 2014 2018 SUMMARY INTRODUCTION Yemen, one of the least developed countries in the world,
COMMITTEE ON WORLD FOOD SECURITY
 July 2016 CFS 2016/43/5 E COMMITTEE ON WORLD FOOD SECURITY Forty-third Session "Making a Difference in Food Security and Nutrition" Rome, Italy, 17-21 October 2016 CONNECTING SMALLHOLDERS TO MARKETS -
SAYAS FOOD SECURITY AND POLICY WORKSHOP REMARKS BY DR. SHADRACK MOEPHULI 11 April 2018
 SAYAS FOOD SECURITY AND POLICY WORKSHOP REMARKS BY DR. SHADRACK MOEPHULI 11 April 2018 Ladies and Gentlemen, In the last 50 years, the global population has increased from 3 billion to the current estimate
CHINA EMPLOYMENT AND ENVIRONMENTAL SUSTAINABILITY FACT SHEETS 2017
 CHINA EMPLOYMENT AND ENVIRONMENTAL SUSTAINABILITY FACT SHEETS 217 The Employment and Environmental Sustainability Fact Sheets series provides key features of employment and environmental sustainability
The impact of the recent food price increases on the poor and vulnerable By Fiona Remnant and Jenna Coull
 REMNANT, F. and COULL, J. 2008. The impact of food price increases on the vulnerable. Economic Review August/September. pp.49-51 The impact of the recent food price increases on the poor and vulnerable
Global Climate Change
 Global Climate Change Why Does it Matter for the CGIAR? Robert T. Watson Chairman, Intergovernmental Panel on Climate Change Chief Scientist and Director, ESSD, World Bank May 24, 2001 CGAIR Meeting Durban,