Today s Presentation Update on US LNG projects U.S. Gas Market Overview Impact of U.S. LNG on Global LNG Dynamics Sabine Pass First Cargo: 24 th Feb 2
|
|
|
- Whitney Carpenter
- 6 years ago
- Views:
Transcription

1 CHENIERE ENERGY, INC. LNG Market Outlook and US LNG s Function - The Perspective from Cheniere IEEJ 2 October 217 Andrew Walker VP Strategy and Communication

2 Today s Presentation Update on US LNG projects U.S. Gas Market Overview Impact of U.S. LNG on Global LNG Dynamics Sabine Pass First Cargo: 24 th Feb 216 2
3 Safe Harbor Statements Forward-Looking Statements This presentation contains certain statements that are, or may be deemed to be, forward-looking statements within the meaning of Section 27A of the Securities Act of 1933, as amended, and Section 21E of the Securities Exchange Act of 1934, as amended. All statements, other than statements of historical or present facts or conditions, included or incorporated by reference herein are forward-looking statements. Included among forward-looking statements are, among other things: statements regarding the ability of Cheniere Energy Partners, L.P. to pay distributions to its unitholders or Cheniere Energy Partners LP Holdings, LLC or Cheniere Energy, Inc. to pay dividends to its shareholders or participate in share or unit buybacks; statements regarding Cheniere Energy, Inc. s, Cheniere Energy Partners LP Holdings, LLC s or Cheniere Energy Partners, L.P. s expected receipt of cash distributions from their respective subsidiaries; statements that Cheniere Energy Partners, L.P. expects to commence or complete construction of its proposed liquefied natural gas ( LNG ) terminals, liquefaction facilities, pipeline facilities or other projects, or any expansions or portions thereof, by certain dates or at all; statements that Cheniere Energy, Inc. expects to commence or complete construction of its proposed LNG terminals, liquefaction facilities, pipeline facilities or other projects, or any expansions or portions then of, by certain dates or at all; statements regarding future levels of domestic and international natural gas production, supply or consumption or future levels of LNG imports into or exports from North America and other countries worldwide, or purchases of natural gas, regardless of the source of such information, or the transportation or other infrastructure, or demand for and prices related to natural gas, LNG or other hydrocarbon products; statements regarding any financing transactions or arrangements, or ability to enter into such transactions; statements relating to the construction of our proposed liquefaction facilities and natural gas liquefaction trains ( Trains ) and the construction of the Corpus Christi Pipeline, including statements concerning the engagement of any engineering, procurement and construction ("EPC") contractor or other contractor and the anticipated terms and provisions of any agreement with any EPC or other contractor, and anticipated costs related thereto; statements regarding any agreement to be entered into or performed substantially in the future, including any revenues anticipated to be received and the anticipated timing thereof, and statements regarding the amounts of total LNG regasification, natural gas, liquefaction or storage capacities that are, or may become, subject to contracts; statements regarding counterparties to our commercial contracts, construction contracts and other contracts; statements regarding our planned development and construction of additional Trains or pipelines, including the financing of such Trains or pipelines; statements that our Trains, when completed, will have certain characteristics, including amounts of liquefaction capacities; statements regarding our business strategy, our strengths, our business and operation plans or any other plans, forecasts, projections or objectives, including anticipated revenues, capital expenditures, maintenance and operating costs, run-rate SG&A estimates, cash flows, EBITDA, Adjusted EBITDA, run-rate EBITDA, distributable cash flow, and distributable cash flow per share and unit, any or all of which are subject to change; statements regarding projections of revenues, expenses, earnings or losses, working capital or other financial items; statements regarding legislative, governmental, regulatory, administrative or other public body actions, approvals, requirements, permits, applications, filings, investigations, proceedings or decisions; statements regarding our anticipated LNG and natural gas marketing activities; and any other statements that relate to non-historical or future information. These forward-looking statements are often identified by the use of terms and phrases such as achieve, anticipate, believe, contemplate, develop, estimate, example, expect, forecast, goals, guidance, opportunities, plan, potential, project, propose, subject to, strategy, target, and similar terms and phrases, or by use of future tense. Although we believe that the expectations reflected in these forward-looking statements are reasonable, they do involve assumptions, risks and uncertainties, and these expectations may prove to be incorrect. You should not place undue reliance on these forward-looking statements, which speak only as of the date of this presentation. Our actual results could differ materially from those anticipated in these forward-looking statements as a result of a variety of factors, including those discussed in Risk Factors in the Cheniere Energy, Inc., Cheniere Energy Partners, L.P. and Cheniere Energy Partners LP Holdings, LLC Annual Reports on Form 1-K filed with the SEC on February 24, 217, which are incorporated by reference into this presentation. All forward-looking statements attributable to us or persons acting on our behalf are expressly qualified in their entirety by these Risk Factors. These forward-looking statements are made as of the date of this presentation, and other than as required by law, we undertake no obligation to update or revise any forward-looking statement or provide reasons why actual results may differ, whether as a result of new information, future events or otherwise. Reconciliation to U.S. GAAP Financial Information The following presentation includes certain non-gaap financial measures as defined in Regulation G under the Securities Exchange Act of 1934, as amended. Schedules are included in the appendix hereto that reconcile the non-gaap financial measures included in the following presentation to the most directly comparable financial measures calculated and presented in accordance with U.S. GAAP.


4 LNG Trade Today A Snapshot 53 years old 264 mt (35 bcf/d) in exporting countries 4 importing countries* ~435 trading ships** ~1% of all gas consumed worldwide ~3% of internationally traded gas *including small scale importers; Norway, Sweden, Finland **excludes FSRUs, small vessels, laid-up vessels 4 Source: GIIGNL Annual Report 216, BP Statistical Review of World Energy June 217, Affinity LNG
5 Today s Presentation Update on US LNG projects U.S. Gas Market Overview Impact of U.S. LNG on Global LNG Dynamics Sabine Pass First Cargo: 24 th Feb 216 5
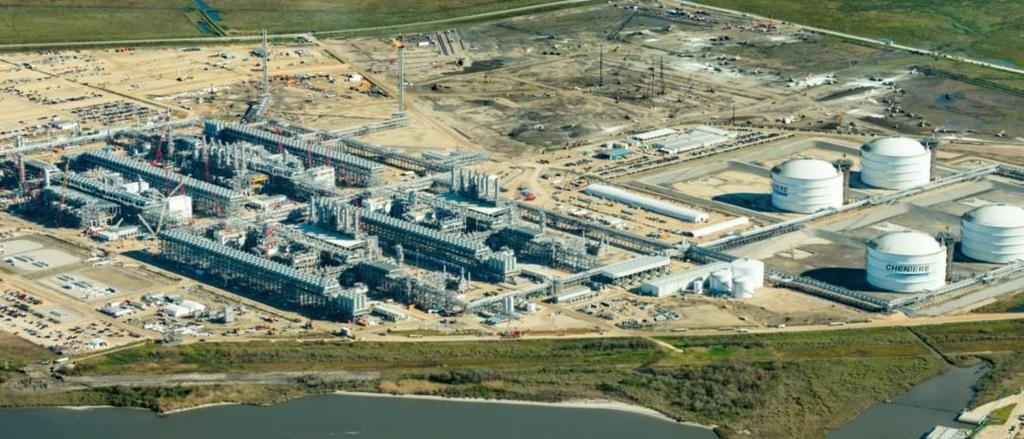
 Corpus Christi LNG Terminal Trains 1 and 2 are under construction First LNG expected in late")
6 Cheniere LNG Platform Along United States Gulf Coast Sabine Pass Liquefaction Project Trains 1-4 substantial completion achieved Train 5 is under construction Train 6 is fully permitted, ready to commercialize Land secured for further expansion First operational lower-48 export facility (Sabine Pass) Corpus Christi LNG Terminal Trains 1 and 2 are under construction First LNG expected in late 218 Train 3 is fully permitted and being commercialized Trains 4-5 (or mid-scale equivalent) : Initiated development Land secured for further expansion First greenfield export project under construction (Corpus Christi) 7 train platform (operating / under construction) = 31.5 mtpa Cheniere now the largest gas consumer in the U.S. 6

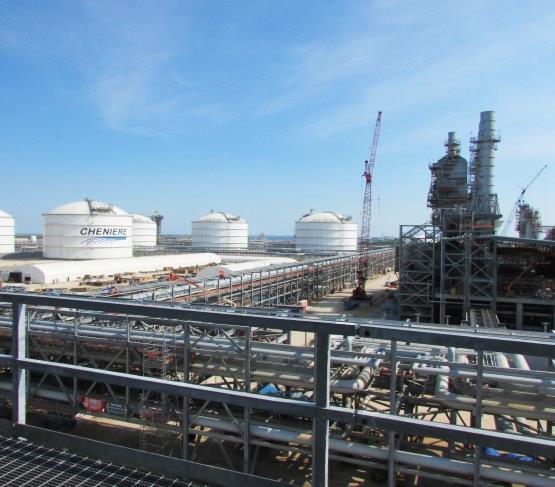
7 Sabine Pass Liquefaction Project 7

8 Sabine Pass Liquefaction 2Q 217 8

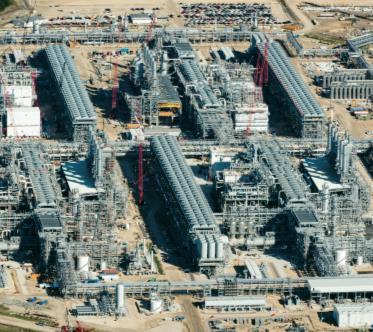
9 Corpus Christi Liquefaction 2Q 217 9


10 Cheniere LNG Projects: Attractive Features Cheniere LNG SPAs: LNG price tied to Henry Hub, offer destination flexibility, upstream gas procurement services, no lifting requirements SPAs with investment grade off-takers featuring parent as counterparty or guarantor & pricing with HH + fixed fee (no price reopeners) EPC contractor: proven track record of execution; proven liquefaction technology Sabine Pass Customers BG Gulf Coast LNG Gas Natural Fenosa Korea Gas Corporation GAIL (India) Limited Total Gas & Power N.A. Centrica plc Corpus Christi Customers PT Pertamina Gas Natural (Persero) Endesa S.A. Iberdrola S.A. Fenosa Woodside Energy Trading Électricité de France EDP Energias de Portugal S.A. 1
11 U.S. LNG Capacity Under Construction Cheniere Export Project Non-Cheniere Export Project Cameron Cameron LNG T3 LNG T3 Cameron LNG T2 Cameron LNG T2 Freeport Freeport LNG T3 LNG T3 Sabine Sabine Pass T5 Pass T5 Freeport Freeport LNG T2 LNG T2 MTPA Cameron Cameron LNG T1 LNG T1 Corpus Christi T2 Corpus Christi T1-2 Corpus Christi T1 Elba Island Phase 2 Elba Island Phase 2 Freeport Freeport LNG T1 LNG T1 Elba Island Phase 1 Elba Island Phase 1 Cove Point Cove Point 1 Sabine Pass T1-4 Sabine Pass T1-4 - Jan-16 Jan-17 Jan-18 Jan-19 Jan-2 Source: Cheniere Research estimates for first export. Actual start dates may differ depending on construction schedules 11
12 US LNG - A Wide Range of Customers MTPA Portfolio Composition of Major Buyers (22) Non-US Supply US Supply % US supply Share of US supply in net portfolio 1% 9% 8% 7% US FOB off-takers by type Asian end-user e.g. Chubu 33% European end-user e.g. Iberdrola 9% 15% European buyer; domestic / portfolio % 5% 4% 3% Asian reseller e.g. Mitsui 17% 26% e.g. Shell e.g. GNF Portfolio player 5-2% 1% % ~5% sold to Asian entities ~42% sold to end-users Of 58 % sold to resellers; at least 57% resold / allocated Source. Cheniere interpretation of Wood Mackenzie Data (217). Top 15 portfolios shown. Volumes are net of re-sales. 12
13 Current Status of US LNG Projects Note: Excludes Alaska FERC Status (as of September 217) Corpus Christi 4-5 G2 LNG Jordan Cove * Fourchon Commonwealth 33 Gulf LNG Venture Global (Calcasieu) Texas LNG Brownsville Rio Grande LNG Annova LNG Port Arthur LNG Eagle LNG Venture Global (Plaquemines) Driftwood LNG Freeport mtpa online 53.5 mtpa under construction over 3 mtpa proposed mtpa Lake Charles CC T3 SP T6 Cameron T4/5 Magnolia Golden Pass 56 SP T1-5 Cameron T1-3 Freeport T1-3 Cove Point CC T1-2 Elba 5 67 Total No FERC filing Pre-filed Formal filing Approved FID Source: US FERC, US DOE, and press reports *Previously denied by FERC and had to re-file 13
14 Projected Company Ranking by LNG Sales in 22 On Track to Be a Top-5 Seller Less Than 5 Years After First Cargo 6 Projected Top LNG Suppliers by Company - 22 Volumes for Projects Existing and Under Construction 5 4 mtpa Source: Cheniere Research, Wood Mackenzie Note: volumes include equity LNG, third-party offtake and own project offtake. Tolling facility production reflected in offtaker volumes. 14
15 Today s Presentation Update on US LNG projects U.S. Gas Market Overview Impact of U.S. LNG on Global LNG Dynamics Sabine Pass First Cargo: 24 th Feb
16 Shale Gas has Doubled U.S. Natural Gas Resources Since 26 Total U.S. future gas supply (reserves + resources) stands at record 3,141 Tcf Represents 1+ years of current domestic needs U.S. future supply of natural gas Tcf Shale accounts for 64% of U.S. Gas Resources Date of outlook Non-shale Shale EIA Proved Reserves 16 Source: Potential Gas Committee, 217; EIA (Proved Reserves)
17 And Has Fundamentally Reset Price Expectations Break-even price at Henry Hub for North American natural gas resources Henry Hub Natural Gas Price Average break-even Henry Hub price ($/MMBtu) <$3./mmBtu = 25 years supply at 215 production levels $/MMBtu Futures , 1,5 2, Tcf Actuals Source: EIA Historical Henry Hub to Oct. 217, NYMEX Henry Hub Futures as of Oct.11,
18 U.S. Natural Gas Production Total U.S. Natural Gas Marketed Production 216: 78 Bcf/d : 62 Bcf/d -1 Bcf/d +26 Bcf/d 25: 52 Bcf/d Shale Shale Wells Supplied 51% of US Gas in Bcf/d 4 3 Non-Shale Source: EIA Natural Gas Monthly Sept
19 Supply and Demand since 25 Supply Consumption Bcf/d Shale Gas Production (Bcf/d) Marketed Production Growth 25 to (3.4 pa) Other Shale Marcellus+Utica Haynesville (LA & TX) Eagle Ford (TX) Fayetteville (AR) Barnett (TX) Woodford (OK) Bakken (ND & MT) (annual average growth ) (-1. pa) -11 Unconventional Conventional Net Shale Gas Production 26 (2.4 pa) Bcf/d Incremental natural gas consumption Source: EIA -3 Residential Industrial Power Pipeline Exports *Base Year 25 LNG Exports 19
20 Dry Gas Growth Will Be Driven By Marcellus/Utica, Permian & Haynesville Cumulative Production Growth from mid Nearly 9 Bcf/d net growth expected through year-end 219 Haynesville 7 Bcf/d 5 Permian 3 1 Marcellus, Utica (1) all other (3) Jul-217 Nov-217 Mar-218 Jul-218 Nov-218 Mar-219 Jul-219 Nov Source: Spring Rock; Cheniere Research
21 Current Production Growth Supported By Prices Below $3.5 Henry, $6 Oil US Gas Rigs vs. NYMEX cal-218 Henry Hub strip US oil rigs vs. NYMEX cal-218 WTI strip Henry Hub 218 Calendar Strip US Gas Directed Rig Count WTI 218 Calendar Strip US Oil Directed Rig Count Henry Hub (USD/MMBtu) Rig Count WTI (USD/Bbl) Rig Count Permian oil rig deployments support associated gas production Jan-16 Jul-16 Jan-17 Jul Jan-16 Jul-16 Jan-17 Jul-17 Source: NYMEX, Baker Hughes 21
22 Northeast Output Will Soon Be Unconstrained By Pipeline Infrastructure Incremental pipeline projects will provide up to 7 Bcf/d of additional market access by early 218 Additional 6 Bcf/d takeaway capacity is expected to enter service from mid-218 through year-end 219 Northeast US Dry Natural Gas Production vs. Pipeline Takeaway Capacity Marcellus/Utica production in New York, Ohio, Pennsylvania, West Virginia 4 35 Production Pipeline Capacity Production temporarily constrained 3 Bcf/d Bcf/d growth projected from mid-218 to year-end Source: Spring Rock; Cheniere Research
23 EIA U.S. Outlook to 24 Gas production outlook Gas consumption outlook EIA base case sees dry gas growing 31 Bcf/d from 216 U.S. Gas demand grows at 1.5% CAGR Shale gas will be 67% of total dry gas production Incremental Natural Gas Consumption by 24 Gas production grows at 1.5% CAGR through 24 Forecasted U.S. Dry Gas Marketed Production 12 Shale EIA Forecast Non-Shale Residential demand has peaked; population shift to warmer climates & efficiency gains Industrial; low prices stimulate.9% demand CAGR Power at forecast prices; gas displaces coal in power gen. driving.4% CAGR Bcf/d 6.5 Bcf/d Source: EIA AEO Residential Industrial Power Pipeline *Base Year 216 Exports LNG Exports 23
24 EIA Price Outlook for Henry Hub and WTI 3 25 EIA Forecast $/MMBtu (nominal) 2 15 WTI AEO 216 AEO HH AEO 216 AEO Source: EIA Annual Energy Outlook 216,217; Note: Actuals to 216 from EIA


25 U.S. Natural Gas Production Continues to Evolve Recent evolution Larger wells: average initial production (IP) rates have more than tripled since 29 Longer laterals: average horizontal feet drilled in Marcellus have doubled since 29 Multi-stage fracking: producers have increased number of stages used in hydraulic fracturing process Innovation: operational efficiencies improving drill times Future evolution - continued technological advances to reduce costs and increase efficiencies Data processing, better software modelling and real time monitoring to help with well spacing, space staging, completion engineering Enhanced recovery factors by experimenting with pump fluids and recovery methods Targeted and steered drilling to make more precise cuts into deep terrain Extracting from multiple benches of production within same play Non-intrusive technologies such as micro-seismic geophones and electromagnetics. 25
26 Today s Presentation Update on US LNG projects U.S. Gas Market Overview Impact of U.S. LNG on Global LNG Dynamics Sabine Pass First Cargo: 24 th Feb
27 LNG: A High Growth Industry 3 LNG trade growth by importing region Other 25 North America 2 Europe Asia Pacific CAGR 9% / 16 mtpa mtpa 15 CAGR 7% / 9 mtpa 1 CAGR 8% / 4 mtpa Source: IHS Markit (217) 27
28 Commercial Evolution Underway in Contract Length LNG trade by contract length 3 Bilateral deals Slow evolution Growing flexibility 25 2 Spot & short-term trade* Prompt ** (15% - 18%) 28% mtpa Mid & long-term contract trade 72% * Contract duration of 4 years or less (GIIGNL) ** Prompt = delivered within 3 months of transaction date Source: CEDIGAZ World Outlook for (assumes no spot volume), Poten and Partners (21), GIIGNL (216) 28
29 Europe s Balancing Role in the LNG market mtpa 3 Market loosening Market tightening Market Stable 25 Supply outpacing Asia demand growth Asia demand growth outpacing supply LNG volumes flow in Europe Europe decants volumes Europe MENA Latin America 15 1 Asia Pacific 5 US/Canada Source: Cheniere interpretation of IHS Waterborne data (Apr 216), delivered volumes 29
30 LNG Supply vs. Demand to Production capacity 215/ 22 [1] 22 LNG trade forecast 215 to 23 CAGR(%) = mtpa New supply USA mtpa 3 Australia 2 Qatar Supply: existing and under construction Source: Cheniere Research estimates; Woodmac for historical figures 3
31 LNG Import Outlook by Region mtpa Asia and Middle East mtpa Atlantic Basin 4 Bunkers Asia 4 Bunkers Atlantic Middle East Other Asia China India JKT Other Asia Africa Europe N. America S. America 2 China 2 15 India JKT 5 Europe S. America Source: Cheniere Research, Cheniere interpretation of Wood Mackenzie data (Q4 216) 31
32 Opportunities and Challenges for Gas and LNG in Asia Opportunities Demand for gas in Asia set to nearly triple over coming decades New markets, new buyers and new demand segments for LNG emerging in the region A more liquid and more responsive global LNG trade will make gas more attractive But gas growth in Asia should not be taken for granted.. Bcm Gas Demand* Asia Growth vs. 214 ~16% Challenges Demand uncertainty a common theme across Asia as energy transition and market liberalisations gather pace 2 1 Rest of World Europe, Latin America. MENA, N. America, Sub- Saharan Africa ~4% Some new markets will require help with the commercial or technical aspects of LNG Coal likely to remain cheap and tempting WEC Energy Outlook ( Modern Jazz Scenario) Gas needs to prove it is affordable, reliable and secure 32 * Source WEC Energy Scenarios 216
33 Market Context Market context for LNG buyers has been evolving in recent years Growing Supply Availability Increasing market length through 219 (+) Some portfolio players looking to reduce own length Expectations of growing liquidity / spot availability Healthy slate of potential new supply projects Growing Price Uncertainty Reducing Oil Indexation Levels;.16 at peak falling to ~.115 now Oil price uncertainty Inversion of Spot, Oil-indexed and HH-indexed prices; Growing Demand Uncertainty Liberalising markets: new players, increasing market competition Changing fuel mix outlook: fall of nuclear and coal, rise of renewables Domestic gas balance; maturing fields, unconventional gas uncertainty Buyers looking to rebalance their purchase portfolios to include greater spot / ST volumes 33
34 Contracting behaviour reacting to changing market environment Lower Overall Sales ACQ (mmtpa) Market Length H % Reaction to 15 Full year? Shorter Duration Contracts ACQ (mmtpa) Reaction to Market Uncertainty H1 217 < 5 years 5-1 years 2 years Mov. Av. (RHS) Average length (yrs) Lower HH Sales ACQ (mmtpa) H1 217 Henry Hub Share of total Reaction to Price Uncertainty 45% 35% 25% 15% 5% -5% Share of total (%) Smaller Volume Contracts ACQ (mmtpa) Reaction to Market Uncertainty H1 217 <1 mmtpa 1 to <2 mmtpa 2 years Mov. Av. (RHS) Average volume (mmtpa) Source: Cheniere interpretation of Wood Mackenzie data (217) Are these changes structural or cyclical? 34 34
35 LNG trade is diversifying and fragmenting Supply Markets BG Group interpretation of Wood MacKenzie and IHS data (215) *each country considered a single supplier / buyer. Market categories for HHI: US Department of Justice 35

36 U.S. LNG Exports Driving Change in the Industry Destination-free, flexible volumes Growing liquidity FOB and DES hub formation New markets facilitated by abundant, competitively priced gas A more responsive, more competitive more diverse and more resilient LNG trade system 36

 US Cargoes / month (Left Axis) No of companies lifting US LNG (Right Axis)")
37 Benefits of U.S. LNG exports Largescale resource base with strong Government support for exports Tcf U.S. Future Supply of Natural Gas (1) Diversification from oil indexation Non-shale Shale EIA Proved Reserves LNG Contracts by Price Index (3) 7+ flexible U.S. cargoes per month by 22 - underpinning growing industry liquidity Cargoes / Month U.S. Supply & FOB Customers (2) US Cargoes / month (Left Axis) No of companies lifting US LNG (Right Axis) J A J O J A J O J A J O J A J O J A J O Inter-project competition driving innovation No. of FOB Customers mtpa Henry Hub Europe gas Hybrid Oil LNG demand LNG trade forecast HH index 1 Oil index Mid-scale trains Visualization of possible mid-scale trains at Corpus Christi - Source: Cheniere U.S. LNG driving change in the industry 37 Source: (1) Potential Gas Committee, 217; EIA (Proved Reserves), (2) Cheniere Research, Primary FOB Customers Only, 1% UF, 17, cm vessel (3) Cheniere interpretation of Wood Mackenzie data (Q1 217)
38 Destination of Sabine Pass Cargoes Since Start Up, More than 19 Cargoes Loaded and Delivered to 25 Countries London, U.K. Houston, TX Washington, DC Mexico Dominican Republic Poland, Lithuania, Netherlands, United Kingdom Portugal, Spain Italy, Malta, Egypt, Turkey, Jordan Kuwait, UAE, Pakistan Beijing, China India, Thailand China, Taiwan Singapore Japan, South Korea Tokyo, Japan Santiago, Chile Brazil EUROPE 14% MENA 15% ASIA 3% Chile LATIN AMERICA 41% Cheniere LNG Facility Cheniere Office Cargo Delivery Destination Argentina Sabine Pass Exports By Destination Region (Since Startup (1) ) Sources: Cheniere Research, Kpler MENA Middle East North Africa (1) Date reflects cargo loading date until September 28, 217, representing all cargoes that have loaded and discharged.
39 LNG Trade Figures H1 217 Regional imports balance H1 217 (Year-over-year) 8 Growth by Supply Country H1-217 (YoY) 7.8 Top 5 growth Bottom 5 growth mtpa Australia US Angola Nigeria Malaysia Oman UAE Norway Trinidad Indonesia mtpa Supply Asia MENA Source: Waterborne IHS data, delivered volumes Lat Am N.America 4.9 M.Europe -1.8 N.Europe mtpa Growth by Import Country H1-217 (YoY) 4.2 China Top 4 growth Japan S.Korea 3.3 M.Europe Spain Italy Portugal France Argentina Bottom 4 growth Lithuania Brazil -2.1 UK 39
40 Global Gas Prices (as of 1/1/217) 25 Q4 17 Q1 18 Cal Asia Spot LNG Asia L-T Contract Proxy Brent $56 /bbl $56 /bbl $56 / bbl JKM $7.72 $8.6 $6.95 TTF $6.21 $6.36 $5.97 HH $2.99 $3.19 $3.2 Forward Curves $/MMBtu 1 Oil parity 1 TTF 5 5 Henry Hub Note: Asia L-T Contract Proxy = 14.85% Japan Crude Cocktail (3-month average)+ $.5/MMBtu; same formula is used with Brent crude oil prices for forward curves 4 Source: Bloomberg, CME, ICE, Platts, Japan Ministry of Finance, Cheniere Research
41 Global LNG balance 215 to Aug 217 MT/month Rising supply not yet overflowing into N. Europe Supply: Australia + US Imports: UK + Netherlands + Belgium Where did the incremental global supply go? ~6 MT Source: Waterborne Data, Graph based on Akos Losz/ Teddy Kott CGEP (217) Incremental imports since 214 Others +ve China Egypt India Jordan Pakistan Spain Thailand Taiwan UAE Italy France Others -ve Mexico South Korea Brazil Japan MT imported Jan 215 to Aug 217 above 214 levels Note: countries with less than +/-3 mt increment were aggregated +1 MT -4 MT Net ~6 MT 41
42 1 Ways U.S. LNG is Changing the Global Market 1. Significant new supply source reduces the market power of incumbents 2. Competitive cost sets price marker for new LNG supplies 3. Transparent pricing improves price discovery 4. Destination flexible supply reduces the rigidity of current trade 5. Growth in liquidity will result in development of trading and risk management tools 6. and aid the formation of LNG trade hubs in Asia 7. Volume flexibility provides buyers a safety valve on supply commitments 8. HH indexed pricing weakens the influence of oil price on the global gas market 9. HH pricing construct reduces pricing volatility 1. Increasing influence of US energy diplomacy Flexibility Liquidity Transparency A more competitive and resilient trade system 42
43 Will a Liquid Hub for LNG Form Over the Next Decade? Drivers Significant supply at open market location (USGC) LNG & gas hub initiatives in Asia New players interested in new instruments Increase in flexible supply Any significant disconnect between spot and term prices Inhibitors Limited buyer-seller alignment Current low industry liquidity Lack of consensus on location for an Asian LNG hub Market access Deregulated Pricing Multiple Buyers / Sellers Existing long-term contracts Established pricing indexes Quality constraints Storage constraints Financing secured through long-term oil indexed / HH-plus contracts Inhibitors will likely not stop Asian hubs from forming but will determine pace and location of hub developments 43
44 Slowdown in FIDs mtpa FIDs per annum Qatar Hiatus Australia US Hiatus Other Aus US Qatar 44 Source: Cheniere interpretation of Wood Mackenzie data (Q1 217)
45 U.S. LNG Advantaged by Low Costs Break-even price at Henry Hub for North American natural gas resources 12 $3, Liquefaction plant EPC* costs Reported Planned Grassroots Average break-even Henry Hub price ($/MMBtu) <$3./mmBtu = 25 years supply at 215 production levels Specific EPC Cost (216 $/tpa) $2,5 $2, $1,5 $1, $5 Expansion Australia FLNG USA Canada , 1,5 2, Tcf FID Date *Engineering, procurement and construction costs for liquefaction plant. Does not include upstream development, pipelines or financing and owner s costs. Source: IHS Energy : Shale Gas Reloaded (216) Source: Poten & Partners 45
46 Long-Term LNG Price Outlook (EIA) 25 Actual = forward curve Industry Consultant Forecasts Oil Volatility Indicator $/mmbtu (nominal) JKM Spot Price US LNG Range of prices: Oil Linked LNG* JKM 5 HH *midpoint of range Note: prices are annual averages 46 Sources: Actuals - Platts, Heren, IPE, Petroleum Association of Japan and Bloomberg (Apr 216); Forecasts EIA, Wood Mackenzie, IHS CERA, and PIRA (216)
47 Benefits of US LNG for Asian Buyers Price competitiveness Largescale, low-cost gas resource HH-plus price structure De-linked from oil Price stability Reduced volatility from fixedcomponent Buyer control Destination flexible volumes to manage demand uncertainty and / or build trading platform Sabine Pass First Cargo: 24 th Feb 216 Reliability Largescale, nationwide resource base 47
48 New LNG Market Realities New market realities Fragmenting / Evolving market place Globalising / Commoditising industry with regional nature Supplier challenge: how to lower cost, innovate & create new markets will require new commercial solutions but will also have to be financeable New contract structures: price index, term, flexibility 48
49 Summing Up Flexible U.S. LNG ramping up and responding to global market signals U.S. LNG has already changed the industry. Providing buyers with; Price diversification and transparency Destination flexibility Increased supply availability and market competition A sustainably low-cost supply over the long-run And is set to drive further change Growing liquidity / hub formation / price discovery Resulting in a more competitive and more resilient trade system Buyers can enjoy and capitalize on these functions of U.S. LNG in a direct manner But Buyers and Sellers will have to work together to achieve the commercial bargain required to bring on new supply under current low-price conditions Cheniere able to move quickly to expand its platform with two permitted brownfield trains, plus enough land at both sites to allow for significant further expansion 49

50 Thank You 5 Contact :report@tky.ieej.or
CHENIERE ENERGY, INC. How is the Rest of the World s LNG Interfacing With Europe?
 CHENIERE ENERGY, INC. How is the Rest of the World s LNG Interfacing With Europe? European Gas Conference - Vienna Andrew Walker VP LNG Strategy January 23, 18 2 Safe Harbor Statements Forward-Looking
CHENIERE ENERGY, INC. Louisiana Energy Conference. June 2016
 CHENIERE ENERGY, INC. Louisiana Energy Conference June 2016 Forward Looking Statements This presentation contains certain statements that are, or may be deemed to be, forward-looking statements within
CHENIERE ENERGY, INC.
 CHENIERE ENERGY, INC. Factors Affecting Global Coal-Gas Competition NGI Workshop - Global Competition Between Coal and Natural Gas October 15th 218 Najla Jamoussi Director, Market Fundamentals & Corporate
Safe Harbor Statements. CHENIERE ENERGY, INC. NYSE American: LNG CHENIERE ENERGY, INC. The LNG market: new opportunities and challenges
 IEEJ:December 18 IEEJ18 CHENIERE ENERGY, INC. The LNG market: new opportunities and challenges 23 rd International Gas and Power Summit, Paris. November 22, 18 Eric Bensaude Managing Director Commercial
US LNG Supply into Europe. Baltic Energy Summit, Vilnius November 25 th, 2015 Helena Wisden, Cheniere Marketing International
 US LNG Supply into Europe Baltic Energy Summit, Vilnius November 25 th, 2015 Helena Wisden, Cheniere Marketing International Forward Looking Statements This presentation contains certain statements that
CHENIERE ENERGY, INC.
 CHENIERE ENERGY, INC. THE GAS PACKAGE - THE ROLE OF US LNG European Parliament Public Hearing Andrew Walker Vice-President, Strategy, Cheniere Marketing May 23, 2016 Forward Looking Statements This presentation
Cheniere Energy Partners, L.P. / Cheniere Energy, Inc. Proposed Sabine Pass LNG Facility Expansion Adding Liquefaction Capabilities.
 Cheniere Energy Partners, L.P. / Cheniere Energy, Inc. Proposed Sabine Pass LNG Facility Expansion Adding Liquefaction Capabilities June 4, 2010 Forward Looking Statements This presentation contains certain
LNG Exports: A Brief Introduction
 LNG Exports: A Brief Introduction Natural gas one of the world s most useful substances is burned to heat homes and run highly-efficient electrical powerplants. It is used as a feedstock in the manufacture
Global LNG Market dynamics, key trends and market outlook
 REUTERS / Anne Kat Brevik Global LNG Market dynamics, key trends and market outlook December 14, 217 What to address Market dynamics, key trends and market outlook The role and outlook for U.S. LNG China
Forward Looking Statements This presentation contains certain statements that are, or may be deemed to be, forward looking statements within the meani
 Outlook for U.S. LNG Exports METI, Japan LNG Producer Consumer Conference Charif Souki CEO, Cheniere Energy Inc. Forward Looking Statements This presentation contains certain statements that are, or may
ROYAL DUTCH SHELL PLC LEADER IN GLOBAL GAS
 ROYAL DUTCH SHELL PLC LEADER IN GLOBAL GAS DEFINITIONS AND CAUTIONARY NOTE Resources: Our use of the term resources in this announcement includes quantities of oil and gas not yet classified as Securities
LNG Shipping: How Long Will The Good Times Last?
 LNG Shipping: How Long Will The Good Times Last? Poten & Partners November 1 HOUSTON NEW YORK LONDON ATHENS SINGAPORE GUANGZHOU PERTH A GLOBAL BROKER AND COMMERCIAL ADVISOR FOR THE ENERGY AND OCEAN TRANSPORTATION
Outlook for Gas Markets
 IEEJ IEEJ:Published 2015 年 7 in 月 August 禁無断転載 2015 All rights reserved The 420th Forum on Research Work July 10, 2015 Outlook for Gas Markets The Institute of Energy Economics, Japan Tetsuo Morikawa Manager,
The Case for Investing in LNG Export Terminals in the US. Marine Money 2017 Meg Gentle, CEO
 The Case for Investing in LNG Export Terminals in the US Marine Money 2017 Meg Gentle, CEO June 19, 2017 Cautionary statement Forward looking statement Non-GAAP Financial Measures The information in this
CHENIERE ENERGY, INC.
 CHENIERE ENERGY, INC. U.S. LNG in the new energy price environment January 2016 Forward Looking Statements This presentation contains certain statements that are, or may be deemed to be, forward-looking
Gas Markets in 2015: Outlook and Challenges
 The 418th Forum on Research Work Gas Markets in 2015: Outlook and Challenges December 19, 2014 Tetsuo Morikawa The Institute of Energy Economics, Japan Natural Gas Demand in Major Regions Natural Gas Demand
Summary LNG, an increasingly important energy option in Asia and the rest of the world But challenges remain for LNG to play an expected bigger role S
 Prospect and Challenges in the World and Asian LNG Market LNG Producer Consumer Conference September 19, 2012 The Institute of Energy Economics Japan Ken Koyama 0 Summary LNG, an increasingly important
U.S. Natural Gas and the Poten3al for LNG Export Growth
 U.S. Natural Gas and the Poten3al for LNG Export Growth Presentation to: 2018 Wyoming Oil & Gas Fair By: John Harpole September 12, 2018 It is not a scarce resource anymore 2 US RIG COUNTS: Aug 2018 vs
The Evolving Global LNG Industry South Africa Gas Options, Cape Town, 3 rd 5 th October 2016
 The Evolving Global LNG Industry South Africa Gas Options, Cape Town, 3 rd 5 th October 2016 John Mauel Head of Energy Transactions, United States Norton Rose Fulbright US LLP An industry in transformation
U.S. Natural Gas and the Potential for LNG Export Growth
 U.S. Natural Gas and the Potential for LNG Export Growth Presentation to: 2018 Wyoming Oil & Gas Fair By: John Harpole September 12, 2018 It is not a scarce resource anymore 2 US RIG COUNTS: Aug 2018
Changes in Dynamics and Pricing of LNG in the Atlantic Basin
 Changes in Dynamics and Pricing of LNG in the Atlantic Basin Andrew Williamson Head of LNG Supply, Commercial Operations & Trading Vienna, 29 January 2018 OMV Gas & Power Agenda Changes in Dynamics and
The Shale Invasion: Will U.S. LNG Cross the Pond? New terminals ramp up exports.
 ? The Shale Invasion: Will U.S. LNG Cross the Pond? New terminals ramp up exports. Morningstar Commodities Research 6 December 2016 Sandy Fielden Director, Oil and Products Research +1 512 431-8044 sandy.fielden@morningstar.com
Shale Gas and U.S. LNG Exports. Vienna, January 29, 2013 Jean Abiteboul President, Cheniere Supply & Marketing
 Shale Gas and U.S. LNG Exports Vienna, January 29, 2013 Jean Abiteboul President, Cheniere Supply & Marketing Forward Looking Statements This presentation contains certain statements that are, or may be
RIM LNG Trade Annual 2010 Edition
 RIM LNG Trade Annual 2010 Edition -Contents Volume 1 = Liquefacation Terminals in the world 1. Liquefacation Terminals in Asian Pacific Region 1 United states of America(Alaska) 2 Brunei 3 Indonesia 4
CHENIERE ENERGY, INC.
 CHENIERE ENERGY, INC. * Sabine Pass LNG, L.P. Cheniere Energy Partners, L.P. Cheniere Energy, Inc. 91% *Corpus Christi LNG, LLC Cheniere Energy, Inc. 100% *Creole Trail LNG, L.P. Cheniere Energy, Inc.
Natural Gas Supply, Demand, and the Prospects for North American LNG Exports
 Natural Gas Supply, Demand, and the Prospects for North American LNG Exports December 3 rd, 2014 Robert D. Stibolt Senior Managing Director Observations on natural gas prices and project returns Price
North American Gas: A dynamic environment. Josh McCall BP North American Gas and Power November 16, 2011
 North American Gas: A dynamic environment Josh McCall BP North American Gas and Power November 16, 2011 Disclaimer Copyright BP Energy Company. All rights reserved. Contents of this presentation do not
NARUC. Global Liquefied Natural Gas Supply: An Introduction for Public Utility Commissioners
 2009 Global Liquefied Natural Gas Supply: An Introduction for Public Utility Commissioners NARUC October 2009 The National Association of Regulatory Utility Commissioners Funded by the U.S. Department
LNG Projects & Markets Past, Present & Challenges Ahead
 LNG Projects & Markets Past, Present & Challenges Ahead Presented by: Don Andress Mostefa Ouki Nexant [Part 2: Markets, Past, Present & Challenges Ahead] United States Association for Energy Economics
World LNG Report industry trends-
 World LNG Report-218 -industry trends- Satoshi Yoshida General Manager, International Section, Policy and Planning Department Japan Gas Association International Gas Union (IGU) Who we are Founded in 1931,
Gas Markets Globalization: Perspectives and Limits
 Gas Markets Globalization: Perspectives and Limits By: Sid Ahmed Hamdani, Senior Business Analyst, Sonatrach, Algeria Date:04 June 2012 Venue: Kuala Lumpur Towards Gas Market Globalization? Increasing
The Impact of US LNG Exports on India s Gas Market Jason Bordoff
 The Impact of US LNG Exports on India s Gas Market Jason Bordoff November 30, 2016 Delhi, India US Natural Gas Outlook 2 US Shale: There Will Be Gas US Dry Gas Production Under the EIA s Reference Case
The impact of US LNG on European gas prices
 January 2018 The impact of US LNG on European gas prices Increasing US exports of LNG will change how gas prices are determined in Europe Import dependency for the European Union, pushed higher as a result
Comparison of Netbacks from Potential LNG Project with ALCAN Pipeline Project
 Comparison of Netbacks from Potential LNG Project with ALCAN Pipeline Project June 20, 2008 Barry Pulliam Senior Economist Econ One Research 5th Floor 601 W 5th Street Los Angeles, California 90071 213
LNG strategy and the outlook for global gas markets
 LNG strategy and the outlook for global gas markets October 16 th, 2012 Jean-Marie Dauger Executive Vice-president GDF SUEZ The LNG market Strong growth particularly in Asia An LNG market of ~550 Mt in
Lecture 12. LNG Markets
 Lecture 12 LNG Markets Data from BP Statistical Review of World Energy 1991 to 2016 Slide 1 LNG Demand LNG demand is expected to grow from China, India and Europe in particular. Currently biggest importer
LNG Market in Asia. - A Japanese Perspective on the LNG Industry - October 14 th, Industry Research Department
 LNG Market in Asia - A on the LNG Industry - October 14 th, 216 Industry Research Department Copyright (c) Mizuho Bank, Ltd. All Rights Reserved. Contents 1 Energy Policies in Japan P. 2 2 P. 9 3 P. 15
An Overview of U.S. Liquefied Natural Gas Exports
 Executive Brief An Overview of U.S. Liquefied Natural Gas Exports Executive Summary The world is competing for the tremendous advantage offered by affordable U.S. natural gas. Relative to globally expensive
AIChE: Natural Gas Utilization Workshop Overcoming Hurdles of Technology Implementation
 AIChE: Natural Gas Utilization Workshop Overcoming Hurdles of Technology Implementation Natural Gas in the United States: An Overview of Resources and Factors Affecting the Market November 2, 216 Justin
[LNG MARKET ANALYSIS ] 1. LNG Market Analysis
![[LNG MARKET ANALYSIS ] 1. LNG Market Analysis](/thumbs/82/85327793.jpg "[LNG MARKET ANALYSIS ] 1. LNG Market Analysis") [LNG MARKET ANALYSIS ] 1 LNG Market Analysis LNG Market Analysis Volume: 6 th April 2018 [LNG MARKET ANALYSIS ] 2 LNG and Natural Gas Price Assessment 26 th March 6 th April 2018 LNG Analysis Global LNG
[LNG MARKET ANALYSIS ] 1 LNG Market Analysis LNG Market Analysis Volume: 6 th April 2018 [LNG MARKET ANALYSIS ] 2 LNG and Natural Gas Price Assessment 26 th March 6 th April 2018 LNG Analysis Global LNG
Rice Global E&C Forum
 Rice Global E&C Forum "Will Shale revolution trigger game changes in Asian Energy Market and LNG?" Tevin Vongvanich President and Chief Executive Officer PTT Exploration and Production Public Company Limited
EVA S QUARTERLY LNG OUTLOOK
 EVA S QUARTERLY LNG OUTLOOK LNG Webinar Dustin Meyer Lead LNG Analyst! Arlington, VA ENERGY VENTURES ANALYSIS 1901 N. Moore St., Suite 1200 (703) 276 8900 Arlington, VA 22209 www.evainc.com OUTLINE 1.
Natural Gas Abundance: The Development of Shale Resource in North America
 Natural Gas Abundance: The Development of Shale Resource in North America EBA Brown Bag Luncheon Bracewell & Giuliani Washington, D.C. February 6, 2013 Bruce B. Henning Vice President, Energy Regulatory
IPTC MS The Outlook for LNG Supply to Asia. Stuart Traver, Lalitha Seelam and Nick Fulford Baker Hughes Inc. and Gaffney, Cline & Associates
 IPTC 17774 - MS The Outlook for LNG Supply to Asia Stuart Traver, Lalitha Seelam and Nick Fulford Baker Hughes Inc. and Gaffney, Cline & Associates Slide 2 2013 GLOBAL NATURAL GAS TRADE Units: billion
[LNG MARKET ANALYSIS ] 1. LNG Market Analysis
![[LNG MARKET ANALYSIS ] 1. LNG Market Analysis](/thumbs/83/87599992.jpg "[LNG MARKET ANALYSIS ] 1. LNG Market Analysis") [LNG MARKET ANALYSIS ] 1 LNG Market Analysis LNG Market Analysis Volume: 8 th June 2018 LNG and Natural Gas Price Assessment 28 th May 8 th June 2018 [LNG MARKET ANALYSIS ] 2 LNG Analysis Stable to bullish
[LNG MARKET ANALYSIS ] 1 LNG Market Analysis LNG Market Analysis Volume: 8 th June 2018 LNG and Natural Gas Price Assessment 28 th May 8 th June 2018 [LNG MARKET ANALYSIS ] 2 LNG Analysis Stable to bullish
Will the growth of LNG create a global gas market?
 Will the growth of LNG create a global gas market? Chris Evans Vice President Global LNG Supply Shell Gas & Power FLAME, Amsterdam 25 th February 25 Increasing choice for consumers and producers Environmental
SHELL LNG OUTLOOK 218 DEFINITIONS & CAUTIONARY NOTE Reserves: Our use of the term reserves in this presentation means SEC proved oil and gas reserves.
 SHELL LNG OUTLOOK 218 DEFINITIONS & CAUTIONARY NOTE Reserves: Our use of the term reserves in this presentation means SEC proved oil and gas reserves. Resources: Our use of the term resources in this presentation
Changes are Coming: The Emergence of U.S. LNG Exports
 OCTOBER 25 TH 2016 Changes are Coming: The Emergence of U.S. LNG Exports 34 th USAEE/IAEE North American Conference Tulsa, Oklahoma Where Are We Today? 1. The Global LNG Market & Emergence of US Volumes
Trends in International LNG
 Trends in International LNG Anthony Patten, Partner, Allens Presentation to AMPLA State Conference Fremantle, Western Australia 18 May 2012 Allens is an independent partnership operating in alliance with
World LNG Trade 2014 & Outlook 2015
 World LNG Trade 2014 & Outlook 2015 By: Global LNG Info (GLNGI) May 2015 www.globallnginfo.com LNG Trades 2014 (1) 239.2 MMT of LNG traded in 2014, effectively flat for the third year running as reduced
Markets and Opportunities. Paul Burgener March 2015
 Markets and Opportunities Paul Burgener March 2015 Disclaimer Copyright BP Energy Company. All rights reserved. Contents of this presentation do not necessarily reflect the Company s views. This presentation
Cheniere Energy and the LNG Market. NARUC LNG Working Group November 8, 2015 Patricia Outtrim, Vice President, Government and Regulatory Affairs
 Cheniere Energy and the LNG Market NARUC LNG Working Group November 8, 2015 Patricia Outtrim, Vice President, Government and Regulatory Affairs Forward Looking Statements 2 This presentation contains certain
US LNG Export Growth and the Benefits to Midstream
 US LNG Export Growth and the Benefits to Midstream July 2018 The US is on the brink of adding significant LNG export capacity in 2019 and becoming a sizable player in the global LNG market. In 2017, the
HGAP. Haynesville Global Access Pipeline. Tellurian Midstream Group April 2018
 HGAP Haynesville Global Access Pipeline Tellurian Midstream Group April 2018 Cautionary statements Forward looking statements The information in this presentation includes forward-looking statements within
[LNG MARKET ANALYSIS ] 1. LNG Market Analysis
![[LNG MARKET ANALYSIS ] 1. LNG Market Analysis](/thumbs/82/85327769.jpg "[LNG MARKET ANALYSIS ] 1. LNG Market Analysis") [LNG MARKET ANALYSIS ] 1 LNG Market Analysis LNG Market Analysis Volume: 13 th April 2018 LNG and Natural Gas Price Assessment 3 rd 13 th April 2018 [LNG MARKET ANALYSIS ] 2 LNG Analysis Global LNG prices
[LNG MARKET ANALYSIS ] 1 LNG Market Analysis LNG Market Analysis Volume: 13 th April 2018 LNG and Natural Gas Price Assessment 3 rd 13 th April 2018 [LNG MARKET ANALYSIS ] 2 LNG Analysis Global LNG prices
Trends, Issues and Market Changes for Crude Oil and Natural Gas
 Trends, Issues and Market Changes for Crude Oil and Natural Gas East Iberville Community Advisory Panel Meeting Syngenta September 26, 2012 Center for Energy Studies David E. Dismukes, Ph.D. Center for
Corporate Presentation
 Corporate Presentation Enercom Conference Denver, Colorado August 2018 John Howie, President Tellurian Production Company Cautionary statements Forward-looking statements The information in this presentation
Natural Gas Supply/Demand Outlook
 Natural Gas Supply/Demand Outlook Presentation to: The Fertilizer Outlook and Technology Conference Jacksonville, Florida By: John Harpole November 14, 2018 Fertilizer Industry vs. Natural Gas Industry
Natural Gas Supply/Demand Outlook
 Natural Gas Supply/Demand Outlook Presentation to: The Fertilizer Outlook and Technology Conference Jacksonville, Florida By: John Harpole November 14, 2018 Fertilizer Industry vs. Natural Gas Industry
Atlantic LNG: Has the boat sailed? Is the US out of the LNG trade and what are the implications for Europe?
 Atlantic LNG: Has the boat sailed? Is the US out of the LNG trade and what are the implications for Europe? James Osten Principal North American Energy Markets LNG Trade Different for U.S. Than Europe
Session 3: Enhancing gas supply and diversification New sources & markets
 Session 3: Enhancing gas supply and diversification New sources & markets IEF-IGU Gas Ministerial 22 nd November 218 Key messages: Enhancing gas supply and diversification new sources and markets Key messages
Energy in 2011 disruption and continuity
 June 212 bp.com/statisticalreview Energy in 211 disruption and continuity Richard de Caux, Refining Analyst, Group Economics Outline A year of disruptions Energy and the economy Fuel by fuel Concluding
Corporate Presentation. March 2008
 Corporate Presentation March 2008 Safe Harbor Act This presentation contains certain statements that are, or may be deemed to be, forward-looking statements within the meaning of Section 27A of the Securities
The Shifting Sands of Natural Gas Abundance
 August 17, 2016 The Shifting Sands of Natural Gas Abundance Richard Meyer Manager, Energy Analysis & Standards Here s how global energy changed between 2014 and 2015. Winners were oil, natural gas, renewables.
Natural Gas: Challenges for the Industry, the LNG Chain, and Implications for Market Structure
 27 September 216 Algiers Natural Gas: Challenges for the Industry, the LNG Chain, and Implications for Market Structure Plenary Session 2 Introduction Market context Session objectives Low gas prices across
Fundamentals. Summer 2018
 Fundamentals Summer 2018 Cautionary statements Forward-looking statements The information in this presentation includes forward-looking statements within the meaning of Section 27A of the Securities Act
The Evolving Landscape of the LNG Sector.
 The Evolving Landscape of the LNG Sector Four Divisions One Team One integrated full-service team for your project to serve you from concept to commercial operations Ship Broking Logistics Braemar ACM
7. Liquefied Natural Gas (LNG)
") 7. Liquefied Natural Gas (LNG) Figure 7-1: LNG supply chain Source; Total Liquid natural gas (LNG) is a good alternative to natural gas in remote locations or when the distance between the producer and
7. Liquefied Natural Gas (LNG) Figure 7-1: LNG supply chain Source; Total Liquid natural gas (LNG) is a good alternative to natural gas in remote locations or when the distance between the producer and
Energy in 2011 disruption and continuity
 June 212 bp.com/statisticalreview Energy in 211 disruption and continuity Paul Appleby, Head of Energy Economics Outline A year of disruptions Energy and the economy Fuel by fuel Concluding remarks Energy
An Exporter s Perspective
 An Exporter s Perspective Kathleen Eisbrenner CEO, Pangea LNG B.V. May 2013 Mayer Brown is a global legal services provider comprising legal practices that are separate entities (the "Mayer Brown Practices").
LNG TRADE FLOWS. Hans Stinis Shell Upstream International
 LNG TRADE FLOWS Hans Stinis Shell Upstream International ABSTRACT The LNG industry has witnessed a great deal of change recently, and indications are that this will only continue. Global gas demand is
Brian A. Habacivch Constellation, Commodities Management Group October 20, 2018
 North American Energy Outlook The Transformative Role of Shale in the Global Hydrocarbons Market Why It Matters to Commercial, Institutional, and Industrial End Users Brian A. Habacivch Constellation,
Global energy markets
 For Woodrow Wilson Center Global Energy Forum September 21, 215 Washington, DC by Adam Sieminski, Administrator U.S. Energy Information Administration U.S. Energy Information Administration Independent
Investor Presentation
 Investor Presentation First nine months 2017 activity update October 18, 2017 Disclaimer This document is strictly confidential. Any unauthorised access to, appropriation of, copying, modification, use
The Really Big Game Changer: Crude Oil Production from Shale Resources and the Tuscaloosa Marine Shale
 The Really Big Game Changer: Crude Oil Production from Shale Resources and the Tuscaloosa Marine Shale Baton Rouge Chamber of Commerce Regional Stakeholders Breakfast June 27, 2012 Center for Energy Studies
Evaluating the Impacts of Market Shifts on Local Markets and Assets. Ron Norman May 20, 2009
 Evaluating the Impacts of Market Shifts on Local Markets and Assets Ron Norman May 20, 2009 Gas market outlooks are only one component of an effective marketing or procurement strategy Agenda Gas Market
Natural Gas Market Outlook FGU Conference, June 2017 Shelley Corman
 Natural Gas Market Outlook FGU Conference, June 217 Shelley Corman Important Information Forward-looking statements disclosure Statements made at this conference or in the materials distributed in conjunction
LNG Markets GDF SUEZ and its LNG activities
 LNG Markets GDF SUEZ and its LNG activities Paris 22 April 2013 Denis Bonhomme Executive VP Strategy GDF SUEZ LNG This presentation is not intended to provide the basis for any evaluation of GDF SUEZ or
International gas markets: recent developments and prospects
 International gas markets: recent developments and prospects Christopher Allsopp New College Oxford Director, Oxford Institute for Energy Studies December 2012 International gas markets are changing rapidly
LNG MARKET TRENDS AND OPPORTUNITIES IN LNG SUPPLY CHAIN
 LNG MARKET TRENDS AND OPPORTUNITIES IN LNG SUPPLY CHAIN LNG SEMINAR PETROLEUM INSTITUTE OF PAKISTAN MAY 23, 2016 ISLAMABAD No part of this presentation may be circulated, quoted, or reproduced for distribution
LNG in 2015 and MT perspectives
 CEDIGAZ, the International Association for Natural Gas LNG in 2015 and MT perspectives Geoffroy Hureau Secretary General - CEDIGAZ THE LNG MARKET IN 2015 (Preliminary estimates) LNG Demand grew 2% in 2015
CenterPoint Energy Services. Current Market Fundamentals June 27, 2013
 CenterPoint Energy Services Current Market Fundamentals June 27, 2013 CenterPoint Energy is one of the largest combined electric and natural gas delivery companies in the U.S. Asset portfolio CNP Footprint
IHS LATIN AMERICA LPG SEMINAR
 ENTERPRISE PRODUCTS PARTNERS L.P. IHS LATIN AMERICA LPG SEMINAR November 8, 2016 Joseph Fasullo Manager, International NGLs ALL RIGHTS RESERVED. ENTERPRISE PRODUCTS PARTNERS L.P. enterpriseproducts.com
Oil and natural gas: market outlook and drivers
 Oil and natural gas: market outlook and drivers for American Foundry Society May 18, 216 Washington, DC by Howard Gruenspecht, Deputy Administrator U.S. Energy Information Administration Independent Statistics
RYSTAD ENERGY GAS PERSPECTIVES. Jakarta, November 20 th 2017
 RYSTAD ENERGY GAS PERSPECTIVES Jakarta, November 2 th 217 Agenda 1. Global LNG market outlook Oversupply and new Asian demand 2. Japan LNG Market outlook LNG demand in a nuclear restart 2 Longer distances
4 TH GAS FORUM. Jean Jaylet, Senior Vice President Strategy, Markets & LNG. May 30 th, 2016
 4 TH GAS FORUM Jean Jaylet, Senior Vice President Strategy, Markets & LNG May 30 th, 2016 THE LNG MARKET TODAY 2005: 143 MT 13 exporters 15 importers ~60 flows 2015: 250 MT 19 exporters 34 importers ~160
U.S. Shale Gas in Context
 U.S. Shale Gas in Context Overview of U.S. Natural Gas production and trends For National Conference of State Legislatures Natural Gas Policy Institute September 9, 215 Pittsburgh, Pennsylvania By Grant
Edgardo Curcio President AIEE
 Edgardo Curcio President AIEE The First National Conference on Liquefied Natural Gas for Transports - Italy and the Mediterranean Sea April 11, 2013 What is LNG? The LNG (Liquefied Natural Gas) is a fluid
STATE OF MICHIGAN BEFORE THE MICHIGAN PUBLIC SERVICE COMMISSION
 STATE OF MICHIGAN BEFORE THE MICHIGAN PUBLIC SERVICE COMMISSION In the matter of the Application of ) DTE ELECTRIC COMPANY for ) approval of Certificates of Necessity ) pursuant to MCL 460.6s, as amended,
LNG Market Trends & Price Transparency
 LNG Market Trends & Price Transparency Tokyo Fiona Poynter April 2015 London Houston Washington New York Portland Calgary Santiago Bogota Rio de Janeiro Singapore Beijing Tokyo Sydney Dubai Moscow Astana
[LNG MARKET ANALYSIS ] 1. LNG Market Analysis
![[LNG MARKET ANALYSIS ] 1. LNG Market Analysis](/thumbs/89/100997948.jpg "[LNG MARKET ANALYSIS ] 1. LNG Market Analysis") [LNG MARKET ANALYSIS ] 1 LNG Market Analysis LNG Market Analysis Volume: 23 rd March 2018 [LNG MARKET ANALYSIS ] 2 LNG Price Assessment and Natural Gas 12 th 23 rd March 2018 LNG Analysis Global LNG prices
[LNG MARKET ANALYSIS ] 1 LNG Market Analysis LNG Market Analysis Volume: 23 rd March 2018 [LNG MARKET ANALYSIS ] 2 LNG Price Assessment and Natural Gas 12 th 23 rd March 2018 LNG Analysis Global LNG prices
Cheniere Energy, Inc. July 2015
 Cheniere Energy, Inc. July 2015 Forward Looking Statements 2 This presentation contains certain statements that are, or may be deemed to be, forward-looking statements within the meaning of Section 27A
LNG as a global market ESCP London School London, September 22nd, 2015 GUY BROGGI SENIOR ADVISOR, LNG DIVISON
 LNG as a global market ESCP London School London, September 22nd, 2015 GUY BROGGI SENIOR ADVISOR, LNG DIVISON Today s Menu (and take-aways ) Latest changes in the LNG landscape 2014 was a continuation
The US shale revolution and its economic impact
 The US shale revolution and its economic impact Sylvie Cornot-Gandolphe Groupe Idées, Rueil Malmaison, 16 mars 2015 1 The US shale revolution and its economic impact 1. Shale gas Coal-to-gas switching
Current and expected LNG supply-demand balance LNG, a tool to mitigate potential risks linked to pipe gas transport
 Current and expected LNG supply-demand balance LNG, a tool to mitigate potential risks linked to pipe gas transport Armand Khayat Madrid, 17 March 215 Agenda LNG has already demonstrated it is an effective
Natural Gas & LNG Fundamentals. Greg Kist Vice President, Marketing, Corporate & Government Relations
 Natural Gas & LNG Fundamentals Greg Kist Vice President, Marketing, Corporate & Government Relations Marketing & Risk Management Strategy Hedge up to 50% of production currently focused on protecting AECO
Effect of Crude Oil Price Drop on the Global Energy
 2016/EWG52/WKSP1/003 Effect of Crude Oil Price Drop on the Global Energy Submitted by: APERC Asia Pacific Energy Research Centre Workshop Moscow, Russia 18 October 2016 APERC Workshop at EWG52 Moscow,
Regasification N. Atlantic
 North Atlantic Basin LNG Week in Review 1 The report is for the week ending December 13. Table 1 to the right tracks 2013 LNG consumption in the Atlantic Basin through December 13 versus the same time
Energizing America: Facts for Addressing Energy Policy. Rayola Dougher API Senior Economic Advisor,
 Energizing America: Facts for Addressing Energy Policy Rayola Dougher API Senior Economic Advisor, dougherr@api.org 1970 1975 1980 1985 1990 1995 2000 2005 2010 2015 1970 1975 1980 1985 1990 1995 2000
[LNG MARKET ANALYSIS ] 1. LNG Market Analysis
![[LNG MARKET ANALYSIS ] 1. LNG Market Analysis](/thumbs/83/87599942.jpg "[LNG MARKET ANALYSIS ] 1. LNG Market Analysis") [LNG MARKET ANALYSIS ] 1 LNG Market Analysis LNG Market Analysis Volume: 20 th April 2018 LNG and Natural Gas Price Assessment 14 th 20 th April 2018 [LNG MARKET ANALYSIS ] 2 LNG Analysis Global LNG prices
[LNG MARKET ANALYSIS ] 1 LNG Market Analysis LNG Market Analysis Volume: 20 th April 2018 LNG and Natural Gas Price Assessment 14 th 20 th April 2018 [LNG MARKET ANALYSIS ] 2 LNG Analysis Global LNG prices