The Risks and Regulation of Shale Gas Development: Research Findings
|
|
|
- Leo Shaw
- 6 years ago
- Views:
Transcription

1 RFF s Center for Energy Economics and Policy The Risks and Regulation of Shale Gas Development: Research Findings Alan Krupnick, PhD Director, Center for Energy Economics and Policy National Governors Association, September 9-10, 2013
2 Risk Matrix 2
 Effects of shale gas activity on surface water quality in Pennsylvania b) Analysis of chemical assays of flowback/produced water c) Property Value")
3 Sloan Project on Environmental Risks Risk Matrix 1. Expert survey of shale gas development risks 2. Statistical analysis: a) Effects of shale gas activity on surface water quality in Pennsylvania b) Analysis of chemical assays of flowback/produced water c) Property Value effects 3. State-by-state regulatory analysis 4. Public Survey 5. Summary 3

4 Overlap of each groups high priority routine risk pathways

5 Consensus routine risk pathways
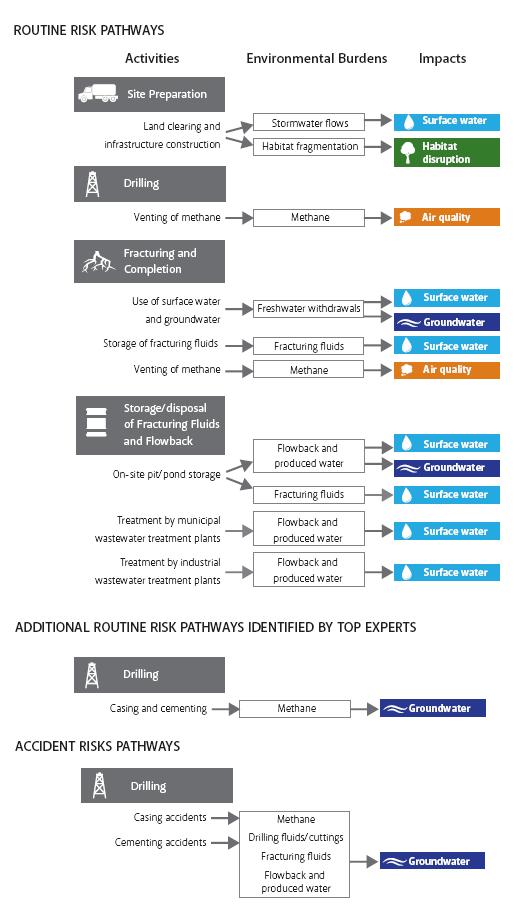
6 6
7 Non-consensus top government concerns White area: All groundwater effects, including from pit or pond storage of fracturing fluids, DWI, saline intrusion from drilling. Other for states: The above effects on surface water, drilling fluids and cuttings to both surface and groundwater; frack fluids hydraulic fracture propagation to groundwater Noticeably lower state priorities: community and habitat effects and air pollutants 7
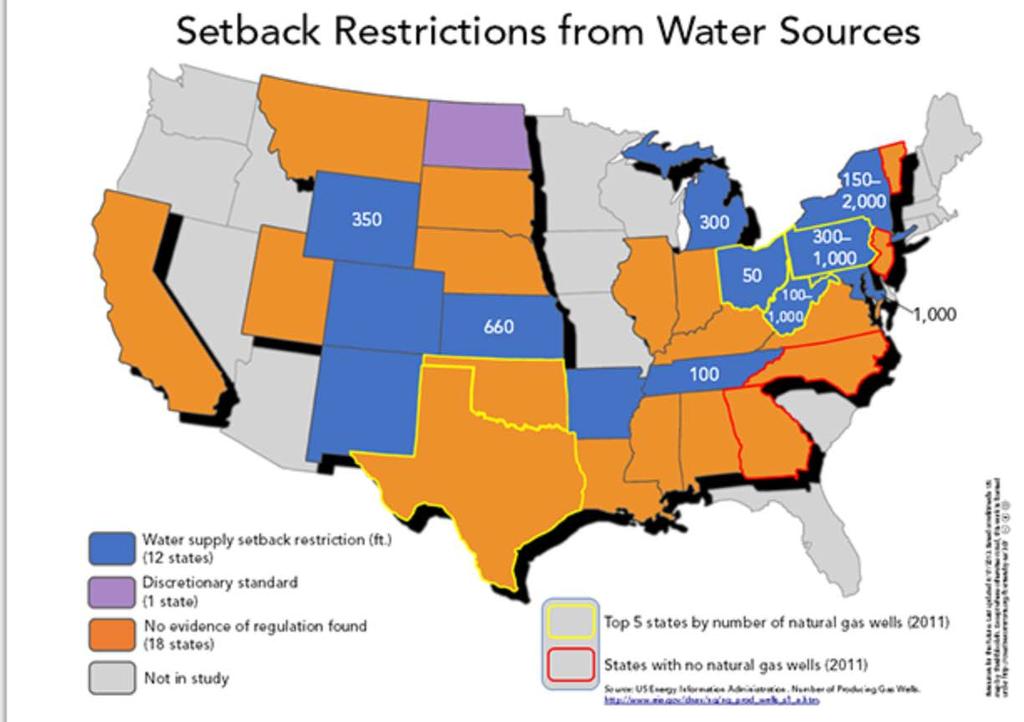
8 State-by-state regulatory analysis 31 states 27 regulatory elements across shale development process Sources of data: statutes, regulations, independent reports, and interviews with regulators 8
9 9
10 Elements Regulated New York West Virginia Colorado Pennsylvania Michigan New Mexico Alabama Kansas Louisiana Ohio Oklahoma Texas Wyoming Nebraska Maryland Natl. Average Arkansas Illinois North Dakota Indiana Kentucky Montana Mississippi Utah South Dakota Tennessee California Virginia Top 5 states by number of gas wells
11 Stringency of Quantitatively Regulated and Unregulated Elements 100% 90% 80% 70% 60% 50% 40% 30% 20% 74% 61% 60% 60% 59% 57% 57% 54% 54% 52% 51% 51% 47% 46% 46% 45% 44% 44% 42% 42% 40% 31% 28% 25% 25% 22% 13% 10% 0% Maryland Nebraska New York West Virginia Colorado Pennsylvania Louisiana Kansas Alabama Texas Michigan Oklahoma North Dakota New Mexico Ohio Arkansas Wyoming Montana Mississippi Illinois Utah South Dakota California Kentucky Indiana Tennessee Virginia Top 5 states by number of gas wells
12 Some Findings Heterogeneity is the rule. States average regulating about 70% of our elements (18-95%) Mostly command and control Of these, numerical standards range from 9% to 75% of maximum stringency Lack of transparency and data availability 12
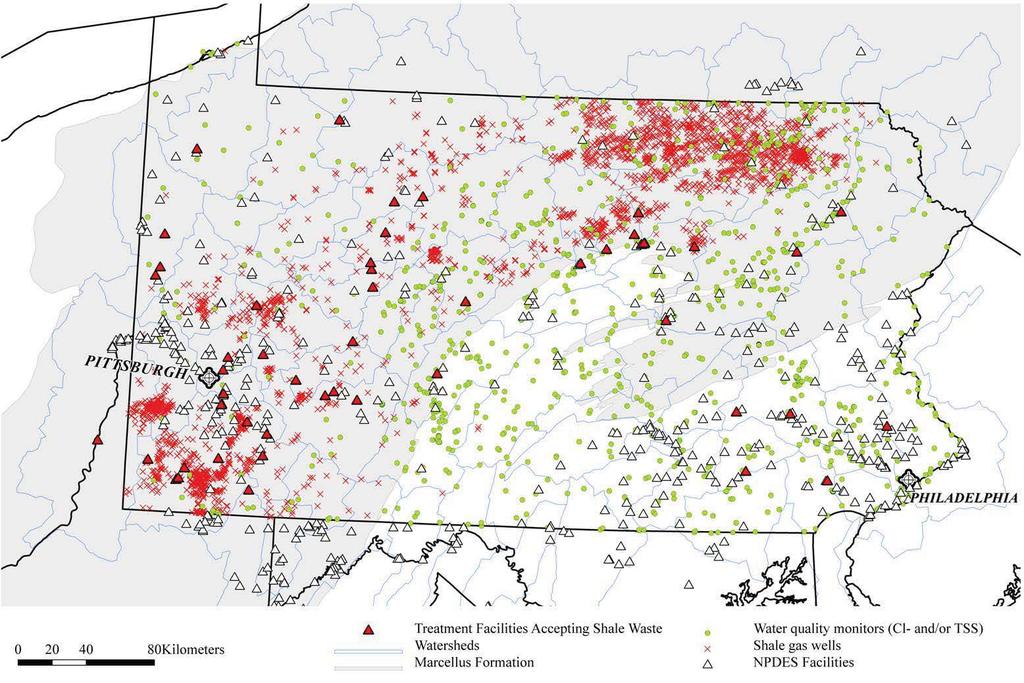
13 RFF project focuses on environmental risks Surface from shale Water gas Quality development Risk Study (PNAS, 2013) We exploit spatial and temporal variation in the proximity of shale gas wells, waste treatment facilities, and surface water quality monitors in Pennsylvania to estimate: 1. the impact of shale gas wells on downstream chloride and TSS concentrations; and 2. the impact of shale gas waste treatment and release to surface water on downstream chloride and TSS concentrations. 13
14 14
15 RFF project focuses on environmental risks from Conclusions shale gas development No statistically significant impact of shale gas wells on downstream chloride concentrations. A positive result here would have been consistent with contamination problems from spills, dumping, etc. Release of treated shale gas waste to surface water by permitted waste facilities appears to increase downstream chloride concentrations. Effect is significant only for POTWs, not CWTs. Shale gas wells appear to increase downstream TSS concentrations. 15
16 Public Survey Public concerns for shale gas development well known, but no information currently available on Risk valuation Risk preference tradeoffs We survey public in Texas and Pennsylvania to elicit attitudes and (monetary) preferences for five key risk attributes 16
17 Degree of concern about the environmental consequences of shale gas development (1=none, 7=extreme concern) 30% 25% 26% 20% 20% 15% 10% 7% 9% 12% 13% 11% 11% 11% 10% 13% 12% 15% 15% 8% 8% 5% 0% No opinion PA TX 17
18 Degree of support of shale gas development (1=not at all, 7=extremely supportive) 25% 20% 21% 21% 20% 19% 18% 17% 15% 10% 9% 11% 12% 10% 12% 7% 7% 5% 6% 4% 4% 0% No opinion PA TX 18
19 Primary (conservative) WTP Estimates (mean, 90% CI), Controlling for Information Treatment and Baseline Groundwater (1,000 wells w/ problems) 6.5 Surface Water (% water bodies w/ problems) 3.6 Air Quality (days of standard violation) Local Community (% time loss) Wildlife Habitat (% habitat fragmented) PA WTP TX WTP 19
20 Thank you 20
U.S. Drought Monitor, August 28, 2012
 University of Nebraska - Lincoln DigitalCommons@University of Nebraska - Lincoln US Ag in Drought Archive Drought -- National Drought Mitigation Center 8-28-2 U.S. Drought Monitor, August 28, 2 Brian Fuchs
U.S. Drought Monitor, September 4, 2012
 University of Nebraska - Lincoln DigitalCommons@University of Nebraska - Lincoln US Ag in Drought Archive Drought -- National Drought Mitigation Center 9--12 U.S. Drought Monitor, September, 12 Brian Fuchs
U.S. Drought Monitor, July 31, 2012
 University of Nebraska - Lincoln DigitalCommons@University of Nebraska - Lincoln US Ag in Drought Archive Drought -- National Drought Mitigation Center -3-2 U.S. Drought Monitor, July 3, 2 Mark D. Svoboda
U.S. Drought Monitor, October 2, 2012
 University of Nebraska - Lincoln DigitalCommons@University of Nebraska - Lincoln US Ag in Drought Archive Drought -- National Drought Mitigation Center -2-12 U.S. Drought Monitor, October 2, 12 Anthony
U.S. Drought Monitor, August 7, 2012
 University of Nebraska - Lincoln DigitalCommons@University of Nebraska - Lincoln US Ag in Drought Archive Drought -- National Drought Mitigation Center -- U.S. Drought Monitor, August, Mark D. Svoboda
The local/community impacts of shale gas development: What we know and don t
 [Add your own pictures here] The local/community impacts of shale gas development: What we know and don t Alan Krupnick Director, Center for Energy Economics and Policy Example of Impact Pathways Activities
U.S. Drought Monitor, August 14, 2012
 University of Nebraska - Lincoln DigitalCommons@University of Nebraska - Lincoln US Ag in Drought Archive Drought -- National Drought Mitigation Center 8-4-2 U.S. Drought Monitor, August 4, 2 Michael J.
Watershed Condition Framework
 US Forest Service - Watershed Condition Classification Maps http://www.fs.fed.us/publications/watershed/ Page 1 of 2 1/9/2013 Watershed Condition Framework The Forest Service has released the first national
Cumulative Risks of Shale Gas Development
 RFF s Center for Energy Economics and Policy Cumulative Risks of Shale Gas Development Alan Krupnick, PhD Director, Center for Energy Economics and Policy Sheila Olmstead, Senior Fellow Presentation to
U.S. Gas Production Overview
 Gas Well Deliquification Workshop Sheraton Hotel, February 23-26, 2009 U.S. Gas Production Overview Rob Sutton US Gas Well Locations Source: IHS MS Streets & Trips 2 Background Number of Gas Wells 448,641
Benchmarking Standards, Model Codes, Codes and Voluntary Guidelines on the HERS Index
 Benchmarking Standards, Model Codes, Codes and Voluntary Guidelines on the HERS Index Importance of Benchmarking Quantifying energy efficiency programs and codes helps: Consumers understand the performance
HOW BIG IS AFRICA? Rules. recommended grades: 3-6
 AFRICA HOW BIG IS AFRICA? recommended grades: 3-6 time needed: 25 MINUTES Description Students develop a sense of scale by using their bodies and other tools to measure the length and width of Africa.
Predict. Prevent. Protect. Transform.
 Optum solution uses global positioning system technology for Optum (CES) is an open-architecture claims editing tool that Program Integrity Solutions Optum provides 30 years worth of government expertise
Case Study: market growth strategy. - Selection of slides
 Case Study: market growth strategy - Selection of slides 1 Objective of the collaboration Situation: The Client, global AC player, would like to enhance its positioning in the USA In this sense, the overall
Pollution Control Exemptions for Pipelines
 Pollution Control Exemptions for Pipelines Greg Wood Ryan, LLC Atlanta, Georgia 30303 Greg.Wood@Ryan.com (919) 219-5605 Keith Fuqua Colonial Pipeline Company Alpharetta, Georgia 30009 kfuqua@colpipe.com
ENERGY STAR Oil Furnaces Product List
 ENERGY STAR Oil Furnaces Product List Below are currently qualified ENERGY STAR models available for sale in the U.S. and Canada * Air Leakage data was not collected under the Version 3.0 ENERGY STAR Program
ANNEX E: Methodology for Estimating CH 4 Emissions from Coal Mining
 1 1 1 1 1 1 1 1 0 1 0 1 ANNEX E: Methodology for Estimating CH Emissions from Coal Mining The methodology for estimating methane emissions from coal mining consists of two distinct steps. The first step
Accelerating Energy Efficiency in Texas
 Accelerating Energy Efficiency in Texas Southwest Partnership for Energy Efficiency As a Resource Houston, Texas August 5, 2014 Jim Lazar RAP Senior Advisor The Regulatory Assistance Project 50 State Street,
Milk Production, Disposition, and Income 2014 Summary
 United s Department of Agriculture National Agricultural Statistics Service Milk Production, Disposition, and Income 04 Summary ISSN: 949-506 April 05 Contents Summary... 4 Milk Cows and Production of
Do you have staff reviewing formation filings for name availability purposes or is this done electronically?
 Topic: Developing an Online Filing System Question by: Allison Clark Jurisdiction: Ohio Date: 2 February 2011 Jurisdiction Question(s) Manitoba Corporations Canada Alabama Alaska Arizona Arkansas California
PA = Prior Appropriation R = Riparian AD = Absolute Dominion RU = Reasonable Use CR = Correlative Rights RSTMT = Restatement of Torts (Second)
") PA = Prior Appropriation R = Riparian AD = Absolute Dominion RU = Reasonable Use CR = Correlative Rights RSTMT = Restatement of Torts (Second) TABLE 1: State Water Rights Surface Water Percolating Groundwater
PA = Prior Appropriation R = Riparian AD = Absolute Dominion RU = Reasonable Use CR = Correlative Rights RSTMT = Restatement of Torts (Second) TABLE 1: State Water Rights Surface Water Percolating Groundwater
Asphalt Pavement Mix Production Survey On Reclaimed Asphalt Pavement, Reclaimed Asphalt Shingles, And Warm-mix Asphalt Usage:
 Asphalt Pavement Mix Production Survey On Reclaimed Asphalt Pavement, Reclaimed Asphalt Shingles, And Warm-mix Asphalt Usage: 2009-2010 Appendix A Purpose The National Asphalt Pavement Association is working
Chapter TRI Data and Trends (Original Industries Only)
") Chapter 3 1999 TRI Data and 1995 1999 Trends (Original Industries Only) Chapter 3 1999 TRI Data and 1995 1999 Trends (Original Industries Only) INTRODUCTION This chapter summarizes information reported
Chapter 3 1999 TRI Data and 1995 1999 Trends (Original Industries Only) Chapter 3 1999 TRI Data and 1995 1999 Trends (Original Industries Only) INTRODUCTION This chapter summarizes information reported
The next big reliability challenge: EPA revised ozone standard
 The next big reliability challenge: EPA revised ozone standard Eugene M. Trisko Attorney-at-Law SSEB Clean Coal Technology Committee Kingsport, TN May 19, 2015 Background EPA is proposing to lower the
New Information on Produced Water Volumes and Management Practices. John Veil
 New Information on Produced Water Volumes and Management Practices John Veil 410-212-0950 john@veilenvironmental.com www.veilenvironmental.com 22 nd International Petroleum Environmental Conference Denver,
Milk Production, Disposition, and Income 2011 Summary
 United s Department of Agriculture National Agricultural Statistics Service Production, Disposition, and Income 2011 Summary April 2012 ISSN: 19491506 Contents Summary... 4 Cows and Production of and
Knowledge Exchange Report
 Knowledge Exchange Report February 2016 The Economic Impact of a Minimum Wage Increase on New York State Agriculture New York State is considering a minimum wage increase from $9.00 to $15.00 statewide.
https://aba2.issi.net/team/admin/wizard/survey/loadinstance.asp?formid=208&instanc...
 https://aba2.issi.net/team/admin/wizard/survey/loadinstance.asp?formid=208&instanc... Page 1 of 1 Print Last edited by Vicki Osman on Mar 28 2016 8:54AM Marketplace 2017 Associate Profile Page 1/1 Please
Trends in. U.S. Delivered Coal Costs: October 2013
 Trends in U.S. Delivered Coal Costs: 2004-2012 October 2013 By Teresa Foster and Leslie Glustrom Inquiries or corrections to info@cleanenergyaction.org 1 2 TABLE OF CONTENTS Introduction... 5 UNITED STATES
U.S. Political Activity & Public Policy Report 2013
 U.S. Political Activity & Public Policy Report 2013 Best Buy Co., Inc. 2013 Best Buy engages in the political process by developing and advocating public policy positions that directly impact our employees,
±450 Acre Premiere Business Park
 ±450 Acre Premiere Business Park Property Highlights Flexible lot sizes from 12-100 + acres. Lots are unplatted so different variations of each lot may be revised. Home to Musician s Friend, FedEx Ground,
HYDRAULIC FRACTURING: STATES TAKE ACTION
 HYDRAULIC FRACTURING: STATES TAKE ACTION FEBRUARY 21, 2014 KRISTY HARTMAN ENERGY POLICY SPECIALIST NCSL NCSL OVERVIEW Bipartisan organization Serves the 7,383 legislators and 30,000+ legislative staff
Potential Impacts to Texas of EPA s Clean Power Plan. Brian Tulloh Austin Electricity Conference April 9, 2015
 Potential Impacts to Texas of EPA s Clean Power Plan Brian Tulloh Austin Electricity Conference April 9, 2015 Luminant Is Texas Largest Competitive Power Generator 15.4 GW of generation capacity: 8.0 GW
Government Spending and Air Pollution in the US
 Government Spending and Air Pollution in the US ONLINE APPENDIX Asif M. Islam* University of Maryland 2106 Symons Hall College Park, MD 20740 (651) 246 4017 aislam@arec.umd.edu Ramón E. López University
Trends in. U.S. Delivered Coal Costs: July 2012
 Trends in U.S. Delivered Coal Costs: 2004-2011 July 2012 By Teresa Foster, William Briggs and Leslie Glustrom Version 1.1 Inquiries or corrections to info@cleanenergyaction.org 1 2 Table of Contents INTRODUCTION...
Climate Regulation in the United States
 Climate Regulation in the United States Karen Palmer IAEE/USAEE International Conference Plenary: Climate Change and Carbon Policies -International Lessons and Perspectives June 17, 2014 A Little History
U.S. Political Activity & Public Policy Report 2011
 U.S. Political Activity & Public Policy Report 2011 Best Buy Co., Inc. 2011 Best Buy engages in the political process by developing and advocating public policy positions which directly impact our employees,
U.S. Political Activity & Public Policy Report 2012
 U.S. Political Activity & Public Policy Report 2012 Best Buy Co., Inc. 2012 Best Buy engages in the political process by developing and advocating public policy positions that directly impact our employees,
Water Reuse: A Little Less Talk. Texas Water Reuse Conference July 20, 2012
 Water Reuse: A Little Less Talk and a Lot More Action Texas Water Reuse Conference July 20, 2012 Purpose 1. Brief Overview of WateReuse Association 2. National and Global Update 3. Potable Reuse 4. The
NEAUPG Annual Fall Meeting
 NEAUPG Annual Fall Meeting 1 Presentation Overview What does it mean to be Sustainable? What asphalt technologies are considered Sustainable and why? Why do we need to quantify our impact? What tools are
Lessons from the Coalbed Methane Boom in Wyoming. Kathryn Bills Walsh, Montana State University Dr. Julia H. Haggerty, Montana State University
 Lessons from the Coalbed Methane Boom in Wyoming Kathryn Bills Walsh, Montana State University Dr. Julia H. Haggerty, Montana State University ASMR April 10, 2017 Mitigating destructive legacies: Reclamation
CALCULATING THE SUPPLEMENTAL NUTRITION ASSISTANCE PROGRAM (SNAP) PROGRAM ACCESS INDEX: A STEP-BY-STEP GUIDE FOR 2013
 PROGRAM ACCESS INDEX: A STEP-BY-STEP GUIDE FOR 2013") Food and Nutrition Service January 2015 CALCULATING THE SUPPLEMENTAL NUTRITION ASSISTANCE PROGRAM (SNAP) PROGRAM ACCESS INDEX: A STEP-BY-STEP GUIDE FOR 2013 Introduction The Program Access Index (PAI)
Food and Nutrition Service January 2015 CALCULATING THE SUPPLEMENTAL NUTRITION ASSISTANCE PROGRAM (SNAP) PROGRAM ACCESS INDEX: A STEP-BY-STEP GUIDE FOR 2013 Introduction The Program Access Index (PAI)
FREIGHT POLICY TRANSPORTATION INSTITUTE. Spatial Patterns in Household Demand for Ethanol Hayk Khachatryan, Ken Casavant and Eric Jessup
 FREIGHT POLICY TRANSPORTATION INSTITUTE Spatial Patterns in Household Demand for Ethanol Hayk Khachatryan, Ken Casavant and Eric Jessup Spatial Patterns in Household Demand for Ethanol Hayk Khachatryan,
Overview and Background: Regulation of Power Plants under EPA s Proposed Clean Power Plan
 Overview and Background: Regulation of Power Plants under EPA s Proposed Clean Power Plan Jennifer Macedonia Council of State Governments Annual Meeting August 11, 2014 BACKGROUND: EPA S PROPOSED CLEAN
The Clean Power Plan NJ Clean Air Council Meeting
 M.J. Bradley & Associates The Clean Power Plan NJ Clean Air Council Meeting D E C E M B E R 9, 2 0 1 5 DRAFT FOR DISCUSSION PURPOSES ONLY Chris Van Atten vanatten@mjbradley.com (978) 369 5533 / www.mjbradley.com
CALCULATING THE SUPPLEMENTAL NUTRITION ASSISTANCE PROGRAM (SNAP) PROGRAM ACCESS INDEX: A STEP-BY-STEP GUIDE FOR 2015
 PROGRAM ACCESS INDEX: A STEP-BY-STEP GUIDE FOR 2015") Food and Nutrition Service January 2017 CALCULATING THE SUPPLEMENTAL NUTRITION ASSISTANCE PROGRAM (SNAP) PROGRAM ACCESS INDEX: A STEP-BY-STEP GUIDE FOR 2015 Introduction The Program Access Index (PAI)
Food and Nutrition Service January 2017 CALCULATING THE SUPPLEMENTAL NUTRITION ASSISTANCE PROGRAM (SNAP) PROGRAM ACCESS INDEX: A STEP-BY-STEP GUIDE FOR 2015 Introduction The Program Access Index (PAI)
A Study of United States Hydroelectric Plant Ownership
 INL/EXT-06-11519 A Study of United States Hydroelectric Plant Ownership Douglas G. Hall, INL Project Manager Kelly S. Reeves, NPS June 2006 The INL is a U.S. Department of Energy National Laboratory operated
General Manager: Front Desk Manager: Front Desk/Shift Supervisor: Housekeeping or Environmental Services Manager: Housekeeping Supervisor/Inspector:
 1 Report Summary WageWatch, Inc. has partnered with AAHOA to provide its members with a Hospitality Salary Survey Report for limited/select service hotels twice a year. This is the first report and is
EPA s Proposed Clean Power Plan: Rate to Mass Conversion
 EPA s Proposed Clean Power Plan: Rate to Mass Conversion JENNIFER MACEDONIA ARKANSAS STAKEHOLDER MEETING OCTOBER 1, 2014 EPA S PROPOSED CLEAN POWER PLAN: RATE TO MASS CONVERSION 2 EPA June Guidance on
Electronic Check Service Quick Reference Guide
 Electronic Check Service Quick Reference Guide VeriFone Omni & Vx Series Using the RDM EC6000i VeriFone Omni & Vx Series Using the RDM EC6000i Image Settlement/Upload Check images are settled/uploaded
The Denver Water System
 The Denver Water System Established in 1918 Unique structure Serves 1.3 million people 25% of Colorado s population System footprint - 4,000 square miles (2.5 million acres) 19 raw water reservoirs Critical
Meat Animals Production, Disposition, and Income 2015 Summary
 United States Department of Agriculture National Agricultural Statistics Service Meat Animals Production, Disposition, and Income 2015 Summary ISSN: 0748-0318 April 2016 Contents Summary... 5 Meat Animals
Franchise.Org IFA Franchisor Member Packages
 Average Monthly Unique Visitors: 150,000 Average Page Views Per Visitor: 14 Total Annual Page Views: 25,200,000 Average Time Spent on Franchise.org: 8 minutes Average Number of Leads Processed Per Month:
Review of State Regulations re Open Burning of Pesticide Containers
 Review of State Regulations re Open Burning of Pesticide Containers Ron Perkins ACRC Executive Director TPSA 16 th Annual Pesticide Stewardship Conference 1 Research Objectives 1. To assess the availability
PJM-MISO Stakeholder JCM Briefing June 30, 2005 Joint and Common Market Portal
 PJM-MISO Stakeholder Briefing June 30, 2005 Joint and Common Market Portal Version 4.0 6/27/05 Joint and Common Market Four Phases Phase 1: Coordination of operations to ensure proper congestion management
STATE LEGISLATIVE ACTION FOR THE DEVELOPMENT OF A HEMP INDUSTRY IN THE U.S. Hawaii Representative Cynthia Henry Thielen
 (AL) Alabama -- -- -- (AK) Alaska -- -- (AZ) Arizona -- (AR) Arkansas -- SR13 (adopted 1999): Requires the University of Arkansas to conduct studies to determine the feasibility of growing hemp as an alternative
HR Architecture Survey Summary.
 2011 HR Architecture Survey www.naspe.net NASPE HR Architecture Survey 2011 The following is a general overview of the structure of state human resource management agencies and past and future plans for
Cattle. January 1 Cattle Inventory Up 3 Percent
 Cattle ISSN: 1948-90 Released January 29, 2016, by the National Agricultural Statistics Service (NASS), Agricultural Statistics Board, United States Department of Agriculture (USDA). January 1 Cattle Inventory
Invasive Species There is an App and a Map for That
 Invasive Species There is an App and a Map for That Who am I? Information Technology Director Public Service Assistant in Entomology B.S. and M.S. in Computer Science President - National Exotic Pest Plant
Labor Market Outlook. Labor Market Outlook Survey Q (October December) Published by the Society for Human Resource Management
 Published by the Society for Human Resource Management") October December 2009 Labor Market Outlook Published by the Society for Human Resource Management Labor Market Outlook Survey Q4 2009 (October December) LABOR MARKET OUTLOOK SURVEY Q4 2009 (October December)
October December 2009 Labor Market Outlook Published by the Society for Human Resource Management Labor Market Outlook Survey Q4 2009 (October December) LABOR MARKET OUTLOOK SURVEY Q4 2009 (October December)
The Pyrogeographyof Wildfires in the Western U.S.
 The Pyrogeographyof Wildfires in the Western U.S. Dr. Michael Medler 1 2 3 4 The pumps buy you time, but minutes only. From this moment, no matter what we do, Titanic will founder. But this ship can't
Crop Progress. Corn Mature Selected States [These 18 States planted 93% of the 2015 corn acreage]
![Crop Progress. Corn Mature Selected States [These 18 States planted 93% of the 2015 corn acreage]](/thumbs/95/123882085.jpg "Crop Progress. Corn Mature Selected States [These 18 States planted 93% of the 2015 corn acreage]") Crop Progress ISSN: 0 Released October,, by the National Agricultural Statistics Service (NASS), Agricultural Statistics Board, United s Department of Agriculture (USDA). Corn Mature Selected s [These
Crop Progress ISSN: 0 Released October,, by the National Agricultural Statistics Service (NASS), Agricultural Statistics Board, United s Department of Agriculture (USDA). Corn Mature Selected s [These
2012 Distribution Best Practices Benchmarking Company Profile Data Packet
 American Gas Association January 2012 Company Name: DOT Operating ID(s): Person Completing Form: Phone Number: Email Address: Required Fields Deadline for data submittal in BESS, http://www.aga.org/research/bess/
Does your company lease any provider networks from other dental plans or network management companies? (Please check all that apply)
") Name Company Phone Email Address Which type of Dental benefit products does your company currently offer? (Please check all that apply) 1. 2. 3. DEPO 4. Dental Indemnity 5. Medicaid/CHIP 6. Medicare 7.
Name Company Phone Email Address Which type of Dental benefit products does your company currently offer? (Please check all that apply) 1. 2. 3. DEPO 4. Dental Indemnity 5. Medicaid/CHIP 6. Medicare 7.
AMERICAN FORESTRY CONGRESS
 PROCEEDINGS OF THE AMERICAN FORESTRY CONGRESS AT ITS MEETING HELD IN BOSTON, SEPTEMBER 1885 WASHINGTON DC JUDD & DETWILLER, PRINTERS FACTS AND FIGURES IN RESPECT TO THE FORESTS OF THE COUNTRY AND THEIR
Meat Animals Production, Disposition, and Income 2011 Summary
 United States Department of Agriculture National Agricultural Statistics Service Meat Animals Production, Disposition, and Income 2011 Summary April 2012 ISSN: 0748-0318 Special Note Sheep: Monthly sheep
Steers weighing 500 pounds and over, as of January 1, 2018, totaled 16.4 million head, down slightly from January 1, 2017.
 Cattle ISSN: 1948-90 Released January 31, 2018, by the National Agricultural Statistics Service (NASS), Agricultural Statistics Board, United States Department of Agriculture (USDA). January 1 Cattle Inventory
Crop Progress. Corn Planted - Selected States [These 18 States planted 92% of the 2016 corn acreage] Corn Emerged - Selected States ISSN:
![Crop Progress. Corn Planted - Selected States [These 18 States planted 92% of the 2016 corn acreage] Corn Emerged - Selected States ISSN:](/thumbs/83/87811397.jpg "Crop Progress. Corn Planted - Selected States [These 18 States planted 92% of the 2016 corn acreage] Corn Emerged - Selected States ISSN:") Crop Progress ISSN: 00 Released May, 0, by the National Agricultural Statistics Service (NASS), Agricultural Statistics Board, United s Department of Agriculture (USDA). Corn Planted Selected s [These
Crop Progress ISSN: 00 Released May, 0, by the National Agricultural Statistics Service (NASS), Agricultural Statistics Board, United s Department of Agriculture (USDA). Corn Planted Selected s [These
Crop Progress. Corn Planted - Selected States [These 18 States planted 92% of the 2017 corn acreage] Corn Emerged - Selected States ISSN:
![Crop Progress. Corn Planted - Selected States [These 18 States planted 92% of the 2017 corn acreage] Corn Emerged - Selected States ISSN:](/thumbs/85/91512831.jpg "Crop Progress. Corn Planted - Selected States [These 18 States planted 92% of the 2017 corn acreage] Corn Emerged - Selected States ISSN:") Crop Progress ISSN: 00 Released April 0, 0, by the National Agricultural Statistics Service (NASS), Agricultural Statistics Board, United s Department of Agriculture (USDA). Corn Planted Selected s [These
Crop Progress ISSN: 00 Released April 0, 0, by the National Agricultural Statistics Service (NASS), Agricultural Statistics Board, United s Department of Agriculture (USDA). Corn Planted Selected s [These
U.S. Department of Labor
 U.S. Department of Labor Employment and Training Administration 200 Constitution Avenue, N.W. Washington, D.C. 20210 MEMORANDUM TO: State Workforce Agency Administrators FROM: William Carlson Chief, Division
State Environmental Agencies
 Alabama Alabama Department of Environmental Management www.adem.state.al.us/ Alabama Department of Conservation & Natural Resources www.outdooralabama.com/ Alaska Alaska Department of Environmental Conservation
Land Values 2013 Summary
 United States Department of Agriculture National Agricultural Statistics Service Land Values 2013 Summary August 2013 ISSN: 19491867 Contents Agricultural Land Values Highlights... 4 Farm Real Estate,
Crop Progress. Cotton Bolls Opening Selected States [These 15 States planted 99% of the 2010 cotton acreage]
![Crop Progress. Cotton Bolls Opening Selected States [These 15 States planted 99% of the 2010 cotton acreage]](/thumbs/90/104141847.jpg "Crop Progress. Cotton Bolls Opening Selected States [These 15 States planted 99% of the 2010 cotton acreage]") Crop Progress ISSN: 00 Released September, 0, by the National Agricultural Statistics Service (NASS), Agricultural Statistics Board, United s Department of Agriculture (USDA). Cotton Bolls Opening Selected
Crop Progress ISSN: 00 Released September, 0, by the National Agricultural Statistics Service (NASS), Agricultural Statistics Board, United s Department of Agriculture (USDA). Cotton Bolls Opening Selected
Facts on Direct-to-Consumer Food Marketing
 United States Department of Agriculture Agricultural Marketing Service May 2009 Facts on Direct-to-Consumer Food Marketing Incorporating Data from the 2007 Census of Agriculture Written by: Adam Diamond
Crop Progress. Corn Planted - Selected States [These 18 States planted 92% of the 2017 corn acreage]
![Crop Progress. Corn Planted - Selected States [These 18 States planted 92% of the 2017 corn acreage]](/thumbs/87/95248897.jpg "Crop Progress. Corn Planted - Selected States [These 18 States planted 92% of the 2017 corn acreage]") Crop Progress ISSN: 00 Released April, 0, by the National Agricultural Statistics Service (NASS), Agricultural Statistics Board, United s Department of Agriculture (USDA). Corn Planted Selected s [These
Crop Progress ISSN: 00 Released April, 0, by the National Agricultural Statistics Service (NASS), Agricultural Statistics Board, United s Department of Agriculture (USDA). Corn Planted Selected s [These
Milk Production. January Milk Production up 2.7 Percent
 Milk Production ISSN: 9-557 Released February, 07, by the National Agricultural Statistics Service (NASS), Agricultural Statistics Board, United States Department of Agriculture (USDA). January Milk Production
Crop Progress. Corn Harvested Selected States [These 18 States harvested 94% of the 2017 corn acreage]
![Crop Progress. Corn Harvested Selected States [These 18 States harvested 94% of the 2017 corn acreage]](/thumbs/89/99253316.jpg "Crop Progress. Corn Harvested Selected States [These 18 States harvested 94% of the 2017 corn acreage]") Crop Progress ISSN: 00 Released October, 0, by the National Agricultural Statistics Service (NASS), Agricultural Statistics Board, United s Department of Agriculture (USDA). Corn Harvested Selected s [These
Crop Progress ISSN: 00 Released October, 0, by the National Agricultural Statistics Service (NASS), Agricultural Statistics Board, United s Department of Agriculture (USDA). Corn Harvested Selected s [These
All cows and heifers that have calved, at 39.1 million, were down 2 percent from the 40.0 million on January 1, 2011.
 Cattle ISSN: 1948-90 Released January 27, 2012, by the National Agricultural Statistics Service (NASS), Agricultural Statistics Board, United States Department of Agriculture (USDA). January 1 Cattle Inventory
Farm Radio Habits Wave 1, Winter Conducted by Millennium Research, Inc.
 Farm Radio Habits Wave 1, Winter 2015 Conducted by Millennium Research, Inc. TAKE A PICTURE OF THE RADIO YOU LISTEN TO THE MOST OFTEN? 2 Radio Is An Important Part Of Farmers And Ranchers Day I started
Crop Production ISSN:
 Crop Production ISSN: 1936-3737 Released August 12, 2014, by the National Agricultural Statistics Service (NASS), Agricultural Statistics Board, United States Department of Agriculture (USDA). Corn Production
Legislative Trends: Upcoming Increases to Minimum Wage Round-up 2018
 Legislative Trends: Upcoming Increases to Minimum Wage Round-up 2018 While the last federal minimum wage increase was on July 24, 2009, when it rose from $6.55 to $7.25 per hour, many state and local governments
Flour Milling Products
 Flour Milling Products ISSN: 2378-2498 Released May 1, 2018, by the National Agricultural Statistics Service (NASS), Agricultural Statistics Board, United States Department of Agriculture (USDA). Highlights
Crop Progress. NASS Survey Update!
 Crop Progress ISSN: 00 Released May, 0, by the National Agricultural Statistics Service (NASS), Agricultural Statistics Board, United s Department of Agriculture (USDA). NASS Survey Update! In the first
Flour Milling Products 2017 Summary
 United States Department of Agriculture National Agricultural Statistics Service Flour Milling Products 2017 Summary May 2018 ISSN: 2470-9921 2017 Flour Milling Products As part of the Current Agricultural
Crop Progress. Corn Silking Selected States [These 18 States planted 92% of the 2017 corn acreage]
![Crop Progress. Corn Silking Selected States [These 18 States planted 92% of the 2017 corn acreage]](/thumbs/81/83000292.jpg "Crop Progress. Corn Silking Selected States [These 18 States planted 92% of the 2017 corn acreage]") Crop Progress ISSN: 00 Released July, 0, by the National Agricultural Statistics Service (NASS), Agricultural Statistics Board, United s Department of Agriculture (USDA). Corn Silking Selected s [These
Crop Progress ISSN: 00 Released July, 0, by the National Agricultural Statistics Service (NASS), Agricultural Statistics Board, United s Department of Agriculture (USDA). Corn Silking Selected s [These
Crop Progress. Corn Dented Selected States [These 18 States planted 92% of the 2017 corn acreage] Corn Mature Selected States ISSN:
![Crop Progress. Corn Dented Selected States [These 18 States planted 92% of the 2017 corn acreage] Corn Mature Selected States ISSN:](/thumbs/85/92551331.jpg "Crop Progress. Corn Dented Selected States [These 18 States planted 92% of the 2017 corn acreage] Corn Mature Selected States ISSN:") Crop Progress ISSN: 00 Released September, 0, by the National Agricultural Statistics Service (NASS), Agricultural Statistics Board, United s Department of Agriculture (USDA). Corn Dented Selected s [These
Crop Progress ISSN: 00 Released September, 0, by the National Agricultural Statistics Service (NASS), Agricultural Statistics Board, United s Department of Agriculture (USDA). Corn Dented Selected s [These
Internet Appendix for The Impact of Bank Credit on Labor Reallocation and Aggregate Industry Productivity
 Internet Appendix for The Impact of Bank Credit on Labor Reallocation and Aggregate Industry Productivity John (Jianqiu) Bai, Daniel Carvalho and Gordon Phillips * June 4, 2017 This appendix contains three
Grain Stocks. Corn Stocks Down 7 Percent from September 2017 Soybean Stocks Up 45 Percent All Wheat Stocks Up 5 Percent
 Grain Stocks ISSN: 949-095 Released September 8, 08, by the National Agricultural Statistics Service (NASS), Agricultural Statistics Board, United s Department of Agriculture (USDA). Corn Stocks Down 7
Flour Milling Products
 Flour Milling Products ISSN: 2378-2498 Released February 1, 2018, by the National Agricultural Statistics Service (NASS), Agricultural Statistics Board, United States Department of Agriculture (USDA).
Welcome to the BPA Brand Report
 Welcome to the BPA Brand Report You are looking at the contemporary design that has replaced BPA s traditional green sheets and pink sheets. No longer called a Circulation Statement, the BPA Brand Report
Intrepid Potash New Capital Investments Support Future Opportunities
 Intrepid Potash New Capital Investments Support Future Opportunities MMSA Colorado Section September 7, 2012 Presentation Overview Company Overview Capital Investment Overview Presentation of Select Capital
Franchise.Org IFA Supplier Member Packages
 Average Monthly Unique Visitors: 150,000 Average Page Views Per Visitor: 14 Average Time Spent on Franchise.org: 8 minutes Average Monthly Supplier Profile Searches: 22,000 Total Direct Visits Delivered
Honey. United States Honey Production Down 1 Percent
 Honey ISSN: 199-192 Released March 18, 2013, by the National Agricultural Statistics Service (NASS), Agricultural Statistics Board, United States Department of Agriculture (USDA). United States Honey Production
National Inventory of Dams Overview
 National Inventory of Dams Overview NID Data Team 27 Oct 2016 US Army Corps of Engineers NID Definition Congressionally authorized database documenting dams in the United States and its territories Maintained
EPA Stormwater Update
 EPA Stormwater Update Ken Moraff 3/27/13 http://www.flickr.com/photos/chefmattrock/4780312471/ Massachusetts 2010 Rhode Island 2010 Vermont 2011 http://www.flickr.com/photos/tomswift/6102959612/ Charles
(404) Solid Waste Management Program
 Solid Waste Management Program") APPENDIX D STATE SOLID WASTE AGENCIES ALABAMA COLORADO FLORIDA Alabama Department of Department of Health Department of Environmental Regulation Environmental Management 4210 East Eleventh Street Solid
APPENDIX D STATE SOLID WASTE AGENCIES ALABAMA COLORADO FLORIDA Alabama Department of Department of Health Department of Environmental Regulation Environmental Management 4210 East Eleventh Street Solid
128 Million Reasons to Get BPI Certified
 128 Million Reasons to Get BPI Certified How BPI Certification Helps Build a Green Collar Work Force Larry Zarker Building Performance Institute Obituary Obituary Green, 36, Is Dead The word green, which
A Perspective on the Clean Power Plan: Stringency, Scope and Form
 A Perspective on the Clean Power Plan: Stringency, Scope and Form Sophie Pan, Dallas Burtraw, Anthony Paul, Karen Palmer Presented at TAI Conference 10/06/2014 Presented by Sophie Pan Outline 1. Introduction
All cows and heifers that have calved, at 40.0 million, were down 1 percent from the 40.5 million on January 1, 2010.
 Cattle ISSN: 18- Released January 28, 2011, by the National Agricultural Statistics Service (NASS), Agricultural Statistics Board, United States Department of Agriculture (USDA). January 1 Cattle Inventory
Fatal Occupational Injuries in Maine 2004
 Fatal Occupational Injuries in Maine 2004 BLS 732 D EPARTMENT OF LABOR B UREAU OF LABOR S TANDARDS 45 STATE HOUSE STATION AUGUSTA, MAINE 04333-0045 LAURA A. FORTMAN COMMISSIONER JOHN ELIAS BALDACCI GOVERNOR