Emission accounts. Julian Chow United Nations Statistics Division September 2016 Putrajaya, Malaysia
|
|
|
- Eugenia McLaughlin
- 6 years ago
- Views:
Transcription

1 Emission accounts Julian Chow United Nations Statistics Division September 2016 Putrajaya, Malaysia

2 SEEA Conceptual Framework
3 Types of physical flows accounts in SEEA-CF Physical flow accounts Topics covered (detailed definition) Full set of supply and use tables for materials Economy-wide material flow accounts (MFA) Physical supply and use tables for water (PSUT water) Physical supply and use tables for energy (PSUT energy) All resources and materials (energy, water, air emissions, water emissions, solid waste) (CF 3.45) Supply and consumption of energy; air emissions, water emissions, and solid waste (CF 3.279) Supply (precipitation) and consumption of water (CF 3.186) Supply and consumption of energy (CF 3.140) Air emissions accounts Air emissions (CO2, pollutants) (CF 3.233) Water emissions accounts Water emissions (CF 3.257) Waste accounts Solid wastes (CF 3.268) CF = Central Framework, white cover edition, refers to paragraph number
4 Similarities and differences of various physical flows account in SEEA-CF Similarities: > Scope includes Flows from the environment to economy (natural inputs) Flows within the economy (Products flow) Flows back to environments (Residuals flows) > Finer level of focus can be undertaken consistent with the general principles of the PSUT > Same concepts, definitions and standards > Same institutional units Differences: > Units of measurement > Key components of the PSUT > Breakdowns of economic activities
5 What do water emission accounts measure? Present information on the activities responsible for the emissions and releases, the types and amounts of substances, as well as the destination of the emissions (e.g. water resources or the sea). Describe, in physical units, flows of pollutants added to wastewater as a result of production and consumption, and flowing into water resources either directly or through the sewage network.
6 Why compiling water emission accounts Emission accounts provide information on > Which activities are responsible for the emission > How much is being emitted > Where is being emitted They are useful for designing policies aimed at reducing pressure on the environment
7 Why compiling water emission accounts Since they are linked to the economic accounts, they allow for > the formulation of cost-effective policies aiming at reducing emissions > the evaluation of the economic impacts of policies aiming at reducing emissions Useful tool for designing economic instruments, including new regulations to reduce emissions into the inland water system or seas and oceans
8 Emission to water Substances released to water resources by establishments and households as a result of production, consumption and accumulation process Flows
9 Flows in water emission account
10 Wastewater and pollutants pathways Households Agriculture Other industries Rest of the world Sewerage Water resources and the sea
11 Water emission accounts: coverage Record the quantity of substance added to water by establishment and households during an accounting period Cover > Substances added to wastewater and collected in the sewage system > Substances added to wastewater and discharged directly to water bodies > Substances from non-point sources E.g. emissions from urban runoff and emissions from agriculture
12 Water emission accounts: Key components Emission by types of substances (supply) and received by the environment (use) > Direct flow to the environment Release to (supply) and collection by (use) economic units > Flow to sewage industry
13 Physical supply table for gross releases of substances to water Generation of gross releases to water Sewerage industry Other industries Households Accumulation Emissions from fixed assets Flows with the rest of the world Flows from the environment Total supply Emissions by type of substance BOD / COD * Suspended solids Heavy metals Phosphorous Nitrogen Releases to other economic units BOD / COD * Suspended solids Heavy metals Phosphorous Nitrogen Physical use table for gross releases of substances to water Collection of gross releases to water Flows with the rest of the world Flows to the environment Total use Sewerage Other Households industry industries Emissions received by the environment BOD / COD * Suspended solids Heavy metals Phosphorous Nitrogen Collection by other economic units BOD / COD * Suspended solids Heavy metals Phosphorous Nitrogen PSUT for water emission
 were released by economic activities and households.")
14 Example of pollution flows in the economy Pollution expressed in thousands of metric tons of BOD5 per year The diagram shows that 106 units of pollution (measured in thousands of metric tons of BOD 5 per year) were released by economic activities and households. Wastewater Treatment Plants (WWTPs) removed 68 units, and 4 units were included in wastewater that was supplied for further use in the economy. Only 34 units of pollution were part of the emissions (emissions are releases to the environment).
15 Example of pollution flows in the economy Further disaggregation of the data is possible, as shown in the figure below. households release 91 thousand metric tons of BOD5 to the sewers Industries and services release 15 thousand 106 thousand metric tons of BOD5 is collected in sewers, but only 28 thousand are released to the environment (emissions) Industries and services release 6 thousand metric tons of organic pollution to the environment. In summary, the total emissions are 34 thousand tons of organic pollution (28 from sewerage + 6 from industries).
16 Example of pollution flows in the economy

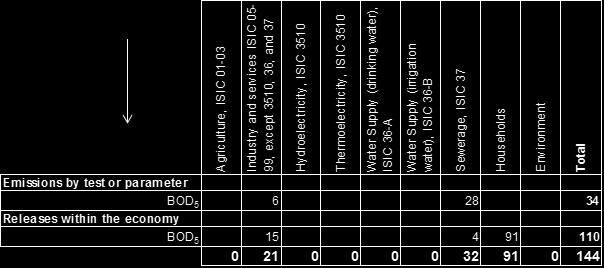
17 Example Supply table
18 Agriculture, ISIC Industry and services ISIC 05-99, except 3510, 36, and 37 Hydroelectricity, ISIC 3510 Thermoelectricity, ISIC 3510 Water Supply (drinking water), ISIC 36-A Water Supply (irrigation water), ISIC 36-B Sewerage, ISIC 37 Households Environment Total Example Use table Emissions by test or parameter Releases within the economy BOD BOD
19 Sources Two sources > Point sources emission > Non-point (or diffuse) source Point sources emission > Geographical location of the discharge of the wastewater is identified > E.g. emissions from sewage facilities, power plants, industrial establishments > They are generally easier to measure since the point of emission to the water resources is clearly identified
20 Sources Non-point (or diffuse) sources > Sources without a single point of origin or a specific outlet into a receiving water resources > Pollutants are generally carried off the land by stormwater run-off or may be the result of a collection of individual and small scale polluting activities which for practical reasons cannot be treated as point sources of pollution. > Commonly used categories for non-point sources include agriculture and urban areas. > E.g. Urban runoff, releases from individual and small scale activity
21 Urban runoff Urban run-off: that portion of precipitation on urban areas that does not naturally percolate into the ground or evaporate, but flows via overland flow, underflow, or channels or is piped into a defined surface water channel or a constructed infiltration facility. It is generally highly polluted and there is an increasing awareness in the potential danger of discharging it into the environment without treatment. Emissions to water in the urban runoff are allocated to the Sewerage industry, ISIC 37 since this is the economic unit responsible for its collection and discharge
22 Basic concepts and definitions Gross emissions are the pollutants added to the water by an activity, assessed at the point where the wastewater leaves the activity's site (or the dwelling, in the case of households). Net (or final) emissions correspond to the pollutants discharged into water resources after treatment. Net emissions= gross emissions if there is no treatment of wastewater
23 Reallocation of emissions In the calculation of net emissions, the release of pollutants by the sewerage industry has to be reallocated to the economic unit responsible for the discharge in the first place Net emission = direct emission to the environment + share of emissions released to the environment by sewage industry Reallocation of emission > Use average removal rates (e.g. per category of WWTP) or > Use information of known removal rates per WWTP
24 Emission accounts Industries, households and the rest of the world are identified by columns They record the pollution added to water by an economic unit (and not the total pollution discharged with wastewater)
25 Scope of emission accounts Point sources: Include: Pollutants added to wastewater Exclude: Discharges of heavy metal and hazardous wastes not contained in wastewater (included in the SEEA waste accounts) Pollutants resulting from in-situ use (e.g. navigation, fishing, etc.) Non-point sources: Urban runoff Irrigation water and rain-fed agriculture All non-point sources except for urban runoff, irrigation water and rain-fed agriculture
26 Water emission accounts: - Inclusion and exclusion Do not include imports and exports of substances through natural flows of water resources > Substances in rivers crossing country borders are not included Included in the accounts are emissions of relevant substances from fixed assets, such as from vessels operating within a country s water resources. Include emission due to activities undertaken in water resources or seas
27 Households Rest of the world Total Emission accounts - Gross emissions tonnes Industries (by ISIC categories) Pollutant 1. Gross emissions (=1.a+1.b) 1.a. Direct emissions to water (=1.a.1+1.a.2=1.a.i+1.a.ii) 1.a.1 Without treatment 1.a.2 After on-site treatment 1.a.i To water resources 1.a.ii To the sea 1.b. To Sewerage (ISIC 37) , ,39, Total Households 185 Agriculture 30 Other industries Rest of the world Sewerage 20 Water resources and the sea
28 Emission accounts Emission by ISIC division 37 Pollutant 4. Emissions to water (=4.a+4.b) 4.a After treatment To water resources To the sea tonnes ISIC Households Agriculture 30 5 Sewerage Other industries 20 Rest of the world 4.b Without treatment To water resources Water resources and the sea To the sea Now we can reallocate the emissions by ISIC 37 to the activity responsible for the emission
 1.a.1 Without treatment 1.a.2 After on-site treatment 1.a.i To water resources 1.a.ii To the sea 1.b. To Sewerage (ISIC 37) 2. Reallocation of emission by ISIC 37 3.")
29 Households Rest of the world Total Emission accounts net emissions tonnes Industries (by ISIC categories) Pollutant 1. Gross emissions (=1.a+1.b) 1.a. Direct emissions to water (=1.a.1+1.a.2=1.a.i+1.a.ii) 1.a.1 Without treatment 1.a.2 After on-site treatment 1.a.i To water resources 1.a.ii To the sea 1.b. To Sewerage (ISIC 37) 2. Reallocation of emission by ISIC Net emissions (=1a+2) , ,39, Total Households 185 Agriculture 30 Other industries Rest of the world Sewerage 20 Water resources and the sea
30 Urban runoff Urban run-off: that portion of precipitation on urban areas that does not naturally percolate into the ground or evaporate, but flows via overland flow, underflow, or channels or is piped into a defined surface water channel or a constructed infiltration facility. It is generally highly polluted and there is an increasing awareness in the potential danger of discharging it into the environment without treatment. Emissions to water in the urban runoff are allocated to the Sewerage industry, ISIC 37 since this is the economic unit responsible for its collection and discharge
31 Conclusions Emission accounts are addressing new policy-relevant questions Existing data collection systems may contain useful information (e.g. Emissions Register) May need to set-up specific data collections Promotion of usefulness of (emission) accounts is very important. They will aide: Understanding of the costs and benefits of measures discussion with different stakeholders (e.g. agriculture versus industry as polluters of waters) monitoring of environmental efficiency definition of policy goals

32 PHYSICAL DATA ITEMS RELATED WITH WATER EMISSIONS
33 Wastewater Wastewater in SEEA is defined as all the water that is discarded and no longer required by the owner or user Wastewater by type of water users discharging > Household > Industries connected to sewer network > Sewage industries > Industries not connected to the sewer network > Agriculture > Thermoelectric plants > Hydroelectric plants
34 Data collection Common sources of data > Water and/or sewage utilities, companies, associations or regulators > Departments in charge of controlling polluting discharges (they may issue permits and develop inventories of polluting discharges) > National statistics office > Research institutions Data collection of wastewater should be done in conjunction with data collection of emissions
35 Waterborne polluting release Pollution problem > Transmission of disease through water > Reduction of dissolved oxygen in water > Proliferation of aquatic weed and algae > Poisoning of aquatic life and humans Emission statistics and accounts are based on the results of tests or analyses (e.g. BOD, COD, TSS) done to wastewater samples
36 Pollutants and their measurement Pollutants Parameters (Based on Laboratory Tests) Pathogenic viruses, bacteria, Fecal coliforms protozoa, and parasitic worms E. coli (helminthes) from excreta of Enterococci people with diseases. Organic Matter Biochemical oxygen demand (BOD) Chemical oxygen demand (COD) Total organic carbon (TOC) Nutrients Total Nitrogen (TN) Total Phosphorus (TP) Total Kjehldahl Nitrogen (TKN) Toxic substances that often accumulate through the food chain Tests to detect the presence of metals (e.g. Arsenic, Cadmium, Chromium) (E.g. metals, persistent organic pollutants, and cyanides). Also Tests to detect persistent organic pollutants (POPs), such as PCBs. known as micro-pollutants. Tests to detect cyanides. Substances that change the Total Solids (TS) physical properties of water. It Total suspended solids (TSS) includes a wide variety of Temperature properties that may reveal the Conductivity presence of pollutants. Acidity (ph) Color
37 Data items related with waterborne pollution Waterborne pollutant releases to other economic units (data item J) Sources of data: Data from wastewater utilities. Data processing required: Estimates of the different types of waterborne pollution released by economic activities and households to the sewer network. Pollution is measured using different parameters, usually based on laboratory tests of wastewaters. Relevant agencies: Wastewater or sewerage utilities. Ministry of Environment. Statistical projects to be developed: Inventory of wastewater treatment plants.
38 Waterborne pollutant emissions to the environment from point sources Sources of data: Estimates of waterborne pollution emitted to inland water resources, to the sea, or to land, by households and the different economic activities. Data processing required: Estimates of the different types of waterborne pollution released by economic activities and households. Amount of pollution retained in wastewater treatment plants based on treatment efficiencies reported by the wastewater treatment operators. Pollution is measured using different parameters, usually based on laboratory tests of wastewaters. Some pollution may be collected in sewer networks and the rest discharged directly to the environment. The waterborne pollution collected in sewer networks is also discharged to the environment with or without treatment. Relevant agencies: Wastewater utilities. Ministry of Environment. Statistical projects to be developed: Inventory of discharge points. Inventory of wastewater treatment plants.
39 Waterborne pollutant emissions to the environment from non-point sources (data item K.2) Sources of data: Estimates of waterborne pollution emitted to inland water resources, to the sea, or to land, by diffuse sources of pollution, such as the following: fertilizers, herbicides, and insecticides from agricultural lands; oil, grease, and toxic chemicals from urban runoff and energy production; organic matter from septic systems. Data processing required: Information about the amount of nitrogen and phosphorous applied to crops in the form of fertilizers. Relevant agencies: Ministry of Environment. Ministry of Agriculture (for non-point pollution emitted by agricultural activities). Statistical projects to be developed: Map of agricultural and industrial areas that discharge non-point pollution.

40 THANK YOU
Emissions tables. Every drop counts: SEEA-Water Training Course. Draft exercises and questions to build understanding of SEEA Water
 Every drop counts: SEEA-Water Training Course Draft exercises and questions to build understanding of SEEA Water United Nations Statistics Division Water accounts training 1 Exercise: Emissions tables
UNSD Water Data Collection. Workshop on Environment Statistics (Addis Ababa, July 2007)
") UNSD Water Data Collection Workshop on Environment Statistics (Addis Ababa, 16-20 July 2007) UNSD Water Data Collection Focus Physical data Freshwater resources, the abstraction and use of freshwater by
UNSD Water Data Collection Workshop on Environment Statistics (Addis Ababa, 16-20 July 2007) UNSD Water Data Collection Focus Physical data Freshwater resources, the abstraction and use of freshwater by
Water Pollution & Quality. Dr. Deniz AKGÜL Marmara University Department of Environmental Engineering
 Water Pollution & Quality Dr. Deniz AKGÜL Marmara University Department of Environmental Engineering IMPORTANCE OF WATER Life on planet Earth would be impossible without water. All life forms, from simple
Water Policies Monitoring Framework: Draft Text for the UNSD- WWAP Glossy Publication Paper prepared by UNSD
 ESA/STAT/AC.238 UNCEEA/6/31 DEPARTMENT OF ECONOMIC AND SOCIAL AFFAIRS STATISTICS DIVISION UNITED NATIONS Sixth Meeting of the UN Committee of Experts on Environmental-Economic Accounting New York, 15-17
Water Pollution. Objective: Name, describe, and cite examples of the eight major types of water pollution.
 Water Pollution Objective: Name, describe, and cite examples of the eight major types of water pollution. Types of Water Pollution Water pollutants are divided into eight categories: 1. Sediment pollution
Water Pollution. And Humans are 70% Water! A. Facts 1. 71% of the Earth s surface is water I. Water and the Planet Earth
 Water Pollution Water Pollution I. Water and the Planet Earth A. Facts 1. 71% of the Earth s surface is water. 3 0.5.003 2. Of the 100% of water on the planet, % is fresh water, % is available fresh water
Abuja, May 2008
 Waste Water Treatment and Water Quality Based on UNSD Questionnaire 2002 and 2004 United Nations Statistics Division Workshop on Environment Statistics Abuja, 19-23 May 2008 Waste water generation Total
WASTEWATER PROBLEMS ASSOCIATED WITH SOLVENTS
 WASTEWATER PROBLEMS ASSOCIATED WITH SOLVENTS James L. Walsh, Jr., P.E. Senior Research Engineer Georgia Tech Research Institute Atlanta, Georgia 30332 Introduction There a number of advantages to elimination
Stormwater Management in Your Backyard: Stormwater 101
 Stormwater Management in Your Backyard: Stormwater 101 Gregory Rusciano Program Associate, Water Resources Rutgers Cooperative Extension New Jersey Sea Grant Extension Program How much water do we have?
Physical Flow Accounts: Overview
 Physical Flow Accounts: Overview SEEA Training Seminar for ESCAP February 23-26, 2016 Chiba, Japan Joe St. Lawrence Statistics Canada The Economy and The Environment -Natural Resources -Ecosystem Services
United Nations Statistics Division (UNSD) and United Nations Environment Programme (UNEP) QUESTIONNAIRE 2016 ON ENVIRONMENT STATISTICS
 and United Nations Environment Programme (UNEP) QUESTIONNAIRE 2016 ON ENVIRONMENT STATISTICS") UNSD United Nations Statistics Division (UNSD) and United Nations Environment Programme (UNEP) QUESTIONNAIRE 2016 ON ENVIRONMENT STATISTICS Section: WATER TABLE OF CONTENTS Guidance Definitions Table W1
UNSD United Nations Statistics Division (UNSD) and United Nations Environment Programme (UNEP) QUESTIONNAIRE 2016 ON ENVIRONMENT STATISTICS Section: WATER TABLE OF CONTENTS Guidance Definitions Table W1
Water Pollution. Chapter 20
 Water Pollution Chapter 20 Water Pollution Comes from Point and Nonpoint Sources Water pollution Any chemical, biological, or physical change in water quality that harms living organisms or makes water
Aquatic Science Unit 2. Water Quality and Water Pollution
 Aquatic Science Unit 2 Water Quality and Water Pollution What is a healthy water body? In your own words, take a moment to describe what you believe are some of the characteristics of a healthy stream
Scavenger2000 s Technology
 Scavenger2000 s Technology THE SYSTEM: When ozone and UV light is added to the aeration/oxygenation process of the Scavenger2000 water decontamination and regeneration vessel, several unique abilities
QUESTIONNAIRE FOR GENERAL WTP REQUESTED DATA FOR THE WATER TREATMENT PLANT (WTP) - Application : groundwater (well pit); urban wastewater;
 - Application : groundwater (well pit); urban wastewater;") REQUESTED DATA FOR THE WATER TREATMENT PLANT (WTP) - Application : ENVIRONMENTAL DATA - Temperature min. : C - Temperature max. : C - Altitude (m.a.s.l) : m - Plant location (geographic area, seismic zone,
REQUESTED DATA FOR THE WATER TREATMENT PLANT (WTP) - Application : ENVIRONMENTAL DATA - Temperature min. : C - Temperature max. : C - Altitude (m.a.s.l) : m - Plant location (geographic area, seismic zone,
SEEA Central Framework
 Statistical Commission Forty-third session 28 February 2 March 2012 Item 3 (e) of the provisional agenda Environmental-economic accounting Background document Available in English only REVISION OF THE
Physical Flow Accounts: Overview
 Physical Flow Accounts: Overview UNSD SEEA Training of Trainers Seminar 7-10 July 2015, Santiago Joe St. Lawrence Statistics Canada The Economy and The Environment -Natural Resources -Ecosystem Services
Lecture 7 Water Quality Monitoring: Estimation of fecal indicator bacteria
 Lecture 7 Water Quality Monitoring: Estimation of fecal indicator bacteria FECAL INDICATOR BACTERIA Fecal indicator bacteria, which are directly associated with fecal contamination, are used to detect
United Nations Statistics Division (UNSD) and United Nations Environment Programme (UNEP) QUESTIONNAIRE 2010 ON ENVIRONMENT STATISTICS
 and United Nations Environment Programme (UNEP) QUESTIONNAIRE 2010 ON ENVIRONMENT STATISTICS") UNSD United Nations Statistics Division (UNSD) and United Nations Environment Programme (UNEP) QUESTIONNAIRE 2010 ON ENVIRONMENT STATISTICS Section: WATER TABLE OF CONTENTS Guidance Definitions Table W1
UNSD United Nations Statistics Division (UNSD) and United Nations Environment Programme (UNEP) QUESTIONNAIRE 2010 ON ENVIRONMENT STATISTICS Section: WATER TABLE OF CONTENTS Guidance Definitions Table W1
Water Account, Mauritius 2013
 Republic of Mauritius Water Account, Mauritius 2013 Statistics Mauritius, Ministry of Finance and Economic Development June 15 Contents Foreword... III List of Symbols and Abbreviations... IV 1. Introduction...
Water Pollution and Water Quality (Nazaroff & Alvarez-Cohen, Sections 6.A and 6.B) (with additional materials)
 (with additional materials)") Water Pollution and Water Quality (Nazaroff & Alvarez-Cohen, Sections 6.A and 6.B) (with additional materials) Water is a basic necessity of nature and humans. We use water for: -drinking - food preparation
Water Pollution and Water Quality (Nazaroff & Alvarez-Cohen, Sections 6.A and 6.B) (with additional materials) Water is a basic necessity of nature and humans. We use water for: -drinking - food preparation
Chapter 14. Water Pollution
 Chapter 14 Water Pollution The Chesapeake Bay Chesapeake Bay largest estuary in the US Pollutants: Excess nitrogen and phosphorus From 3 major sources: Consequence of increased nutrients Sediment increase
Introduction to Core Accounting Principles on SEEA and SNA
 Introduction to Core Accounting Principles on SEEA and SNA Julian Chow United Nations Statistics Division 16-18 November 2015 Shanghai Objectives of the Session Introduce and recall some fundamentals of
Comprehensive Plan Update - Sanitary Sewer Section Planning Commission Workshop: November 10, 2014
 Comprehensive Plan Update - Sanitary Sewer Section Planning Commission Workshop: November 10, 2014 Application type Agency Review Comments Applicable Plan Sections Staff Planner Staff Recommendation Publicly
THE DATA COLLECTION AND COMPILATION PROCESSES
 6 November 2013 Rev 31 Chapter 3 THE DATA COLLECTION AND COMPILATION PROCESSES This chapter is based on the list of data items of the IRWS. The different sources of data are discussed as well as the particularities
Thames River Water Quality 2017
 Thames River Water Quality 2017 City Of London Environment and Engineering Services June 2018 Purpose: To present information on the water quality of the Thames River for 2017. Executive Summary Thames
Pollutants in our Waters
 Pollutants in our Waters CARIWIN Advanced Course in IWRM September 17, 2007 Apurva Gollamudi Brace Centre for Water Resources Management McGill University It isn t the pollution that s harming the environment.
Activities of Water Environment Management by Yangon Regional ECD. Daw Khin Thida Tin Director Environmental Conservation Department Yangon Region
 Activities of Water Environment Management by Yangon Regional ECD Daw Khin Thida Tin Director Environmental Conservation Department Yangon Region Outlines Background Environmental Policy and Legislation
We used these results to calculate the Water Quality Index (WQI) using this formula:
 using this formula:") Water Quality Study The water quality study of Sungai Way was undertaken by a certified laboratory (EraLab) on Friday, March 7, 2008 from 9.30am to 12pm. The official Certificate of Analysis of the water
Water Quality Study The water quality study of Sungai Way was undertaken by a certified laboratory (EraLab) on Friday, March 7, 2008 from 9.30am to 12pm. The official Certificate of Analysis of the water
Water Asset Account in Physical Terms
 Water Asset Account in Physical Terms Regional Training Workshop on the System of Environmental-Economic Accounting with a Focus on Water Accounting September 26-30, 2016 Putrajaya, Malaysia François Soulard
Report on the Global Assessment of Water Statistics and Water Accounts. Prepared by the United Nations Statistics Division
 Statistical Commission Fortieth session 24-27 February 2009 Item 3 (d) of the provisional agenda Environmental-Economic Accounting Background document Available in English only Report on the Global Assessment
City of Texarkana, Arkansas. Storm Water Pollution
 City of Texarkana, Arkansas Storm Water Pollution STORM WATER GUIDE What is Storm Water Pollution? Stormwater can provide a toxic discharge which can enter into a lake, river or coastal water system. As
Pilot Arno Water Accounts. 2 Workshop. Exercise and Workbook. Building water flow diagrams for The pilot sub-basins & Review data sources
 Pilot Arno Water Accounts 2 Workshop Exercise and Workbook Building water flow diagrams for The pilot sub-basins & Review data sources 2 July 2014 30 June 2014 Rev 0.1 1 P a g e Natural water cycle Exercises:
Factsheet: Town of Deep River Water Quality and Stormwater Summary
 79 Elm Street Hartford, CT 06106-5127 www.ct.gov/deep Affirmative Action/Equal Opportunity Employer Factsheet: Town of Deep River Water Quality and Stormwater Summary This document was created for each
Water Pollution. Dr. Sireen Alkhaldi/ Community Medicine
 Water Pollution Dr. Sireen Alkhaldi/ Community Medicine Water Situation 85% of the world population lives in the driest half of the planet (United Nations, 2013) 1 billion people do not have access to
Little Cypress Bayou Special Study - Subwatershed 1.10
 - Subwatershed 1.1 Sabine River Authority of Texas August 31, 21 Prepared in Cooperation with the Texas Natural Resource Conservation Commission Under the Authorization of the Texas Clean Rivers Act Table
CE 370. Wastewater Characteristics. Quality. Wastewater Quality. The degree of treatment depends on: Impurities come from:
 CE 37 Wastewater Characteristics Quality Wastewater Quality The degree of treatment depends on: Influent characteristics Effluent characteristics Impurities come from: Domestic activities Industrial activities
Tackling Non-point Source Water Pollution in British Columbia
 Water Quality Clean Water Tackling Non-point Source Water Pollution in British Columbia Our well-being depends on sustainable supplies of clean water for our physical health and for a healthy environment
Study Session 7 Pollution: Types, Sources and Characteristics
 Study Session 7 Pollution: Types, Sources and Characteristics Copyright 2016 The Open University Contents Introduction 3 Learning Outcomes for Study Session 7 3 7.1 What is pollution? 3 7.2 Physical nature
Appendix X: Non-Point Source Pollution
 Appendix X: Non-Point Source Pollution Sources Nonpoint source of pollution, unlike pollution from industrial and sewage treatment plants, comes from many different sources. Nonpoint source pollution is
Factsheet: City of West Haven Water Quality and Stormwater Summary
 79 Elm Street Hartford, CT 06106-5127 www.ct.gov/deep Affirmative Action/Equal Opportunity Employer Factsheet: City of West Haven Water Quality and Stormwater Summary This document was created for each
Septic System Impacts on Stormwater and Impaired Waterbodies. December 8, 2016 Tim Denison, Johnson Engineering Marcy Frick, Tetra Tech
 Septic System Impacts on Stormwater and Impaired Waterbodies December 8, 2016 Tim Denison, Johnson Engineering Marcy Frick, Tetra Tech Presentation Overview Charlotte County: Many areas adjacent to impaired
6. Pollutant Sources in
 6. Pollutant Sources in 45 6. Pollutant Sources in the Plum Creek Watershed The LDC analysis for Plum Creek indicates that both point and nonpoint sources contribute pollutants in the watershed. Identifying
Water and Waste Water Management in Yangon, Myanmar
 Union of Myanmar Ministry of Agriculture and Irrigation Irrigation Department Water and Waste Water Management in Yangon, Myanmar Mu Mu Than Staff Officer, Irrigation Department Myanmar March,2010 Socio-economical
Factsheet: Town of East Lyme Water Quality and Stormwater Summary
 79 Elm Street Hartford, CT 06106-5127 www.ct.gov/deep Affirmative Action/Equal Opportunity Employer Factsheet: Town of East Lyme Water Quality and Stormwater Summary This document was created for each
Water Quality: The Basics
 Water Quality: The Basics Environmental Science Why is Water Quality Important? Effects all humans Safe drinking water Allows for food productions and SAFE food products Effects Wildlife Health domestic
Best Practice in Sewage and Effluent Treatment Technologies
 Best Practice in Sewage and Effluent Treatment Technologies Contents 1 Wastewater - Introduction 1 1.1 Earth s ecological system 1 1.1.1 Water effect on ecology 2 1.1.2 Wastewater generation 3 1.2 Wastewater
Basic knowledge of Wastewater
 Basic knowledge of Wastewater Wastewater What is wastewater! The used water and solids from our activities such as washing, bathing and from industrial uses such as cleaning raw material. The characteristics
Lagoons Operation and Management in New Brunswick
 Lagoons Operation and Management in New Brunswick Lagoons Provide secondary treatment to domestic wastewater by the action of bacteria stabilizing the organic matter in the wastewater. Benefits of lagoons:
ASSESSMENT OF WATER QUALITY AT PAON DHOI RIVER DURING MONSOON AND AFTER SEASON, SAHARANPUR (U.P.)
") ASSESSMENT OF WATER QUALITY AT PAON DHOI RIVER DURING MONSOON AND AFTER SEASON, SAHARANPUR (U.P.) *Malik Dinkar Department of Chemistry, M.S. College, Saharanpur U.P. *Author for Correspondence ABSTRACT
ASSESSMENT OF WATER QUALITY AT PAON DHOI RIVER DURING MONSOON AND AFTER SEASON, SAHARANPUR (U.P.) *Malik Dinkar Department of Chemistry, M.S. College, Saharanpur U.P. *Author for Correspondence ABSTRACT
Biological Treatment of Wastewater
 Biological Treatment of Wastewater Why do we treat sewage? Because the law requires it To protect public health by avoiding the spread of water borne diseases To protect the environment by avoiding eutrophication
Fundamental Concepts: Overview of Water Quality
 Fundamental Concepts: Overview of Water Quality Ann Kenimer Texas A & M University University Curriculum Development for Decentralized Wastewater Management NDWRCDP Disclaimer This work was supported by
National Pollution Discharge Elimination System (NPDES) Inventory and Analysis Summary Report for the Saluda- Reedy Watershed
 Inventory and Analysis Summary Report for the Saluda- Reedy Watershed") National Pollution Discharge Elimination System (NPDES) Inventory and Analysis Summary Report for the Saluda- Reedy Watershed Report Submitted to the Saluda-Reedy Watershed Consortium June 2007 Katherine
National Pollution Discharge Elimination System (NPDES) Inventory and Analysis Summary Report for the Saluda- Reedy Watershed Report Submitted to the Saluda-Reedy Watershed Consortium June 2007 Katherine
4.0 SAN GABRIEL RIVER WATERSHED MANAGEMENT AREA
 4.0 SAN GABRIEL RIVER WATERSHED MANAGEMENT AREA 4.1 Watershed Description 4.1.1 Watershed Land Use, Percent Impervious, and Population Land use in the San Gabriel River Watershed Management Area is approximately
Wastewater Pollutants & Treatment Processes. Dr. Deniz AKGÜL Marmara University Department of Environmental Engineering
 Wastewater Pollutants & Treatment Processes Dr. Deniz AKGÜL Marmara University Department of Environmental Engineering Wastewater combination of the liquid or water carried wastes removed from residences,
Factsheet: Town of Hamden Water Quality and Stormwater Summary
 79 Elm Street Hartford, CT 06106-5127 www.ct.gov/deep Affirmative Action/Equal Opportunity Employer Factsheet: Town of Hamden Water Quality and Stormwater Summary This document was created for each town
Monitoring Stormwater Best Management Practices: Why Is It Important and What To Monitor
 Monitoring Stormwater Best Management Practices: Why Is It Important and What To Monitor Scott D. Struck, Ph.D. US EPA, Urban Watershed Management Branch New Jersey Water Monitoring Workshop 4/20/2006
Factsheet: Town of Trumbull Water Quality and Stormwater Summary
 79 Elm Street Hartford, CT 06106-5127 www.ct.gov/deep Affirmative Action/Equal Opportunity Employer Factsheet: Town of Trumbull Water Quality and Stormwater Summary This document was created for each town
2-4- 3: Water Pollution
 2-4- 3: Water Pollution A"er this lecture, you should be able to: Iden6fy the various types of pollu6on (Unit 2-3) and describe their poten6al sources and effects with respect to water. Explain how dissolved
Overview of Chapter 21
 21 Water Pollution Overview of Chapter 21 Types of Water Pollution Water Quality Today Municipal Agricultural Industrial Improving Water Quality Laws Controlling Water Pollution Types of Water Pollution
Properties of Water. Their shapes change when they are in different containers. Their volumes stay the same in any container.
 Name: Date: 1. Which statement correctly describes both gases and liquids? Their shapes stay the same in any container. Their shapes change when they are in different containers. Their volumes stay the
N, B, & T: POLLUTANTS THREE
 N, B, & T: POLLUTANTS THR OBJCTIVS The student will do the following: 1. List and describe three types of surface water pollution (nutrient, bacterial, toxic). 2. Observe the effects of various water pollutants
Study Session 4 Liquid Wastes: Sources, Types and Characteristics
 Study Session 4 Liquid Wastes: Sources, Types and Characteristics Copyright 2016 The Open University Contents Introduction 3 Learning Outcomes for Study Session 4 3 4.1 Sources of liquid waste 3 4.1.1
Onsite/Decentralized Treatment is Important Nationally
 TITLE 5 SOIL EVALUATOR CERTIFICATION TRAINING ON-SITE SYSTEM BASICS PAUL SPINA, NEIWPCC Prepared for: Commonwealth of Massachusetts Department of Environmental Protection In conjunction with the New England
Total Solids (TS) - material remaining after evaporation of sample liquid
 - material remaining after evaporation of sample liquid") Page 1 of 8 Reference Two publications are widely used as the principal cookbooks for water and wastewater analysis: o Standard Methods for the Analysis of Water and Wastewater. American Water Works Association
Page 1 of 8 Reference Two publications are widely used as the principal cookbooks for water and wastewater analysis: o Standard Methods for the Analysis of Water and Wastewater. American Water Works Association
CHAPTER 4 WASTEWATER CHARACTERISTICS WASTEWATER FLOWS
 CHAPTER 4 WASTEWATER CHARACTERISTICS Wastewater collection, treatment, and disposal facilities are designed to handle specific hydraulic and pollutant loads for 20 or more years after they are constructed.
Water Pollution Overview. Sewage dumping
 Water Pollution Water Pollution Overview Sewage dumping Ocean Pollution Water Pollution Overview Urban Water Pollution Water Pollution Overview Water Pollution Overview Urban Runoff Water Pollution Overview
Acidity and Alkalinity:
 Evaluation of Pollution Sources to Lake Glenville Quarterly Report December 2018 Kimberlee K Hall, PhD Environmental Health Program, Western Carolina University Summary Chemical and microbial analysis
Duffin Creek Water Pollution Control Plant Technical Information
 Duffin Creek Water Pollution Control Plant Technical Information Plant History The Duffin Creek Water Pollution Control Plant (WPCP) is located on the northern shore of Lake Ontario in the City of Pickering
Compliance Guide for the Concentrated Aquatic Animal Production Point Source Category
 EPA 821-B-05-001 Compliance Guide for the Concentrated Aquatic Animal Production Point Source Category : Glossary Full document available at http://www.epa.gov/waterscience/guide/aquaculture Engineering
Chapter 2: Technology/Indicator Analysis
 2020 Facilities Plan State of the Art Report Chapter 2: Technology/Indicator Analysis 2.1 Introduction To begin the production theory analysis, specific water quality indicators and technologies that address
UNEP/AEO/ NEPAD Lead Indicators Change in incident of water borne diseases. UNSD suggestions. Population connected to public water supply
 Session 4: for the ECOWAS countries: level (based on research of official government websites), Questionnaire, NEPAD, (22 February 2005) Environmental health Environmentally related diseases: malaria,
An Environmental Health Perspective: Land Use Planning, Drinking Water and Onsite Sewage
 An Environmental Health Perspective: Land Use Planning, Drinking Water and Onsite Sewage Clare Audet, Environmental Health Officer Healthy Built Environment, Infrastructure Programs, Health Protection
Chapter : Water Pollution and Treatment
 Chapter : Water Pollution and Treatment Water Pollution Refers to degradation of water quality. Generally look at the intended use of the water How far the water departs from the norm Its effects on public
Physical Water Flow Accounts (PWFA)
") Physical Water Flow Accounts (PWFA) Manual (version 2014) draft version 18 November 2014 1 Table of Content Table of Content... 2 Preface... 4 Acknowledgement... 4 Important abbreviations... 4 1 Introduction...
Physical Water Flow Accounts (PWFA) Manual (version 2014) draft version 18 November 2014 1 Table of Content Table of Content... 2 Preface... 4 Acknowledgement... 4 Important abbreviations... 4 1 Introduction...
Indian Standard DRINKING WATER SPECIFICATION (Second Revision)
") APPENDIX I BIS (IS 10500: 2012) Indian Standard DRINKING WATER SPECIFICATION (Second Revision) Sl No. Characteristic Requirement (Acceptable Limit) Permissible Limit in the Absence of Alternate Source
APPENDIX I BIS (IS 10500: 2012) Indian Standard DRINKING WATER SPECIFICATION (Second Revision) Sl No. Characteristic Requirement (Acceptable Limit) Permissible Limit in the Absence of Alternate Source
Executive Summary EXECUTIVE SUMMARY. ES.1 Monitoring Program Objectives. ES.2 Summary of Monitoring Results
 EXECUTIVE SUMMARY ES.1 Monitoring Program Objectives The following are the major monitoring program objectives, as outlined in the Municipal Stormwater Permit: Assess compliance with the Municipal Stormwater
The Use of Human Health Risk Assessment as a Tool in the Assessment of Reclaimed Municipal Wastewater
 The Use of Human Health Risk Assessment as a Tool in the Assessment of Reclaimed Municipal Wastewater Karen Phillipps, M.Sc., DABT Intrinsik Environmental Sciences Inc., Calgary, AB Presentation at Watertech,
POTABLE WATER SUPPLY DEFINITIONS
 Definitions POTABLE WATER SUPPLY DEFINITIONS AQUIFER. A porous, water-bearing geologic formation. Generally restricted to materials capable of yielding an appreciable supply of water. BASIN. A natural
Hence, most commentators will indicate a range of values for effluent quality and maybe put forward a typical concentration.
 NOTES on SEPTIC TANK EFFLUENT QUALITY Prepared By: Ian Gunn, On-Site NewZ 25 August 2014 1.0 Background Information on septic tank effluent quality is particularly hard to come by as: the amount of work
How does water cycle?
 How does water cycle? Will we have enough useable water? Although the vast majority of Earth is covered in water, one in eight people lacks access to clean freshwater. What will happen in 20 years? About
Maine Department of Environmental Protection Program Guidance on Combined Sewer Overflow Facility Plans
 Maine State Library Maine State Documents Land and Water Quality Documents Environmental Protection 9-1-1994 Maine Department of Environmental Protection Program Guidance on Combined Sewer Overflow Facility
Developing Water Quality Monitoring Programs for Agricultural Runoff/Discharges in the Central Valley of California
 Developing Water Quality Monitoring Programs for Agricultural Runoff/Discharges in the Central Valley of California G. Fred Lee, PhD, PE, DEE & Anne Jones-Lee, PhD G. Fred Lee & Associates El Macero, CA
Overview of Chapter 21
 21 Water Pollution Overview of Chapter 21 Types of Water Pollution Water Quality Today Agricultural, Municipal, Industrial, Groundwater, Water pollution internationally Improving Water Quality Laws Controlling
Environmental Management System
 Environmental Management System Moreton Bay Research Station (MBRS) Water Management Program 1. Program Scope The Water Management Program incorporates all the water used throughout the Moreton Bay Research
Onsite Systems, Soils, and Climate Change Jennifer Cooper University of Rhode Island
 Onsite Systems, Soils, and Climate Change Jennifer Cooper University of Rhode Island Overview OWTS technologies Wastewater renovation Climate change Initial results Next step New England Pop. NE US = 55
Manitoba Water Quality Standards, Objectives, and Guidelines Dwight Williamson, Manager Water Quality Management Section Manitoba Conservation
 Manitoba Water Quality Standards, Objectives, and Guidelines 2002 Dwight Williamson, Manager Water Quality Management Section Manitoba Conservation 1 Outline Brief history Review process Overview of proposed
DC STORMWATER PLAN CONSOLIDATED TOTAL MAXIMUM DAILY LOAD (TDML) IMPLEMENTATION PLAN
 IMPLEMENTATION PLAN") DC STORMWATER PLAN CONSOLIDATED TOTAL MAXIMUM DAILY LOAD (TDML) IMPLEMENTATION PLAN CONTENTS Introduction 1 The Challenge 5 The Solution 7 Tracking Progress 11 What can you do? 15 INTRODUCTION The DC Stormwater
DC STORMWATER PLAN CONSOLIDATED TOTAL MAXIMUM DAILY LOAD (TDML) IMPLEMENTATION PLAN CONTENTS Introduction 1 The Challenge 5 The Solution 7 Tracking Progress 11 What can you do? 15 INTRODUCTION The DC Stormwater
Kangaré Water. An Introduction to Environmental Economic Accounts for Water (SEEA-Water) WORKBOOK
 WORKBOOK") Kangaré Water An Introduction to Environmental Economic Accounts for Water (SEEA-Water) WORKBOOK 7 September 2012 Based on the introduction to national accounts exercise prepared by NGO Thi Cuc and Jean-Louis
Kangaré Water An Introduction to Environmental Economic Accounts for Water (SEEA-Water) WORKBOOK 7 September 2012 Based on the introduction to national accounts exercise prepared by NGO Thi Cuc and Jean-Louis
PRESENTATION OUTLINE. Stormwater Program Update Stormwater Overview. Education Program Discussion. Sources and consequences of pollutants
 PRESENTATION OUTLINE Stormwater Program Update Stormwater Overview Sources and consequences of pollutants Education Program Discussion Why Stormwater? 1972 Clean Water Act Established permitting program
Hydrology and Water Quality. Water. Water 9/13/2016. Molecular Water a great solvent. Molecular Water
 Hydrology and Water Quality Water Molecular Water Exists as an equilibrium But equilibrium altered by what is dissolved in it Water Molecular Water a great solvent In reality, water in the environment
Hydrology and Water Quality. Water. Water 9/11/2018. Molecular Water a great solvent. Molecular Water
 Hydrology and Water Quality Water Molecular Water Exists as an equilibrium But equilibrium altered by what is dissolved in it Water Molecular Water a great solvent In reality, water in the environment
Water Pollution. Water Pollution: Two Main Causes: Two Types of Sources. Iron Mine Pollution. Oil leak into bay
 Water Pollution: Water Pollution any chemical, physical or biological agent added to water that decreases water quality and affects organisms Two Main Causes: Industrialization: Developed countries Dumping
Water Statistics elease dat e: Oct ober, 2017
 Water Statistics 2016 Released date: Dat: October, Oct ob5 2017 Contents Introduction... 3 Key Points... 4 Water statsics... 4 Desalinated water statistcs... 4 Consumption of desalinated water... 4 Consumption
Read: Case Study: America s First River : A Success Story Summarize the story of the Hudson River and PCB s:
 Botkin & Keller: Environmental Science: Earth as a Living Planet- 8th Ed. APES- Chapter #19- Water Pollution and Treatment- Guided Reading Name: Brandon Tran Learning Objectives: Degradation of our surface-water
Impacts of Rainfall Events on Water Quality in the Houston Metro Area
 Impacts of Rainfall Events on Water Quality in the Houston Metro Area Hanadi Rifai and Anuradha Desai Civil and Environmental Engineering University of Houston, Houston, TX Acknowledgments TCEQ EPA Houston
Which Data Are Important And Why? Barry Tonning Tetra Tech
 Which Data Are Important And Why? Barry Tonning Tetra Tech Last week... In-stream monitoring parameters Chemical, physical, biological Including in-stream habitat parameters Bank area assessment Vegetation,
Characteristics of Wastewater
 Characteristics of Wastewater What is Wastewater? Wastewater is sewage, stormwater, and water that have been used for various purposes around the community. Unless properly treated, wastewater can harm
WATER TREATMENT & POLLUTION
 WATER TREATMENT & POLLUTION WATER POLLUTANTS Any chemical, biological, physical change in water quality that has a harmful effect on living organisms or make water unsuitable for desired uses Types of
Mid-Halton Wastewater (Sewage) Treatment Plant Expansion And Effluent Sewer Public Information Centre # 1 May 14, 2009
 Treatment Plant Expansion And Effluent Sewer Public Information Centre # 1 May 14, 2009") INFORMATION BRIEF MID-HALTON WASTEWATER (SEWAGE) TREATMENT PLANT EXPANSION AND EFFLUENT SEWER SCHEDULE C CLASS ENVIRONMENTAL ASSESSMENT PUBLIC INFORMATION CENTRE (PIC) # 1 1 Municipal Class Environmental
INFORMATION BRIEF MID-HALTON WASTEWATER (SEWAGE) TREATMENT PLANT EXPANSION AND EFFLUENT SEWER SCHEDULE C CLASS ENVIRONMENTAL ASSESSMENT PUBLIC INFORMATION CENTRE (PIC) # 1 1 Municipal Class Environmental