Leesville Lake Water Quality Monitoring
|
|
|
- Rafe Moody
- 6 years ago
- Views:
Transcription

1 Leesville Lake Water Quality Monitoring Prepared for: Leesville Lake Association Prepared by: Dr. Thomas Shahady Lynchburg College Funds Supplied by: American Electric Power & Leesville Lake Association
2 (Page Left Intentionally Blank) 2
3 Table of Contents List of Tables. List of Figures List of Maps... List of Acronyms and Abbreviations.... Executive Summary... Section 1: Current Conditions (Year 2015) General Methods Water Quality: Current Test Results (Year 2015) Temporal Analysis by Station Dam (Lacustrine) Mile Marker 6 (Transition) Toler Bridge (Riverine) Other Data..... Section 2: Lake Wide Trending Analysis of Trophic State Analysis of Pigg River. Section 4: Management Implications..... References... Appendix A: Water Parameter Testing Details... Appendix B: Quality Assurance (QA) / Quality Control (QC).. Appendix C: Quality Assurance (QA) / Quality Control (QC) Checklist... Page iv v vi vii ix
4 List of Tables ID Table Description Page 1.0 Leesville Lake 2015 Sampling Sites Dam (Lacustrine) Conductivity (µs/cm) Measures Over Study Period (2015) Dam (Lacustrine) Dissolved Oxygen (mg/l) Measures Over Study Period 5 (2015) 1.3 Dam (Lacustrine) Temperature (Degrees C) Measures Over Study Period 7 (2015) 1.4 Dam (Lacustrine) Fluorometer Measured Chlorophyll a (ppb) (Degrees C) 8 Measures Over Study Period (2015) 1.5 Typical Trophic State Indicators For Lakes Dam (Lacustrine) ph Measures Over Study Period (2015) Dam (Lacustrine) ORP Measures Over Study Period (2015) Dam (Lacustrine) Turbidity (NTU) Measures Over Study Period (2015) Dam (Lacustrine) Other Parameters Over Study Period (2015) Mile Marker 6 (Transition) Conductivity (µs/cm) Measures Over Study Period 17 (2015) 1.11 Mile Marker 6 (Transition) Dissolved Oxygen (mg/l) Measures Over Study 18 Period (2015) 1.12 Mile Marker 6 (Transition) Temperature (Degrees C) Measures Over Study 20 Period (2015) 1.13 Mile Marker 6 (Transition) Fluorometer Measured Chlorophyll a (ppb) 21 (Degrees C) Measures Over Study Period (2015) 1.14 Mile Marker 6 (Transition) ph Measures Over Study Period (2015) Mile Marker 6 (Transition) ORP Measures Over Study Period (2015) Mile Marker 6 (Transition) Turbidity (NTU) Measures Over Study Period 25 (2015) 1.17 Mile Marker 6 (Transition) Other Parameters Over Study Period (2015) Toler Bridge (Riverine) Conductivity (µs/cm) Measures Over Study Period 28 (2015) 1.19 Toler Bridge (Riverine) Dissolved Oxygen (mg/l) Measures Over Study 29 Period (2015) 1.20 Toler Bridge (Riverine) Temperature (Degrees C) Measures Over Study Period 30 (2015) 1.21 Toler Bridge (Riverine) Fluorometer Measured Chlorophyll a (ppb) (Degrees 32 C) Measures Over Study Period (2015) 1.22 Toler Bridge (Riverine) ph Measures Over Study Period (2015) Toler Bridge (Riverine) ORP Measures Over Study Period (2015) Toler Bridge (Riverine) Turbidity (NTU) Measures Over Study Period (2015) 35 4
5 1.25 Toler Bridge (Riverine) Other Parameters Over Study Period (2015) Leesville Lake Marina Other Parameters Measured Over Study Period (2015) 37 5
6 List of Tables Cont Tri County Marina Other Parameters Measured Over Study Period (2015) Mile Marker 9 Other Parameters Measured Over Study Period (2015) Smith Mountain Lake Tail Waters Other Parameters Measured Over Study 38 Period (2015) 1.30 Pigg River Other Parameters Measured Over Study Period (2015) Pigg River Dissolved Oxygen (mg/l) Measures Over Study Period (2015) Pigg River Temperature (Degrees C) Measures Over Study Period (2015) Pigg River ph Measures Over Study Period (2015) Pigg River Conductivity (µs/cm) Measures Over Study Period (2015) Pigg River Turbidity (NTU) Measures Over Study Period (2015) Pigg River ORP Measures Over Study Period (2015) 40 List of Figures ID Figure Description Page 1.1 Dam (Lacustrine) Conductivity (µs/cm) Measures Over Study Period 3 (2015) 1.2 Dam (Lacustrine) Dissolved Oxygen (mg/l) Measures Over Study 5 Period (2015) 1.3 Dam (Lacustrine) Temperature (Degrees C) Measures Over Study Period 6 (2015) 1.4 Dam (Lacustrine) Fluorometer Measured Chlorophyll a (ppb) (Degrees 9 C) Measures Over Study Period (2015) 1.5 Dam (Lacustrine) ph Measures Over Study Period (2015) Dam (Lacustrine) ORP Measures Over Study Period (2015) Dam (Lacustrine) Turbidity (NTU) Measures Over Study Period (2015) Mile Marker 6 (Transition) Conductivity (µs/cm) Measures Over Study 18 Period (2015) 1.9 Mile Marker 6 (Transition) Dissolved Oxygen (mg/l) Measures Over 19 Study Period (2015) 1.10 Mile Marker 6 (Transition) Temperature (Degrees C) Measures Over 21 Study Period (2015) 1.11 Mile Marker 6 (Transition) Fluorometer Measured Chlorophyll a (ppb) 22 (Degrees C) Measures Over Study Period (2015) 1.12 Mile Marker 6 (Transition) ph Measures Over Study Period (2015) Mile Marker 6 (Transition) ORP Measures Over Study Period (2015) Mile Marker 6 (Transition) Turbidity (NTU) Measures Over Study Period (2015) 27 6
7 1.15 Toler Bridge (Riverine) Conductivity (µs/cm) Measures Over Study 28 Period (2015) 1.16 Toler Bridge (Riverine) Dissolved Oxygen (mg/l) Measures Over Study 30 Period (2015) List of Figures cont Toler Bridge (Riverine) Temperature (Degrees C) Measures Over Study 30 Period (2015) 1.18 Toler Bridge (Riverine) Fluorometer Measured Chlorophyll a (ppb) 31 (Degrees C) Measures Over Study Period (2015) 1.19 Toler Bridge (Riverine) ph Measures Over Study Period (2015) Toler Bridge (Riverine) ORP Measures Over Study Period (2015) Toler Bridge (Riverine) Turbidity (NTU) Measures Over Study Period 34 (2015) 2.1 Trophic State Index (TSI) based upon Secchi disk measurements in 41 Leesville Lake from Trophic State Index (TSI) based upon TP measurements in Leesville 42 Lake from Trophic State Index (TSI) based upon Chl a measurements in Leesville 42 Lake from Trophic State Index (TSI) based upon average measurements in Leesville 43 Lake from Daphnia abundance based upon average measurements in Leesville Lake 44 from The relationship between TP and Chlorophyll a years The relationship between TP and Chlorophyll a years A photo of water entering Leesville Lake from the mouth of the Pigg 47 River on September 30, 2015 after heavy rains (up to 5 ) 2.9 Additional photo of water entering Leesville Lake from the mouth of the 48 Pigg River demonstrating strong contrast of Pigg and Leesville Lake A photo of water entering Leesville Lake from the mouth of the Pigg 49 River on September 30, 2015 flowing towards Toler Bridge 2.11 A photo of sediment laden water after it has mixed with Leesville Lake 50 and SML Dam release A photo of water near MM6 on Leesville Lake taken on September 30, Trophic State Index (TSI) based upon TP measurements in Leesville Lake from List of Maps 7
8 ID Map Description Page 4.1 Leesville Lake Water Quality Monitoring Stations w/ DEQ Identification Map of Pigg River and Old Woman s Creek Watersheds Map of Leesville Lake Area 56 8
9 List of Acronyms and Abbreviations AEP American Electric Power DCR Virginia Department of Conservation & Recreation DEQ Virginia Department of Environmental Quality DO Dissolved Oxygen EIS Environmental Impact Statement EPA United States Environmental Protection Agency FERC Federal Energy Regulatory Commission FPA Federal Power Act LLA Leesville Lake Association ORP Oxygen Reduction Potential SML Smith Mountain Lake SMP Shoreline Management Plan TMDL Total Maximum Daily Load TP Total Phosphorus TSI Trophic State Index TSS Total Suspended Solids VDEQ Virginia Department of Environmental Quality 9
10 Executive Summary The Leesville Lake water quality monitoring program has several aspects: (1) conduct water quality monitoring consistent with Appalachian Power Company's Water Quality Monitoring Plan as approved by the Federal Energy Regulatory Commission, (2) monitor compliance with state water quality standards, (3) monitor eutrophication in the lake, and (4) make recommendations for identified problems. This report summarizes the findings under each of these aspects for the 2015 sampling year. Leesville Lake met all Virginia DEQ water quality standards for measured parameters including dissolved oxygen, temperature, ph, and Chlorophyll a. For Escherichia coli (E. Coli), all stations remained at or below the 10% of the total samples in the assessment period below the 235 E. coli CFU/100 ml standard. Pigg River confluence continued to be the greatest area of concern for E. coli and 60% of the samples exceeded the standard.. Chlorophyll a seasonal averages in the lacustrine portion of the lake were 20.6 ug/l. Some measures between 4-6 meters depth were much higher but hydrology of the reservoir appears to mitigate this problem. Total phosphorus (TP) seasonal averages at dam surface were 70.6 ug/l. The lake continues to exhibit mild eutrophic conditions. Average trophic state index is 55.2 in the lower portion of the lake. This gives Leesville Lake a moderately eutrophic rating as values below 50 are necessary to classify the lake as mesotrophic. This is primarily a result of elevated TP and Chlorophyll a concentrations. Greater understanding of Pigg River contributions to lake water suggest worsening water quality inputs are adversely impacting the health of the lake. Trophic state analysis in this portion of the lake are worsening. Based upon analysis of current trends the following recommendations are made: Closely monitor the developing phytoplankton blooms that occur in the reservoir at 4-5 meters depth during warmer months (June-August). Very high productivity readings have been measured here and warrant greater study and understanding. Continued monitoring Pigg River water quality and document other inputs worsening water quality in the reservoir. Station MM6 recorded much greater E. coli concentrations than Toler Bridge station in October. This suggests other inputs below the Pigg River are important or hydrology is isolating pockets of poor water quality traveling down the reservoir. This needs documentation. Continued analysis of the biological conditions present in the reservoir. Populations of zooplankton, forage fish and curly leaf pond weed need to be monitored for abrupt changes that may influence water quality. 10
11 Hydrology must be better documented and correlated to observed water quality. 11
12 Section 1: Current Conditions (Year 2015) 1.1 General: This is the sixth year of water quality monitoring of Leesville Lake by Lynchburg College in partnership with Leesville Lake Association (LLA). Six years of data continue to strengthen our understanding of water quality and allows us to pinpoint areas of concern and management. At the end of this report, trends from these six years of sampling are examined and a more detailed analysis of Pigg River hydrology (Sections 5) and Influence of Reduction Trends on Magnesium (section 6) are presented. This section documents results for the current year s sampling by Lynchburg College and Leesville Lake volunteers. Data are reported in tabular form to facilitate future analysis and in graphical form to facilitate visualization of emerging trends. This project continues to provide essential baseline results for the condition of the lake. We look forward to the continued study of the lake. 1.2 Methods: Data were collected by Lynchburg College through a series of water samplings and testing from April through October, when lake productivity is high. The following eight sites continue to be sampled, as stated in the Leesville Lake Water Monitoring Plan: Table 1.0. Leesville Lake 2015 Sampling Sites Lynchburg College Station Leesville Lake Association Station Site ID DEQ Station ID Latitude Longitude LVLAROA Leesville Lake Dam Leesville Lake LLAOWC Marina Tri County LLATER Marina Mile Marker LLAROA Mile Marker LLAROA Toler Bridge LLAROA Pigg River LLAPGG Smith Mtn LVLAROA
13 Tail Waters Samples were collected at each station on a monthly basis by Lynchburg College: April 29, May 18, June 25, July 28, August 28, September 30 and October 30. Additional water sampling was provided by volunteers at selected sites on June 11, July 8 and August 13. For more detail concerning water quality testing parameters, quality assurance (QA) and quality control (QC), and background information please see Appendix A, B, C and D. 1.3 Water Quality: Current Test Results (2015) Temporal Analysis by Station Background The analysis of results is based upon our division of the reservoir (Leesville Lake) into three distinct zones. In the portion near the Leesville Lake dam, we consider the reservoir to be Lacustrine and we have labeled this region the Dam site. This classification suggests the reservoir will take on qualities we often see associated with natural lakes. It is the deepest portion of the reservoir and less likely to be immediately affected by river inputs. It should show the strongest levels of stratification and develop patterns of biology, chemistry and physical processes better understood from lake limnology. However, the lacustrine zone is not isolated from Riverine influences. During high volume storm events stratification is broken down in these areas and the reservoir resembles a river from headwaters to the dam. The middle portions of the reservoir are considered the transition zones. This is represented by Mile Marker 6 (MM6) in our study. In this area, the Lacustrine portions of the reservoir meet the Riverine dominated sections. This area often exhibits the highest areas of productivity due to river inputs of nutrients yet slows water velocities allowing biological processes to flourish. This defined area may move in the reservoir as Riverine processes exert influence. This is again driven by hydrological inputs. In our best analysis, it is acceptable to observe the transition zone based upon depth, nutrient transport and productivity. The upper portions of the reservoir are considered Riverine. This is represented by the Toler Bridge site in our study. The reservoir s Riverine Section behaves much like a large river system. While nutrients are often elevated in this region, so are the sediment inputs. This limits potential limnetic (open water) biological productivity but often creates ideal conditions for littoral (shoreline) production. Nuisance rooted vegetation often takes hold in this portion of the reservoir. Inputs from Riverine areas often determine water quality parameters for the Lacustrine portions. 13
14 Additionally, several sites throughout the reservoir were sampled for specific reasons. We sampled marinas at the lake (Leesville Lake and Tri County Marinas) due to concern for possible Escherichia coli (E. coli) contamination. We sampled Mile Marker 9 to study a point above the transition zone, where the lake becomes riverine. We sampled the Pigg River confluence to determine the potential impacts this river has on water quality in the lake. Finally, we sampled Smith Mountain Lake tail waters to evaluate water quality entering the Leesville Lake. The following analysis divides the reservoir into these three sections and then discusses the additional sampling stations with regard to expected and observed results. One of the difficulties for predicting water quality trends in Leesville Lake is the artificially influenced hydrology. While expectations are outlined, operations of the Smith Mountain Lake Dam are a dominant hydrological feature and create difficulty in predicting the water quality of Leesville Lake Dam (Lacustrine) The area near the Leesville Lake dam is considered a Lacustrine section. It exhibits characteristics similar to a lake and can be analyzed for similarities to lake conditions. Conductivity 14
15 Figure 1.1. Dam (Lacustrine) Conductivity (µs/cm) measures over study period (2015). Conductivity (Figure 1.1) measures demonstrate changes in hydrology. In 2015 conductivity remained relatively consistent with past observations. Small changes do occur in conductivity, with higher measures generally from rain inputs received in the spring and lower measures over the summer months. These measures provide a good background measure for water quality; therefore any observed spikes in conductivity would provide reason for concern. Throughout 2015, conductivity results do not provide reason for concern about water quality in the reservoir. Data is clumped among the spring dates and August (near 0.25) and the remaining sampling events (<0.20). Table 1.1. Dam (Lacustrine) Conductivity (µs/cm) Measures Over Study Period (2015). 29-Apr 18-May 25-Jun 28-Jul 28-Aug 30-Sep 30-Oct Depth (m): Conductivity (μs/cm) Dissolved Oxygen Each year of data for profiles of dissolved oxygen (Figure 1.2) strengthen the conclusion that Leesville Lake is a eutrophic reservoir. Furthermore, a general pattern has emerged. In the epilimnion (upper 2 meters) the water is well oxygenated and stable. Particularly in June of 2015, water was well oxygenated throughout the epilimnion. In the metalimnion (2-6 meters) 15
16 transition occurs. In all measures, water displayed a decrease in dissolved oxygen with depth, marking the beginning a negative heterograde. In the hypolimnion, oxygen continues to decrease through all depths on all sampling dates. Depending on time of year and strength of stratification, the loss of oxygen may be more or less pronounced. Particularly in July and August of this year, oxygen loss was very high and of concern for the reservoir. This strength of oxygen loss causes chemical changes in the hypolimnion that are worrisome (will be discussed in Section 4). Correlations to observed peaks of Chlorophyll a (Figure 1.4) the months of July and August demonstrate very high peaks of Chlorophyll at the metalimnion as also reflected in the oxygen data. These continued blooms (that are strengthening) also likely contribute to the greater loss of oxygen in the hypolimnion (bacterial respiration through breakdown of these algal blooms). Conditions in the reservoir capable of producing these high concentration blooms of phytoplankton below the surface are concerning and need continued monitoring and evaluation. This presents a well established pattern in Leesville Lake and requires further study. Figure Dam (Lacustrine) Dissolved Oxygen (mg/l) measures over study period (2015), These data will be looked at in conjunction with Temperature (Figure 1.3). Table 1.2. Dam (Lacustrine) Dissolved Oxygen (mg/l) Measures Over Study Period (2015). 16
17 Depth (m) 29-Apr 18-May 25-Jun 28-Jul 28-Aug 30-Sep 30-Oct Temperature Again, the warmest months did not exhibit the greatest degree of stratification nor the warmest temperatures in the reservoir. In 2015, June had the highest temperature of water in the hypolimnion and August displayed the warmest water throughout the reservoir (Figure 1.3). Interestingly, this set conditions in the lake for producing a positive heterograde pattern and high peaks of Chlorophyll a in the metalimnion. Also the relatively cool temperatures in the epilimnion and warm temperatures in the hypolimnion during the warmer months suggest that mixing is a very significant driver of water quality in the reservoir. Analyzing oxygen and temperature data together supports the conclusion that the reservoir is eutrophic. Interestingly, weak or no stratification in temperature is associated with a much stronger patterns of oxygen depletion in the hypolimnion. With weaker stratification, oxygen loss is greater (Figure 1.2). 17
18 Figure 1.3. Dam (Lacustrine) Temperature (Degrees C) measures over study period (2015). 18
19 Table 1.3. Dam (Lacustrine) Temperature (Degrees C) Measures Over Study Period (2015). Depth (m) 29-Apr 18-May 25-Jun 28-Jul 28-Aug 30-Sep 30-Oct Chlorophyll a The depth and seasonal content of chlorophyll a in the water (Figure 1.4, Table 1.4) illustrates the productivity patterns in the reservoir. Similar to the pattern observed in previous years, high concentrations of chlorophyll a were observed in the metalimnion (transition zone between the epilimnion and the hypolimnion). In 2015, we observed very high levels of Chlorophyll a in the metalimnion. This suggests layers in the lake seem very well established and the blooms throughout the metalimnion a consistent trend when mixing from either intensive rain events (greater than 2 inches over a 24hour period) or excessive heat causing operations of Smith Mountain Lake Dam to intensify, along with increased water release and pump back. A greater understanding of the apparent relationship between nutrient availability and phytoplankton blooms is needed. Obtaining nutrient samples at the surface and at 4 meters will provide appropriate data to increase our understanding. These samples will also undergo further testing for phytoplankton species and chlorophyll analysis. Results will be presented in the 2016 report. Based on the parameters of trophic state for lakes and reservoirs (Table 1.5), the blooms of phytoplankton in the metalimnion are suggestive of a eutrophic lake. Additionally, concentrations of total phosphorus (Table 1.9) fluctuate within the range associated with a 19
20 eutrophic condition. The pattern is difficult to discern at times due to the changes occurring throughout the reservoir and the heavy influx of sediment during rain events. 20
21 Figure 1.4. Dam (Lacustrine) Chlorophyll a (ppb) concentrations over study period (2015). Table 1.4. Dam (Lacustrine) Chlorophyll a (ppb) concentrations over study period (2015). Depth 29-Apr 18-May 25-Jun 28-Jul 28-Aug 30-Sep 30-Oct (m):
22 Table 1.5. Typical trophic state indicators for lakes 1. Organic Matter TP mg/l Avg Chl a (ppb) Secchi Depth (M) TSI Oligotrophic low < 40 Mesotrophic medium Eutrophic high Hypertrophic very high > 70 1 TP = Total Phosphorus, TSI = Trophic State Index There are 3 main categories under the TSI; eutrophic, mesotrophic, and oligotrophic. Eutrophic lakes are highly productive and concentrated in nutrients; mesotrophic lakes experience temperate productivity and have moderate nutrient levels; oligotrophic lakes have little productivity and low nutrient levels. Additionally, the very high concentrations of phytoplankton in the metalimnion continue to be a concern. When we integrate the observations throughout the water column (Table 1.9) we see a reservoir that is only slightly eutrophic. However, looking at point specific data in the metalimnion, indicates that the reservoir is very eutrophic. Management recommendations are suggested to address this issue. It is also important to note that Secchi depth may not be an adequate predictor of the trophic status in Leesville Lake. Typically Secchi depth data are more informative of water quality on the trophic state index (TSI) than are total phosphorus (TP) and Chlorophyll a data. An approximation of the euphotic zone (depth of light available for phytoplankton growth is 1.7 X Secchi Depth). Interestingly, this provides a depth very close to 4 meters or essentially the depth of greatest chlorophyll a concentration. Apparent in the graphs for Chlorophyll a (Figure 1.4) the water is much clearer above this zone of intensive growth. Therefore the lake is somewhat more eutrophic than it appears visually and the mechanisms in place (mixing and movement of water) seem to keep it from further degradation. Because hypolimnion release from Smith 22
23 Mountain Lake is well documented as mesotrophic, it follows that Pigg River input along with Smith Mountain Lake operations are combining to create this condition. ph The ph (Figure 1.5) is reflective of phytoplankton growth and chemical activity. We see elevated ph during increased phytoplankton activity. Elevated ph occurs from phytoplankton productivity removing CO 2 from water. Carbon dioxide acts as a weak acid in water and its removal elevates ph ph data provided an interesting pattern, with July ph readings being very elevated in correspondence with high concentrations of Chlorophyll a. This is the exact pattern observed in These readings were elevated throughout the epilimnion, suggesting some periods of stratification. The ph readings approaching 8.5 are very concerning as this suggests hypereutrophy. The summer months consistently show elevated ph in the reservoir, associated with high concentrations of chlorophyll a. 23
24 Figure 1.5. Dam (Lacustrine) ph measures over study period (2015). 24
25 Table 1.6. Dam (Lacustrine) ph Measures Over Study Period (2015). Depth (m) May 25-Jun 28-Jul 28-Aug 30-Sep 30-Oct Apr ORP Oxidation Reduction Potential (ORP) presented in Figure 1.6 provides information related to chemical transformations in the reservoirs and can identify anaerobiosis in the water column. Patterns for this measure support observations from other measurements in the lake. More importantly than focusing on the individual numbers observed and possible interpretation throughout the water column, it is important to note that the reservoir remained in a very oxidized state (ORP measures in the high positive numbers) throughout the sampling season and at all depths. We remain uncertain about the driving mechanisms within the reservoir that impact this parameter; however it is a positive indication that all measurements fall within oxidized range. 25
26 Figure 1.6. Dam (Lacustrine) ORP (mv) measures over study period (2015). Table 1.7. Dam (Lacustrine) ORP Measures (mv) Over Study Period (2015). Depth (m) 29-Apr 18-May 25-Jun 28-Jul 28-Aug 30-Sep 30-Oct
27 Turbidity Turbidity (Figure 1.7) is influenced by the combination of both phytoplankton growth and sediment entering the reservoir. At the dam site, we expect the entry of sediment to be minimal and turbidity to reflect the phytoplankton content of the water. That phytoplankton is the primary driver of turbidity in this portion of the lake is borne out by the direct relationship between chlorophyll a and turbidity (see Figure 1.4 vs. Figure 1.7). While this relationship is very evident in the June and July sample dates it is not borne out as clearly for August. Turbidity increased with depth and was elevated at lower potions of the reservoir but not at the 4 meter depth typical for the phytoplankton bloom and shown in the June and July data. Figure 1.7. Dam (Lacustrine) Turbidity (NTU) measures over study period (2015). 27
28 Table 1.8. Dam (Lacustrine) Turbidity (NTU) Measures Over Study Period (2015). Depth: 29-Apr 18-May 25-Jun 28-Jul 28-Aug 30-Sep 30-Oct Other Measured Parameters 28
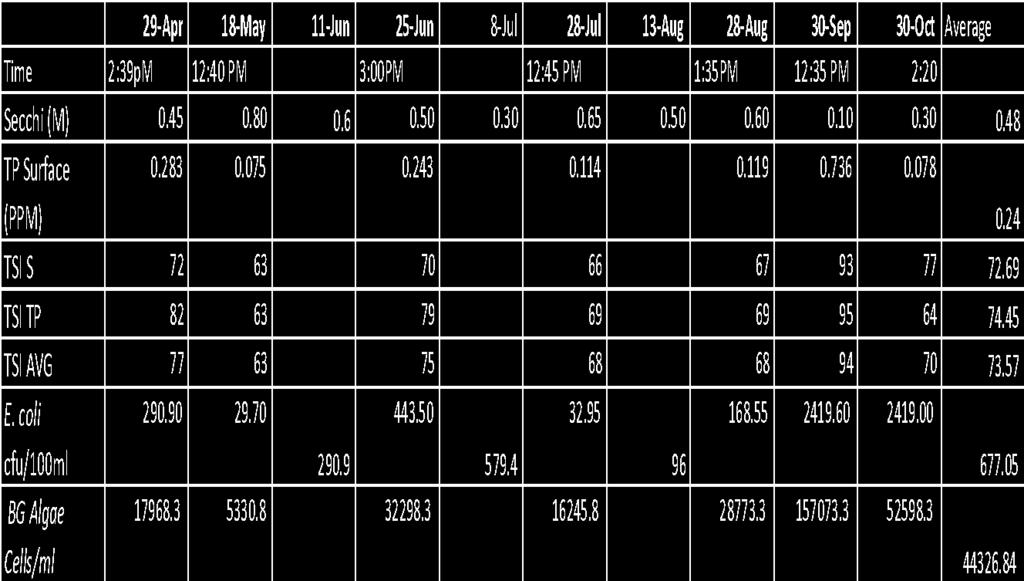
29 Looking at the other parameters (Table 1.9) we gain insights into the integration of biology and chemistry operating within the reservoir. The Trophic State Index (TSI) is a good indicator of lake condition. Leesville Lake is still in very good condition with average TSI values just slightly eutrophic at an annual average of 55 (50-70 range for eutrophic conditions). Unlike previous years, Chlorophyll a was elevated above TP and Secchi depth as an indicator of reservoir health. The very high blooms in July and August elevated indicators of eutrophication. Additionally, the late season rains elevated productivity when typically we see levels declining during these months. Additional collections by the volunteers between sampling events supported this observation. Some readings into the 60 s suggest Leesville Lake is increasing in eutrophication rather then declining. Zooplankton populations shifted in 2015 and this may explain some of the increased chlorophyll α productivity. Bosmina (a small bodied zooplankter) became more prevalent in our samples than Daphnia. Also, important to note is that Leptodora (a Daphnia predator) were found in more samples this season (than past seasons). We hypothesize that increased Leptodora predation of Daphnia populations accounts for increased prevalence of Bosmina and potentially causes spikes in phytoplankton growth along the metalimnion. If Daphnia populations have controlled a majority of the growth of phytoplankton and fisheries populations are differentially impacting the dynamics of the zooplankton populations then it would be expected that Chlorophyll a will increase. It is important to continue monitoring these populations to gain insight into regulation of their population dynamics and the potential impact on fish populations.. E. coli numbers at this locale are always very low relative to the remainder of the lake and interestedly remained low even during the heavy rains in the fall. However, the population of E. coli in April was surprisingly high, but well below the standard. April was a very wet month this year and thus greater numbers may be expected. The lower concentrations in September and October, although the rain was very intense, may reflect increased predation rates by rotifers (minute multicellular aquatic animals). Rotifers are know to prey heavily upon bacteria and large populations of rotifers (although not quantified) were observed in the zooplankton samples at these times. Table 1.9. Other parameters measured over study period (2015). Dates represent sampling of both the volunteers and Lynchburg College. First column represents each parameter measured along with units of measure. Zooplankton numbers are organisms per liter. 29
, comparisons are made back to Lacustrine and Riverine.")

30 1.3.3 Mile Marker 6 (Transition) Background In discussing water quality at the transition station (MM6), comparisons are made back to Lacustrine and Riverine. The purpose of this section is not to further discuss the patterns observed at the Dam or Toler Bridge but to discern any trends the data provide on a spatial scale moving up or down the lake. Conductivity 30
31 Conductivity (Figure 1.8) showed similar trends to the dam station. As in previous years conductivity was relatively stable and echoes the pattern from the dam, showing spring and August samples having the highest average conductivities. Figure 1.8. Mile Marker 6 (Transition) Conductivity (µs/cm) measures over study period (2015). 31
32 Table Mile Marker 6 (Transition) Conductivity (µs/cm) Measures Over Study Period (2015). Depth (m) 29-Apr 18-May 25-Jun 28-Jul 28-Aug 30-Sep 30-Oct Dissolved Oxygen Dissolved oxygen (Figure 1.9) content of water at the transition station did not show a strong stratified pattern compared to the dam. Some concerns include the low levels of oxygen throughout the water column in October. These low concentrations can be stressful to aquatic life. There is a very strong contrast between dissolved oxygen content of the water in April and 32
33 October. Remaining issues are similar to station at the dam although water is not as strongly stratified and may not have the same chemical transformations as water at the dam. Figure 1.9. Mile Marker 6 (Transition) Dissolved Oxygen (mg/l) measures over study period (2015). Table Mile Marker 6 (Transition) Dissolved Oxygen (mg/l) Measures Over Study Period (2015). Depth(m) 29-Apr 18-May 25-Jun 28-Jul 28-Aug 30-Sep 30-Oct
34 Temperature Greatest temperature stratification was observed in May (Figure 1.10). The pattern was similar to that observed at the Dam (with the exception of the degree or intensity of stratification), with little or no temperature gradient in the metalimnion during the warmest months. In this portion of the reservoir, the metalimnion appears to begin at 2 meters rather than at 4 meters, which is typical at the Dam site. Water at this site is shallower than at the dam and much more influenced by mixing due to SML dam operations. 34
35 Figure Mile Marker 6 (Transition) Temperature (Degrees C) measures over study period (2015). 35
36 Table Mile Marker 6 (Transition) Temperature (Degrees C) Measures Over Study Period (2015). Depth (m) 29-Apr 18-May 25-Jun 28-Jul 28-Aug 30-Sep 30-Oct Chlorophyll a Chlorophyll a (Figure 1.11) content of water differs from that at the dam site in the following ways. Only June exhibited the high metalimnion peak (seen in June, July and August at the dam) at this site. Other months also show peaks at the metalimnion, but these are of lower intensity. Furthermore, the metalimnion at this site began at a shallower depth (at 2 meters) than at the dam site (4 meters). A peak in chlorophyll a within the metalimnion was consistently observed throughout the reservoir; however, the intensity of the peaks differed by month. 36
37 Figure Mile Marker 6 (Transition) Chlorophyll a (ppb) measures over study period (2015). Table Mile Marker 6 (Transition) Chlorophyll a (ppb) Measures Over Study Period (2015). Depth (m) 29-Apr 18-May 25-Jun 28-Jul 28-Aug 30-Sep 30-Oct
38
39 ph The ph measures (Figure 1.12) were elevated in response to phytoplankton productivity during the warm months. Patterns were similar to those observed previously ( ) at this site and at the dam site. Figure Mile Marker 6 (Transition) ph measures over study period (2015). Table Mile Marker 6 (Transition) ph Measures Over Study Period (2015). Depth: 29-Apr 18-May 25-Jun 28-Jul 28-Aug 30-Sep 30-Oct
40 ORP ORP values (Figure 1.13) were similar to those analyzed at the dam site and showed oxidized conditions here and throughout the reservoir during all seasons at all depths. Figure Mile Marker 6 (Transition) ORP measures over study period (2015). Table Mile Marker 6 (Transition) ORP Measures Over Study Period (2015). Depth 29-Apr 18-May 25-Jun 28-Jul 28-Aug 30-Sep 30-Oct (m):
41 Turbidity Evaluation of water turbidity demonstrates that MM6 is a true transition site (Figure 1.14). In September turbidity was the highest observed all season and most of this was due to sediment turbidity. When sediment turbidity was low, phytoplankton turbidity generally increased (June). Thus, turbidity (similar to the Dam site) tracked the growth of phytoplankton throughout the reservoir during periods of low turbidity. More importantly, data suggests sediment influenced turbidity during large storm events. 41
42 Figure Mile Marker 6 (Transition) Turbidity (NTU) measures over study period (2015). 42
43 Table Mile Marker 6 (Transition) Turbidity (NTU) Measures Over Study Period (2015). Depth (m): 29-Apr 18-May 25-Jun 28-Jul 28-Aug 30-Sep 30-Oct Other Parameters Other parameters (Table 1.17) show similar general trends to those observed at the dam station (Table 1.9) with the following exceptions. Overall, TSI was greater in this section of the reservoir (compared with the dam and Toler Bridge), suggesting a slightly higher eutrophic condition. This is generally expected in reservoirs as the headwaters receive greater levels of nutrients and response of the aquatic life to this increase. The TP portion of TSI, generally in the 60s and with a peak of 74, suggests that this region exhibits the highest level of eutrophication within the reservoir (TSI-TP averaged 58.8, 60.8 and 62.1, for the dam, MM6 and Toler Bridge, respectively). Secchi Depth predicts a lower TSI than TP, while chlorophyll a falls into the middle as a predictor. This represents a slightly different trend than observed at the dam and suggests that sediment more strongly impacts this portion of the reservoir. The most significant source of sediment is the Pigg River. The greatest visualization of this problem was observed during is September and October (See Section 2.3). Furthermore, E. coli were evident at very high concentrations here and suggest caution when utilizing this portion of the reservoir for recreation when the water appears muddy. This sediment is quite visible when sampling and based upon testing results contains high levels of bacteria. Overall population concentrations of zooplankton are lower at MM6 than at the Dam. If the data were considered strictly in terms of productivity, we would expect zooplankton populations to be higher here than at the Dam. But, the increased phytoplankton productivity at this site may be a result of lower zooplankton grazing. Spatial patterns of fish planktivory are difficult to predict 43


44 and were not evaluated, but the upper reaches of the reservoir are likely to contain greater concentrations of planktivorous fish. All of these determinants may influence the patterns observed here. Table Mile Marker 6 (Transition) Other parameters measured over study period (2015). Dates represent sampling of both the volunteers and Lynchburg College. First column represents each parameter measured along with units of measure. Zooplankton numbers are organisms per liter. 44
45 45
46 1.3.4 Toler Bridge (Riverine) Background The station at Toler Bridge is influenced heavily by Riverine conditions and the tail waters of Smith Mountain Lake. We see a combination of the water qualities of Pigg River discharge with hypolimnion release from SML. The resulting water quality is completely driven by hydrological dynamics of the Dam (a mechanistic event) with river flow from the Pigg River (a stochastic event) thus creating a very dynamic system that is challenging to interpret. Conductivity Profiles of water conductivity at this station (Figure 1.15) differ from the patterns observed at other stations down lake. May and August samples are greater than October with higher measures of conductivity than down the reservoir. This suggests the influence of river and SML inputs. These results are consistent with all previous sampling years on the lake and remain difficult to predict. 46
47 Figure Toler Bridge (Riverine) Conductivity (µs/cm) measures over study period (2015). Table Toler Bridge (Riverine) Conductivity (µs/cm) Measures Over Study Period (2015). Depth: 29-Apr 18-May 25-Jun 28-Jul 28-Aug 30-Sep 30-Oct Dissolved Oxygen Dissolved oxygen measures (Figure 1.16) show that stratification is minimal at this station. 47
48 Figure Toler Bridge (Riverine) Dissolved Oxygen (mg/l) measures over study period (2015). Table Toler Bridge (Riverine) Dissolved Oxygen (mg/l) Measures Over Study Period (2015). Depth (m): 29-Apr 18-May 25-Jun 28-Jul 28-Aug 30-Sep 30-Oct Temperature Water temperature at this station is much cooler than the remainder of the reservoir. During the sampling in June, eplilimnion temperatures at the Leesville dam and MM6 were the highest recorded throughout the sampling year yet at this station water is much cooler during the similar dates. For the June sampling this is approximately an 8 degrees C difference between upper and lower portions of the reservoir. Because the hydrological dynamics are such an important driver in this reservoir it is unknown the extent this cooler water is being pushed and pulled back and forth. 48
49 Figure Toler Bridge (Riverine) Temperature (Degrees C) measures over study period (2015). Table Toler Bridge (Riverine) Temperature (Degrees C) Measures Over Study Period (2015). Depth 29-Apr 18-May 25-Jun 28-Jul 28-Aug 30-Sep 30-Oct (m):
50 Chlorophyll a Chlorophyll a concentrations at this station are influenced by SML operations as evidenced in Figure (1.18). The mixing of hypolimnetic water from SML with Pigg River flow creates some phytoplankton growth in this portion of the reservoir but not as a consistent pattern. Concentrations of Chlorophyll a are completely dependent on the flow patterns occurring and degree of sedimentation limiting light at this station. Chlorophyll a content during the summer months was greater than that during the late fall and early spring, but easily influenced by the other dynamics at this site. 50
51 Figure Toler Bridge (Riverine) Fluorescence measured Chlorophyll a (ppb) measures over study period (2015). Table Toler Bridge (Riverine) Fluorometer measured Chlorophyll a (ppb) Measures Over Study Period (2015). Depth 29-Apr 18-May 25-Jun 22-Jan 28-Aug 30-Sep 30-Oct (m):
52 52
53 ph Toler Bridge ph trends (Figure 1.19) do not reflect a strong influence of primary productivity in this portion of the lake. This is argulably more reflective of input from the Pigg River (Table 1.33) or hypolimnion of SML. Figure Toler Bridge (Riverine) ph measures over study period (2015). Table Toler Bridge (Riverine) ph Measures Over Study Period (2015). 29-Apr 18-May 25-Jun 28-Jul 28-Aug 30-Sep 30-Oct Depth(m):
54 54
55 ORP All ORP (Figure 1.20) are within the oxidized range throughout the water column. Figure ORP measures over study period (2015). Table Toler Bridge (Riverine) ORP Measures Over Study Period (2015). Depth 29-Apr 18-May 25-Jun 28-Jul 28-Aug 30-Sep 30-Oct (m):
56
57 Turbidity Interpretation of turbidity data at this site (Figure 1.21) remains consistent with that for other parameters evaluated. Pigg River dominates when the following conditions exist: 1. High River Flow 2. Predominate drawback conditions at SML dam 3. No measureable operation of SML dam Smith Mountain Lake Hypolimnion dominates these observations when the following conditions exist: 1. Low River Flow 2. Baseline SML Dam operations flow through of water from SML to Lessville Lake Dam Figure Toler Bridge (Riverine) Turbidity (NTU) measures over study period (2015). 57
58 58
59 Table Toler Bridge (Riverine) Turbidity (NTU) Measures Over Study Period (2015). 29-Apr 18-May 25-Jun 28-Jul 28-Aug 30-Sep 30-Oct Depth: Other Parameters Other parameters (Table 1.25) provide a very interesting picture of the reservoir. TSI measures are higher in the reservoir at this station mainly a result of sediment input lowering Secchi Depths and increasing ph. Light control of phytoplankton growth and periods of sediment mixing increased the overall TSI condition in this portion of the reservoir. Interpretation of zooplankton is difficult, as I believe water movement strongly impacts these populations. Daphnia is present and variable in population density. During storm events, E. coli is elevated but often much lower than observations in the Pigg River due to dilution from SML Dam release. 59


60 Table 1.25 Toler Bridge (Riverine) Other parameters measured over study period (2015). Dates represent sampling of both the volunteers and Lynchburg College. First column represents each parameter measured along with units of measure. Zooplankton numbers are organisms per liter. Additional Sampling Sites The two marina sites were evaluated for Secchi depth, E. coli and TP to determine possible contamination from septic systems and possible changes in clarity. Neither site demonstrated data to support the possibility of contamination and fit general trends throughout the lake. 60
61 61

.")

62 Table Pitt Stop Marina Other Parameters Measured Over Study Period (2015). Table Tri County Marina Other Parameters Measured Over Study Period (2015). 62
.")
63 Table Mile Marker 9 Other Parameters Measured Over Study Period (2015). Table Smith Mountain Lake Tail Waters Other Parameters measured over study period (2015). 63
64 Data for tail water sampled at the bridge just below the SML dam (Table 1.29) helps to quantify the quality of water that is released into Leesville Lake. Low oxygen contents of water released in the summer months along with influence from Pigg River during drawback are of a general concern because the hypolimnion of any reservoir can be devoid of oxygen. None of the data collected as part of this study suggest any concerns from low dissolved oxygen during 2015 We do see E. coli and it is believed the only source of this is from Pigg River during draw back operations. The concentrations are much higher in fall than spring. TP is highly variable again influenced by hydrology. Pigg River site again demonstrated high inputs of phosphorus, E. coli and poor water quality entering the lake (Table 3.31). Under low flow conditions water from dam operations may flow into this site giving diluted readings. It is clear from our study that the Pigg River is contaminated. The Pigg River has exceeded Virginia standards for E. coli 60% of the time based on our measurements (Table 1.30). Table Pigg River Other Parameters Measured Over Study Period (2015). 64
65 65
. Table 1.34. Pigg River Conductivity (us/cm) Measures Over Study Period (2015). Table 1.35.")
66 Table Pigg River Dissolved Oxygen (mg/l) Measures Over Study Period (2015). Table Pigg River Temperature (Degrees C) Measures Over Study Period (2015). Table Pigg River ph Measures Over Study Period (2015). Table Pigg River Conductivity (us/cm) Measures Over Study Period (2015). Table Pigg River Turbidity (NTU) Measures Over Study Period (2015). Table Pigg River ORP Measures Over Study Period (2015). 66
67 Section 2: Lake-wide Trending and Analysis The purpose of this section is to look at the functioning of the reservoir and establish trends. These trends are important to give a trajectory of lake health and allow us to manage the lake for optimum water quality. These trends are based on collected water quality parameters over the course of this study and compilation into trophic state indices (TSI) and other predictive indicators. The use of these indices allows ease of comparison among known parameters for lake and reservoir function and facilitates the translation of raw data into a useable management tool. As with any index, confounding parameters may, at times, reduce the value of a given index necessitating alternate interpretations and hypotheses. However, within the science of limnology (study of lakes), use of the indices is widespread and offers good explanations. There are 3 main categories under the TSI; eutrophic, mesotrophic, and oligotrophic. Eutrophic lakes are highly productive and concentrated in nutrients; mesotrophic lakes experience temperate productivity and have moderate nutrient levels; oligotrophic lakes have little productivity and low nutrient levels. When the TSI value is greater than 51, lakes are classified as eutrophic. Water has more clarity in oligotrophic lakes than in eutrophic lakes due to the lower nutrient levels. Conversely, excessive eutrophication is to be avoided. This is classified as TSI > Analysis of Trophic State In this analysis, trends of all the measurable trophic state indices (TSI) are looked at over a fiveyear period. The usefulness of this is many-fold. First, we can examine several parameters that are used to predict TSI or lake health. The use of multiple parameters always strengthens any scientific investigation. Second, each parameter measured provides a predictor based on differing influences within the reservoir. Secchi depth is influenced by both sediment input and phytoplankton growth, whereas total phosphorus (TP) simply reflects the concentrations of this limiting nutrient. Additionally, chlorophyll a concentrations reflect use of TP for phytoplankton growth within the limitations of shading (sediment inputs) and grazing by zooplankton (Daphnia concentrations). While each TSI predictor is based upon a differing parameter for prediction, often the predictions are within similar ranges. 67

68 Secchi Depth TSI Figure 2.1- Trophic State Index (TSI) based upon Secchi disk measurements in Leesville Lake from Y axis reflects the calculated TSI for each of the three primary sampling stations throughout the reservoir. The shaded box represents the mesotrophic range for TSI where below this range is oligotrophic conditions and above represents eutrophic conditions. Analysis: Secchi depth remains in the slightly eutrophic range for the portions of the lake from MM6 to Toler Bridge. MM6 and the Dam station demonstrate greater stability in TSI from year to year than does the Toler Bridge station, which suggests strongly that the lake is highly influenced by sediment inputs. 68

69 Total Phosphorus TSI Figure Same as Figure 2.1 but TSI is based on Total Phosphorus (TP). TSI based on TP remained at eutrophic levels in An upward trend observed in appears to have stabilized over the past two sampling seasons is the first sampling year where MM6 trends higher than the dam and is more aligned with Toler Bridge station. Data suggest the later samples (September and October) strongly influenced this trend with the very intense rains observed throughout those months. Chlorophyll a TSI 69
70 Figure Same as Figure 2.1 but TSI is based on Chlorophyll a. Chlorophyll a (Chl a) is the photosynthetic pigment found in all plant cells. Its concentration in water samples gives us a direct assessment of the concentration of phytoplankton in the reservoir. This parameter is directly related to utilization of TP by phytoplankton. However, the number of phytoplankton, and in turn the concentration of chlorophyll a, is reduced by zooplankton grazing on the phytoplankton, hydrological movements of water flushing phytoplankton out of the reservoir and into the river, and sediment inputs shading the amount of light available to phytoplankton; all of which lower the TSI. In 2015, Chlorophyll a TSI appeared to improve for main portions of the reservoir, while returning to 2012 levels at Toler Bridge. TSI Average 70
71 Figure Same as Figure 2.1 but TSI presented is the average of TSI for all parameters evaluated (Secchi depth, total phosphorous, chlorophyll a). Looking at average TSI demonstrates that Leesville Lake is a mildly eutrophic reservoir and relatively stable in this classification. Results are consistently within the range. In 2015, trends returned to the 2013 readings showing the variability and fluctuations possible within the reservoir. Overall, there appears to be little evidence for increasing eutrophication of the lake. Yearly fluctuations in TSI are impacted by environmental conditions and a complex of factors influencing water quality, including SML dam operations and stream inputs. 71
72 Daphnia Figure Average Daphnia concentrations in Leesville Lake from Numbers on y axis represent Daphnia / liter. Daphnia trends over the study period show relatively low concentrations for this species. Daphnia can exhibit strong grazing pressure on phytoplankton and this is often reflected in lower chlorophyll a concentration per TP concentration in a reservoir. For 2015, concentrations of Daphnia continued to decrease moving back to observations from Limnology of Leesville Lake Limnology refers to the biological and ecological functions of a lake. Here, I am analyzing a reservoir, so typical limnological paradigms may not hold true. Nevertheless, within this context we want to understand several key parameters, as they each hold the key to management of the reservoir. Theoretically, in lake limnology, spring time concentrations of total phosphorus (TP) set the concentrations of phytoplankton productivity (measured as Chlorophyll a). This is why we traditionally measure these parameters and weigh heavily upon them in our analysis. Further research suggests that this understanding does not include the impact of grazing on phytoplankton productivity and thus a measure of zooplankton populations in the lake can be 72
73 informative about the roles these organisms have in regulating water quality. Of all species of zooplankton found in the reservoir, only species of Daphnia have the population density and filtering capacity to graze phytoplankton faster than the growth rates of phytoplankton. Further, because this is a reservoir, non-algal turbidity such as suspended clay particles influence the light entering the reservoir and can inhibit the growth of phytoplankton. And even further in the instance of Leesville Lake (LL) Smith Mountain Lake (SML) Complex, the washing machine effect of water withdrawal and release brings polluted Pigg River water into SML mixing it with oligotrophic/mesotrophic water before re-release. Additionally, high release of SML pushes Pigg River water rapidly down the reservoir but the problematic impacts of this are mitigated by the hypolimnetic release from SML. The potential relationship between TP-Chl a (Figure 2.6) is used as a traditional predictor of water productivity throughout the world. Analysis using data did not yield a significant relationship in Leesville Lake suggesting that multiple factors in addition to TP control Chlorophyll a in the reservoir. The idea is that adding 2015 data could possibly strengthen this relationship. Figure Relationship between Chlorophyll a and TP for the last two years of study Y axis reflects all Chl a measures and x-axis reflects all TP measures during this period of time (all units ug/l). The strength of relationship is shown as R 2. Relationship is not significant. 73
74 With the addition of 2015 data (Figure 2.7) the relationship was not significant. While we expect a positive linear relationship between TP and Chlorophyll a, the addition of 2015 monitoring data did not suggest this relationship exists in Leesville Lake. Thus, other predictors will be examined for relationships during ensuing years of study. Figure Same relationship between Chlorophyll a and TP for the last three years of study Y axis reflects all Chl a measures and x-axis reflects all TP measures during this period of time (all units ug/l). The strength of relationship is shown as r 2 describing the strength of fit for the line. A r 2 = 1 is a perfect fit. Relationship is not significant. 2.3 Analysis of Relationship Between Pigg River and Smith Mountain Lake Dam Operation on Water Quality We continue to study the importance of the Pigg River inflow and SML dam operations on the water quality of Leesville Lake. During this season, several analyses were undertaken to further understand this relationship. I report here continued analysis from Pigg River and its entrance into Leesville Lake. Several large storm events occurred at the end of the sampling season (September and October). The area received 5 of rain from a storm system during September and I sampled the Lake on September 30. Below is a series of pictures taken to illustrate the dynamics of Pigg River Input and SML dam operations on the lake pertaining to this event. 74
. Water entering from SML Dam is of a very high quality (TP = 0.059 mg/l, E. coli =13.")
75 At the outset, very heavy sediment laden water enters the lake from the Pigg River (Figure 2.8 and 2.9). This water is of very worst quality (TP = mg/l, E. coli > 2419 cfu/100 ml, turbidities over 75 NTU and Secchi Depth of 0.1 meters). Water entering from SML Dam is of a very high quality (TP = mg/l, E. coli =13.4 cfu/100 ml, turbidity = 10 NTU and Secchi Depth of 2.7 meters). As this water continues to flow toward Toler Bridge (Figure 2.10), it begins to widen and mix with water flowing from SML Dam. Figure 2.8 a photo of water entering Leesville Lake from the mouth of the Pigg River on September 30, 2015 after heavy rains (up to 5 ) in the days preceding this photo. The brown Pigg River water is seen moving along the left portion of the photo with Dam release from SML entering on the right portion. The mouth of the Pigg River is straight ahead in the background of the photo 75
 demonstrating strong contrast of")
76 Figure 2.9 additional photo of water entering Leesville Lake from the mouth of the Pigg River on September 30, 2015 after heavy rains (up to 5 ) demonstrating strong contrast of Pigg and Leesville Lake. The brown Pigg River water is seen moving along the left portion of the photo with Dam release from SML entering on the right portion. 76

77 Figure 2.10 a photo of water entering Leesville Lake from the mouth of the Pigg River on September 30, 2015 flowing towards Toler Bridge. The contrast is very strong showing the sediment and debris contaminated Pigg River water maintaining a sharp demarcation as it flows. The water mixes as it approaches Toler Bridge. As the water reaches Toler Bridge it becomes completely mixed and shows a very distinct brown color that is a mix from the two very distinctive flows (Figure 2.10). This water combines in a unique way that gives insights into the dynamics and inpact metabolism of much of these two water sources on the lake. Water quality at the Toler Bridge station was (TP = surface and at 4 meters depth, E. coli = 1859 cfu/200 ml, turbidity = 115 NTU at surface and 75 NTU at 4 meters and Secchi Depth = 0.3 meters) Water in this portion of the lake exhibited very poor water quality from the Pigg River and from this storm event. 77

78 Figure 2.11 a photo of sediment laden water after it has mixed with Leesville Lake and SML Dam release. Toler Bridge is now in the background of the photo and water no longer has the orange brown but a duller brown after mixing in the lake at this portion of the reservoir. The poor water quality continues down the reservoir into the station at MM6 (Figure 2.11). It is difficult to speculate the extent of of water movement into this area but the effects are clear. Water quality at MM6 indicated (TP = mg/l surface and mg/l at 5 meters, E. coli = cfu/200ml, Turbidity = 26.1 NTU at surface and 62.9 NTU at 5 meters and Secchi Depth of 0.85 meters). This is a very significant impact on the lake and the extent of this pollution event illustrates the importance of work to control what the Pigg River carries into the lake for the overall continued health of Leesville Lake. 78

79 Figure 2.12 a photo of water near MM6 on Leesville Lake taken on September 30, The brown color of the water and debris in the background are very typical for the reservoir after heavy rain events. Additional testing over the course of this study year indicated the Chestnut Creek portion of Pigg River contained very high concentrations of Total Phosphorus (0.663 mg/l) when tested with areas closer to the lake (Route 40 crossing = mg/l and Toshes Road crossing = mg/l). Significant work to limit sedimentation in these rivers is imperative for improving and maintaining the water quality of Leesville Lake. Because water is not only released into Leesville Lake but also pumped back into SML, great uncertainty remains toward the implications of these results. Long periods of pumpback would extend the time this polluted water remains in the lake. Certainly, during heavy rains, water continues through the lake; but during normal operation, the quantity water and frequency of pumpback operations is dictated by largely unpredictable energy demands. Additionally 79
80 concerning is the quantity of sediment inflow that the Pigg River is responsible for each year. This sediment certainly settles out into the reservoir and ultimately increases silting of the lake. But much of the sediment is likely re-suspended during high flow events created by power generation. Remixing of water in the reservoir during intensive power generation creates issues that the limited data from this study cannot fully address. 2.4 Sources and Fate of Mn and Fe in a Flow Regulated River During portions of the past two sampling seasons this project teamed up with researchers from Virginia Tech to study the role of Leesville Lake stratification and mixing on movement of metals through the Roanoke River. Dr. Madeline Schreiber and her graduate student Mr. Zach Munger analyzed concentrations of Magnesium and Iron in the hypolimnion and transport patterns of these metals through the reservoir as it mixes and stratifies throughout the year. We were happy to team up with these researchers and look forward to working with other groups as we continue this study. Results are not available for public release until publication in a scientific journal. In general, the research found that stratified conditions in Leesville Lake created anoxic conditions in the hypolimnion strong enough to release metals into a soluble form. These metals were transferred from the lake through the tail race and into receiving streams in varying concentrations and distances depending upon reservoir and stream dynamics. Hydrology of Leesville Lake is again an important factor in the control of concentrations of these metals in the lake and receiving tail waters. In the 2016 water quality report, I will address these findings more extensively. Section 3: Management Implications Analysis of the current data is valuable for making management recommendations. Water quality in the Pigg River remains relatively poor and remains relatively poor when entering the reservoir. The September storm was responsible for the influx of large quantities of water that was of particularly poor quality (TP TSI = 95). Still, the TSI was not severely impacted downstream to the Leesville Lake dam. TSI at the dam declined slightly compared to pervious two seasons. Deteriorating water quality at Pigg River does not equate to poor water quality at the dam and this distribution of TSI is more representative of a typical reservoir. The lake remains in a mildly eutrophic state. 80

81 Figure Trophic State Index (TSI) based upon TP measurements in Leesville Lake from Y axis reflects average TSI for the entire sampling year for each of the three primary sampling stations. Based upon the water quality analysis in Figure (3.1) it is inferred that SML operations can potentially impact water quality throughout the reservoir in certain years (2013 and While other years (2012, 2011 and 2015) the data suggests the lake may operate as a typical reservoir with a strong TSI gradient from headwaters to the dam. And in other years (2010 and 2014) the gradient is very weak with Toler representative of either the dam or Pigg River. Thus, TSI changes in the depicted stations (variations among years) suggest a controlling hydrology other than natural process. In order to further process this information and develop hypotheses for testing it is suggested: Smith Mountain Lake (SML) operations should be coupled with water quality observations. The monthly tail water data collected for this report are helpful but only provide snap shot data of water quality exiting SML. Volumes of water pumped back and forth between Leesville Lake 81
82 and SML, flow rates of Pigg River and frequency and nature of dam operation are critical to proper understanding and management of water quality. Continued efforts to control Pigg River water quality are necessary. This remains a concern particularly during months of high energy generation at SML because pump back operations are more pronounced during these months. Leesville Lake is more vulnerable to water quality deterioration during high pumping into SML and high flow from Pigg River because of the movement toward the dam increases contact time in Leesville Lake and the mixing effect it creates. The argument that SML operations increase contact time of Pigg River discharge in Leesville Reservoir and increased mixing that is greater than natural processes is the only suggestion here. Continued analysis and monitoring of zooplankton and forage fish populations in the reservoir is desirable. Improved water quality based upon zooplankton grazing is inferred from the persistent abundance of Daphnia in the reservoir. It is desirable to increase the populations of this species of zooplankton not only to improve the forage base for planktivorous fish but also the water quality improvements this species brings. Game fish management to enhance and maintain this condition should be encouraged. Section 4: Hydrological Analysis 4.1 Water Sources including Summaries of Historical Data Pigg River Watershed - The annual reports of the Leesville Lake Association s Citizen Water Monitoring Project and the Virginia DEQ data are the two primary sources of historical data. DEQ compiled the data with the assistance of the Department of Conservation and Recreation (DCR) for its Virginia Water Quality Assessment Reports. Data were collected by the agencies quality control citizen monitoring data. DEQ used Water Quality Management Plans (WQMPs), required by section 303(e) of the Clean Water Act, to establish the link between the required water quality assessment and water quality based controls. 82
83 Map 4.1. Leesville Lake Water Quality Monitoring Stations with DEQ Identification (Lobue 2011) From June through November 2010, Lynchburg College and volunteers from LLA collected Leesville Lake water quality data. Lynchburg College sampled eight sites while LLA sampled seven. Data on water quality parameters included temperature, oxygen (dissolved oxygen and percent saturation dissolved oxygen percentage), conductivity, ph, oxidation-reduction potential, turbidity and more. Lynchburg College and LLA volunteers also monitored water quality in 2011, 2012, 2013 and Total Maximum Daily Load (TMDL): The Virginia Total Maximum Daily Load (TMDL) Program, which addresses waters with bacteria levels exceeding state standards, published a report in 2006 on waters around Leesville Lake. This report addressed bacteria levels flowing from the lake s two main tributaries; Pigg River and Old Woman s Creek (Lobue, 2010, p. 10). Story Creek (a tributary to Leesville Lake- Pigg River) and Upper Pigg River have been on Virginia s 303(d) list of impaired waters since Leesville Lake-Pigg River has been listed as impaired since Snow Creek (another tributary to Leesville Lake-Pigg River) and Old Woman's Creek have been listed as impaired since

84 The TMDL report identified three point sources discharging bacteria into the Pigg River basin, with one located in the Story Creek watershed area. There were no permitted dischargers in the Old Woman's Creek watershed. The TMDL reporting specifies nonpoint sources as the primary source for high bacteria levels; including agriculture, land-applied animal waste, and livestock manure are the main nonpoint sources. The report also specifies that cattle and wildlife directly dumping feces into streams cause a large bacteria load. Nonpoint sources from residential areas include straight pipes, failing septic systems, and pet waste (Virginia Tech, 2006). Map 4.2. Pigg River and Old Womans Creek Watersheds from TMDL studies (Virginia Tech, 2006). 84

85 Map 4.3 Franklin County Virginia showing Pigg River flowing under Smith Mountain Lake and into Leesville Lake along the border of Franklin and Pittsylvania counties. For reference, Snow Creek And Pigg River are shown in greater detail in Map 4.2. Pigg River and Old Woman's Creek TMDL Implementation Plan published 2009 identifies work necessary for E. coli reductions in the watershed to bring violation rates below 10% per year. Majority of the need is controlling pasture runoff with livestock fencing and point source reductions. Of concern for Leesville Lake are the elevated E. coli concentrations in Pigg River discharge. Additionally, cattle are consistently in the creek at the Leesville site. The Leesville community needs to support the work of both the soil and water conservation districts, VADEQ and VADCR as they work toward implementation of the TMDL effort. The community should also be active in controlling residential discharge directly in the lake and efforts to upgrade septic systems in the watershed. References Federal Energy Regulatory Commission. Office of Energy Projects. (2009, August). Final Environmental Impact Statement for Hydropower License, Smith Mountain Pumped Storage Project, FERC Project Number 2210 Virginia. Retrieved from 85
Leesville Lake 2014 Water Quality Monitoring
 Leesville Lake 2014 Water Quality Monitoring Prepared for: Leesville Lake Association Prepared by: Dr. Thomas Shahady Lynchburg College Funds Supplied by: American Electric Power & Leesville Lake Association
Leesville Lake Water Quality Monitoring Program Report
 Leesville Lake Water Quality Monitoring Program 2009 Report Prepared by Michael A. Lobue Leesville Lake Association Sponsored by Leesville Lake Association Funded by Virginia Department of Environmental
Water Quality Analysis of Lakewood Lakes
 Water Quality Analysis of Lakewood Lakes December 2016 Prepared by WEST Consultants, Inc. Bellevue, Washington With support from HDR, Inc., Olympia, Washington TABLE OF CONTENTS EXECUTIVE SUMMARY... V
Smithville Lake 2000 Water Quality Report
 Smithville Lake 2 Water Quality Report 1. General. a. Project location. The dam is located at river mile 12.9 on the Little Platte River, a tributary of the Platte River. The drainage area above the dam
2016 Summit Lake Water Quality Report Prepared by Thurston County Environmental Health Division
 ! 216 Summit Lake Water Quality Report Prepared by Thurston County Environmental Health Division PART OF TOTTEN INLET WATERSHED LENGTH OF LAKE: 2.2 miles SHORELINE LENGTH: 5.6 miles LAKE SIZE: 53 acres
Long-Term Volunteer Lake Monitoring in the Upper Woonasquatucket Watershed
 Long-Term Volunteer Lake Monitoring in the Upper Woonasquatucket Watershed Linda Green URI Watershed Watch 1-87-95, lgreen@uri.edu WATER QUALITY IS A REFLECTION OF THE ACTIVITIES IN THE LANDS AND WATERS
8 LITTLE CROSBY LAKE RESULTS
 8 LITTLE CROSBY LAKE RESULTS 8.1 LITTLE CROSBY LAKE BACKGROUND Figure 8-1: View of the south shoreline of. is 8 acres with an average depth of 7 ft and a maximum depth of 34 ft. Little Crosby Lake is a
What s Happening in Lake Whatcom?
 What s Happening in Lake Whatcom? Dr. Robin A. Matthews, Director Institute for Watershed Studies Huxley College of the Environment Western Washington University June 6, 2011 Site 2 Basin 2 Lake Whatcom
White Lake 2017 Water Quality Report
 Introduction Watersheds Canada believes that every person has the right to access clean and healthy lakes and rivers in Canada. We work to keep these precious places naturally clean and healthy for people
Lake Whatcom Water Quality - Presentation to Bellingham City Council
 Western Washington University Western CEDAR Lake Whatcom Other Reports Lake Whatcom 7-6-2015 Lake Whatcom Water Quality - Presentation to Bellingham City Council Robin A. Matthews Western Washington University,
Interpreting Lake Data
 Interpreting Lake Data Indiana Clean Lakes Program The Indiana Clean Lakes Program was created in 1989 as a program within the Indiana Department of Environmental Management's (IDEM) Office of Water Management.
Phosphorus Goal Setting Process Questions and Answers 2010
 Lake Winnipesaukee Watershed Management Plan Phase I: Meredith, Paugus, Saunders Bays 1. What is phosphorus? Phosphorus (P) is a naturally occurring element and a major nutrient required for biological
2012 Range Ponds Water Quality Report
 2012 Range Ponds Water Quality Report Prepared by Scott Williams, Aquatic Biologist Lake & Watershed Resource Management Associates The Range Ponds Environmental Association continued to monitor the health
Interpreting Lake Data
 Interpreting Lake Data Indiana Clean Lakes Program The Indiana Clean Lakes Program was created in 1989 as a program within the Indiana Department of Environmental Management's (IDEM) Office of Water Management.
Watershed and Water Quality Modeling to Support TMDL Determinations Lake Oologah
 Watershed and Water Quality Modeling to Support TMDL Determinations Lake Oologah 26 th Annual Conference Oklahoma Clean Lakes and Watersheds Association (OCLWA) April 5-6, 2017 Stillwater, Oklahoma Lake
Boy Lake CASS COUNTY
 Boy Lake 11-143- CASS COUNTY Summary Boy Lake is located near Remer, MN in Cass County. It covers 3,452 acres, which places it in the upper 1% of lakes in Minnesota in terms of size. Boy Lake has two main
2007 Inland and Purdy Reservoirs Report. Rivers and Reservoirs Monitoring Program
 2007 Inland and Purdy Reservoirs Report Rivers and Reservoirs Monitoring Program Field Operations Division Environmental Indicators Section Aquatic Assessment Unit June 2012 Rivers and Reservoirs Monitoring
Continuous records for the Chariton River indicate that 2004 was an average water year, with total flow approximately equal to the average annual
 2004 Rathbun Report Iowa State University Limnology Laboratory John A. Downing, Ph.D. George Antoniou, Assistant Scientist For Rathbun Land and Water Alliance August 31, 2005 A. Tributaries Personnel of
Impacts to Aquatic Habitats from Land-Use or Is It Polluted?
 Impacts to Aquatic Habitats from Land-Use or Is It Polluted? Water Pollution is: The addition of excessive carbon to a system The addition of large amounts of materials to water that causes adverse changes
Figure 1. Platte River Sub-Watersheds and Monitoring Locations.
 Figure 1. Platte River Sub-Watersheds and Monitoring Locations. 10 2 1 9 7 BL Pond 8 Hatchery 6 3 5 4 1 Platte River at Fewins Rd 6 B. Creek to Hatchery Spring 2 Platte River at Stone Bridge 7 Platte River
2017 Data Report for Perch Lake, Iron County
 Michigan Lakes Ours to Protect 217 Data Report for Perch Lake, Iron County Site ID: 3646 46.361392 N, 88.658338 W The CLMP is brought to you by: 1 About this report: This report is a summary of the data
2018 Data Report for. Crystal Lake, Montcalm County
 Michigan Lakes Ours to Protect 218 Data Report for Crystal Lake, Montcalm County Site ID: 5915 43.25584 N, 84.93362 W The CLMP is brought to you by: 1 About this report: This report is a summary of the
Portage Lake CASS COUNTY
 Portage Lake 11-0204-00 CASS COUNTY Summary Portage Lake is located near Bena, MN in Cass County. It covers 1,539 acres, which places it in the upper 10% of lakes in Minnesota in terms of size. Portage
Harry S Truman Reservoir 1999 Water Quality Report
 Harry S Truman Reservoir 999 Water Quality Report. General. a. Project location. Truman Dam is located approximately. miles northwest of Warsaw, Missouri, at river mile. on the Osage River, a tributary
2017 Data Report for Lake Independence, Marquette County
 Michigan Lakes Ours to Protect 217 Data Report for Lake Independence, Marquette County Site ID: 2149 46.88337 N, 87.711393 W The CLMP is brought to you by: 1 About this report: This report is a summary
2017 Data Report for Earl Lake, Livingston County
 Michigan Lakes Ours to Protect 217 Data Report for Earl Lake, Livingston County Site ID: 755 2.191 N, 3.95 W The CLMP is brought to you by: 1 About this report: This report is a summary of the data that
2017 Data Report for Painter Lake, Cass County
 Michigan Lakes Ours to Protect 217 Data Report for Painter Lake, Cass County Site ID: 1418 41.81667 N, 85.99194 W The CLMP is brought to you by: 1 About this report: This report is a summary of the data
CLMP+ Report on Grass Lake (Anoka County) Lake ID# CLMP+ Data Summary
 Lake ID# CLMP+ Data Summary") CLMP+ Report on Grass Lake (Anoka County) Lake ID# 02-0113-00 2012-2013 CLMP+ Data Summary October 2014 Authors Shannon Martin, MPCA Editing and graphic design Public Information Office Staff The (MPCA)
CLMP+ Report on Grass Lake (Anoka County) Lake ID# 02-0113-00 2012-2013 CLMP+ Data Summary October 2014 Authors Shannon Martin, MPCA Editing and graphic design Public Information Office Staff The (MPCA)
Portage Lake Hubbard County
 Prepared in cooperation with the Minnesota Department of Natural Resources Minnesota Lake ID: 9- Area: acres Watershed Area: 6,7 acres Ecoregion: Northern Lakes and Forests (NLF) Portage Lake Hubbard County
2017 Data Report for Loon Lake, Iosco County
 Michigan Lakes Ours to Protect 2017 Data Report for Loon Lake, Iosco County Site ID: 350078 The CLMP is brought to you by: 1 About this report: This report is a summary of the data that have been collected
2006 Aliceville Reservoir Report. Rivers and Reservoirs Monitoring Program
 2006 Aliceville Reservoir Report Rivers and Reservoirs Monitoring Program Field Operations Division Environmental Indicators Section Aquatic Assessment Unit May 2011 Rivers and Reservoirs Monitoring Program
Gull Lake CASS & CROW WING COUNTIES
 Gull Lake 11-0305-00 CASS & CROW WING COUNTIES Summary Gull Lake is located just northwest of Brainerd, Minnesota, on the border of Cass and Crow Wing Counties. It covers 9,947 acres, which places it in
2017 Data Report for Oxbow Lake, Oakland County
 Michigan Lakes Ours to Protect 2017 Data Report for Oxbow Lake, Oakland County Site ID: 630666 42.64167 N, 83.477226 W The CLMP is brought to you by: 1 About this report: This report is a summary of the
2017 Data Report for Big Maggie Lake, Iron County
 Michigan Lakes Ours to Protect 2017 Data Report for Big Maggie Lake, Iron County Site ID: 360173 46.01 N, 88.4626 W The CLMP is brought to you by: 1 About this report: This report is a summary of the data
2016 Data Report for Bruin Lake, Washtenaw County
 Michigan Lakes Ours to Protect 1 Data Report for Bruin Lake, Washtenaw County Site ID: 8575.189788 N, 8.39387 W The CLMP is brought to you by: 1 About this report: This report is a summary of the data
2017 Data Report for Arbutus Lake, Grand Traverse County
 Michigan Lakes Ours to Protect 217 Data Report for Arbutus Lake, Grand Traverse County Site ID: 2819 44.65917 N, 85.519726 W The CLMP is brought to you by: 1 About this report: This report is a summary
2017 Data Report for Spider Lake, Grand Traverse County
 Michigan Lakes Ours to Protect 217 Data Report for Spider Lake, Grand Traverse County Site ID: 28395 44.675987 N, 85.49947 W The CLMP is brought to you by: 1 About this report: This report is a summary
2016 Data Report for Iron Lake, Iron County
 Michigan Lakes Ours to Protect Data Report for Iron Lake, Iron County.1397 N,.533 W The CLMP is brought to you by: 1 About this report: This report is a summary of the data that have been collected through
2017 Data Report for Silver Lake, Van Buren County
 Michigan Lakes Ours to Protect 2017 Data Report for Silver Lake, Van Buren County Site ID: 800534 42.3891 N, 86.0599 W The CLMP is brought to you by: 1 About this report: This report is a summary of the
State of the Lake Environment Report December Big Gull Lake
 State of the Lake Environment Report December 2004 Big Gull Lake Big Gull Lake Big Gull Lake is located in the Townships of Central and North Frontenac. Big Gull Lake is at an elevation of 253 metres above
2017 Data Report for Shingle Lake, Clare County
 Michigan Lakes Ours to Protect 217 Data Report for Shingle Lake, Clare County Site ID: 1818 43.96359 N, 84.95282 W The CLMP is brought to you by: 1 About this report: This report is a summary of the data
2016 Data Report for Klinger Lake, St. Joseph County
 Michigan Lakes Ours to Protect 216 Data Report for Klinger Lake, St. Joseph County Site ID: 75136 41.82781 N, 85.543893 W The CLMP is brought to you by: 1 About this report: This report is a summary of
2017 Data Report for Hoags Lake, Mason County
 Michigan Lakes Ours to Protect 17 Data Report for Hoags Lake, Mason County.171 N,.19575 W The CLMP is brought to you by: 1 About this report: This report is a summary of the data that have been collected
2017 Data Report for Deer Lake, Alger County
 Michigan Lakes Ours to Protect 2017 Data Report for Deer Lake, Alger County Site ID: 020127 46.48016 N, 86.98277 W The CLMP is brought to you by: 1 About this report: This report is a summary of the data
2017 Data Report for Pleasant Lake, Wexford County
 Michigan Lakes Ours to Protect 2017 Data Report for Pleasant Lake, Wexford County Site ID: 830183 44.3 N, 85.4775 W The CLMP is brought to you by: 1 About this report: This report is a summary of the data
2016 Data Report for Barlow Lake, Barry County
 Michigan Lakes Ours to Protect 216 Data Report for Barlow Lake, Barry County Site ID: 8176 42.67559 N, 85.5242 W The CLMP is brought to you by: 1 About this report: This report is a summary of the data
2018 Data Report for Pickerel Lake, Kalkaska County
 Michigan Lakes Ours to Protect 2018 Data Report for Pickerel Lake, Kalkaska County Site ID: 400035 44.800559 N, 84.97667 W The CLMP is brought to you by: 1 About this report: This report is a summary of
Ploof s Creek South. Johannes Creek. Grand Lake, Ploof s Creek South, Johannes Creek. Introduction
 524 4th Street South Sauk Centre, MN 56378 320.352.2231 Grand Lake, Ploof s Creek South, Johannes Creek Introduction Since the 2012 monitoring season, the Grand Lake Improvement District (Grand LID) and
2017 Data Report for Portage Lake, Washtenaw County
 Michigan Lakes Ours to Protect 2017 Data Report for Portage Lake, Washtenaw County Site ID: 810248 42.420559 N, 83.921392 W The CLMP is brought to you by: 1 About this report: This report is a summary
2016 Data Report for Magician Lake, Cass County
 Michigan Lakes Ours to Protect 216 Data Report for Magician Lake, Cass County Site ID: 1465 42.649 N, 86.179 W The CLMP is brought to you by: 1 About this report: This report is a summary of the data that
CLMP+ Report on Fleming Lake (Aitkin County)
") CLMP+ Report on Fleming Lake (Aitkin County) Lake ID# -5-5-6 CLMP+ Data Summary July 7 Authors Shannon Martin Contributors/acknowledgements Terry Dahlberg Sandy Dahlberg Pam Anderson For questions regarding
CLMP+ Report on Fleming Lake (Aitkin County) Lake ID# -5-5-6 CLMP+ Data Summary July 7 Authors Shannon Martin Contributors/acknowledgements Terry Dahlberg Sandy Dahlberg Pam Anderson For questions regarding
2015 Range Ponds Water Quality Report
 2015 Range Ponds Water Quality Report Prepared by Scott Williams, Aquatic Biologist Lake & Watershed Resource Management Associates PO Box 65; Turner, ME 04282 207-576-7839 The Range Ponds Environmental
2017 Data Report for Fern Lake, Grand Traverse County
 Michigan Lakes Ours to Protect 2017 Data Report for Site ID: 280438 44.73475 N, 85.73409 W The CLMP is brought to you by: 1 About this report: This report is a summary of the data that have been collected
2017 Data Report for Rogers Pond, Mecosta County
 Michigan Lakes Ours to Protect 2017 Data Report for 43.6175478 N, 85.4718313 W The CLMP is brought to you by: 1 About this report: This report is a summary of the data that have been collected through
2016 WATER QUALITY MONITORING PROMPTON RESERVOIR PROMPTON, PENNSYLVANIA
 2016 WATER QUALITY MONITORING PROMPTON RESERVOIR PROMPTON, PENNSYLVANIA U.S. Army Corps of Engineers Philadelphia District Environmental Resources Branch December 2016 2016 Water Quality Monitoring Prompton
2017 Data Report for Ottawa Lake, Iron County
 Michigan Lakes Ours to Protect 2017 Data Report for Site ID: 360033 46.08484 N, 88.76419 W The CLMP is brought to you by: 1 About this report: This report is a summary of the data that have been collected
Lake Washington. Water Quality Assessment Report. Copyright 2012 PLM Lake & Land Management Corp.
 Lake Washington 2012 Water Quality Assessment Report Copyright 2012 PLM Lake & Land Management Corp. Water Quality Report On May 22nd, June 18th, July 30th, August 29th, and September 27 th, 2012, PLM
2017 Data Report for Lake Tahoe, Oceana County
 Michigan Lakes Ours to Protect 17 Data Report for Lake Tahoe, Oceana County Site ID: 33 3.1 N,.3 W The CLMP is brought to you by: 1 About this report: This report is a summary of the data that have been
Lake Elsinore and San Jacinto Watersheds Authority. Canyon Lake Phase 2 Water Quality Monitoring Plan
 Lake Elsinore and San Jacinto Watersheds Authority December 2010 Background Canyon Lake was formed in 1928 when the Canyon Lake (Railroad Canyon) Dam was constructed; the lake has three main sections the
2018 Data Report for. Lotus Lake, Oakland County
 Michigan Lakes Ours to Protect 218 Data Report for Lotus Lake, Oakland County 42.6941 N, 83.4244 W The CLMP is brought to you by: 1 About this report: This report is a summary of the data that have been
2017 Data Report for Little Paw Paw Lake, Berrien County
 Michigan Lakes Ours to Protect 2017 Data Report for Site ID: 110765 42.21899 N, 86.29072 W The CLMP is brought to you by: 1 About this report: This report is a summary of the data that have been collected
Learning from Lake of the Woods
 Learning from Lake of the Woods Internal loading and resuspension in shallow lakes Julie Blackburn, Minnesota Area Manager Julie.Blackburn@respec.com 651-305-5705 Lake of the Woods Aug. 2006 In 2008,
U.S. Geological Survey s Update on the Water Quality of Delavan Lake
 Memo to: Town of Delavan Lake Committee Date: February 2, 2013 From: Ryan Simons, Town of Delavan Lake Committee Chairman Subject: U.S. Geological Survey s Update on the Water Quality of Delavan Lake On
Watershed - Lake Model to Support TMDL Determinations for Lake Thunderbird
 Watershed - Lake Model to Support TMDL Determinations for Lake Thunderbird 18 th Annual EPA Region 6 Stormwater Conference Workshop 5: TMDLs and You October 3, 2016 Oklahoma City, OK Lake Thunderbird Watershed-Lake
Fish Conservation and Management
 Fish Conservation and Management CONS 486 Trophic pyramids, food webs, and trophic cascades oh my! Ross Chapter 2, Diana Chapter 1 Trophic interactions Limnological classification review Trophic pyramids
Project Water Quality
 Project Water Quality Yadkin-Pee Dee Hydroelectric Project No. 2206 Water Resources Working Group May 7, 2003 Surveys of Existing Resources! Reservoirs (monthly sampling) " Lake Tillery (2000, 2002) "
2016 WATER QUALITY MONITORING BELTZVILLE RESERVOIR LEHIGHTON, PENNSYLVANIA
 2016 WATER QUALITY MONITORING BELTZVILLE RESERVOIR LEHIGHTON, PENNSYLVANIA U.S. Army Corps of Engineers Philadelphia District Environmental Resources Branch December 2016 2016 Water Quality Monitoring
2015 Data Report for South Torch Lake, Antrim County
 Michigan Lakes Ours to Protect 2015 Data Report for South Torch Lake, Antrim County Site ID: 050240 44.91590 N, 85.30280 W The CLMP is brought to you by: About this report: This report is a summary of
Monitoring Update April 1, Northeast Aquatic Research George Knoecklein Hillary Kenyon Sabina Perkins
 Monitoring Update April 1, 215 Northeast Aquatic Research George Knoecklein Hillary Kenyon Sabina Perkins Lake Monitoring Approach for 214 Tonight's discussion will focus on in-lake aspects: Assessment
Appendix D Monitoring Program
 Appendix D Monitoring Program [This page left intentionally blank.] Shingle Creek and West Mississippi Watershed Management Commissions Third Generation Watershed Management Plan Monitoring Program Minnesota
2017 Water Quality Report and Historical Analysis. Long Lake Mickey Lake Ruth Lake. Monitoring Years
 2017 Water Quality Report and Historical Analysis Long Lake Mickey Lake Ruth Lake Monitoring Years 1993-2017 Submitted to: Long Lake Association October 2017 Prepared by: Great Lakes Environmental Center
Effect of Turbidity on Dissolved Oxygen in the Lake Macatawa. Watershed
 Effect of Turbidity on Dissolved Oxygen in the Lake Macatawa Watershed Hope College GES 401 Research Project Group Members: Peter Van Heest, Rachel Burkhart, Wyatt Curry Advisor: Dr. G. Peaslee Introduction
2017 Data Report for Duck Lake, Muskegon County
 Michigan Lakes Ours to Protect 217 Data Report for Duck Lake, Muskegon County Site ID: 61778 43.33785 N, 86.39258 W The CLMP is brought to you by: 1 About this report: This report is a summary of the data
Lake & Watershed Resource Management Associates P O Box 65; Turner, ME
 Lake & Watershed Resource Management Associates P O Box 65; Turner, ME 207-336-2980 LWRMA@megalink.net 2008 Baseline Water Quality Monitoring and Assessment of Pemaquid and Biscay Ponds At the request
Utah Lake Watch Report 2005
 Utah Lake Watch Report Prepared for Utah Division of Water Quality By Andy Dean, Utah State University Water Quality Extension www.extension.usu.edu/waterquality (45)797-58 December, For additional copies
Evaluation of Water Quality in. Sylvia Heaton Water Bureau, MDNRE
 Evaluation of Water Quality in Ford and Belleville Lakes Sylvia Heaton Water Bureau, MDNRE Objectives of 2010 TMDL Reevaluation Evaluate nutrient (total phosphorus) levels in Ford and Belleville Lakes
State of the Lake Environment Report December Mackavoy Lake
 State of the Lake Environment Report December 2003 Mackavoy Lake Mackavoy Lake Mackavoy Lake is located in the Township of Addington Highlands. Mackavoy Lake is a headwater lake of the Mississippi River
Primer on Pond & Lake Ecology & Watershed Dynamics
 Primer on Pond & Lake Ecology & Watershed Dynamics The water quality of a lake is often described as a reflection of its surrounding watershed. The term lake collectively refers to reservoirs (man-made
Water Quality Study In the Streams of Flint Creek and Flint River Watersheds For TMDL Development
 Water Quality Study In the Streams of Flint Creek and Flint River Watersheds For TMDL Development Idris Abdi Doctoral Dissertation Presentation Major Advisor: Dr. Teferi Tsegaye April 18, 2005 Alabama
SOURCE WATER MONITORING
 Monitoring and Protecting Our Water Sources SOURCE WATER MONITORING The Upper Cache la Poudre (UCLP) Watershed Collaborative Monitoring Program was established in 28 between the City of Fort Collins, the
Hadlock Pond, Washington Co., Lake Hadlock Association, Inc.
 Hadlock Pond, Washington Co., Lake Hadlock Association, Inc. Lake Characteristics Watershed Characteristics Surface Area (ac/ha) Max Depth (ft/m) Mean Depth (ft/m) Retention Time (years) Water Class Dam
Limnology 101. PA AWWA SE District & Eastern Section WWOAP Joint Technical Conference October 13, 2016
 Limnology 1 PA AWWA SE District & Eastern Section WWOAP Joint Technical Conference October, 2 Kristen Bowman Kavanagh, P.E. Flow Science Incorporated Limnology is the study of the biological, chemical,
2018 WATER QUALITY MONITORING BLUE MARSH RESERVOIR LEESPORT, PENNSYLVANIA
 2018 WATER QUALITY MONITORING BLUE MARSH RESERVOIR LEESPORT, PENNSYLVANIA U.S. Army Corps of Engineers Philadelphia District Environmental Resources Branch January 2019 2018 Water Quality Monitoring Blue
Utah Lake Watch Report 2006
 Porcupine Reservoir Photo taken by: Kaisi Baron 6 Utah Lake Watch Report 6 Utah State University Water Quality Extension Prepared by: Kaisi Baron Introduction Utah Lake Watch () is a statewide monitoring
Water Quality Monitoring Stations
 Water Quality Monitoring Stations Eastern Basin Race Narrows Western Basin Central Basin The CT Department of Environmental Protection (CT DEP) conducts a water quality CT DEP monitoring program for the
Pebble Lake - Water Quality Report
 Emerald Lakes Village, Oakland County January 8 th, 218 Pebble Lake - Water Quality Report The goal of this testing protocol was to monitor various water quality parameters of the lake, compare results
2017 Data Report for Klinger Lake, St. Joseph County
 Michigan Lakes Ours to Protect 217 Data Report for Klinger Lake, St. Joseph County Site ID: 75136 41.82781 N, 85.543893 W The CLMP is brought to you by: 1 About this report: This report is a summary of
Township Of Georgian Bay. Inland Water Quality Program Report. Paul M. Wiancko - B. Sc., M. Eng
 Township Of Georgian Bay Inland Water Quality Program Report 2015 By Paul M. Wiancko - B. Sc., M. Eng 1 Table of Contents Page Executive Summary 3 1.0 Introduction 5 2.0 Water Quality Analyses 6 2.1 Results
Results from the 2017 Water Quality Monitoring Program
 Results from the 217 Water Quality Monitoring Program As part of a larger project, this summer the BWC conducted water sampling throughout the Belleisle Bay to get a baseline of data and determine the
Okanagan Large Lakes Water Quality Monitoring Program Ellison Lake Wood Lake Kalamalka Lake Okanagan Lake Skaha Lake Osoyoos Lake
 Okanagan Large Lakes Water Quality Monitoring Program Ellison Lake Wood Lake Kalamalka Lake Okanagan Lake Skaha Lake Osoyoos Lake 1 Table of Contents Goals & Objectives... Trophic Status... Data Collection...
RECAPTURE LAKE. surface. The area has since been been uplifted and Recapture Reservoir is an impoundment of an
 Introduction surface. The area has since been been uplifted and Recapture Reservoir is an impoundment of an eroded, leaving a rugged mountain range. The high ephemeral stream on the south slope of the
2014 Data Report for Freska Lake, Kent County
 214 Data Report for Freska Lake, Kent County Michigan Lakes Ours to Protect The CLMP is brought to you by: About this report: This report is a summary of the data that have been collected through the Cooperative
Ecosystem Consulting Service, Inc. July 15, P a g e
 Prepared for: Normanoch Association Prepared by: Robert W. Kortmann, Ph.D. Ecosystem Consulting Service, Inc. July 17, 2014 Culver Lake Status 2014 (a brief mid-summer report) Cold water fish need water
Understanding the Basics of Limnology
 Understanding the Basics of Limnology Outline Watershed Processes Lake Formation Physical Features of Lakes Lake Processes Lake Chemistry Lake Biology Lake Management WATERSHED PROCESSES A Lake is a Reflection
2014 Data Report for Higgins Lake, Roscommon County North Basin
 214 Data Report for Higgins Lake, Roscommon County North Basin Michigan Lakes Ours to Protect The CLMP is brought to you by: About this report: This report is a summary of the data that have been collected
Results of Water Quality Measurements in Messer Pond Bob Crane, Messer Pond Protective Association (MPPA) Board
 Board") Results of Water Quality Measurements in Messer Pond Bob Crane, Messer Pond Protective Association (MPPA) Board The collection of water samples for the assessment of water quality in Messer Pond, New London,
Results of Water Quality Measurements in Messer Pond Bob Crane, Messer Pond Protective Association (MPPA) Board The collection of water samples for the assessment of water quality in Messer Pond, New London,
Watershed, Hydrodynamic, Water Quality and Sediment Flux Modeling to Support TMDL Determinations, Lake Thunderbird
 Watershed, Hydrodynamic, Water Quality and Sediment Flux Modeling to Support TMDL Determinations, Lake Thunderbird 24 th Annual Conference Oklahoma Clean Lakes and Watersheds Association (OCLWA) April
State of the Lake Environment Report December Clayton Lake
 State of the Lake Environment Report December 2002 Clayton Lake Clayton Lake Clayton Lake is situated in the Townships of Lanark Highlands and Mississippi Mills in Lanark County. Clayton Lake is at an
Torch Lake (South), Antrim County
, Antrim County") 2014 Data Report for Torch Lake (South), Antrim County Michigan Lakes Ours to Protect The CLMP is brought to you by: About this report: This report is a summary of the data that have been collected through
2014 Data Report for Torch Lake (South), Antrim County Michigan Lakes Ours to Protect The CLMP is brought to you by: About this report: This report is a summary of the data that have been collected through
Dog River Watershed Management Plan
 Dog River Watershed Management Plan Preliminary Water Quality Data Analysis Doug Robison, PWS ESA is where solutions and service meet. Water Quality - Regulatory Primer Designated Use Categories Swimming