Initial Vision Scenario for Public Discussion
|
|
|
- Nelson Floyd
- 6 years ago
- Views:
Transcription


1
2
3 Initial Vision Scenario for Public Discussion March 11, 2011 Joseph P. Bort MetroCenter 101 Eighth Street Oakland, CA tel fax Joseph P. Bort MetroCenter 101 Eighth Street Oakland, CA tel fax tty/tdd web
4

5 Executive Summary of the Initial Vision Scenario In 2008, Senate Bill 375 (Steinberg) was enacted. The state law requires that our Regional Transportation Plan contain a Sustainable Communities Strategy that integrates land-use planning and transportation planning. For the 25-year period covered by the Regional Transportation Plan, the Sustainable Communities Strategy must identify areas within the ninecounty Bay Area sufficient to house all of the region s population, including all economic segments of the population. It must also attempt to coordinate the resulting land-use pattern with the transportation network so as to reduce per capita greenhouse-gas emissions from personaluse vehicles (automobiles and light trucks). The Initial Vision Scenario for Plan Bay Area is a first-cut proposal that identifies the areas where the growth in the region s population might be housed. This proposal builds upon a rich legacy of integrative planning in the Bay Area. For over a decade, the region and its local governments have been working together to locate new housing in compact forms near jobs, close to services and amenities, and adjacent to transit so that the need to travel long distances by personal vehicle is reduced. Compact development within the existing urban footprint also takes development pressure off the region s open space and agricultural lands. We have referred to this type of efficient development as focused growth, and the regional program that supports it is called FOCUS. Planning for New Housing and Supporting Infrastructure The Initial Vision Scenario is constructed by looking first at the Bay Area s regional housing needs over the next 25 years. This analysis was performed using demographic projections of household growth. It is not a forecast of the region, and does not take into account many factors that constrain the region s supply of new housing units, such as limitations in supporting infrastructure, affordable housing subsidies, and market factors. The principal purpose of the Initial Vision Scenario is to articulate how the region could potentially grow over time in a sustainable manner, and to orient policy and program development to achieve the first phases of implementation. Under the assumptions of the Initial Vision Scenario, the Bay Area is anticipated to grow by over 2 million people, from about 7,350,000 today to about 9,430,000 by the year This population growth would require around 902,000 new housing units. The Initial Vision Scenario proposes where these new units might be accommodated. In a departure from previous regional growth scenarios, this Initial Vision Scenario is designed around places for growth identified by local jurisdictions. These places are defined by their character, scale, density, and the expected housing units to be built over the long term. Using place types, areas with similar characteristics and physical and social qualities, ABAG asked local governments to identify general development aspirations for areas within their jurisdictions. These places were mostly the Priority Development Areas (PDAs) already identified through the Initial Vision Scenario Page 1
6 FOCUS program. They also included additional Growth Opportunity Areas, some similar to PDAs and others with different sustainability criteria. Based on local visions, plans and growth estimates, regional agencies distributed housing growth across the region, focusing on PDAs and Growth Opportunity Areas. ABAG in some cases supplemented the local forecast with additional units based on the typical characteristics of the relevant locally-selected place type. ABAG also distributed additional units to take advantage of significant existing and planned transit investment, and it assigned some units to locally identified areas that present regionally significant development opportunities for greater density. The Initial Vision Scenario accommodates 97 percent of new households within the existing urban footprint. Only 3 percent of the forecasted new homes require greenfield development (building on previously undeveloped lands). Priority Development Areas and Growth Opportunity Areas contain about 70 percent of the total growth (743,000 households). Among counties, three take the lion s share of growth: Santa Clara, Alameda and Contra Costa absorb a little over two-thirds of the total. These same counties also are anticipated to take the majority of the region s job growth (64 percent). The region s three major cities do a lot of the heavy lifting. Thirty-two percent of the forecast and proposed housing growth occurs in San José, San Francisco and Oakland. Seventeen percent goes to medium-sized cities like Fremont, Santa Rosa, Berkeley, Hayward, Concord, and Santa Clara. The analysis embodied in the Initial Vision Scenario is founded on the location of housing. Employment forecasting and distribution in this Scenario is not directly related to land use policy. Employment location can have a powerful influence on travel demand, vehicle miles traveled, and vehicle greenhouse-gas emissions. In light of these factors and considering economic competitiveness, transit sustainability, and a balanced relationship between employment and housing, regional agencies will be embarking, with local partners, on further analysis regarding appropriate employment locations in relation to future housing growth and the transportation network. This will inform the development of the Detailed Scenarios. The Initial Vision Scenario reflects the transportation investments from MTC s current Regional Transportation Plan (known as the Transportation 2035 Plan) with an Express Lane backbone system. It also includes some proposed improvements to the region s transit network. These include increased frequencies on over 70 local bus and several express bus routes, improved rail headways on BART, ebart, Caltrain, Muni Metro, VTA light-rail, and Altamont Commuter Express, and more dedicated bus lanes in San Francisco and Santa Clara counties, all resulting in overall growth in transit capacity. However, the Bay Area s transit system is financially unsustainable with operators unable to afford to run the current service levels into the future, much less expanded headways contemplated under the Initial Vision Scenario. MTC s Transit Sustainability Project will propose a more sustainable transit system for inclusion in the Detailed Scenarios to be tested. Measuring Performance Against Targets The Initial Vision Scenario results in a 12 percent per capita greenhouse gas emissions reduction from personal-use vehicles in 2035, compared to a 2005 base year. This reduction falls short of Initial Vision Scenario Page 2
7 the region s state-mandated 15 percent per capita greenhouse gas emissions reduction target. It s clear that additional strategies will need to be employed if we want to attain the greenhouse gas targets, and other targets previously adopted by ABAG and MTC. MTC and ABAG have adopted a set of Plan Bay Area performance targets to describe in specific, measureable terms the region s commitment and progress toward to the three E principles of sustainability (Economy, Environment, and Equity). The Initial Vision Scenario meets several regional targets, including accommodating all the projected housing need by income level (in other words, no more in-commuting by workers who live in other regions); reducing the financial burden of housing and transportation on low-income households by providing more affordable housing; and housing the majority of new development within the existing urban core. Also, more residents are projected to ride transit, walk and bike more than existing residents because much of the new housing is located close to services, amenities and jobs, and adjacent to transit in complete communities. The Initial Vision Scenario brings more residents into the region, thus increasing the total amount of travel. Some residents will still drive for some trips. Even though vehicle miles traveled per capita in the Bay Area are projected to be lower in the Initial Vision Scenario than it is today, total miles driven within the region is projected to increase. With more Bay Area Residents and more miles driven within the region, we can also expect an increase in the total number of injuries and fatalities. Health impacts from exposure to particulate emissions from automobiles and trucks are likewise projected to worsen with more driving; however, state and federal efforts to clean up heavy duty truck engines will more than off-set the increases from automobiles, resulting in overall reductions sooty particulate pollution. Finally, it must be said that while bringing more people into the Bay Area will increase the amount of driving and collisions within the region, it is still a net win in the larger sense. The amount of overall driving and greenhouse gas emissions statewide is certainly less than if the new residents were commuting to Bay Area jobs from communities in neighboring regions that do not offer such amenities. Next Steps The Initial Vision Scenario is offered as basis for discussion with local governments, stakeholders, and the general public about how the Bay Area can accommodate all its population growth over the next quarter century. It is by no means a fait accompli. Over the next several months we will seek input through elected official briefings, local government staff discussions, and public workshops. The comments received will assist ABAG and MTC in developing a range of Detailed Scenarios and testing feasible land-use/transportation alternatives that achieve the greenhouse gas emission reduction targets. The purpose of the SCS is to forge consensus in the Bay Area on a preferred long-term regionwide growth pattern. Under SB 375, local governments are explicitly not required to update their general plans in accordance with the SCS. The SCS does not carry the same authority as Regional Housing Needs Allocation but it will inform the distribution of housing at the local level. The adopted SCS land development pattern will help guide regional policies and investments that are made pursuant to the Regional Transportation Plan. These regional policies Initial Vision Scenario Page 3
8 and investments are intended to create financial and other incentives to implement the adopted land pattern in the SCS. ABAG is currently working with its Housing Methodology Committee to develop a methodology for distributing regional eight-year housing targets to Bay Area local jurisdictions; the methodology will be adopted by ABAG later this year. The Initial Vision Scenario kicks off a two-year conversation among local jurisdictions and regional agencies on what ultimately will become the forecasted Sustainable Communities Strategy, as a part of Plan Bay Area. During that time, the regional agencies will engage local agencies and the public to help identify and assess several detailed Sustainable Communities Strategy scenarios that demonstrate ways that land-use strategies, transportation investments, pricing and other strategies could achieve our adopted goals and targets. The scenarios also will need to address how the Bay Area s land use plans can assist adaptation to climate change. The Sustainable Communities Strategy will need to coordinate regional agencies initiatives and requirements related to sea-level rise, air quality, and other climate change related issues. These Detailed Scenarios will lead to selection of a preferred scenario early next year that would include an integrated transportation investment and land-use plan; this plan would also undergo a detailed environmental impact review that local agencies could use to streamline environmental assessments of their own local development projects as provided for in SB 375. Finally, the ABAG and MTC boards would be asked to adopt the complete Plan Bay Area, including a Sustainable Communities Strategy, by April This report includes five major sections. First, the introduction describes the development rationale for the Initial Vision Scenario and regional and local challenges. Second, the regional growth section describes the overall population, household, and employment growth, household distribution under the Initial Vision Scenario, the performance of this scenario against targets, and the preliminary results of an equity analysis. Third, the regional growth analysis is developed into narratives for each county. Fourth, the key priorities and potential strategies section describes the preliminary tools to be considered for the implementation of the proposed development. Fifth, the next steps section describes the process of interaction with local jurisdictions and stakeholders and the analytical tasks for the Detailed Scenarios. The appendix includes a glossary that defines the terms used throughout the report and a table describing the place types. Initial Vision Scenario Page 4
9 TABLE OF CONTENTS 1. INTRODUCTION Coordination of regional strategies Initial Vision Scenario Rationale Meeting local and regional challenges Regional Growth by Historical Trends and Current Regional Plans Forecast Housing Distribution by Employment Distribution by Evaluation of Initial Vision Scenario Performance Targets Equity Assessment COUNTY VISION SCENARIOS Key Priorities and Potential Strategies Key Priorities Potential Strategies SCS NEXT STEPS Initial Vision Scenario Outreach Process Development of Detailed Scenarios APPENDIX Glossary of Terms MTC Station Area Planning Manual Place Type Identification Matrix LIST OF TABLES, MAPS, AND FIGURES Tables Table 2.1: Initial Vision Scenario Regional Growth Table 2.2: Initial Vision Scenario Total Households and Household Growth by County...29 Table 2.3: Initial Vision Scenario Total Jobs and Job Growth by County...35 Table 2.4: Initial Vision Scenario Household and Job Totals and Growth by Jurisdiction...36 Table 2.5: Performance Target Results for the Initial Vision Scenario...41 Table 2.6: Results of Equity Analysis of Performance Targets for the Initial Vision Scenario.42 Table 3.1: Initial Vision Scenario Total Households and Household Growth by County and Priority Development Areas and Growth Opportunity Areas...44 Initial Vision Scenario Page 5
10 Table 3.2: Alameda County Initial Vision Scenario Household Growth for Priority Development Areas and Growth Opportunity Areas by Jurisdiction...48 Table 3.3: Contra Costa County Initial Vision Scenario Household Growth for Priority Development Areas and Growth Opportunity Areas by Jurisdiction...53 Table 3.4: Marin County Initial Vision Scenario Household Growth for Priority Development Areas and Growth Opportunity Areas by Jurisdiction...57 Table 3.5: Napa County Initial Vision Scenario Household Growth for Priority Development Areas by Jurisdiction...60 Table 3.6: San Francisco City and County Initial Vision Scenario Household Growth for Priority Development Areas and Growth Opportunity Areas...63 Table 3.7: San Mateo County Initial Vision Scenario Household Growth for Priority Development Areas and Growth Opportunity Areas by Jurisdiction...67 Table 3.8: Santa Clara County Initial Vision Scenario Household Growth for Priority Development Areas and Growth Opportunity Areas by Jurisdiction...71 Table 3.9: Solano County Initial Vision Scenario Household Growth for Priority Development Areas and Growth Opportunity Areas by Jurisdiction...76 Table 3.10: Sonoma County Initial Vision Scenario Household Growth for Priority Development Areas and Growth Opportunity Areas by Jurisdiction...80 Maps Map 2.1: Map 3.1: Map 3.2: Map 3.3: Map 3.4: Map 3.5: Map 3.6: Map 3.7: Map 3.8: Place types for Priority Development Areas and Growth Opportunity Areas in the San Francisco Bay Area...30 Alameda County PlaceTypes for Priority Development Areas and Growth Opportunity Areas...47 Contra Costa County Place Types for Priority Development Areas and Growth Opportunity Areas...52 Marin County Place Types for Priority Development Areas and Growth Opportunity Areas...56 Napa County Priority Development Area Place Type...59 San Francisco City and County Place Types for Priority Development Areas...62 San Mateo County Place Types for Priority Development Areas and Growth Opportunity Areas...66 Santa Clara County Place Types for Priority Development Areas and Growth Opportunity Areas...70 Solano County Place Types for Priority Development Areas and Growth Opportunity Areas...75 Initial Vision Scenario Page 6
11 Map 3.9: Sonoma County Place Types for Priority Development Areas and Growth Opportunity Areas...79 Figures Figure 2.1: Regional Household Growth Figure 2.2: Regional Job Growth Figure 5.1: SCS Planning Process and Timeline...86 Initial Vision Scenario Page 7
12 1. INTRODUCTION Senate Bill 375, passed in 2008, calls upon the San Francisco Bay Area and other regions throughout California to incorporate a Sustainable Communities Strategy (SCS) that identifies a land use pattern into the federally-mandated 25-year Regional Transportation Plan (RTP). The 2013 RTP will be the Bay Area s first plan that is subject to SB 375 and is referred to by ABAG and MTC as Plan Bay Area. The SCS seeks to reduce greenhouse gas emissions and provide housing for the region s future population by integrating the forecasted development pattern with the regional transportation network and policies. The greenhouse gas reduction target for the Bay Area is a 7 percent per capita reduction by 2020 and a 15 percent per capita reduction by SB 375 also synchronizes the legal requirement known as the Regional Housing Needs Assessment (RHNA) process with the RTP process and streamlines California Environmental Quality Act (CEQA) for housing and mixed-use projects that meet specified criteria outlined in the bill. The Initial Vision Scenario identifies a land use pattern to meet the Bay Area s housing targets established under SB 375. This Scenario provides a rationale for a sustainable development vision based on the character, scale, and quality of diverse places in the region, and is measured for environmental, social, and economic performance. It builds upon the work done by local communities to identify Priority Development Areas (PDAs) and Priority Conservation Areas (PCAs) through the FOCUS program. The proposed distribution of housing focuses on areas identified by local jurisdictions that are pedestrian and transit accessible. This focused growth reduces development pressure from the urban periphery and ensures the retention of open space and agricultural land in the Bay Area. The Initial Vision Scenario assumes a strong economy and a substantial public investment in affordable housing, public infrastructure, and high quality transit. The operating assumption of the Initial Vision Scenario is that all issues that prevent growth from occurring in the urbanized core are substantially resolved, including adequate public infrastructure, appropriate management of hazards and risks, sufficient transit headways, redevelopment and affordable housing funding, quality schools, fiscal solvency, and the removal of market barriers to private development. With these assumptions, the Initial Vision Scenario proposes to meet the housing needs of the Bay Area in locations that are appropriate both for local governments and for sustainable development. The release of this Initial Vision Scenario report represents the first step in the Sustainable Communities Strategy process, as regional agencies seek specific input from local elected officials and other stakeholders about the future growth pattern in the Bay Area. Input on the Initial Vision Scenario will be gathered through multiple local and regional forums through May This input will inform the range of development options to be considered in the Detailed Scenarios. Further public engagement will be sought on the results of this analysis which will lead to the release of a Preferred Scenario for the SCS by January The SCS Preferred Scenario will be adopted as part of the Regional Transportation Plan by Initial Vision Scenario Page 8
13 The purpose of the SCS is to forge consensus in the Bay Area regarding the long-term growth pattern and identify the issues associated with its implementation. The Sustainable Communities Strategy, when eventually adopted by the regional agencies, will not impose a binding land use authority on local governments. Under SB 375, local governments are explicitly not required to update their general plans in accordance with the SCS nor use the SCS as part of their cumulative CEQA analysis of development projects. The SCS does not carry the same authority as RHNA, but it will inform the distribution of housing at the local level. The adopted SCS land development pattern will help guide regional policies and investments that are made pursuant to the Regional Transportation Plan. These regional policies and investments are intended to create financial and other incentives to implement the adopted land pattern in the SCS. Five major sections organize the content of this report. This introduction section includes the rationale for the development of the scenario and the regional challenges and needs associated with it. The second section focuses on regional growth. It describes the overall population, household, and employment growth; the distribution of housing and employment at the county, city, and place level; and the evaluation of this scenario against adopted targets and results of the preliminary equity analysis. The third section takes the regional growth analysis as the basis for a narrative of the Initial Vision Scenario in each county. The fourth section describes the key priorities and potential strategies to be considered for the implementation of the proposed development. The fifth section outlines the next steps in the process of interaction with local jurisdictions and stakeholders and the analytical tasks for the development of the Detailed Scenarios. The appendix includes a glossary that defines the terms used throughout the report and the MTC Station Area Planning Manual Place Type Development Guidelines Table. 1.1 Coordination of regional strategies Since, by federal law the RTP must be internally consistent, the over $200 billion of transportation investment typically included in the RTP must align with and support the adopted SCS land use pattern. The transportation investment strategy included in this Initial Vision Scenario relies primarily on the Transportation 2035 Plan with some improvements in the level of service provided by transit. Regional agencies will work closely with the Congestion Management Agencies (CMAs), transit agencies, and local jurisdictions, along with stakeholders and members of the public to define transportation projects that may better serve the development pattern of the Initial Vision Scenario. The project performance assessment, a qualitative and quantitative assessment of projects proposed for inclusion in the RTP, will help determine which transportation projects are included in the Detailed Scenarios. The Regional Housing Needs Assessment (RHNA) prepared by ABAG must be consistent with the SCS. Both the SCS and RHNA require consideration of housing needs by income group. RHNA, however, must meet specific legal equity and housing type requirements including a shift towards a more equitable distribution of low-income housing and a mix of housing types, tenure, and affordability in all cities and counties. This Initial Vision Scenario provides a point of reference to the housing needs for the RHNA. Additional demographic and housing analysis will inform the specific forecast for RHNA and the Detailed Scenarios. This Initial Vision Scenario assumes the availability of tools, resources, and mitigation strategies that address the impacts of the CEQA thresholds and guidelines recently approved by the Bay Initial Vision Scenario Page 9
14 Area Air Quality Management District (BAAQMD) and the policy recommendations encompassed in the Bay Plan prepared by the Bay Conservation and Development Commission (BCDC). In the Initial Vision Scenario, neither of these agencies guidelines were used to constrain growth in the urbanized core of the Bay Area. 1.2 Initial Vision Scenario Rationale The Initial Vision Scenario identifies a land use pattern to meet the housing target adopted by ABAG and MTC. To support the projected level of future growth, this scenario assumes strong regional economic performance and sufficient funding for affordable housing, transportation and the planning and infrastructure dollars needed to support transit-oriented and infill development in the Bay Area. In a departure from previous regional growth scenarios, this Initial Vision Scenario is designed around places for growth identified by local jurisdictions. These places are organized into place types that are defined by their character, scale, density, and the housing units expected over the long term. The Initial Vision Scenario supports cities that are choosing to advance local goals and to improve quality of life by providing affordable housing and transportation choices that help to reduce automobile dependency. It connects local neighborhood priorities in creating high quality places to live and work with regional objectives and resources. Initial Vision Scenario Objectives In addition to the regionally adopted performance targets listed on page 32, the following objectives guide the Initial Vision Scenario. 1. Strengthening the character of places through sustainable development The Bay Area encompasses a wide range of places that vary in character, scale, activities, population, and access. The Initial Vision Scenario pursues a sustainable development pattern that enhances the qualities of each place and provides diverse housing types and transportation choices as defined by each community. This scenario proposes to strengthen the physical, social, and economic qualities of various neighborhoods and centers according to each area s selected place type. 2. Accommodating affordable housing and employment centers within the urban footprint The Initial Vision Scenario proposes growth within the region s urban footprint around the regional transportation network. This approach builds upon previous and current efforts developed by local jurisdictions and regional agencies to enhance the qualities of selected urban centers, towns, neighborhoods, or transit corridors. This approach recognizes the need to produce affordable housing, maximize the use of existing infrastructure, and reduce the use of the automobile. In contrast to previous trends, greenfield development is minimized to retain the open space and agricultural land of the region. 3. Location of future housing and jobs next to transit, amenities, and services The development of complete communities in the Initial Vision Scenario assumes access to services and amenities at the appropriate urban scale. Schools, shops, parks, Initial Vision Scenario Page 10
15 health services, and restaurants close to residents and workers increase walking, biking, and transit while reducing driving. This location pattern strengthens the identity and diversity of places and reduces greenhouse gas emissions. 4. Strengthening regional transit corridors to provide access to jobs and services The Initial Vision Scenario emphasizes growth along transit corridors to increase transportation options, improve mobility, and expand access to jobs and services. The distribution of growth recognizes the complementary functions of different nodes along the corridor, and the importance of cultivating and connecting diverse place types that provide a unique urban quality with a particular mix of shops, services, or amenities. 5. Preservation of land for open space and agriculture The Bay Area s greenbelt of agricultural, natural resource, and open space lands is a treasured asset that contributes to the region s quality of life, and supports economic development. The Initial Vision Scenario supports the retention of these lands by directing nearly all non-agricultural development within the urban footprint and by supporting the continuation of agricultural activities in rural communities. The Initial Vision Scenario builds upon existing efforts in many Bay Area jurisdictions to encourage more focused and compact growth that reflects the unique characteristics of the region s communities and neighborhoods. Priority Development Areas (PDAs) are urban neighborhoods or centers that can accommodate future housing close to transit. They are designated by local jurisdictions and adopted by ABAG. PDAs cover a wide range of areas from downtown Cloverdale, to the El Camino Real transit corridor on the Peninsula, to downtown San Jose. Growth Opportunity Areas are places that might be PDAs in the future or have different criteria to pursue sustainability focused on employment or town center characteristics. They have been proposed by local jurisdictions for inclusion in the Initial Vision Scenario. Concentration of growth in these areas also supports retention of Priority Conservation Areas (PCAs), locally identified regionally significant near term conservation priorities adopted by ABAG in Input from Local Jurisdictions Many Bay Area jurisdictions have worked in partnership with MTC and ABAG to plan and advance the implementation of Priority Development Areas as complete communities in recent years. The planning processes for these key infill, transit-oriented neighborhoods are often painstaking and involve a complex range of issues. The Initial Vision Scenario is structured to serve as a tool to advance dialogue around a more sustainable regional growth pattern that recognizes local aspirations and the unique characteristics of our region s neighborhoods and communities. In November 2010, MTC and ABAG requested that local jurisdictions provide input regarding the capacity for sustainable growth in PDAs or new Growth Opportunity Areas. This information supplemented the extensive PDA Assessment undertaken by ABAG and MTC in the prior year. Most local jurisdictions provided input on place types and levels of growth. Regional agencies have used local estimates of growth and adopted local plans to meet the housing target to the extent possible. However, for discussion purposes, some Priority Development Areas or Initial Vision Scenario Page 11
16 new Growth Opportunity Areas have been allocated some additional housing units in this scenario. Transportation Network Assumptions In defining the transportation component of the Initial Vision Scenario, MTC first examined the change in the population forecasts between the Initial Vision Scenario and the Current Regional Plans Forecast. In areas of growth, transit frequencies were increased. MTC also solicited input from the Bay Area Congestion Management Agencies (CMAs), receiving detailed information regarding transit improvements from San Francisco, San Mateo, Santa Clara, and Alameda counties. Projects received from the CMAs that were consistent with the Initial Vision Scenario s land use patterns were included. Relative to the Current Regional Plans Forecast transportation network, the Initial Vision Scenario network includes: Improved headways on over 70 local bus routes and several express bus routes; Improved headways on BART, ebart, Caltrain, Muni Metro, VTA light rail, and Altamont Commuter Express; and, Sixty miles of dedicated bus lanes in San Francisco and Santa Clara counties. Housing Distribution To determine how much growth an area could accommodate, regional staff evaluated a Priority Development Area s or Growth Opportunity Area s location in the region, access to employment, proximity to transit or major transit corridors, and overall size and development intensity. This evaluation was framed by the characteristics of the place type selected by the local jurisdiction. A place type groups neighborhoods or centers with similar sustainability characteristics and physical and social qualities, such as the scale of housing and commercial buildings, frequency and type of transit, quality of the streets, concentration of jobs, and range of services. Transit investments and the regional role of a given area were also considered in the distribution of housing. The following criteria were used to distribute housing growth throughout the Bay Area: 1. Locally identified growth in existing Priority Development Area or new Growth Opportunity Area 2. Additional housing units based upon the identified characteristics of the locally selected place type for an area 3. Greater housing density proximate to significant transit investment (Existing Transit and Resolution 3434) 4. Major mixed-use corridors with high potential for transit-served infill development. Initial Vision Scenario Page 12
. For the Initial Vision Scenario, place types are a tool for local-regional exchange to identify places and policies for sustainable development.")
17 Place Type Framework Local jurisdictions used the place types developed by the Center for Transit Oriented Development for Priority Development Area planning purposes1 (Station Area Planning Manual 2007). For the Initial Vision Scenario, place types are a tool for local-regional exchange to identify places and policies for sustainable development. Place types help local governments describe appropriate levels of growth in the Sustainable Communities Strategy. The place types are based upon national standards for transit-oriented neighborhoods and corridors. They offer local governments a way to identify their vision for the future of an area, based on building characteristics related to the scale of the place, type of transit, the mix of land uses, the intensity of development, retail characteristics, amenities, design guidelines, and major planning and development challenges. These place type characteristics outline a proposed mix of housing types, targets for total housing units and jobs, net densities for new housing, and minimum Floor Area Ratios (FARs) for new employment development. (See Appendix 6.2) While the place types emphasize the specific context of a particular place, they also take into account the network of transit-served areas in the region. In this way, the place types provide a common language for a regional policy framework that relates to planning and implementation occurring at the local level. Local jurisdictions have identified place types for their Priority Development Areas and for new Growth Opportunity Areas. Most local jurisdictions selected place types from the Station Area Planning Manual. A few local jurisdictions proposed alternative place types to better describe their area s vision. The place types included in the Initial Vision Scenario are summarized below. Place Types from Station Area Planning Manual Regional Center 1 The entire manual can be downloaded from the MTC website at Initial Vision Scenario Page 13


18 Regional centers are primary centers of economic and cultural activity for the region. They have a dense mix of employment, housing, retail and entertainment. They are served by a rich mix of transit modes and types and local-serving bus networks. Examples of regional centers include the downtown areas in San Jose, San Francisco, and Oakland. City Center City centers contain a mix of residential, employment, retail, and entertainment uses. They are magnets for surrounding areas while also serving as commuter hubs to the region. They retain their historic character in the structure of their street networks and buildings. They are served by multiple transit options including high volume bus or Bus Rapid Transit, as well as local bus routes. Examples of city centers include the downtowns of Fremont, Berkeley, Redwood City, and Santa Rosa. Suburban Center Suburban centers are similar to city centers but currently have lower densities, less transit, and more parking. These places also include areas that are adding new housing and services to predominantly single-use employment areas. Suburban centers envision a mix of residential, Initial Vision Scenario Page 14


19 employment, retail, and entertainment uses. They are both origin and destination settings for commuters, with a mix of transit service connected to the regional network. Examples of suburban centers include West Downtown Walnut Creek, Downtown Dublin, and Hacienda in Pleasanton. Transit Town Center Transit town centers are local-serving centers of economic and community activity. A variety of transit options serve transit town centers, with a mix of origin and destination trips, focusing primarily on commuter service to major employment centers. Examples of transit town centers are the Hercules Waterfront District, the Suisun City Downtown and Waterfront, and Downtown South San Francisco. Urban Neighborhood Urban neighborhoods are primarily residential areas that are well-connected to regional or city centers. They have moderate-to-high densities, and usually feature local-serving retail mixed in Initial Vision Scenario Page 15


20 with housing. Commercial and other employment is often limited to small businesses or historically industrial uses. Examples of urban neighborhoods include the Fruitvale District in Oakland, the Woodland/Willow Neighborhood in East Palo Alto, and Mission Bay in San Francisco. Transit Neighborhood Transit neighborhoods are primarily residential areas that are served by rail service or multiple bus lines that connect at one location. They have low-to-moderate densities, and the transit stations are often a minor focus of activity. They usually do not have enough residential density to support large retail, but have nodes of retail activity. Examples of transit neighborhoods include Whisman Station in Mountain View, The Cannery in Hayward, Central Hercules, and Berryessa Station in San Jose. Mixed-Use Corridor Initial Vision Scenario Page 16


21 Streetcars, light rail, bus rapid transit, or high-volume bus corridors can serve Mixed-Use Corridors. These encompass a mix of a moderate-density buildings housing services, retail, employment, and civic or cultural uses. Existing mixed-use corridors include Telegraph Avenue- International Boulevard-Mission Boulevard in Alameda County, San Pablo Avenue in the East Bay, Mission-San Jose Corridor in San Francisco, and El Camino Real on the San Francisco Peninsula. Other Place Types Recently Identified by Local Jurisdictions: Employment Center Employment centers are significant centers of economic activity that do not have a mix of housing integrated in the area. These areas are served by a variety of transit options for commuters and can be enhanced by local-serving retail. Examples of employment centers include the Sunnyvale Moffett Park and the North Concord BART Adjacent Growth Opportunity Areas. Rural Town Center Initial Vision Scenario Page 17


22 Rural town centers are local centers of economic and community activity surrounded by agricultural lands. They have the opportunity to integrate moderate-density housing and supporting local-serving retail while retaining scale and improving bicycle and pedestrian access. The Sonoma County Penngrove Urban Service Area Growth Opportunity Areas is an example of a rural town center. Rural Mixed-Use Corridor Rural mixed-use corridors have a local focus of economic and community activity surrounded by agricultural lands. They integrate a mix of uses and provide access to transit and ability to walk or bike along the corridor. The Springs Growth Opportunity Area in Sonoma County is an example of a rural mixed-use corridor. The place type approach to distribution of housing growth provides very tangible benefits to the Bay Area: Concentrates growth in and revitalizes existing communities Limits greenfield development Reduces development pressure on Priority Conservation Areas Preserves character of existing lower density residential neighborhoods Utilizes existing transit infrastructure Strengthens planned transit lines and corridors Provides for rapid growth in senior population Leverages and improves existing water, sewer and capital infrastructure Lowers per capita water use due to development footprint and location of growth Improves alignment between employment centers, housing and regional transit Provides for an improved regional economy Initial Vision Scenario Page 18
23 These Place types define the growth pattern encompassed in the Initial Vision Scenario, which represents an acceleration of the shift in recent years toward infill development in existing communities rather than Greenfield development and a very different regional growth pattern than the historical trends of the last 25 years. 1.3 Meeting local and regional challenges Bay Area cities and counties, along with regional agencies, have identified numerous challenges to creating sustainable development. This section summarizes those challenges around a number of themes. Many of the challenges identified do not fall under the purview of ABAG or MTC, however they provide an important context for developing the SCS and will need to be addressed if this region is to achieve a sustainable development pattern. Economic Recovery and Vitality: The recent recession has severely impacted leading industries and triggered a high number of mortgage foreclosures in the Bay Area. The region lost about 200,000 jobs in the last few years, which will likely not be fully recovered until close to Under the Initial Vision Scenario, the region is expected to produce an average of almost 50,000 jobs per year over the 25-year planning period. This is much higher than the job growth average over the previous 20 years, which was closer to 10,000 jobs per year. Economic restructuring and regional competitiveness are often cited as the reasons for anemic job growth in the Bay Area. The slow economic recovery is compounded by long commutes for many of the Bay Area s workers who travel from locations where the market provided moderate-income housing at affordable levels prior to the current recession. Still, the Bay Area is one of the most successful metropolitan areas in the world, and employment growth will be revived. The Bay Area s innovative industries include key exporting industries and services (technology, life sciences, professional and financial services, tourism, etc) as well as critical assets that keep them competitive (universities, research labs, some outstanding public and private schools). Additionally, the region s diverse population and unique mix of entrepreneurial culture and innovation allows for risk-taking, innovative financing, and the adaptive re-allocation of our resources (facilities, workforce, and capital). The SCS should consider a sustainable economic development strategy that accompanies land use and transportation planning. Building on initiatives that have been undertaken throughout the Bay Area, the SCS seeks to enhance the region s prosperity and job production while at the same time improving its environmental integrity and quality of life. Connecting people to work, school, recreation, and commerce is a key aspect of a high-functioning Sustainable Communities Strategy. The SCS should link the Bay Area s existing and projected employment patterns (by industry, occupation, and income level) with housing markets and affordability in order to effectively reduce GHG emissions and increase the stock of affordable housing. Some areas of the region have established Green Corridors or Emerald Cities where a variety of economic development initiatives are underway. These initiatives cluster and support clean tech businesses that supply energy- or resource-efficient products or services. Economic development strategies should include assisting these firms with space needs and investment capital, as well as job development and support for local entrepreneurship. Programs such as these connect green and clean tech businesses with underserved communities and assist low- and Initial Vision Scenario Page 19
24 moderate-income employees and residents with money-saving efficiencies in housing and transport. A regional economic development strategy could support the land uses included in the SCS and bring more economic vitality to these areas. Another important economic development strategy that needs to be addressed in the SCS is the support of goods movement in the Bay Area. Industrial land supply for goods movement businesses has been concentrated along the major transportation corridors that ring the central parts of San Francisco Bay, and some of these locations are proximate to PDAs that are expected to accommodate housing growth. Industrial land supply in the inner Bay Area is declining while goods movement industries and their demand for central locations are growing. Shortages of industrial land result in the outward dispersion of industrial activities. Due to the region s geography and freeway system, the demand shifting outward will be heavily focused on industrial locations with access into the central Bay Area markets they serve via Interstate 580, Interstate 80, and U.S. Highway 101. SCS policies should take into account these trends and find policy incentives to support the retention of existing industrial land. Restoration of Housing Markets: The Bay Area was impacted by the mortgage lending crisis and there are numerous areas where foreclosure activity will continue at much higher than historical rates. Foreclosures suppress the housing construction market and impact the willingness of potential new buyers to invest in purchasing new units. The foreclosure crisis significantly impacted many of the jurisdictions in the eastern part of the region. These steep value declines in many parts of the Bay Area essentially stopped most housing production. The foreclosure crisis dropped home values in many neighborhoods and drastically decreased the funding available for new housing for both families and developers. Most local jurisdictions will probably not experience a regular flow of housing project permits for several years. The steep decline of the housing market has severely impacted the cities, counties, and special districts that are responsible for the implementation of the SCS. Many cities have been forced to reduce staff in planning and economic development departments. In the short term, public agencies will be stretched to implement local plans when the market begins to recover and projects are once again under way. Despite the challenges to the current housing market, the demographic trends and likelihood for economic growth in the Bay Area mean that over the long haul, housing markets will return to health. Demand for housing is expected to be particularly high in areas that are pedestrian- and transit-oriented, which will facilitate future growth in PDAs. Climate Adaptation: The SCS also will need to address how the Bay Area s land use plans can assist adaptation to climate change. Much of the region s key infrastructure, including airports and key expanses of highways close to the Bay are subject to sea-level rise. Our region will need to protect this vital infrastructure, and be prepared to address some of the other byproducts of climate change, such as worsening air quality, drinking water shortages and greater likelihood of events like the Oakland Hills firestorm. Supporting Infrastructure: To support the increased housing, the Initial Vision Scenario reflects the transportation investments from the Transportation 2035 Plan with an Express Lane backbone system. It also includes some initial proposals to improve the region s transit network, Initial Vision Scenario Page 20
25 all resulting in overall growth in transits capacity. However, the Bay Area s transit system is financially unsustainable with operators unable to afford to run the current service levels into the future, much less expanded services. MTC s Transit Sustainability Project will propose a more sustainable transit system for inclusion in the Detailed Scenarios to be tested. Changing Demographics: By 2035, our senior population will represent an increasing share of the overall population. Growth in the 65-and-over population accounts for almost half of the overall Bay Area population growth. This growth has major implications since many people in this population group have limited incomes and a smaller household size, typically one or two people, lowering the regional household size average down to 2.6 persons per household. The increasing diversity of our region also presents a different set of housing needs. Over the last two decades, Latino and Asian populations have increased by more than a third, while the proportion of whites have decreased. This trend has implications on the need for housing that can accommodate multigenerational families and on the location around specific services and cultural nodes. The relocation of the African-American population from inner, transit-served cities to more suburban locations represents a different challenge. While some of this relocation relates to choices, a portion relates to displacement and poor neighborhood qualities. These demographic challenges are compounded by the increasing polarization of our economy between high and low-wage workers and the suburbanization of poverty. The SCS focus on existing neighborhoods could help create a community context for addressing some of these challenges. Economic development, job opportunities and better public health outcomes could result from strengthening the urban core with new development. By capturing the market that exists for infill housing, services can be delivered more efficiently and with greater community resources. Both the senior population and younger knowledge-based workers seek safe, walkable, and diverse environments that are intended to be built using the principles of complete community planning in PDAs. Funding Affordable Housing Production: While its economic strength and quality of life has made the Bay Area attractive for many people, it also has increased the cost of housing for our diverse population. Our region faces a major challenge in the production of housing for all life stages, ethnic groups, and income levels. Between 1999 and 2006, the Bay Area as a whole produced only 55 percent of the needed housing units for low and very low income residents, and only 37 percent of the units needed for moderate-income residents, in contrast with the 153 percent for the above-moderate-income group. This affordable housing challenge is particularly critical in transit-oriented areas and established neighborhoods with high land value and complex planning processes. For low-income households earning less than $35,000 per year, the combined cost of housing and transportation places the vast majority of Bay Area municipalities beyond their reach and makes the Bay Area the most expensive region in the country. Local governments with Planned PDAs have identified a need for $2.42 billion to support their affordable housing goals in the short-term. Redevelopment agencies, in particular, have played a key role in helping to develop affordable housing in the region over the last 25 years, as redevelopment financing has provided subsidies that support construction of affordable housing. Presently, the existence of redevelopment agencies is threatened by state legislative action in response to the current budget crisis. The loss Initial Vision Scenario Page 21
26 of redevelopment agencies would affect the flow of dollars for affordable housing production. One of the key issues the SCS needs to address is how to target PDAs for the efficient production of affordable housing at all levels. Improving Neighborhood Services: The production of housing by itself will not address sustainability unless it is accompanied by the development of complete communities with welldefined destinations. A sustainable approach requires the development of complete communities connected by transit service. Many jurisdictions, however, lack the infrastructure that invites walking, biking and transit use; sidewalks, bike lanes, bus service, retail and entertainment are limited or missing. They also lack good neighborhood services, such as clean parks, good schools and grocery stores. Because schools are a critical housing-choice consideration for households with children, the quality of schools is closely correlated with the potential for market rate housing production. In the Bay Area, we have a wide range of school districts. The region is home to some of the highest-performing public and private schools in the nation, but there are also many poor performing schools in urban communities where the PDAs would accommodate much of the growth in the Initial Vision Scenario. Access to high-quality schools is a primary motivator for families choosing where to live, and schools account for 12 percent of all trips made in the Bay Area. An investment in improvements for urban schools, both in the surrounding neighborhood and in the school itself would reap benefits at the regional scale. Schools that offer innovative, rigorous and supportive programs for a wide range of students, from diverse backgrounds and income levels, are a cornerstone of complete communities. For example, new programs increasing standardized test scores and higher graduation rates at several Bay Area high schools, including Oakland Technical High School, Berkeley High School, and Carlmont High School (Belmont), have made them magnets for families. The SCS can further the achievements of urban schools by investing in safer streets and housing for the surrounding neighborhoods. Effective Planning, Permitting, and Design Tools: The focus on complete communities near transit defines major planning and implementation challenges for local jurisdictions. Beyond the basic planning needs for the development of complete communities, all jurisdictions have highlighted the high cost and time requirements of the environmental review process for new development. The cost of a neighborhood plan Environmental Impact Report can range from $200,000 to $3 million. In addition, designing buildings and public spaces that enhance the quality and character of the neighborhood requires resources and expertise beyond most local jurisdictions capabilities. Given the increase in density, taller buildings, and mix of activities in the development of PDAs, these design resources become essential to create places that meet community expectations. Given the complexity for local government to plan PDAs, planning funding is a critical need. Increasing the number of Planned PDAs that result in complete communities with streamlined permitting is a high priority for the SCS. Existing programs to assist local governments in these efforts could and should be expanded. Regulatory Framework: The mix of local, regional, state, and federal regulations that govern housing, commercial, and infrastructure project delivery makes progress toward compact Initial Vision Scenario Page 22
27 development both expensive and time-consuming. Rules and policies adopted by various levels of government such as storm water runoff, air quality, sea level rise, regional traffic impacts, and mitigations under CEQA can each cost a single project hundreds of thousands of dollars in direct and indirect costs. The coordination of as many rules as possible to facilitate development consistent with the final SCS will be critical for any meaningful implementation to occur. A key indicator for success of the SCS would be to resolve governmental policy conflicts with a mitigation package that will eliminate this key barrier. Water Supply and Distribution: Future water supply is severely constrained. Many water sources in the state are already significantly over-appropriated, and traditional storage developments may not be fiscally or environmentally feasible. Accommodating projected growth largely within the current water supply can be done, but it will require overcoming barriers in existing infrastructure to move and store reclaimed water, better use of storm water, and an increase in public acceptance of alternative-source water supplies. While many local water agencies are making strides toward meeting these outcomes, regional policy alignment is needed so that these efforts are widely pursued around the region and conflicting public policy over recycled and storm water source and use is minimized. The Bay Area s growth potential will need to be supported by an environmentally sustainable and reliable water supply. The compact growth pattern envisioned in the SCS will help to minimize the need for new long-term supply; urban core areas use less water per capita than does greenfield development. To achieve a sustainable water supply, new housing units will need to be built with state-of-the-art water conservation systems and landscaping. New units will also need to be developed within a framework which improves resiliency from more frequent climate-driven droughts and recognizes the potential for major supply disruptions from earthquake and/or levee failure in the Delta. Agricultural Lands, Open Space, Habitat Preservation: Given continued population and job growth and a decrease in programs that support the preservation and retention of agricultural lands, pressure to develop farmland and open space will increase. The preservation of farmland and open space can ensure that Bay Area lands will provide clean water, local food, diverse habitats to support a variety of native plants and animals, and recreational opportunities. It further presents an opportunity to remain economically viable by attracting businesses, workers, and visitors that value these lands for their contribution to the quality of life in the Bay Area and to support climate and adaptation strategies by providing places for species to migrate, water to rise, and land for crop diversification. To support the goal of open space and agricultural preservation, the growth pattern in the Initial Vision Scenario maximizes development in the urban footprint, with the benefit of decreasing development pressure on these lands. Hazards and Risks: Our entire region is subject to a variety of natural hazards. The majority of the housing in the SCS would be located primarily along the inner Bay corridors, where there are substantial short- and long-term risks from sea level rise and earthquake shaking and liquefaction. These hazards will result in damage to housing, infrastructure, and loss of economic power. Much progress has already been achieved by retrofitting major infrastructure. Major investments have upgraded the region s toll bridges and freeway overpasses. BART has strengthened its elevated tracks, 20 stations, and the Transbay Tube. Major seismic Initial Vision Scenario Page 23
28 improvements have been made to the Hetch-Hetchy and Mokelumne aqueduct systems as well as a number of dams and water treatment plants within the region. Local governments have retrofitted or replaced many of their city halls and critical facilities. Additional work to retrofit the region s significant older housing stock, plan for our long-term post-disaster recovery, and develop a regional sea level rise adaptation strategy will help ensure that the region realizes its vision for a sustainable future. Efficient Resource Management: The Sustainable Communities Strategy s emphasis on infill development encourages a resource-efficient economy that utilizes innovative programs within the materials management cycle to produce and consume less toxic and more recyclable products. Programs such as these improve our individual health and reduce our collective environmental impact. Recycling through existing collection systems creates processing jobs and encourages development of local industries that use recovered materials. Urban infill and high density projects are much more energy- and water-efficient than low-density development, thereby increasing economic resilience against future energy price shocks. Initial Vision Scenario Page 24
29 2. REGIONAL GROWTH BY 2035 The Initial Vision Scenario proposes a regional growth pattern to accommodate all the future population of the region. The Initial Vision Scenario assumes that there will be a sufficient number of homes to accommodate future population growth and to provide people coming to work in the Bay Area with a home in the region. It assumes that there is adequate funding for affordable housing. The forecast of future population and household growth is based on fertility rates, life expectancy, net migration, household formation rates, and employment growth. The doubling of the number of people aged 65 and older means that more people will be living in small households, living singly or as couples rather than families. Without assuming increases in the share of multi-generational and non-family households, this demographic shift will result in more households and a smaller average household size. Employment is expected to grow at a higher rate than that of the nation and of the Bay Area in previous decades. The rationale and optimism for this higher growth rate is that the Bay Area economic base is concentrated in sectors likely to lead the nation in job growth, such as professional services and research activities. Additionally, housing all the region s population is assumed to have an impact on employment levels; it will result in both incremental construction employment and incremental employment from consumer spending by the households that are no longer in-commuting from outside the region. Based on these assumptions, the total regional number of households by 2035 is estimated at approximately 3.6 million, or 903,000 additional households. The total number of jobs that are forecasted in the region by 2035 is approximately 4.5 million, an increase of approximately 1.2 million from today. Table 2.1: Initial Vision Scenario Regional Growth Growth Households 2,669,800 3,572, ,600 Population 7,348,300 9,429,900 2,081,600 Employed Residents 3,152,400 4,199,000 1,046,600 Jobs 3,271,300 4,493,300 1,222,000 The distribution of new households focuses on Priority Development Areas (PDAs), Growth Opportunity Areas, and transit corridors. PDAs and Growth Opportunity Areas accommodate about 70 percent of the total regional household growth. About 97 percent of the total households are within the urban footprint. At the county level, Santa Clara, Alameda, and Contra Costa are absorbing a major share of total increase in the number of households, 621,000 out of the 903,000 total. Compared to these counties, San Mateo adds a smaller number of households but grows at a similar rate, at approximately 36 percent. Slightly more than half of the region s job growth is expected in Santa Clara and Alameda Counties. Initial Vision Scenario Page 25
30 This spatial pattern of growth pursues a development path that builds upon recent planning efforts and goals of our local jurisdictions. This path, however, presents an approach that differs from previous development trends and previous forecasts. 2.1 Historical Trends and Current Regional Plans Forecast When compared with historical trends and the Current Regional Plans Forecast, the Initial Vision Scenario shifts the growth of population toward the transportation network, increasing the density and enhancing the qualities of existing cities and towns. The main regional planning approach in this scenario is the definition of character and scale of places by local jurisdictions. Between 1980 and 2010, the region saw a major share of its population growth in newly developed greenfield areas. In the Initial Vision Scenario, 70 percent of the housing is expected to be accommodated in the PDAs and Growth Opportunity Areas located close to transit, and only five percent is expected to be developed outside the urban footprint. In contrast to the recent past, when single-family housing development predominated, it is expected that nearly all of the housing within the PDAs and Growth Opportunity Areas will be multi-family housing, and that some percentage of housing accommodated in areas outside the PDAs and Growth Opportunity Areas will be multi-family as well. Studies of recent demographic and social trends in various regions across the country and beyond indicate that younger generations prioritize urban amenities over single-family homes in their choices of places to live. Access to cafes, restaurants, services, and cultural events around transit has more weight in their choices than do large houses with garages and automobile access. To be clear, suburban development of large houses has not and will not disappear in the immediate future. since our diverse population expects a wide range of housing possibilities. However, it should be noted that this choice is not as prevalent as it was in previous decades in the Bay Area. Given the 903,000 households that must be accommodated by 2035, the Initial Vision Scenario assumes a higher production of housing than the region has experienced in previous decades, when the region produced an average of 21,000 units per year. The Initial Vision Scenario assumes that we will produce about 36,000 units per year, which represents 100 percent of the needed housing. Employment in the Initial Vision Scenario is projected to grow an average of 50,000 jobs per year over the next 25 years. This is a higher job growth rate than the average over the previous 20 years of approximately 10,000 jobs per year, but it is a lower rate than expected prior to the recession. Between 1980 and 2010, the region added 740,000 jobs with most of the growth occurring before Between 2010 and 2035, the Initial Vision Scenario projects an increase of 1.2 million jobs. This recovers the almost half-million jobs lost in the past decade and adds an additional 740,000 jobs. While the regional population and the regional economy have both grown, regional employment has kept a much slower pace, and has had major periods of decline over the past two decades, especially during the recent recession. Figures 2.1 and 2.2 show historical, Current Regional Plans Forecast, and Initial Vision Scenario regional household and job growth. Initial Vision Scenario Page 26
31 Figure 2.1: Regional Household Growth Figure 2.2: Regional Job Growth * The difference between the Historical Trends (Department of Finance) and the Historical Trends (ABAG) reflects certain adjustments between Department of Finance employment figures and those used for regional modeling purposes, such as for self-employed jobs. Initial Vision Scenario Page 27
32 2.2 Housing Distribution by 2035 The distribution of housing in the Initial Vision Scenario maximizes development within the Priority Development Areas and Growth Opportunity Areas along the existing transportation network, three significant inner Bay Area arterial corridors, and three planned rail corridors. This approach is intended to help support transit use and leverage past and future investments in transit and infill. The existing, extensive transportation network in the Bay Area provides a strong foundation upon which to distribute future growth. Many of the region s PDAs, where infill growth is already being planned, are based around the stations of the major heavy- and light-rail systems BART, Caltrain, Amtrak, SF Muni, and VTA. The PDAs along these transit corridors serve as nodes that will connect the majority of the region s housing and jobs by Additionally, three state arterial highways in the Bay Area State Routes 185, 82 and 123, known locally as Telegraph Avenue-International Boulevard-Mission Boulevard, El Camino Real, and San Pablo Avenue are closely linked to the established transit system, and have high potential for infill housing development. Improved bus service (Bus Rapid Transit) is planned along these spines, so development of housing along these corridors will leverage the existing transit network to provide better access to job centers around the region, and help to transform auto-oriented corridors into walkable communities. Three planned heavy rail expansion projects BART to Silicon Valley, BART to Antioch ( ebart ), and Sonoma-Marin Area Rail Transit (SMART) provide an opportunity to more efficiently link residents to the region s major job centers. Development of housing along these new corridors will help to ease the Bay Area s chronic housing shortage, improve the costeffectiveness of the expansions, and help preserve regional open space. Many of the communities along these future transit corridors are already planning for a significant amount of new housing at the future stations. Napa County is the only county without existing or planned commuter rail service. Growth in Napa County will be primarily accommodated in the American Canyon PDA and within city centers that utilize local and regional bus service. At the county level, Santa Clara and Alameda Counties will take the largest shares of new households, at 28 percent and 24 percent of the region s total household growth, respectively. San Mateo, San Francisco, and Contra Costa Counties collectively take on an additional 338,000 new households, or 37 percent of the region s growth. Table 2.2 summarizes the distribution of household growth at the county level. The distribution of household growth along corridors and nodes is described more specifically below. Map 2.1 shows the Initial Vision Scenario Place type distribution across the region. Initial Vision Scenario Page 28
33 Table 2.2: Initial Vision Scenario Total Households and Household Growth by County County 2010 Households 2035 Households Household Growth Percent Change Alameda 557, , , % Contra Costa 392, , , % Marin 106, ,100 10, % Napa 51,300 56,100 4, % San Francisco 346, ,800 90, % San Mateo 264, ,300 93, % Santa Clara 613, , , % Solano 148, ,800 39, % Sonoma 188, ,400 42, % Regional Total 2,669,800 3,572, , % Between 2010 and 2035, regional centers continue to lead the growth in households in the region. San Jose, San Francisco, and Oakland will add 286,000 households, almost one third of the regional total. In each of these cities downtown areas, this level of growth represents a major change in scale and character, a shift towards high-rise residential buildings, and in outer neighborhoods, higher-density development along transit corridors. At the same time, medium size cities that range from city centers to transit town centers are also assuming major growth responsibilities. Fremont, Santa Rosa, Berkeley, Hayward, Richmond, Concord, and Santa Clara, for example, are adding between 10,000 to 20,000 households. See jurisdiction tables at the end of Section 2.3 for more details about city-wide growth. Growth Along Existing Transportation Network San Francisco is an appropriate location for a significant portion of the region s future housing. It has reliable, frequent BART and Caltrain service, Muni light rail and bus lines, ferry service, future high-speed rail service, as well as considerable existing commercial and retail density. In 2035, San Francisco as a whole is expected to have 436,800 households, an increase of 90,100 households. Eighty-one percent of these new households will be in the city s varied PDAs. The Downtown-Van Ness-Geary PDA, a regional center, will take on the greatest share of growth at 19,000 households, while the Bayview/Hunters Point Shipyard/Candlestick Point PDA, an urban neighborhood, will contribute 11,200 households. Treasure Island will add 7,200 households, and new 4,100 households are expected in the Transbay Terminal PDA. Along the Peninsula, Caltrain, BART, and Valley Transportation Authority (VTA) rail systems connect numerous communities, as well as the region s two biggest employment centers, San Francisco and San Jose. Many of these systems stations are within walking distance from El Camino Real, or the planned Grand Boulevard corridor, which crosses through and connects numerous PDAs around the downtowns and commercial streets along the Peninsula, from South San Francisco in the north, to San Jose in the south. SamTrans and VTA provide frequent bus service along this corridor. Initial Vision Scenario Page 29


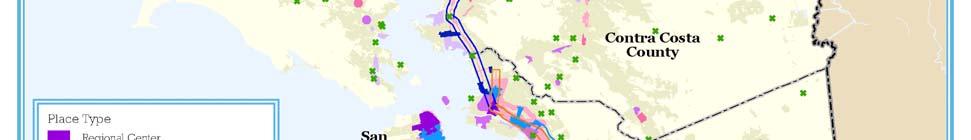
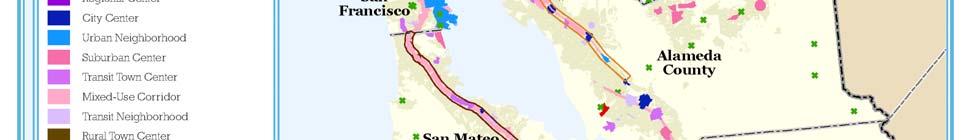

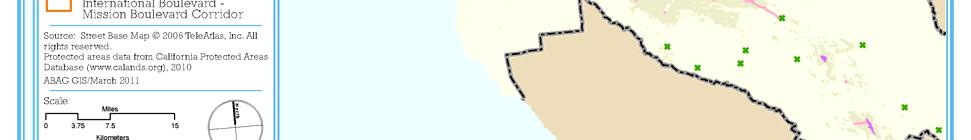
34 Map 2.1: Place Types for Priority Development Areas and Growth Opportunity Areas in the San Francisco Bay Area Initial Vision Scenario Page 30
35 In San Mateo County, Daly City, Redwood City, San Mateo and South San Francisco are expected to take on the largest shares of the county s total growth, totaling 55 percent, or 51,500 new households. Forty-three percent of this growth will be accommodated by these cities PDAs, ranging from city centers to transit town centers. In Redwood City, new Growth Opportunity Areas could accommodate an additional 2,560 households. In Santa Clara County, the PDAs along the Caltrain, El Camino Real, and VTA corridors are expected to add about 110,500 new households by 2035, while new Growth Opportunity Areas in the county could accommodate an additional 65,000 households. This combined growth would account for around 69 percent of the county s total growth, greatly improving residents transit access to major Silicon Valley and Peninsula employment centers. San Jose, a major node along this corridor, is expected to take on the largest share of any city (15 percent) of the region s total growth. In the inner East Bay, BART connects the communities of Richmond, El Cerrito, Berkeley, Oakland, San Leandro, Hayward, Union City, and Fremont. In close proximity to this transit spine are two mixed-use corridors, San Pablo Avenue and Telegraph Avenue-International Boulevard-Mission Boulevard, which further link these inner East Bay communities as far north in Contra Costa as Hercules and Rodeo. AC Transit, Amtrak Capitol Corridor, and the Altamont Commuter Express (ACE) currently provide transit service to these communities, and Bus Rapid Transit is expected to be developed in the future along the San Pablo Avenue and Telegraph Avenue-International Boulevard-Mission Boulevard corridors. The PDAs along the San Pablo Avenue corridor in Contra Costa County are expected to have nearly 45,000 new households, approximately one-third of the household growth projected for Contra Costa County. The Richmond and El Cerrito PDAs, with a total of 22,000 new units collectively, will be the largest nodes of growth along this corridor. With forecasted growth of over 25,500 households, Richmond is expected to add the most households in Contra Costa County between 2010 and It will be the second-largest city in the county, after Concord. In Alameda County, Oakland, the East Bay s largest employment and transit hub, will take on 30 percent of the county s total growth the largest share of any jurisdiction. The approximately 65,500 new households in Oakland will be distributed primarily among the city s seven Priority Development Areas. Oakland s Downtown & Jack London Square PDA, a Regional Center, will take on approximately 17,000 new households, while the nearby West Oakland PDA will grow by about 8,200 households. Berkeley and Emeryville, two major employment centers, will collectively take on over 10 percent of the county s household growth. These cities PDAs, which account for a majority of their growth, are already well-established, higher-density mixed-use neighborhoods. In particular, the Downtown Berkeley PDA will grow by almost 4,900 households, while the Emeryville Mixed-Use Core PDA will have approximately 7,300 new households. Alameda County s inner East Bay corridor, from San Leandro to Fremont, is expected to add over 75,000 new households by After Oakland, Fremont will take on the largest share (13 percent) of the county s growth. Its three PDAs plus its two new Growth Opportunity Areas will Initial Vision Scenario Page 31
36 account for nearly 8,500 new households. The four cities of Hayward, Newark, San Leandro, and Union City will have nearly 147,000 households by 2035, growing by 35,000. The majority of the growth in these cities is centered on their PDAs, most of which have existing or planned heavy-rail transit service. The 14 Growth Opportunity Areas in Alameda County s inner East Bay communities are expected to take on approximately 9,400 new households by The Tri-Valley communities are linked to the rest of the region via BART to Dublin, ACE rail service, and Central Contra Costa Transit Authority County Connection bus service. The four major cities in the Tri-Valley Pleasanton, Livermore, San Ramon, and Dublin are all major East Bay job centers. These communities are expected to grow by nearly 54,000 households by 2035, each expecting to add between 9,700 and 16,700 new households. The eight PDAs in these communities will accommodate 35 percent of these expected new households. Central Contra Costa County consisting of the major employment centers of Walnut Creek, Pleasant Hill, and Concord, as well as the smaller communities of Moraga, Lafayette, Orinda, and Martinez is expected to take on 22 percent of Contra Costa County s total household growth. All of these communities are connected via the BART to Pittsburg line, with the exception of Martinez, which has Amtrak Capitol Corridor service, and Moraga, with County Connection local bus service. With forecasted growth of over 19,000 households, Concord is expected to take on the second largest share of growth in Contra Costa County between 2010 and The bulk of this growth will occur in the Los Medanos (Concord Naval Weapons Station) PDA, a new regional center, as well as new Growth Opportunity Area in the existing downtown commercial core. Walnut Creek s West Downtown PDA will account for about four percent of the county s growth. The city s overall level of growth remains low compared with other major employment centers throughout the region. The PDAs in Pleasant Hill, Martinez, and the Lamorinda communities are forecasted to collectively take on four percent of the county s growth. Solano County is linked to the rest of the Bay Area and the Sacramento region by Amtrak Capitol Corridor service. In 2035, Solano County is expected to have about 188,000 households an increase of about 40,000 from The cities expected to add the most households are Fairfield (16,400), Vacaville (9,200), and Vallejo (5,800). These cities have identified several suburban centers, transit town centers, and mixed-use corridors where growth will be accommodated. Nearly all of the growth in Fairfield will be in one of the city s four PDAs, which encompass the downtown, the Fairfield-Vacaville Amtrak station, and several of the city s major mixed-use corridors. Growth is also planned in Downtown Benicia, a transit neighborhood, and in the Downtown and Waterfront area near the Amtrak station in Suisun City, a transit town center. For Solano County as a whole, almost 60 percent of household growth over the next 25 years will occur in a Priority Development Area or Growth Opportunity Area. Although Napa County has no rail service, the Napa VINE provides connections between the cities in Napa County and the Vallejo ferry terminal where riders can connect to San Francisco. Napa County is projected to add approximately 4,800 households over the next 25 years, for a total of approximately 56,000 in Approximately half (54 percent) of this growth will occur Initial Vision Scenario Page 32
37 in the city of Napa, which accounts for 57 percent of the county s total households in American Canyon is expected to add more than 1,600 households between 2010 and percent of the county s forecasted growth. All of this growth will be in the city s PDA, the Highway 29 Mixed-Use Corridor. Growth Along Future Transit Corridors The planned BART to Silicon Valley extension will connect Santa Clara County residents to the existing 104-mile BART system and the major regional employment centers along the Peninsula, and in San Francisco, Oakland, and the East Bay. Stations are planned in Milpitas, San Jose and Santa Clara, connecting to the existing BART system at Fremont. The extension of BART into Santa Clara County will enhance connections to Caltrain, VTA light rail and buses, Altamont Commuter Express, and Amtrak Capitol Corridor, with planned connections to Mineta San Jose International Airport and high-speed rail, significantly extending the reach of the regional transit network. San Jose, the largest node along this corridor and the region s largest city, is expected to grow by 131,000 new households and will have approximately 436,000 households by 2035 nearly half of Santa Clara County s total. The San Jose downtown area PDAs, where BART will connect at Diridon Station, along with the North San Jose PDA will take on 45 percent of this growth. The other PDAs and Growth Opportunity Areas in San Jose are expected to add over 54,000 new households. These areas, outside of the core of San Jose, are linked to the larger Santa Clara County transit network via VTA. Milpitas and Santa Clara are expected to add approximately 44,000 new households, collectively. Twenty-five percent of this growth will occur in the PDAs and Growth Opportunity Areas near the planned BART stations in these cities. Additionally, Growth Opportunity Areas along bus and light-rail corridors in the city of Santa Clara are expected to take on 16,200 of these households. In Fremont, the Warm Springs station area is expected to grow by almost 800 households. Much of the growth in the North Bay counties of Sonoma and Marin will be in the communities along the Sonoma-Marin Area Rail Transit (SMART) line and in the town centers of smaller communities. SMART will link the cities along the Highway 101 corridor, from Cloverdale in the north to Larkspur in the south, where riders can catch a ferry to San Francisco. The SMART stations in the bigger cities, such as Santa Rosa, San Rafael, Petaluma, Rohnert Park, and Windsor, are city centers or suburban centers, while the stations in smaller cities, such as Cloverdale and Cotati, are transit town centers. In Sonoma County, nearly half of projected growth will occur in Santa Rosa by far the county s largest city with more than 83,000 households in Of the growth in Santa Rosa, 55 percent will occur near the city s two future SMART stations (in the Downtown/Railroad Square PDA and near the northern Santa Rosa station). Windsor and Rohnert Park are both expected to add almost 5,000 households over the next 25 years, while Petaluma will grow by about 2,900 households. Much of the rest of the projected household growth in Sonoma County will take place in rural and suburban areas in unincorporated Sonoma County. Initial Vision Scenario Page 33
38 Marin County is expected to take on only one percent of the region s growth. Approximately half of Marin County s growth will occur in San Rafael the county s largest city. San Rafael is expected to add just over 5,000 households, approximately 80 percent of which will be in one of the city s two Priority Development Areas. Unincorporated Marin County is expected to add about 2,700 households, much of which will be in the San Quentin Growth Opportunity Area and the Urbanized 101 Corridor PDA. Nearly 30 percent of Contra Costa County s household growth is expected to occur in east Contra Costa County. Much of this growth will be spurred by the development of ebart, the extension of the BART to Pittsburg line into eastern Contra Costa. The ebart line will have station stops in Pittsburg and Antioch, providing greater access to the larger Bay Area transit network for eastern county residents. Of the 41,800 new households forecast in this part of the county, one-third are expected to develop at the three station areas along the corridor Pittsburg- Baypoint, Pittsburg-Railroad Avenue, and Antioch-Hillcrest. Citywide, Antioch and Pittsburg each will take on about 10 percent of the county s growth, accommodating a total of 29,000 new households, primarily within their PDAs. Oakley is expected to have 17,500 households by 2035, growth of approximately 6,600 new households. 2.3 Employment Distribution by 2035 Employment distribution among jurisdictions and the nine counties remains comparable to previous regional forecasts. Only the base numbers and growth rate for the region have changed to reflect recent changes in the economy. In the Initial Vision Scenario, the regional economy is expected to grow at a higher rate than the nation, building upon the region s concentration in high-growth industries. Growth is expected to continue in professional services, education and healthcare. The hospitality and entertainment sectors will also grow at a fast pace. Manufacturing and wholesale will grow at a slow pace and continue to relocate jobs outside of the region. However, light industries and services that support core industries will solidify and expand. New industries such as green technology will develop and expand jobs across research and manufacturing at selected locations. In terms of the distribution of job growth in the Initial Vision Scenario, the largest cities outpace the region, as existing employment centers and industry clusters continue to intensify development and add jobs. Employment in the 10 largest cities accounts for more than half of the growth in the region between 2010 and Slightly more than half of the region s job growth is expected in Santa Clara and Alameda Counties. San Francisco, San Mateo, and Contra Costa Counties are also all expected to add more than 100,000 jobs each. Santa Clara, Sonoma, and Solano are expected to grow faster than other counties by 44, 41, and 40 percent, respectively. The city of San Jose will absorb a higher share of jobs in the Silicon Valley. Walnut Creek and Concord continue to add office jobs. Pleasanton, Dublin, and San Ramon continue to attract a range of businesses. Santa Rosa strengthens its role as a major employment center in the North Bay. Low-density office parks add more jobs and in some cases housing, while providing transit access. Initial Vision Scenario Page 34
39 Table 2.3: Initial Vision Scenario Total Jobs and Job Growth by County County 2010 Jobs 2035 Jobs Job Growth Percent Change Alameda 675, , , % Contra Costa 345, , , % Marin 129, ,100 21, % Napa 70,100 88,800 18, % San Francisco 544, , , % San Mateo 330, , , % Santa Clara 858,400 1,238, , % Solano 126, ,700 50, % Sonoma 190, ,600 77, % Regional Total 3,271,300 4,493,300 1,222, % It is important to note that given the Bay Area s attractiveness for high-value employment and the region s very high housing costs over the last three to four decades, regional planning and related policies and investments have to date largely focused on housing as it relates to transitoriented development. The current severe recession, global competition, job losses in key sectors of the regional economy, including technology and manufacturing, and deep fiscal challenges at the state and local levels arguably require a more comprehensive regional planning approach to advance a more competitive regional economy. Toward this end, the distribution of jobs will be further analyzed for the Detailed Scenarios. This analysis will assess whether additional investments in Priority Development Areas and new Growth Opportunity Areas will support additional job growth reflected in local plans, as well as policies such as how employer transportation demand management might shift commute patterns for jobs with quality transit access. Initial Vision Scenario Page 35
40 Table 2.4: Initial Vision Scenario Household and Job Totals and Growth by Jurisdiction Households Alameda County Growth Jobs Percent Change Growth Percent Change Alameda 31,774 39,873 8, % 25,347 37,416 12, % Albany 7,150 9,317 2, % 4,476 4, % Berkeley 46,146 61,876 15, % 69,782 78,575 8, % Dublin 15,572 32,216 16, % 18,058 33,400 15, % Emeryville 5,770 13,260 7, % 18,198 25,479 7, % Fremont 71,004 98,564 27, % 86, ,484 41, % Hayward 46,300 61,283 14, % 66,135 84,730 18, % Livermore 28,662 40,801 12, % 28,485 46,930 18, % Newark 13,530 19,331 5, % 19,049 21,799 2, % Oakland 160, ,019 65, % 187, ,846 67, % Piedmont 3,810 3, % 2,091 2, % Pleasanton 24,034 33,819 9, % 52,775 70,158 17, % San Leandro 31,647 40,447 8, % 38,532 51,606 13, % Union City 20,420 25,900 5, % 17,919 33,560 15, % Alameda County Unincorporated 51,265 63,872 12, % 40,576 51,320 10, % Countywide Total 557, , , % 675, , , % Households Contra Costa County Growth Jobs Percent Change Growth Percent Change Antioch 32,668 46,365 13, % 18,529 37,530 19, % Brentwood 18,250 24,284 6, % 6,766 7, % Clayton 3,966 4, % 874 1, % Concord 46,296 65,624 19, % 58,731 88,097 29, % Danville 16,574 17,920 1, % 12,837 13, % El Cerrito 10,422 20,905 10, % 5,154 7,917 2, % Hercules 8,361 17,431 9, % 2,747 5,344 2, % Lafayette 9,589 11,068 1, % 10,087 10, % Martinez 14,769 16,156 1, % 16,919 17, % Moraga 5,811 6,995 1, % 4,603 5, % Oakley 10,835 17,508 6, % 2,720 7,378 4, % Orinda 6,868 8,788 1, % 5,689 6, % Pinole 7,336 12,623 5, % 5,280 6,410 1, % Pittsburg 20,849 36,261 15, % 12,432 24,657 12, % Pleasant Hill 15,247 17,861 2, % 13,815 19,148 5, % Richmond 37,897 63,439 25, % 37,077 57,222 20, % San Pablo 9,975 13,027 3, % 5,403 8,025 2, % San Ramon 22,061 36,682 14, % 36,286 48,905 12, % Walnut Creek 33,890 40,244 6, % 49,309 56,967 7, % Contra Costa County Unincorporated 61,016 69,382 8, % 40,672 48,654 7, % Countywide Total 392, , , % 345, , , % Initial Vision Scenario Page 36
41 Households Marin County Growth Jobs Percent Change Growth Percent Change Belvedere % % Corte Madera 3,948 4, % 6,482 9,202 2, % Fairfax 3,301 3, % 1,642 1, % Larkspur 8,036 8, % 6,708 7, % Mill Valley 6,267 6, % 8,181 9,900 1, % Novato 20,375 21, % 25,385 30,753 5, % Ross % % San Anselmo 5,310 5, % 4,754 5, % San Rafael 23,164 28,209 5, % 43,649 50,324 6, % Sausalito 4,310 4, % 6,543 7,740 1, % Tiburon 3,844 4, % 3,494 3, % Marin County Unincorporated 26,162 28,900 2, % 21,238 23,166 1, % Countywide Total 106, ,124 10, % 129, ,097 21, % Households Napa County Growth Jobs Percent Change Growth Percent Change American Canyon 5,761 7,392 1, % 2,204 4,321 2, % Calistoga 2,140 2, % 2,748 3, % Napa 29,440 32,019 2, % 34,272 44,565 10, % St. Helena 2,440 2, % 5,763 6, % Yountville 1,110 1, % 2,104 2, % Napa County Unincorporated 10,370 10, % 23,044 27,894 4, % Countywide Total 51,260 56,061 4, % 70,136 88,838 18, % Households San Francisco County Growth Jobs Percent Change Growth Percent Change San Francisco 346, ,794 90, % 544, , , % Countywide Total 346, ,794 90, % 544, , , % Initial Vision Scenario Page 37
42 Households San Mateo County Growth Jobs Percent Change Growth Percent Change Atherton 2,490 2, % 2,485 2, % Belmont 10,740 12,759 2, % 6,635 11,738 5, % Brisbane 1,730 5,324 3, % 7,991 17,402 9, % Burlingame 13,247 19,431 6, % 21,905 26,728 4, % Colma 460 1, % 3,111 4,310 1, % Daly City 31,261 43,095 11, % 16,772 27,084 10, % East Palo Alto 7,780 12,310 4, % 2,105 6,484 4, % Foster City 12,210 13,767 1, % 13,923 18,560 4, % Half Moon Bay 4,440 4, % 4,355 5,539 1, % Hillsborough 3,837 4, % 1,624 2, % Menlo Park 12,432 17,563 5, % 25,145 29,501 4, % Millbrae 8,308 12,910 4, % 6,731 10,238 3, % Pacifica 14,320 14, % 6,051 7,467 1, % Portola Valley 1,730 1, % 1,686 1, % Redwood City 29,620 41,032 11, % 48,682 63,717 15, % San Bruno 15,262 21,699 6, % 13,537 17,938 4, % San Carlos 11,909 15,707 3, % 15,024 21,976 6, % San Mateo 38,643 56,678 18, % 43,337 58,896 15, % South San Francisco 20,288 30,522 10, % 41,328 54,485 13, % Woodside 2,029 2, % 2,381 2, % San Mateo County Unincorporated 21,780 23,830 2, % 45,326 60,869 15, % Countywide Total 264, ,337 93, % 330, , , % Households Santa Clara County Growth Jobs Percent Change Growth Percent Change Campbell 16,892 21,002 4, % 22,099 26,897 4, % Cupertino 19,830 21,588 1, % 30,513 35,283 4, % Gilroy 14,330 22,118 7, % 16,652 22,666 6, % Los Altos 10,670 11,968 1, % 10,250 11,511 1, % Los Altos Hills 3,053 3, % 1,845 1, % Los Gatos 12,430 13, % 18,275 20,700 2, % Milpitas 19,030 38,758 19, % 46,784 55,624 8, % Monte Sereno 1,229 1, % % Morgan Hill 12,399 20,040 7, % 12,698 20,806 8, % Mountain View 32,114 50,348 18, % 50,074 64,507 14, % Palo Alto 26,705 38,692 11, % 73,303 78,163 4, % San Jose 305, , , % 342, , , % Santa Clara 43,403 67,672 24, % 103, ,386 35, % Saratoga 11,000 11, % 6,826 7, % Sunnyvale 54,170 73,425 19, % 72,392 96,408 24, % Santa Clara County Unincorporated 31,604 37,991 6, % 50,304 64,481 14, % Countywide Total 613, , , % 858,399 1,238, , % Initial Vision Scenario Page 38
43 Households Solano County Growth Jobs Percent Change Growth Percent Change Benicia 11,329 13,527 2, % 14,043 17,485 3, % Dixon 5,617 8,222 2, % 4,330 7,239 2, % Fairfield 36,061 52,476 16, % 42,864 60,579 17, % Rio Vista 3,540 4,737 1, % 1,191 2,327 1, % Suisun City 9,132 10,548 1, % 3,210 4,637 1, % Vacaville 32,620 41,775 9, % 23,422 35,030 11, % Vallejo 42,043 47,814 5, % 28,415 38,258 9, % Solano County Unincorporated 7,817 8, % 8,853 11,156 2, % Countywide Total 148, ,776 39, % 126, ,711 50, % Households Sonoma County Growth Jobs Percent Change Growth Percent Change Cloverdale 3,211 4,639 1, % 1,430 1, % Cotati 2,832 3, % 2,043 2, % Healdsburg 4,390 5, % 5,111 6,193 1, % Petaluma 21,775 24,713 2, % 26,968 34,870 7, % Rohnert Park 15,718 20,395 4, % 13,566 21,506 7, % Santa Rosa 62,886 83,010 20, % 72, ,005 44, % Sebastopol 3,325 3, % 4,753 5, % Sonoma 4,476 5, % 7,005 7, % Windsor 8,884 13,809 4, % 5,154 7,782 2, % Sonoma County Unincorporated 60,933 67,505 6, % 52,015 62,822 10, % Countywide Total 188, ,373 42, % 190, ,588 77, % 2.4 Evaluation of Initial Vision Scenario The Initial Vision Scenario has been evaluated against a set of performance targets and has also undergone a preliminary equity analysis. The performance targets were adopted by MTC and ABAG for the Sustainable Communities Strategy and the Regional Transportation Plan in January The equity indicators were discussed with the Regional Equity Working Group in February Performance Targets The performance targets reflect a comprehensive set of goals for regional transportation and land use planning, including climate protection, adequate housing, healthy and safe communities, open space and agricultural preservation, equitable access, economic vitality, and transportation system effectiveness. Table 2.5 provides the results of the performance target analysis for the Initial Vision Scenario. Initial Vision Scenario Page 39
44 Two of the performance targets (targets 1 and 2 below) are required by state legislation, while a third target is based on a federal standard (target 3 below): 1. Greenhouse Gas Emissions Reduction Target: The California Air Resources Board (CARB) has set regional targets for each Metropolitan Planning Organization to reduce carbon dioxide emissions from cars and light trucks for years 2020 and Housing Target: SB 375 effectively requires each region to set target levels for 25 years of housing growth based on accommodating all population growth by income level. 3. Fine Particulate Matter (PM 2.5 ): the US Environmental Protection Agency has designated the Bay Area as not meeting air quality standards for particulate matter less than micrometers PM 2.5 and MTC must demonstrate the SCS/RTP conforms to the new standard. This assessment provides a first overview of how household growth focused on selected place types and transit networks could meet regional goals. This Initial Vision Scenario outlines major progress toward the comprehensive sustainability and equity goals of the region, but remains short in some areas. The Initial Vision Scenario meets the housing goal as it is embedded as an assumption for this scenario. About 97 percent of the growth in housing units is distributed within the urban footprint; it is assumed that the remaining 3 percent outside the urban footprint will be very-low-density housing that is allowable under existing development rules of the respective jurisdictions. When compared to previous forecasts, this scenario introduces major improvements on climate protection, with an expected reduction of CO 2 emissions from cars and light trucks by 12 percent. However, it remains short of the official targets established by the California Air Resources Board by three percent. The performance of the Initial Vision Scenario with respect to the targets related to healthy and safe communities, equitable access, and transportation system effectiveness is mixed, indicating some improvements over previous trends and previous forecasts, but also the need for additional efforts and strategies. Relative to air quality, this scenario will reduce premature deaths by 25 percent, exceeding the target of 10 percent. This is primarily due to California Air Resources Board regulations that reduce emissions from diesel trucks. Overall, coarse particulate matter (PM 10 ) emissions will be reduced by 10 percent, less than half of the target. Fatalities and severe injuries from collisions increase, rather than go down. This is connected to the fact that more people are walking and biking. The amount of time people spend walking and biking for transportation increases from 9 minutes per day to 11 minutes, but falls short of the target of 15 minutes per day. The Initial Vision Scenario meets the targeted reduction of housing and transportation costs for low-income residents; however, this reflects the assumption embedded in the scenario that the region s total demand for housing at all income levels is met. Similarly, the unconstrained financing assumption of the scenario means that the road repair and transit asset targets are also met. With the ninth target, average per-trip transit distance and time increases slightly under the Initial Vision Scenario, while the target proposes a reduction by 10 percent. However, this is the result of an increase in the overall length of transit trips, as longer transit trips become more convenient and more travelers switch from auto to transit for these trips. Initial Vision Scenario Page 40
45 Table 2.5: Performance Target Results for the Initial Vision Scenario GOAL/OUTCOME # TARGET RESULT CLIMATE PROTECTION 1 Reduce per capita CO 2 emissions from cars and light duty trucks by 15% 12% reduction ADEQUATE HOUSING 2 House 100% of the region s projected 25 year growth by income level (very low, low, moderate, above moderate) without displacing current low income residents 100% housing need met HEALTHY & SAFE COMMUNITIES 3 Reduce premature deaths from exposure to particulate emissions: Reduce premature deaths from exposure to fine particulates (PM2.5) by 10% Reduce coarse particulate emissions (PM10) by 30% Achieve greater reductions in highly impacted areas Premature deaths reduced by 24%* PM10 emissions reduced by 10% Highly impacted area results not available at this time 4 Reduce by 50% the number of injuries and fatalities from all collisions (including bike and pedestrian) 21% increase 5 Increase the average daily time walking or biking per person for transportation by 60% (for an average of 15 minutes per person per day) 11 minutes per day OPEN SPACE AND AGRICULTURAL PRESERVATION 6 Direct all non agricultural development within the urban footprint (existing urban development and urban growth boundaries) 97% of households within urban footprint EQUITABLE ACCESS 7 Decrease by 10% the share of low income and lowermiddle income residents household income consumed by transportation and housing 3% decrease in share of income spent on housing ECONOMIC VITALITY 8 Increase gross regional product (GRP) by 90% an average annual growth rate of approximately 2% (in current dollars) Not available at this time TRANSPORTATION SYSTEM EFFECTIVENESS 9 Decrease per trip travel time by 10% Decrease average per trip travel time by 10% for nonauto modes Decrease automobile vehicle miles traveled (VMT) per capita by 10% Non auto triptime increase by 7% (1 minute) VMT per capita reduced by 10% *Preliminary results Initial Vision Scenario Page 41
46 2.4.2 Equity Assessment The equity analysis reveals whether the benefits and burdens forecast by the performance targets are equally distributed between low- and non-low-income households. Where possible, these outcomes are also compared with current conditions. The intent of this preliminary analysis is to identify potential negative regional equity results at the beginning of the planning process. Understanding where current disparities exist for low-income households and how the Sustainable Communities Strategy might address them will be the subject of future analyses. Additional measures may include wages, existing school performance, and jobs/housing match. Table 2.6: Results of Equity Analysis of Performance Targets for the Initial Vision Scenario GOAL/OUTCOME TARGET CURRENT CONDITIONS 2035 RESULT CLIMATE PROTECTION ADEQUATE HOUSING HEALTHY AND SAFE COMMUNITIES ECONOMIC VITALITY Decrease automobile vehicle miles traveled per capita by 10%* House 100% of the region s projected 25 year growth by income level (very low, low, moderate, above moderate) without displacing current low income residents Increase the average daily time walking or biking per person for transportation by 60% (for an average of 15 minutes per person per day) Average travel time per work or school trip* Low income households: 9 miles a day Non low income households: 18 miles a day Not available Low income households: 11 minutes a day Non low income households: 9 minutes a day Low income households: 19 minutes Low income households: 14% reduction Non low income households: 11% reduction Adequate housing for all projected residents, based on scenario assumptions. Low income households: 13 minutes a day; Non low income households: 10 minutes a day Low income households: 2% increase Average daily travel costs* Non low income households: 20 minutes Low income households: $2.79 per typical day Non low income households: 2% increase Low income households: 17% increase Non low income households: $4.59 per Non low income households: 21% Initial Vision Scenario Page 42
47 typical day increase TRANSPORTATION SYSTEM EFFECTIVENESS Decrease average per trip travel time by 10% for nonauto modes Low income households: 24 minutes Low income households: 2% increase Non low income households: 25 minutes Non low income households: 8% increase * These goals required a substitute target. Data or methods of analysis are not available for all targets. Initial Vision Scenario Page 43
48 3. COUNTY VISION SCENARIOS The Initial Vision Scenario distributes growth in each Bay Area county based on the same overarching principle of concentrating development in transit-served areas to create more sustainable communities. However, since each county has its own unique characteristics, each county vision scenario was carefully shaped to reflect differences in history, geography, development patterns, and local planning efforts. The following narratives convey a vision of how growth over the next quarter century might transform each county s Priority Development Areas and Growth Opportunity Areas. They also describe how residents might benefit from the increased housing and transportation choices, better access to jobs and services, and protection of natural resources that would result from a more focused growth pattern. Table 3.1: Initial Vision Scenario Total Households and Household Growth by County and Priority Development Areas and Growth Opportunity Areas County 2010 Households 2035 Households Household Growth Percent Change Alameda 557, , ,700 38% PDAs and Growth Opportunity Areas 161, , ,600 82% Contra Costa 392, , ,000 39% PDAs and Growth Opportunity Areas 35, , , % Marin 106, ,100 10,700 10% PDAs and Growth Opportunity Areas 4,700 10,900 6, % Napa 51,300 56,100 4,800 9% PDAs and Growth Opportunity Areas 300 1,900 1, % San Francisco 346, ,800 90,100 26% PDAs and Growth Opportunity Areas 346, ,800 90,100 26% San Mateo 264, ,300 93,800 36% PDAs and Growth Opportunity Areas 87, ,700 75,300 86% Santa Clara 613, , ,900 41% PDAs and Growth Opportunity Areas 78, , , % Solano 148, ,800 39,600 27% PDAs and Growth Opportunity Areas 4,100 26,600 22, % Sonoma 188, ,400 42,900 23% PDAs and Growth Opportunity Areas 25,200 55,500 30, % Regionwide 2,669,800 3,572, ,600 34% PDAs and Growth Opportunity Areas 742,800 1,377, ,800 85% Initial Vision Scenario Page 44
49 Alameda County Nestled between the hills of the Diablo Range to the east and the San Francisco Bay to the west, Alameda County attracts residents and businesses because of its central location, diverse economy, unique communities, and natural beauty. Alameda County has long been a hub of economic activity. Starting in the late 1880s, the railroads and seaport in Oakland drew manufacturing and industry that spread to other waterfront cities, including Berkeley, Alameda, Emeryville, San Leandro, and Hayward. More jobs brought more residents, and new neighborhoods soon developed along major transportation routes, including rail and streetcar lines. The cities grew as construction of bridges, highways, and transit services enabled efficient access to San Francisco and the emerging job centers in Silicon Valley and the Peninsula. As cars became prevalent and roadways expanded, growth reached outward. The communities of Dublin, Pleasanton, Livermore, and Fremont developed rapidly during the 1960s and 1970s. During the late 20 th century, Alameda County residents became concerned about the rate at which growth was consuming open space. The hillsides, ridgelines, ranchlands, and waterfront that helped define the county s sense of place were threatened. A desire to protect these natural resources prompted a shift toward more compact development. County voters approved Measure D in 2000 establishing a county-wide urban growth boundary and preventing the subdivision of ranchland. Salt ponds along the bay were transformed into a national wildlife refuge. The county also identified 19 Priority Conservation Areas, which included key wildlife habitats, scenic resources, trails and recreational areas. Protecting these spaces will ensure that visitors can continue to appreciate the dramatic views of the hills and bay and enjoy access to trails that provide an important connection to the natural environment. The Initial Vision Scenario foresees Alameda County by 2035 as a network of compact downtowns, mixed-use neighborhoods, and employment centers connected by high-quality transit service, including rail lines and buses. Directing new homes and jobs into neighborhoods along major transportation corridors will help it remain one of the drivers of the Bay Area economy. Downtown Oakland will be a vibrant regional center and the primary job center in the East Bay. It will have residential buildings, high-rise offices, and regional- and local-serving retail clustered around the 12 th Street and 19 th Street BART stations. The transit network will connect downtown to other job-rich neighborhoods, including West Oakland, Fruitvale/Dimond and the MacArthur Transit Village. Other transit-served locations will also be county job centers, including the Emeryville, Fremont, and Berkeley city centers, as well as the Hacienda Business Park in Pleasanton. Transit improvements, such as the extension of BART to Silicon Valley, will give county residents even greater access to job opportunities, and help attract new businesses. The Port of Oakland will remain one of the West Coast s busiest. Other industrial hubs that were at the heart of Alameda County s early growth will have been modernized. Areas such as West Berkeley, Emeryville, West Oakland, and Warm Springs in Fremont already are home to new light industries and services, especially in the clean-tech sector, which includes renewable energy, green building, and other sustainable industries. This trend is expected to continue. Other areas that no longer support industrial functions, such as Alameda Point, the Dumbarton in Initial Vision Scenario Page 45
50 Newark, and the Cannery neighborhood in Hayward, will have transitioned to transit town centers and transit neighborhoods that include a mix of residential, retail, and employment uses. By 2035, transit corridors, such as San Pablo Avenue in the north, Fremont Boulevard in the south, and the Telegraph Avenue-International Boulevard-Mission Boulevard corridor that extends from Berkeley to Union City, will provide essential connections among the city centers, transit town centers, urban neighborhoods, and transit neighborhoods that have experienced significant growth over the past several decades. Travel along these corridors will be fast and efficient. Bus Rapid Transit and local buses will offer links to BART, Altamont Commuter Express (ACE), and Amtrak Capitol Corridor train stations, providing flexible options for people to get around. The Ohlone Greenway, East Bay Greenway, Iron Horse Trail, and other trails will provide safe and enjoyable routes for bicyclists and pedestrians. Three- to six-story residential buildings along these mixed-use corridors will provide affordable housing choices for people of all ages and incomes, with stores, services, offices, parks, and public facilities clustered at key intersections and transit stops. These nodes will serve the daily needs of people living in nearby apartments, condominiums, and townhomes, as well as residents of surrounding lower-density neighborhoods. The inviting streetscapes and pedestrian scale will make it easy and safe for transit users, pedestrians, and bicyclists to shop locally or travel to other destinations along the corridor. In the Tri-Valley, access to regional transit, such as BART and ACE, will have spurred higherdensity development near the rail stations. Places that were once dominated by automobiles will have become pedestrian-oriented districts with a variety of housing choices and easy access to stores and services. Downtown Livermore residents will be able to walk to catch a show, see a movie, or dine out. In Pleasanton, Hacienda Business Park will redevelop as a mixed-use center. In nearby Dublin the downtown, Transit Center, and Town Center will have become focal points for community life. Initial Vision Scenario Page 46


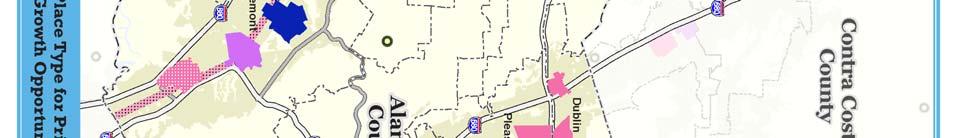

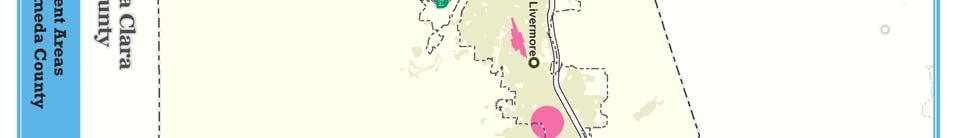

51 Map 3.1: Alameda County Place Types for Priority Development Areas and Growth Opportunity Areas Initial Vision Scenario Page 47
52 Table 3.2: Alameda County Initial Vision Scenario Household Growth for Priority Development Areas and Growth Opportunity Areas by Jurisdiction Alameda County Households Jurisdiction or Area Name Place Type Growth % Change Alameda 31,774 39,873 8, % Naval Air Station (PDA) Transit Town Center 761 4,851 4, % Northern Waterfront (GOA) Transit Neighborhood 322 1, % Albany 7,150 9,317 2, % San Pablo Avenue & Solano Avenue Mixed-Use Corridor 474 1,732 1, % (GOA) Berkeley 46,146 61,876 15, % Adeline Street (PDA) Mixed-Use Corridor 465 1, % Downtown (PDA) City Center 1,894 6,772 4, % San Pablo Avenue (PDA) Mixed-Use Corridor 798 4,081 3, % South Shattuck (PDA) Mixed-Use Corridor % Telegraph Avenue (PDA) Mixed-Use Corridor 444 1,816 1, % University Avenue (PDA) Mixed-Use Corridor 987 3,120 2, % Dublin 15,572 32,216 16, % Downtown Specific Plan Area (PDA) Suburban Center 413 2,156 1, % Town Center (PDA) Suburban Center 4,052 6,672 2,620 65% Transit Center (PDA) Suburban Center 543 2,541 1, % Emeryville 5,770 13,260 7, % Mixed-Use Core (PDA) City Center 3,583 10,849 7, % Fremont 71,004 98,564 27, % Centerville (PDA) Transit Neighborhood 4,611 6,000 1,389 30% City Center (PDA) City Center 6,305 8,569 2,264 36% Irvington District (PDA) Transit Town Center 4,313 6,200 1,887 44% Ardenwood Business Park (GOA) Employment Center % Fremont Boulevard & Warm Springs Boulevard Corridor (GOA) Mixed-Use Corridor 6,076 8,119 2,043 34% Fremont Boulevard Decoto Road Mixed-Use Corridor % Crossing (GOA) South Fremont/Warm Springs (GOA) Suburban Center % Hayward 46,300 61,283 14, % Downtown (PDA) City Center 2,031 4,945 2, % South Hayward BART (PDA) Mixed-Use Corridor 745 1, % South Hayward BART (PDA) Urban Neighborhood 1,491 3,360 1, % The Cannery (PDA) Transit Neighborhood % Carlos Bee Quarry (GOA) Mixed-Use Corridor % Mission Corridor (GOA) Mixed-Use Corridor 474 1, % continued on next page Key: PDA Priority Development Area, GOA Growth Opportunity Area Initial Vision Scenario Page 48
53 Alameda County (continued) Households Jurisdiction or Area Name Place Type Growth % Change Livermore 28,662 40,801 12, % Downtown (PDA) Suburban Center 695 3,485 2, % Vasco Road TOD (PDA) Suburban Center % Newark 13,530 19,331 5, % Dumbarton Transit Oriented Transit Town Center 9 2,910 2, % Development (PDA) Old Town Mixed Use Area (PDA) Transit Neighborhood 283 1,474 1, % Cedar Boulevard Transit (GOA) Transit Neighborhood % Civic Center Re-Use Transit (GOA) Transit Neighborhood % Oakland 160, ,019 65, % Coliseum BART Station Area (PDA) Transit Town Center 2,903 6,913 4, % Downtown & Jack London Square Regional Center 8,054 25,146 17, % (PDA) Eastmont Town Center (PDA) Urban Neighborhood 3,877 6,113 2,236 58% Fruitvale & Dimond Areas (PDA) Urban Neighborhood 11,926 19,068 7,142 60% MacArthur Transit Village (PDA) Urban Neighborhood 8,100 12,302 4,202 52% Transit Oriented Development Mixed-Use Corridor 60,360 78,945 18,585 31% Corridors (PDA) West Oakland (PDA) Transit Town Center 8,905 17,147 8,242 93% Piedmont 3,810 3, % Pleasanton 24,034 33,819 9, % Hacienda (PDA) Suburban Center 1,402 5,264 3, % San Leandro 31,647 40,447 8, % Bay Fair BART Transit Village (PDA) Transit Town Center 504 1,552 1, % Downtown Transit Oriented City Center 3,630 6,494 2,864 79% Development (PDA) East 14th Street (PDA) Mixed-Use Corridor 1,597 5,329 3, % Union City 20,420 25,900 5, % Intermodal Station District (PDA) City Center 601 2,723 2, % Mission Boulevard (GOA) Mixed-Use Corridor % Old Alvarado (GOA) Mixed-Use Corridor % Alameda County Unincorporated 51,265 63,872 12, % Castro Valley BART (GOA) Transit Neighborhood 1,294 1, % East 14th Street and Mission Boulevard Mixed Use Corridor (GOA) Mixed-Use Corridor 5,782 6,982 1,200 21% Key: PDA Priority Development Area, GOA Growth Opportunity Area Initial Vision Scenario Page 49
54 Contra Costa County Named opposite coast for its location across the bay from San Francisco and Marin County, Contra Costa County has grown to be one of the most populous areas in our region. Home to Mount Diablo, the second-tallest peak in the Bay Area, Contra Costa s natural beauty and strategic location between the San Francisco bay and Central Valley has long attracted residents and businesses. Early industrial activity sprouted up along the county s extensive shoreline on the bay and Sacramento-San Joaquin River Delta. After World War II agricultural communities in central Contra Costa became rail depots serving surrounding farm lands. Post-war, auto-oriented growth continued through the end of the 20 th century pushing development eastward. Over one-third of Contra Costa County s most recent population explosion took place in East County. Concern about the effects of uncontrolled growth on mobility, open space, jobs, economic development, and quality of life came to a head in That s when county leaders, residents, and other stakeholders came together to develop Shaping Our Future, a vision and implementation strategy to guide future growth and development. The resulting Principles of Agreement - including growth management, land use and transportation connections, open space protection, infill investment, social equity, and economic development - has provided a framework to guide growth into a more sustainable development pattern. The Initial Vision Scenario projects a continued emphasis on sustainable development. It envisions focused growth between now and 2035 in existing urban centers, built upon the extensive transit network that includes BART and Amtrak rail service, Bus Rapid Transit, ferry service, and local and sub-regional buses. Though the county will be the third most populous in the region, concentrated growth within this linked network will enhance communities quality of life, while helping to protect significant open spaces, including Lamorinda (Lafayette, Moraga, Orinda) area ridgelines, coastal wetlands, agricultural areas, and the Los Medanos Hills. Many of these natural resources have been included in the 15 Priority Conservation Areas identified in the county. In West County, the San Pablo Avenue Corridor will take on a significant portion of the county s housing growth, reinforcing this area s urban character. As one of the East Bay s major thoroughfares, connecting city centers, employment centers, transit neighborhoods, and transit town centers in El Cerrito, Richmond, San Pablo, Pinole, and Hercules, this mixed-use corridor is unique in size and scope. The Initial Vision Scenario foresees a linear community space offering residents parks, recreation, walkable retail and entertainment destinations and equitable housing choices. Richmond is expected to add the most households and will surpass Concord as Contra Costa s largest city. High-density residential and commercial nodes at the three BART stations in El Cerrito and Richmond, and new Bus Rapid Transit service along San Pablo Avenue will have transformed this historically auto-dominated environment into a multipurpose, sustainable, healthy, and livable corridor. The city of Concord will remain a major employment hub. By 2035, the Concord Naval Weapons Station will have been transformed into a high-density employment-focused regional Initial Vision Scenario Page 50
55 center anchored by the North Concord BART station. This center will be connected to lowerdensity transit neighborhoods through a network of new local transit, walkable streets, and biking corridors. This new community will provide a dynamic place to live, work and play while sustaining the quality of life. New mixed-use development within and surrounding the downtown will enhance the existing community by enriching the urban core. Walnut Creek and Pleasant Hill will continue to be engines of economic activity, with mid-rise commercial and residential development clustered around the BART stations. The nearby Martinez and Lamorinda transit town centers and transit neighborhoods will retain their smalltown characteristics, with an increased mix of uses, including the addition of more housing, and a more pedestrian- and bicycle-friendly environment. In the Tri-Valley region, San Ramon will remain a suburban center with a high concentration of employment balanced by new housing and retail. By 2035 a new pattern of suburban development will have emerged in East County. The extension of BART to Pittsburg and Antioch will have fostered new growth, primarily within a more compact, transit-oriented configuration around existing downtowns. These suburban centers and transit town centers will provide a variety of transportation options that will improve access within East County and to regional centers throughout the Bay Area. New homes, stores, civic institutions, and community gathering places will transform the quality of life. Initial Vision Scenario Page 51


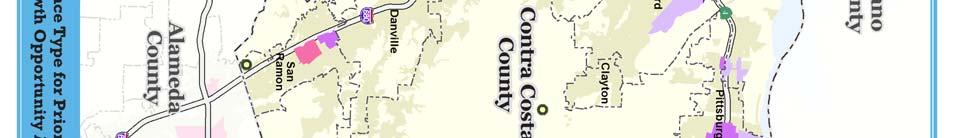
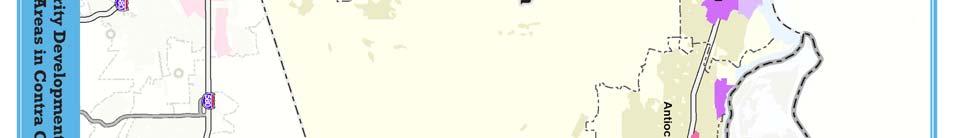
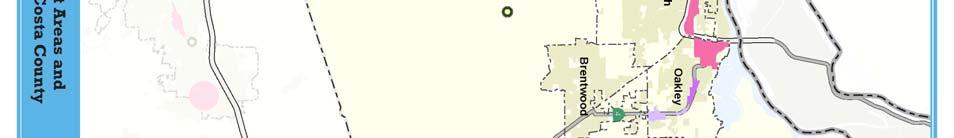

56 Map 3.2: Contra Costa County Place Types for Priority Development Areas and Growth Opportunity Areas Initial Vision Scenario Page 52
57 Table 3.3: Contra Costa County Initial Vision Scenario Household Growth for Priority Development Areas and Growth Opportunity Areas by Jurisdiction Contra Costa County Households Jurisdiction or Area Name Place Type Growth % Change Antioch 32,668 46,365 13, % Hillcrest ebart Station (PDA) Suburban Center 1 4,852 4, % Rivertown Waterfront (PDA) Transit Town Center 1,705 4,458 2, % Brentwood 18,250 24,284 6, % Clayton 3,966 4, % Concord 46,296 65,624 19, % Community Reuse Area (PDA) Regional Center 46 4,147 4, % Community Reuse Area (PDA) Transit Neighborhood 99 7,713 7, % Downtown BART Station Planning Area City Center 1,980 6,400 4, % (GOA) North Concord BART Adjacent Employment Center % Employment Center (GOA) West Downtown Planning Area (GOA) Mixed-Use Corridor NA Danville 16,574 17,920 1, % El Cerrito 10,422 20,905 10, % San Pablo Avenue Corridor (PDA) Mixed-Use Corridor 1,020 10,670 9, % Hercules 8,361 17,431 9, % Central Hercules (PDA) Transit Neighborhood 0 4,561 4,561 NA Waterfront District (PDA) Transit Town Center 174 2,853 2, % Lafayette 9,589 11,068 1, % Downtown (PDA) Transit Town Center 1,596 2,601 1,005 63% Martinez 14,769 16,156 1, % Downtown (PDA) Transit Neighborhood 417 1,679 1, % Moraga 5,811 6,995 1, % Moraga Center (PDA) Transit Town Center % Oakley 10,835 17,508 6, % Downtown (PDA) Transit Town Center 741 1,892 1, % Employment Area (PDA) Suburban Center 384 1, % Potential Planning Area (PDA) Transit Neighborhood 424 1,653 1, % Orinda 6,868 8,788 1, % Downtown (PDA) Transit Town Center 154 1,459 1, % Pinole 7,336 12,623 5, % Appian Way Corridor (PDA) Suburban Center 680 1,704 1, % Old Town (PDA) Transit Town Center 951 4,417 3, % Pittsburg 20,849 36,261 15, % Downtown (PDA) Transit Neighborhood 1,540 3,492 1, % Pittsburg/Bay Point BART Station (PDA) Transit Town Center 0 2,434 2,434 NA Railroad Avenue ebart Station (PDA) Transit Town Center 4,459 7,612 3,153 71% Pleasant Hill 15,247 17,861 2, % Buskirk Avenue Corridor (PDA) Mixed-Use Corridor 1,450 2, % Diablo Valley College (PDA) Transit Neighborhood 488 1,703 1, % continued on next page Initial Vision Scenario Page 53
58 Contra Costa County (continued) Households Jurisdiction or Area Name Place Type Growth % Change Richmond 37,897 63,439 25, % Central Richmond (PDA) City Center 485 7,859 7, % South Richmond (PDA) Transit Neighborhood 3,880 6,860 2,980 77% 23rd Street (GOA) Mixed-Use Corridor 332 1, % San Pablo Avenue Corridor (GOA) Mixed-Use Corridor 653 2,057 1, % San Pablo 9,975 13,027 3, % San Ramon 22,061 36,682 14, % City Center (PDA) Suburban Center 388 4,042 3, % North Camino Ramon (PDA) Transit Town Center 51 1,513 1, % Walnut Creek 33,890 40,244 6, % West Downtown (PDA) Suburban Center 1,266 7,077 5, % Contra Costa County Unincorporated 61,016 69,382 8, % Contra Costa Centre (PDA) Mixed-Use Corridor 2,674 3, % Downtown El Sobrante (PDA) Mixed-Use Corridor 574 2,033 1, % North Richmond (PDA) Transit Neighborhood 1,154 3,485 2, % Pittsburg/Bay Point BART Station (PDA) Transit Neighborhood 710 4,540 3, % West Contra Costa Transportation Advisory Committee: San Pablo Avenue Corridor (PDA) 5,727 19,335 13, % Key: PDA Priority Development Area, GOA Growth Opportunity Area Initial Vision Scenario Page 54
59 Marin County Located north of San Francisco across the Golden Gate Bridge, Marin County offers a retreat for urban dwellers. Marin is recognized for its natural and agricultural landscapes, which support local farming and ranching, tourism, recreation, wildlife habitat, and water supply. In fact, more than 50 percent of the county is protected open space, including renowned national treasures such as Muir Woods and Point Reyes National Seashore. The Marin Agricultural Land Trust and the Marin County Department of Parks and Open Space have worked for decades to protect and preserve the county s iconic landscape. Marin s Priority Conservation Areas encompass a variety of natural resources, including agricultural land, wildlife habitat, and world-class scenery. Marin has worked hard to maintain the rural character of its western reaches and bay lands through city-centered growth policies and focused development along the urbanized U.S. Route 101 highway corridor. Golden Gate Transit bus service offers connections throughout the county and to surrounding areas, including San Francisco, Richmond, and Sonoma County. Ferry terminals in Sausalito, Tiburon, and Larkspur also connect residents to jobs in San Francisco. In the Initial Vision Scenario, Marin County in 2035 will have the same urban fabric, but existing communities will be more walkable and bikable, and they will support more transit infrastructure and services. The large number of seniors expected to live in Marin County will be able to choose homes in city or town centers with easy access to the amenities they depend on. A more diverse housing stock and expanded public transit will increase choices for people of all ages and backgrounds. Transit neighborhoods will be connected along the U.S. 101 Corridor by frequent bus service to local and regional centers. Many will have transitioned away from outdated shopping centers toward more sustainable mixed-use neighborhoods. Transit-oriented growth will include the introduction of planned Sonoma-Marin Area Rail Transit (SMART) stations in Larkspur, San Rafael, and Novato. Downtown San Rafael will be a vibrant city center and transit hub in Marin County, where residents and employees can take advantage of SMART rail service as well as buses. The Civic Center and North San Rafael area will be a transit town center focused around the SMART station. San Quentin will be a transit town center with connections to the commuter rail station and ferry terminal in Larkspur. These enhanced connections will help alleviate traffic congestion along U.S. 101 and local roads. Initial Vision Scenario Page 55


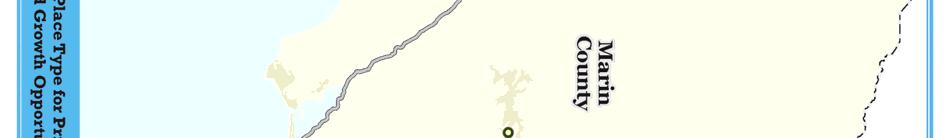
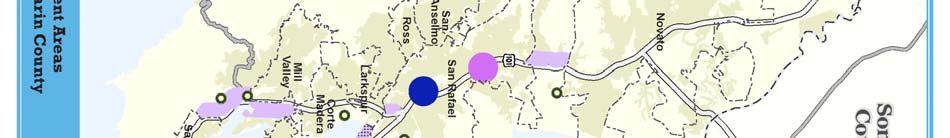

60 Map 3.3: Marin County Place Types for Priority Development Areas and Growth Opportunity Areas Initial Vision Scenario Page 56
61 Table 3.4: Marin County Initial Vision Scenario Household Growth for Priority Development Areas and Growth Opportunity Areas by Jurisdiction Marin County Households Jurisdiction or Area Name Place Type Growth % Change Belvedere % Corte Madera 3,948 4, % Fairfax 3,301 3, % Larkspur 8,036 8, % Mill Valley 6,267 6, % Novato 20,375 21, % Ross % San Anselmo 5,310 5, % San Rafael 23,164 28,209 5, % Civic Center/North Rafael Town Center (PDA) Transit Town Center % Downtown (PDA) City Center 2,223 5,824 3, % Sausalito 4,310 4, % Tiburon 3,844 4, % Marin County Unincorporated 26,162 28,900 2, % Urbanized 101 Corridor (PDA) Transit Neighborhood 2,046 2, % San Quentin (GOA) Transit Neighborhood 80 1,597 1, % Key: PDA: Priority Development Area GOA: Growth Opportunity Area Initial Vision Scenario Page 57
62 Napa County Napa County is internationally acclaimed for its winemaking, and the picturesque Napa Valley wine region is a major draw for San Francisco Bay Area visitors. The valley is bounded by mountains, and the Napa River empties into San Pablo Bay through the narrow Mare Island Strait. Napa County has strong policies to prioritize agricultural uses and to protect farmlands, watersheds, and open space. Consequently, more than 90 percent of unincorporated county falls within those designations. Ten Priority Conservation Areas encompass old-growth redwoods, watersheds, trails, and agricultural areas. Napa County residents and local governments farsighted thinking has protected natural resources, increased the amount of cropland, and supported city-centered growth. Most nonagricultural development is clustered in the four cities and one town connected by Highway 29, which parallels the Napa River in the western part of the county. In the Initial Vision Scenario Napa County will remain the Bay Area s most rural county. Its winemaking, agriculture, and recreation areas will continue to support tourism. The Land Trust of Napa County and Napa County Regional Park and Open Space District will have conserved more land and provided additional recreational opportunities. An area targeted for additional sustainable growth is the Highway 29 Priority Development Area. American Canyon will become the gateway to Napa County from Highway 29, and it will have transitioned from an auto-centric environment to a more pedestrian- and bicycle-friendly mixeduse corridor. Frequent regional and local bus service and an improved bicycle network will increase mobility throughout the county. The city of Napa will continue to be the largest population center, and it will be connected to other regional centers by efficient bus service. People will be able to shop, stroll by the Napa River, and enjoy other downtown amenities. Buses or a wine train will enable exploration of other destinations. Initial Vision Scenario Page 58


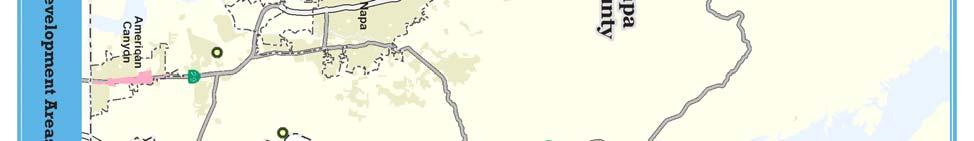
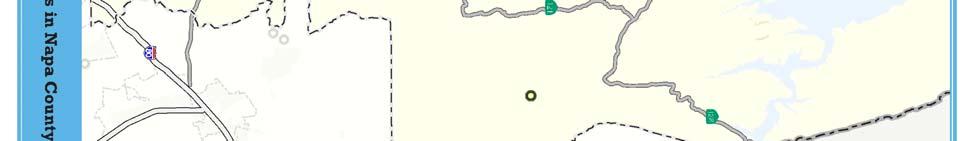
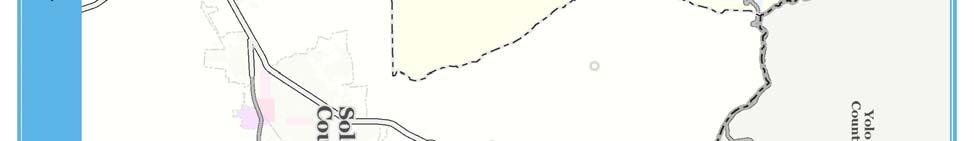
63 Map 3.4: Napa County Priority Development Area Place Type Initial Vision Scenario Page 59
64 Table 3.5: Napa County Initial Vision Scenario Household Growth for Priority Development Areas by Jurisdiction Napa County Households Jurisdiction or Area Name Place Type Growth % Change American Canyon 5,761 7,392 1, % Highway 29 Corridor (PDA) Mixed-Use Corridor 264 1,895 1, % Calistoga 2,140 2, % Napa 29,440 32,019 2, % St. Helena 2,440 2, % Yountville 1,110 1, % Napa County Unincorporated 10,370 10, % Key: PDA: Priority Development Area GOA: Growth Opportunity Area Initial Vision Scenario Page 60
65 San Francisco City and County Uniquely a city and county, San Francisco is one of California s largest cities and home to many historic landmarks. San Francisco city grew rapidly during the Gold Rush in the mid-1800s and became an international center of commerce. Its large port facilitated high volumes of domestic and oversees trade, and during World Wars I and II, its military installations grew to peak levels. Like many port cities, the convergence of various cultures resulted in a diverse population. Over time the city has emerged as a financial and cultural center, as well as a major tourist destination. As the city is surrounded on three sides by water, San Francisco has the highest residential and commercial densities in the region. It is one of the Bay Area s largest employment hubs, drawing nearly a quarter-million commuters each day, many of whom travel within, to and from the city using the region s most extensive public transit system. Although it is the most urbanized county in the Bay Area, with more than 90 percent of its acreage developed, San Francisco is home to some of the region s largest urban open spaces, and it has an extensive neighborhood parks system. Five Priority Conservation Areas identified within the city represent critical linkages in this open space network. In the Initial Vision Scenario, San Francisco by 2035 will have seen a great increase in new residents, businesses, and jobs. Its unique neighborhoods will have become even more distinct, finely-scaled and walkable. Downtown will continue to grow as a regional center, accommodating new and growing businesses that serve the local and global economies. There will be many more high-rise residential buildings, transforming the financial district into a mixed-use neighborhood with shops, services, and amenities that cater to residents, employees, and visitors. The new Transbay Center will be home to 2,600 new households, a 5.4-acre rooftop park, and the Transit Tower, the tallest building on the West Coast. This hub will anchor a new mixed-use neighborhood in the South of Market area. Urban neighborhoods in the southeastern part of the city, such as Hunter s Point and Candlestick Park, will be transformed by new homes, shops, and offices, as well as more parks and increased connections to the waterfront. Other urban neighborhoods, such as the Mission, SoMa, Chinatown, and Market & Octavia, will retain their existing character, but with a greater mix of features that can be accessed easily on foot, bicycle, or public transit. Small-scale infill buildings will have sprung up close to transit lines, especially in transit town centers, such as 19 th Avenue and along the Mission-San Jose mixed-use corridor. The Presidio, Golden Gate Park, Mount Sutro, Twin Peaks, McLaren Park, Bayview Park, and Candlestick Point will be connected by a remarkable open space corridor. This green space will connect neighborhoods form a scenic route for bicyclists and pedestrians. Many major streets also will have been greened, resulting in new pocket parks, outdoor seating, community gardens, and communal plazas. San Francisco s transit network will include more reliable, frequent Muni lines and increased ferry service, as well as new transit services, including several bus rapid transit routes. The Transbay Center will be a hub for high speed trains to Los Angeles and other points in California, and it will connect BART, Caltrain, and Muni Metro service. Initial Vision Scenario Page 61


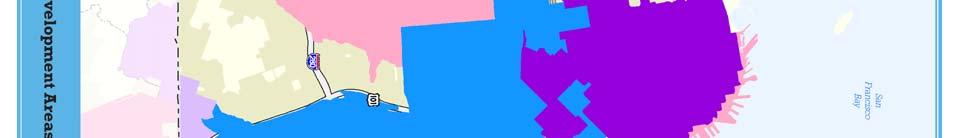


66 Map 3.5: San Francisco City and County Place Types for Priority Development Areas Initial Vision Scenario Page 62
67 Table 3.6: San Francisco City and County Initial Vision Scenario Household Growth for Priority Development Areas and Growth Opportunity Areas San Francisco County Households Jurisdiction or Area Name Place Type Growth % Change San Francisco 346, ,794 90, % 19th Avenue (PDA) Transit Town Center 5,795 8,015 2,220 38% Balboa Park (PDA) Transit Neighborhood 1,461 3,286 1, % Bayview/Hunters Point Urban Neighborhood 10,036 21,265 11, % Shipyard/ Candlestick Point (PDA) Downtown-Van Ness-Geary Regional Center 89, ,031 19,056 21% (PDA) Eastern Neighborhoods (PDA) Urban Neighborhood 29,030 34,386 5,356 18% Market & Octavia (PDA) Urban Neighborhood 10,932 16,605 5,672 52% Mission Bay (PDA) Urban Neighborhood 365 5,997 5, % Mission-San Jose Corridor Mixed-Use Corridor 29,088 30,611 1,523 5% (PDA) Port of San Francisco (PDA) Mixed-Use Corridor 611 2,904 2, % San Francisco/San Mateo Bi- Transit Neighborhood 1,569 8,127 6, % County Area (with City of Brisbane) (PDA) Transbay Terminal (PDA) Regional Center 509 4,637 4, % Treasure Island (PDA) Transit Town Center 460 7,704 7, % Citywide (GOA) 166, ,225 17,376 10% Key: PDA: Priority Development Area GOA: Growth Opportunity Area Initial Vision Scenario Page 63
68 San Mateo County For many decades, residents and businesses have been attracted to San Mateo County because of its strategic location between San Francisco and Silicon Valley, along the waterfront of San Francisco Bay. The Coast Range divides the county into two distinct parts: the bayside and coast. Ninety percent of development in the county is located on the bayside. Historically, the bayside communities developed as a series of railroad suburbs along the Caltrain line that runs parallel to El Camino Real the first automobile route through the Peninsula. In contrast, the coast is primarily agricultural, although some residential and office development has appeared in recent years. The seven Priority Conservation Areas in the county are located primarily on the coast side of the hills, and include areas with scenic vistas, agricultural uses, and the habitat of several endangered and threatened species. The downtowns of many of the county s cities, including South San Francisco, San Bruno, Millbrae, Burlingame, San Mateo, Belmont, San Carlos, Redwood City, and Menlo Park, are clustered near a Caltrain station, often encompassing or bordering El Camino Real. San Mateo County residents also have access to BART through stations at Daly City, Colma, South San Francisco, San Bruno, San Francisco International Airport, and Millbrae. These downtown areas and transit-served neighborhoods have been the primary focus for growth in San Mateo County. Local governments along El Camino Real are working together to transform the corridor from an auto-oriented commercial strip into a grand boulevard that includes a mix of homes, stores, parks, and services, and links the transit town centers and city center nodes along its length. The downtown and transit corridor plans passed by nearly every city in past decades help to promote unique, interesting places, each with its own distinct sense of community. These cities achievements have protected watershed lands, upper creek headwaters, coastal areas and scenic ridges from encroaching development preserving natural resources for the region. With its central location, transit spine, job centers, and strong downtown areas and schools, San Mateo County will continue to be an important place in the region for sustainable development. In the Initial Vision Scenario, in 2035, El Camino Real will have achieved its potential as a place for residents to work, live, shop, and play. 2 It will be a mixed-use corridor with mid-rise homes and townhouses that connects city centers, transit neighborhoods, and transit town centers to employment centers along the corridor and in San Francisco and Silicon Valley. Outdated strip malls will have been replaced with well-designed buildings on either side of the corridor that provide new homes and workplaces, as well as shops and restaurants that create an exciting street life. With new trees and improved sidewalks and crossings, El Camino will be safe for walking and bicycling. Pedestrian routes that cross the railroad tracks and U.S. 101 will make it possible for more people to bike and walk to work or school. Seniors will be able to find homes in the city downtowns, with easy access to parks, libraries, and restaurants. An electrified Caltrain will provide more frequent service, with renovated stations that are the focal point for bustling downtowns. Other strategic transit investments, such as new Bus Rapid 2 Grand Boulevard Vision Statement Initial Vision Scenario Page 64
69 Transit routes, expanded bus and ferry service, and high-speed rail stations will make it easy to travel within the county and to reach employment centers throughout the Bay Area. New homes and residents in transit-served areas will keep town centers growing and vibrant, with a wealth of new cultural activities and resources. San Mateo and Redwood City will be the largest city centers, anchoring the largest concentration of jobs and housing in the County. East of the Grand Boulevard, Brisbane and Daly City will create a multi-centered urban area with San Francisco around the Bayshore Caltrain station and Geneva Avenue. The concentration of growth in these bayside communities will have reduced growth pressures on the coast, allowing agricultural areas and seaside towns to thrive. Initial Vision Scenario Page 65


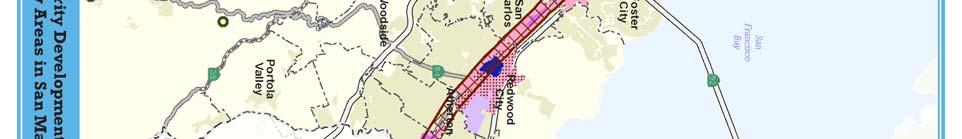
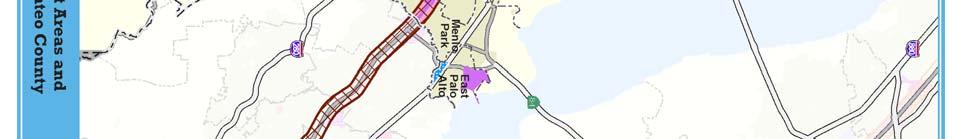
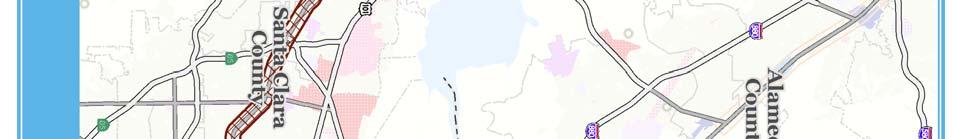
70 Map 3.6: San Mateo County Place Types for Priority Development Areas and Growth Opportunity Areas Initial Vision Scenario Page 66
71 Table 3.7: San Mateo County Initial Vision Scenario Household Growth for Priority Development Areas and Growth Opportunity Areas by Jurisdiction San Mateo County Households Jurisdiction or Area Name Place Type Growth % Change Atherton 2,490 2, % Belmont 10,740 12,759 2, % Brisbane 1,730 5,324 3, % San Francisco/San Mateo Bi- Suburban Center 24 3,208 3, % County Area (with San Francisco) (PDA) Burlingame 13,247 19,431 6, % Burlingame El Camino Real Transit Town Center 6,790 11,477 4,687 69% (PDA) Colma 460 1, % Daly City 31,261 43,095 11, % Bayshore (PDA) Transit Town Center 1,254 3,317 2, % Mission Boulevard (PDA) Mixed-Use Corridor 1,500 2,543 1,043 70% Citywide (GOA) 28,041 34,019 5,978 21% East Palo Alto 7,780 12,310 4, % Ravenswood (PDA) Transit Town Center 1,149 4,155 3, % Woodland/Willow Urban Neighborhood 1,833 2, % Neighborhood (GOA) Foster City 12,210 13,767 1, % Half Moon Bay 4,440 4, % Hillsborough 3,837 4, % Menlo Park 12,432 17,563 5, % El Camino Real Corridor and Downtown (PDA) Transit Town Center 279 3,258 2, % Millbrae 8,308 12,910 4, % Transit Station Area (PDA) Mixed-Use Corridor 176 2,473 2, % Pacifica 14,320 14, % Portola Valley 1,730 1, % Redwood City 29,620 41,032 11, % Downtown (PDA) City Center 786 6,139 5, % Broadway (GOA) Mixed-Use Corridor 1,962 2, % Middlefield (GOA) Mixed-Use Corridor 2,370 2, % Mixed Use Waterfront (GOA) Mixed-Use Corridor 876 1,916 1, % Veterans Corridor (GOA) Mixed-Use Corridor 308 1, % San Bruno 15,262 21,699 6, % Transit Corridors (PDA) Mixed-Use Corridor 3,458 7,556 4, % San Carlos 11,909 15,707 3, % Railroad Corridor (PDA) Transit Town Center 1,022 3,194 2, % San Mateo 38,643 56,678 18, % Downtown (PDA) City Center 482 2,111 1, % El Camino Real (PDA) Mixed-Use Corridor 23 1,605 1, % Rail Corridor (PDA) Transit Neighborhood 23 6,124 6, % Key: PDA Priority Development Area GOA Growth Opportunity Area Initial Vision Scenario Page 67
72 San Mateo County (continued) Households Jurisdiction or Area Name Place Type Growth % Change South San Francisco 20,288 30,522 10, % Downtown (PDA) Transit Town Center 1,449 5,920 4, % Lindenville Transit Transit Neighborhood NA Neighborhood (GOA) Woodside 2,029 2, % San Mateo County 21,780 23,830 2, % Unincorporated City County Association of Governments of San Mateo County: El Camino Real (PDA) 38,091 73,495 35,403 93% PDA: Priority Development Area GOA: Growth Opportunity Area Initial Vision Scenario Page 68
73 Santa Clara County Santa Clara County developed as a fertile agricultural region, and fruit processing grew into a major local industry and remained vital to the economy throughout the 1940s and 1950s. Through the 1970s and 1980s, aerospace and electronics manufacturing replaced the orchards and packing plants. Santa Clara County has since emerged as the birthplace and now global capital of the high-technology revolution, and is synonymous with Silicon Valley. Today, with over 1.8 million residents and 900,000 jobs, Santa Clara County is the most populous and jobrich county in the San Francisco Bay Area. The communities within Santa Clara County represent the full spectrum of urban to rural places found around the Bay Area. From San Jose, with downtown high-rises surrounded by a string of transit-served neighborhoods with village centers, to historic downtown Gilroy and everything in between each of these communities reflects a different history and character even as they grow and change. The cities and county have been coordinating together to manage Santa Clara County s explosive growth for over 40 years. County policies have required that development of land for urban uses occurs within cities, and that each city define an urban service area. Over the past decade, there has been an increased emphasis on transit-supportive land use planning and infrastructure improvements. Many communities in the county have promoted a more compact growth pattern through General Plan updates, while other planning efforts have focused on Caltrain and future BART stations, downtowns, and the El Camino Real corridor. These policies have helped Santa Clara County maintain vital agricultural and habitat lands in the southern portion of the county and in the Santa Cruz Mountains and the Diablo Range that frame Santa Clara Valley. Many of the 18 Priority Conservation Areas identified in the county encompass key wildlife areas in the foothills. In the Initial Vision Scenario, Santa Clara County in 2035 shows the dramatic results of community efforts to channel much of the future growth in the region into existing downtowns, major mixed-use transit corridors, and town and neighborhood centers. Existing neighborhoods will retain their existing character, while providing residents with new opportunities, access, and destinations. These areas will have become thriving communities for the next generation of entrepreneurs, keeping Silicon Valley at the epicenter of global innovation. They will also be attractive places for an increasing number of older residents, allowing them to stay active and independent while remaining in their community. At the same time, the hills will remain largely undeveloped, providing a stunning backdrop from the Valley floor. Regional transit service along an electrified Caltrain corridor, the BART to Silicon Valley corridor, and the ACE and Amtrak Capitol Corridor rail lines will provide quick, convenient access to destinations throughout the region. Shuttle and bus service, along with bicycle and pedestrian routes, will provide direct access from regional transit to the major employment centers in the county. San Jose is expected to add the most households and jobs of any jurisdiction in the region between 2010 and It will remain a regional center, and the heart of Silicon Valley. Growth Initial Vision Scenario Page 69
74 in the city will be focused in the downtown and in North San Jose. San Jose s Diridon Station will be the regional portal for those entering Silicon Valley on the California High Speed Rail system. North San Jose will be home to both major employers along the First Street corridor and a string of nearby residential communities and amenities. A large residential community in downtown San Jose will support a diverse array of evening shopping and entertainment destinations. Improvements to the light rail system and new jobs in downtown and North San Jose will have steadily increased the share of south San Jose transit commuters. Areas around the stations along the BART to Silicon Valley extension, such as the Milpitas Transit Area, will have grown into vibrant residential communities with a mix of neighborhoodserving retail, parks, services, and other amenities. The transit town centers around the Caltrain stations in Gilroy and Morgan Hill will both be vibrant downtown communities that house new residents and also serve the surrounding neighborhoods and visitors with a rich array of shops and events. Central Campbell will continue to grow as an attractive destination for area residents, along with the revitalized Winchester Boulevard corridor. Areas devoted solely to low-intensity office and industrial uses, such as Moffett Field/NASA Ames and North Bayshore in Mountain View, will have been transformed into pedestrian- and bicycle-friendly districts with a mix of homes, stores, and parks as well as additional offices. From Palo Alto to San Jose, and including Los Altos, Mountain View, Sunnyvale, and Santa Clara, the El Camino Real corridor in Santa Clara County will have transformed into a truly grand boulevard, with quick, reliable bus service and improved bicycle and pedestrian connections linking numerous residential, office, and retail nodes along the entire route. New residents along the corridor will have easy access to Silicon Valley jobs, while Caltrain and light rail will link the major Silicon Valley employers to region-wide commuters. Initial Vision Scenario Page 70


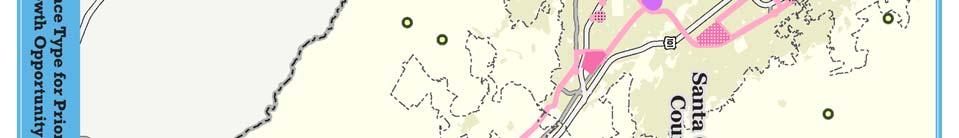
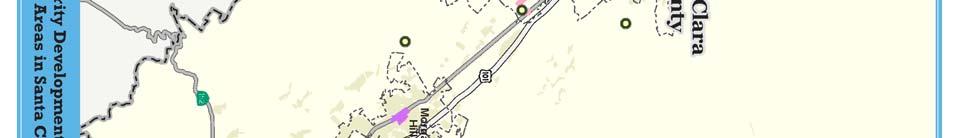

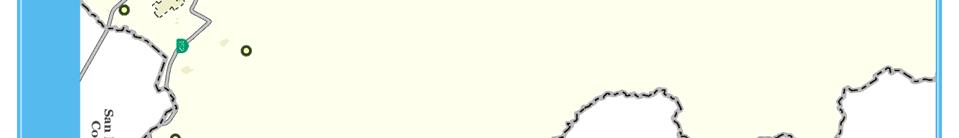
75 Map 3.7: Santa Clara County Place Types for Priority Development Areas and Growth Opportunity Areas Initial Vision Scenario Page 71
76 Table 3.8: Santa Clara County Initial Vision Scenario Household Growth for Priority Development Areas and Growth Opportunity Areas by Jurisdiction Santa Clara County Households Jurisdiction or Area Name Place Type Growth % Change Campbell 16,892 21,002 4, % Central Redevelopment Area (PDA) Transit 965 2,909 1, % Neighborhood Winchester Boulevard Master Plan (GOA) Transit % Neighborhood Cupertino 19,830 21,588 1, % Gilroy 14,330 22,118 7, % Downtown (PDA) Transit Town Center 235 2,911 2, % Los Altos 10,670 11,968 1, % El Camino Real Corridor (GOA) Mixed-Use Corridor % Los Altos Hills 3,053 3, % Los Gatos 12,430 13, % Milpitas 19,030 38,758 19, % Transit Area (PDA) Suburban Center 454 7,563 7, % Hammond Transit Neighborhood (GOA) Transit % Neighborhood McCandless Transit Neighborhood (GOA) Transit % Neighborhood McCarthy Ranch Employment Center (GOA) Employment Center NA Midtown Mixed-Use Corridor (GOA) Mixed-Use Corridor % Serra Center Mixed-Use Corridor (GOA) Mixed-Use Corridor NA Tasman Employment Center (GOA) Employment Center NA Town Center Mixed-Use Corridor (GOA) Mixed-Use Corridor NA Yosemite Employment Center (GOA) Employment Center NA Monte Sereno 1,229 1, % Morgan Hill 12,399 20,040 7, % Downtown (PDA) Transit Town Center 195 2,911 2, % Mountain View 32,114 50,348 18, % Whisman Station (PDA) Transit 0 1,220 1,220 NA Neighborhood Downtown (GOA) Transit Town Center 1,359 2,544 1,185 87% East Whisman (GOA) Employment Center % El Camino Real Corridor (GOA) Mixed-Use Corridor 2,561 4,121 1,560 61% Moffett Field/NASA Ames (GOA) Suburban Center 166 2,283 2, % North Bayshore (GOA) Suburban Center 278 2,653 2, % San Antonio Center (GOA) Transit Town Center 1,470 2,732 1,262 86% Palo Alto 26,705 38,692 11, % Palo Alto: California Avenue (PDA) Transit 922 2,889 1, % Neighborhood Palo Alto: El Camino Real Corridor (GOA) Mixed-Use Corridor 4,272 6,116 1,845 43% Palo Alto: University Avenue/Downtown Transit Town Center 2,162 3,701 1,539 71% (GOA) continued on next page Initial Vision Scenario Page 72
77 Santa Clara County (continued) Households Jurisdiction or Area Name Place Type Growth % Change San Jose 305, , , % Berryessa Station (PDA) Transit 1,926 8,024 6, % Neighborhood Communications Hill (PDA) Transit Town Center 2,423 5,198 2, % Cottle Transit Village (PDA) Suburban Center 59 2,989 2, % Downtown "Frame" (PDA) City Center 5,799 24,458 18, % East Santa Clara/Alum Rock Corridor (PDA) Mixed-Use Corridor 2,306 6,396 4, % Greater Downtown (PDA) Regional Center 3,217 10,117 6, % North San Jose (PDA) Regional Center 9,488 42,128 32, % West San Carlos and Southwest Expressway Mixed-Use Corridor 8,299 16,923 8, % Corridors (PDA) Bascom TOD Corridor (GOA) Mixed-Use Corridor 227 1,627 1, % Bascom Urban Village (GOA) Mixed-Use Corridor 1,089 1, % Blossom Hill/Snell Urban Village (GOA) Mixed-Use Corridor 519 1,619 1, % Camden Urban Village (GOA) Mixed-Use Corridor 346 1,346 1, % Capitol Corridor Urban Villages (GOA) Mixed-Use Corridor 3,692 9,892 6, % Capitol/Tully/King Urban Villages (GOA) Suburban Center 1,504 3,754 2, % Oakridge/Almaden Plaza Urban Village Suburban Center 2,302 9,802 7, % (GOA) Saratoga TOD Corridor (GOA) Mixed-Use Corridor 1,495 2,595 1,100 74% Stevens Creek TOD Corridor (GOA) Mixed-Use Corridor 1,066 4,966 3, % Westgate/El Paseo Urban Village (GOA) Suburban Center 559 3,059 2, % Winchester Boulevard TOD Corridor (GOA) Mixed-Use Corridor 2,026 4,026 2,000 99% Santa Clara 43,403 67,672 24, % Central Expressway Focus Area (GOA) City Center 0 4,000 4,000 NA El Camino Real Focus Area (GOA) Mixed-Use Corridor 1,305 2, % Great America Parkway Focus Area (GOA) Urban 0 3,400 3,400 NA Neighborhood Lawrence Station Focus Area (GOA) Transit 0 6,194 6,194 NA Neighborhood Santa Clara Station Focus Area (GOA) City Center 167 3,502 3, % Tasman East Focus Area (GOA) Transit 0 1,805 1,805 NA Neighborhood Saratoga 11,000 11, % continued on next page Initial Vision Scenario Page 73
78 Santa Clara County (continued) Households Jurisdiction or Area Name Place Type Growth % Change Sunnyvale 54,170 73,425 19, % Downtown & Caltrain Station (PDA) Transit Town Center 1,353 5,321 3, % El Camino Real Corridor (PDA) Mixed-Use Corridor 9,466 14,680 5,214 55% Lawrence Station Transit Village (PDA) Transit 1,465 2, % Neighborhood East Sunnyvale ITR (GOA) Mixed-Use Corridor % Moffett Park (GOA) Employment Center NA Peery Park (GOA) Employment Center NA Reamwood Light Rail Station (GOA) Employment Center NA Tasman Station ITR (GOA) Mixed-Use Corridor % Santa Clara County Unincorporated 31,604 37,991 6, % Valley Transportation Authority: Cores, Corridors, and Station Areas (estimate) (PDA) 72, , , % Key: PDA Priority Development Area, GOA Growth Opportunity Area Initial Vision Scenario Page 74
79 Solano County Solano County has the distinction of containing nearly half the San Francisco Bay Area s important farmland and more than half the region s wetlands, according to the State Farmland Mapping and Monitoring Program. The Sacramento River flows along the southeastern portion of Solano County emptying into the Sacramento-San Joaquin River Delta, the largest estuary on the U.S. s West Coast, and into the Suisun Bay. Solano County s historical growth was in part attributable to military bases Travis Air Force Base and Mare Island Naval Shipyard. The county s location between the metropolitan centers of San Francisco and Sacramento and its lower land prices relative to other parts of the Bay Area made it an attractive place for increased housing development in response to the demand for lower cost housing in the region. Although this housing growth created competition to agricultural uses, residents and local governments in the Solano County value agricultural land protection and have adopted policies to ensure that agriculture remains. Solano County s Orderly Growth Initiative, adopted in 1994, encourages city-centered growth and supports the agricultural economy. This policy has focused jobs and commercial areas in and near the county s major urban areas. Vallejo continues its efforts to enhance their waterfront and downtown, and Fairfield, the county seat, has made strides to make the West Texas Street corridor a walkable and bikeable stretch with improved streetscape enhancements. Five Priority Conservation Areas have been identified to encourage protection of important natural resources such as the Blue Ridge Hills, Western Hills, and the greenbelt between Vacaville and Fairfield. As a result of these sustainability policies, the county remains predominantly rural, with valuable grazing and crop lands encompassing more than half of the land in Solano County. In the Initial Vision Scenario for Solano County, communities in 2035 will continue to have striking views of the bay and agricultural landscapes. These natural assets surround the county s cities, which have been redeveloped into thriving centers that are easily accessible by public transportation and filled with places to walk and bike. The cities of Vallejo, Fairfield, and Vacaville will remain the most populous. Vallejo s downtown and waterfront will be a great place to take in the beauty of the bay or explore the historic city center before or after catching a ferry to San Francisco. Residents of Fairfield who need to commute to Sacramento or to another Bay Area job destination on the Capitol Corridor train will be able to live in downtown and walk across a pedestrian bridge into Suisun City to the Fairfield/Suisun train station or in the new transit town center around the Fairfield/Vacaville train station, which will have a mix of housing types and retail services with scenic views of the area s striking landscape. Vacaville s downtown will retain its historic character with improved amenities for walking and biking. Overall, communities in Solano County will have improved transit connections within their jurisdictions, between jurisdictions, and to regional centers, allowing residents to access a variety of services, jobs, and entertainment. Initial Vision Scenario Page 75


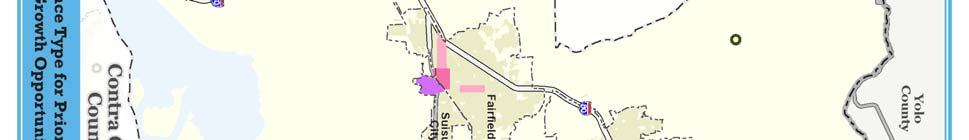
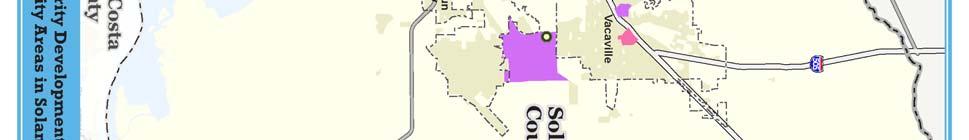
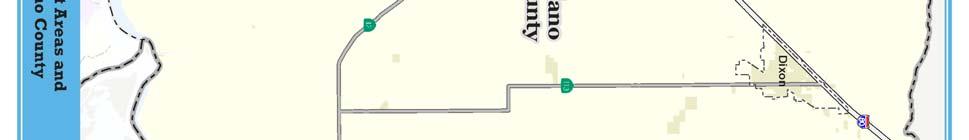

80 Map 3.8: Solano County Place Types for Priority Development Areas and Growth Opportunity Areas Initial Vision Scenario Page 76
81 Table 3.9: Solano County Initial Vision Scenario Household Growth for Priority Development Areas and Growth Opportunity Areas by Jurisdiction Solano County Households Jurisdiction or Area Name Place Type Growth % Change Benicia 11,329 13,527 2, % Downtown (PDA) Transit Neighborhood 570 1, % Northern Gateway (GOA) Suburban Center NA Dixon 5,617 8,222 2, % Fairfield 36,061 52,476 16, % Downtown South (Jefferson Street) (PDA) Suburban Center 142 3,669 3, % Fairfield-Vacaville Train Station (PDA) Transit Town Center 10 6,595 6, % North Texas Street Core (PDA) Mixed-Use Corridor 49 1,810 1, % West Texas Street Gateway (PDA) Mixed-Use Corridor 259 2,784 2, % Rio Vista 3,540 4,737 1, % Suisun City 9,132 10,548 1, % Downtown & Waterfront (PDA) Transit Town Center 1,146 2,278 1,133 99% Vacaville 32,620 41,775 9, % Allison Area (PDA) Suburban Center % Downtown (PDA) Transit Town Center 169 4,172 4, % Vallejo 42,043 47,814 5, % Waterfront & Downtown (PDA) Suburban Center 1,200 2,215 1,015 85% Solano County Unincorporated 7,817 8, % Key: PDA Priority Development Area, GOA Growth Opportunity Area Initial Vision Scenario Page 77
82 Sonoma County Sonoma County is the largest, northernmost county in the San Francisco Bay Area and contains some of the region s most valuable agricultural land. The county has a diverse landscape that encompasses redwood forests and oak woodlands, rivers, wetlands and baylands, vineyards, grasslands, and small farms. Many of these resource areas are included as part of one of the county s 15 Priority Conservation Areas. Urban development in Sonoma County is concentrated within cities along the U.S. 101 corridor, which has been supported by voter-approved urban growth boundaries and other policies that encourage separation between cities and scenic landscapes to maintain the county s rural character and economy. The existing bus service in the county will be enhanced by the introduction of Sonoma-Marin Area Rail Transit (SMART). The stations planned in Cloverdale, Healdsburg, Windsor, Santa Rosa, Rohnert Park, Cotati, and Petaluma will provide improved connections among the cities in the county and to employment opportunities in San Francisco. In the Initial Vision Scenario for Sonoma County, by 2035, the area s agricultural economy and resource lands will be thriving as a result of voter-approved sales taxes to fund the Sonoma County Agricultural Preservation and Open Space District s purchase of conservation and agricultural easements. Cities and towns in Sonoma County will have filled in while retaining their character, providing great places to live and work with access to daily needs within walking distance or an easy bike or transit ride. Downtown Santa Rosa is expected to take on significant population and employment growth, and will continue to be the major city center in the North Bay. This area will connect to Santa Rosa s historic railroad square area, which will have a thriving farmer s market for people to access local foods. Residents will have an easy commute on the rail line, bus line, or regional bicycle path. North of this station in Santa Rosa will be a new suburban center, where the improvements residents identified for the area will connect them to the mall and other key destinations. Santa Rosa residents and visitors will also be able to get to and from these stations through a bus rapid transit system along Sebastopol Road, an east-west mixed-use corridor, and Mendocino Avenue/Santa Rosa Avenue, a north-south mixed-use corridor. The cities and towns north and south of Santa Rosa will have retained their community character and have improved transit, bicycle, and pedestrian connections. Commuters and tourists will be able to hop on the rail line and take it to Cloverdale s transit town center, which will provide an impressive greenway connection between its downtown and the station. Similar to Windsor s town green where residents and visitors can gather, Rohnert Park will have a suburban center at Sonoma Mountain Village, a star example of sustainability principles for the Bay Area and the world. People will be able to enjoy downtown Petaluma s historic character as they walk around taking in the amenities offered and the beauty of the Petaluma River. Sonoma County s rural and suburban areas will have become more complete communities with services and amenities within walking distance. The Airport and Larkfield Urban Service Area will be a suburban center with a mix of residences and other services. Within the Sonoma Valley Urban Service Area, The Springs will be a rural mixed-use corridor where residents can safely Initial Vision Scenario Page 78
83 navigate Highway 12 and where traffic will have been reduced given the level of bus service through the area, and the Eighth Street Industrial Area will be an employment center with major industrial redevelopment to serve agricultural processing in the area, better transit service, and bicycle and pedestrian improvements. The Penngrove Urban Service Area will have become a rural town center, with better transit service, bicycle and pedestrian improvements, and increased retail and service uses. Initial Vision Scenario Page 79


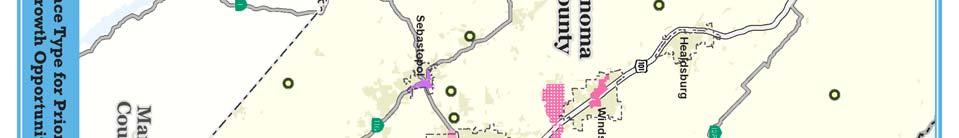
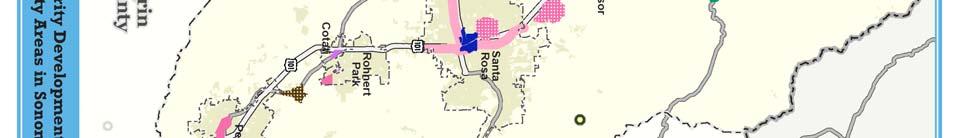

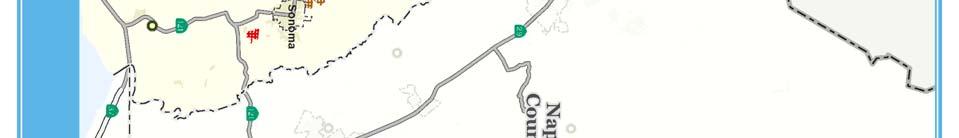
84 Map 3.9: Sonoma County Place Types for Priority Development Areas and Growth Opportunity Areas Initial Vision Scenario Page 80
Honorable Mayor and Members of the City Council. Submitted by: Dan Marks, Director, Planning and Development
 Office of the City Manager To: From: Honorable Mayor and Members of the City Council Phil Kamlarz, City Manager Submitted by: Dan Marks, Director, Planning and Development Subject: EXECUTIVE SUMMARY Senate
Building Consensus for Focused Growth San Francisco Bay Area. Greenbelts: Local Solutions for Global Challenges Conference March 23, 2011
 Building Consensus for Focused Growth San Francisco Bay Area Greenbelts: Local Solutions for Global Challenges Conference March 23, 2011 The Big Picture Priority Development Areas Priority Conservation
SCS Scenario Planning
 E SCS Scenario Planning Introduction As part of the 2035 MTP/SCS process, AMBAG developed a series of land use and transportation alternative scenarios for evaluation and testing to demonstrate how the
SUSTAINABLE COMMUNITIES STRATEGY
 SUSTAINABLE COMMUNITIES STRATEGY Introduction With each RTP update cycle, BCAG prepares a Sustainable Communities Strategy (SCS) as required under Senate Bill 375 (SB 375). The SCS demonstrates the integration
CHAPTER ONE a vision for tomorrow
 1 CHAPTER ONE a vision for tomorrow Transportation is the backbone of our economy and the connector of our communities. It binds together our daily activities and is a key input to our quality of life.
Summary of transportation-related goals and objectives from existing regional plans
 SMTC 2050 Long Range Transportation Plan Appendix A: Summary of transportation-related goals and objectives from existing regional plans SMTC 2050 Long Range Transportation Plan Summary of transportation-related
Chapter 5. Congestion Management Program. Chapter 5
 Chapter 5 Congestion Management Program Chapter 5 67 Chapter 5 Congestion Management Program Enacted in the early 1990s, California s Congestion Management Program (CMP) statutes encourage local jurisdictions
- FACT SHEET - THE GUIDING PRINCIPLES
 THE GUIDING PRINCIPLES The General Plan begins with seven ideas that together create a vision for the City s future. When the City approved the General Plan in 1994, these idea were dubbed the Seven Guiding
CITY OF EMERYVILLE MEMORANDUM. Sustainable Communities Strategy Initial Vision Scenario
 CITY OF EMERYVILLE MEMORANDUM DATE: April 5, 2011 TO: FROM: SUBJECT: Patrick D. O Keeffe, City Manager Planning and Building Department Sustainable Communities Strategy Initial Vision Scenario RECOMMENDATION/REQUESTED
Why a Regional Plan?
 Why a Regional Plan? Population Growth in the Golden State California grows by 300,000 500,000 people each year due mostly to new births and longer lifespans 700,000 600,000 500,000 400,000 300,000 200,000
Memorandum. FROM: Jim Ortbal Rosalynn Hughey Barry Ng TO: HONORABLE MAYOR, CITY COUNCIL. DATE: June 16, 2017
 CITY OF SANjOSE CAPITAL OF SILICON VALLEY TO: HONORABLE MAYOR, CITY COUNCIL SUBJECT: TRANSPORTATION POLICY UPDATE REQUIRED BY STATE LAW - LOS TO VMT Memorandum FROM: Jim Ortbal Rosalynn Hughey Barry Ng
City of Sunnyvale. General Plan Structure
 City of Sunnyvale General Plan Structure 1 What is a General Plan? Long-term land use, circulation, environmental, economic and social goals and policies Guides physical development of the City Foundation
SUBURBAN EDGE COMMUNITY ROLE COUNCIL ROLE ALL COMMUNITIES SUBURBAN EDGE
 Orderly and Efficient Land Use Align land use, development patterns, and infrastructure to make the best use of public and private investment. Plan and stage development for forecasted growth through 2040
REGIONAL PLANNING AND POLICY FRAMEWORK A Preferred Approach for our Regional Growth
 REGIONAL PLANNING AND POLICY FRAMEWORK A Preferred Approach for our Regional Growth The Regional Comprehensive Plan (RCP) establishes a new approach to planning in the San Diego region. This approach is
Chapter 4: Transportation and Land Use
 Chapter 4: Transportation and Land Use Transportation and land use together make possible the wide range of destination opportunities in the region. Transportation provides the connections, and, in turn,
Database and Travel Demand Model
 Database and Travel Demand Model 7 The CMP legislation requires every CMA, in consultation with the regional transportation planning agency (the Metropolitan Transportation Commission (MTC) in the Bay
AGENDA ITEM PLANNING COMMISSION MEETING DATE APRIL 13, 2017 BUSINESS ITEMS. FROM : Community Development Department Director
 AGENDA ITEM PLANNING COMMISSION MEETING DATE APRIL 13, 2017 BUSINESS ITEMS DATE : April 3, 2017 TO : Planning Commission FROM : Community Development Department Director SUBJECT : BENICIA INDUSTRIAL PARK
LAND USE POLICIES BY COMMUNITY DESIGNATION
 137 2040 138 Land Use Policies by Community Designation As discussed earlier in Thrive MSP 2040, the Council assigns a community designation to each city and township. This designation indicates the overall
4: Transportation and Land Use
 Chapter Figure 4-1: Recent development has brought more housing and mixed use Downtown Minneapolis - looking north from E 15th Street at the Grant Street / 11th Street exit 4: Transportation and Land Use
Alameda Countywide Transportation Plan Update Evaluation Outcomes
 TAWG Meeting 07/14/11 Attachment 06 Handout Alameda Countywide Transportation Plan Update Evaluation Outcomes presented to Technical Advisory Working Group presented by Cambridge Systematics, Inc. July
TRANSPORTATION AND LAND USE
 TRANSPORTATION AND LAND USE INTRODUCTION The 2020 and 2030 GHG projections estimate that transportation emissions in the unincorporated area will increase considerably in the next two decades. Minimizing
2040 LAND USE WORKBOOK February 2017
 040 LAND USE WORKBOOK February 017 S A/C INTRODUCTION SITE SPOTLIGHT: WATERFRONT Through a series of community workshops and online activities in 016, Stockton community members shared their vision for
This document has been developed to provide context to the Board as part of the strategic planning process. Regional development and travel trends
 1 This document has been developed to provide context to the Board as part of the strategic planning process. Regional development and travel trends and forecasts are provided, including population, employment,
Chapter 3 Stakeholder Interviews and Summary of Needs
 Chapter 3 Stakeholder Interviews and Summary of Needs 42 CHAPTER 3 STAKEHOLDER INTERVIEWS AND SUMMARY OF NEEDS CHAPTER 3. STAKEHOLDER INTERVIEWS AND SUMMARY OF NEEDS An extensive stakeholder interview
EXECUTIVE SUMMARY REGIONAL TRANSPORTATION PLAN 2050
 EXECUTIVE SUMMARY REGIONAL TRANSPORTATION PLAN 2050 Introduction Goals Policies, and Performance Measures Growth Forecast and Planned Land Use Development Key Recommendations i Executive Summary April
Growth in the Fresno Metro Area
 1 Growth in the Fresno Metro Area 2 A Unique Opportunity Meeting City and Regional Challenges SEGA 9,000 Acres 3 A Unique Planning Process Measuring Up to the Challenge Modeling the Impacts of Different
RURAL CENTER COMMUNITY ROLE COUNCIL ROLE RURAL CENTER ALL COMMUNITIES
 Orderly and Efficient Land Use Align land use, development patterns, and infrastructure to make the best use of public and private investment. Plan for forecasted population and household growth at overall
THE REGION S PLAN POLICY FRAMEWORK. August 2015
 THE REGION S PLAN POLICY FRAMEWORK August 2015 2 What is The Policy Framework? Cover photo credit: Sinan Sinharoy for Atlanta BeltLine, Inc. Atlanta is one of the world s most dynamic metropolitan areas,
CHAPTER HIGHLIGHTS GOALS AND GUIDING POLICIES 60 SEEKING PUBLIC INPUT TO REFINE SCENARIOS FOR OUR FUTURE 61
 04 CHAPTER HIGHLIGHTS GOALS AND GUIDING POLICIES 60 SEEKING PUBLIC INPUT TO REFINE SCENARIOS FOR OUR FUTURE 61 SCENARIOS FOR THE FUTURE: IT S OUR CHOICE 63 CREATING A PLAN FOR OUR FUTURE The RTP/SCS is
ENVISION BURLINGAME General Plan
 City of Burlingame ENVISION BURLINGAME General Plan Public Review Draft City Council Hearing Draft November 2018August 2017 ENVISION BURLINGAME Chapter I. Introduction THE BURLINGAME GENERAL PLAN articulates
GUIDING PRINCIPLES MEMORANDUM
 M E T R O P O L I TAN TRA NS P O RTATI O N PLAN GUIDING PRINCIPLES MEMORANDUM El Paso Metropolitan Planning Organization INTRODUCTION The guiding principles for development of the El Paso MPO s Destino
T BayArea. Irjah. To: MTC Planning Committee, ABAG Administrative Committee Date: April 6, Fr: Executive Director, MTC
 To: MTC Planning Committee, ABAG Administrative Committee Date: April 6, 2012 J:\COMMITTE\Planning Commitee\2012\April\4a_InvestmentstrategyMemo _Final.doc SH:SK June 2012 - Public hearings/workshops April
Transportation, Mobility and Access
 Transportation, Mobility and Access In The City of North Vancouver A Discussion Paper Prepared to Inform the Direction of a New Official Community Plan 2021 & Beyond Dragana Mitic Assistant City Engineer
Community Vision and Core Values DRAFT SEPTEMBER 2013
 Community Vision and Core Values DRAFT SEPTEMBER 2013 Introduction Plan Rapid City is the effort to update the Rapid City Comprehensive Plan, a long-range planning strategy that will provide a blueprint
SOUTHEAST FLORIDA REGIONAL COMPACT CLIMATE CHANGE. Sustainable Communities & Transportation Planning
 SOUTHEAST FLORIDA REGIONAL COMPACT CLIMATE CHANGE Draft Regional Climate Action Plan Sustainable Communities & Transportation Planning SP-1 Develop criteria in collaboration with municipal and county planning
MOBILITY 2045: A FOCUS ON TRANSPORTATION CHOICE:
 Mobility 2045: The Metropolitan Transportation Plan for North Central Texas is the defining vision for the multimodal transportation system in the Dallas- Fort Worth Metropolitan Planning Area. The plan,
CHAPTER 4 HIGHLIGHTS GOALS AND GUIDING POLICIES 64 SEEKING PUBLIC INPUT TO REFINE SCENARIOS FOR OUR FUTURE 66
 04 CHAPTER 4 HIGHLIGHTS GOALS AND GUIDING POLICIES 64 SEEKING PUBLIC INPUT TO REFINE SCENARIOS FOR OUR FUTURE 66 SCENARIOS FOR THE FUTURE: IT S OUR CHOICE 68 CREATING A PLAN FOR OUR FUTURE The RTP/SCS
Chapter 5 Transportation Draft
 Chapter 5 Transportation Draft Discussion Similar to the other elements in the Comprehensive Plan, the transportation element impacts the quality of life, economic development and public safety of the
Re: Item 5a: Proposed Regional Means-Based Transit Fare Program Framework. Dear Chair Josefowitz and Programming and Allocations Committee Members:
 April 10, 2018 Programming and Allocations Committee Metropolitan Transportation Commission 375 Beale St, Suite 800 San Francisco, CA 94105 Re: Item 5a: Proposed Regional Means-Based Transit Fare Program
BAY MEADOWS II TRAFFIC MANAGEMENT PLAN
 FINAL BAY MEADOWS II TRAFFIC MANAGEMENT PLAN Prepared For: WILSON MEANY Four Embarcadero Center, Suite 3330 San Francisco, CA 94111 Prepared By: Original: March 17, 2008 Updated: December 4, 2012 Revised
FACT SHEETS LOS ANGELES COUNTY
 FACT SHEETS LOS ANGELES COUNTY WHAT IS THE REGIONAL TRANSPORTATION PLAN/ SUSTAINABLE COMMUNITIES STRATEGY (RTP/SCS) Every four years the Southern California Association of Governments (SCAG) prepares a
RURAL RESIDENTIAL COMMUNITY ROLE COUNCIL ROLE RURAL RESIDENTIAL ALL COMMUNITIES
 Orderly and Efficient Land Use Align land use, development patterns, and infrastructure to make the best use of public and private investment. Discourage future development of rural residential patterns
San Francisco Freeway Corridor Management Study (FCMS) Phase 1 Report
 Phase 1 Report") San Francisco Freeway Corridor Management Study (FCMS) Phase 1 Report This Report summarizes the study s purpose and institutional setting; proposes a framework of Goals and Objectives for freeway corridor
San Francisco Freeway Corridor Management Study (FCMS) Phase 1 Report This Report summarizes the study s purpose and institutional setting; proposes a framework of Goals and Objectives for freeway corridor
SB 375: California s Grand Experiment in Regional and Intergovernmental Planning. American Planning Association April 16, 2012
 SB 375: California s Grand Experiment in Regional and Intergovernmental Planning American Planning Association April 16, 2012 Background on California Climate Legislation Pre-AB32 legislation State GHG
Proposed Performance Indicators for Thrive MSP 2040 For discussion at the December 19, 2012 Committee of the Whole meeting
 Proposed Performance Indicators for Thrive MSP 2040 For discussion at the December 19, 2012 Committee of the Whole meeting Why develop indicators for Thrive MSP 2040? Why measure performance? Broadly defined,
(Image of a moving Muni light rail vehicle in the Geneva Yard at night)
") (Page 1) Transportation Sustainability Program SFMTA Board of Directors February 2012 Partnership of the San Francisco County Transportation Authority, San Francisco Planning Department, San Francisco
(Page 1) Transportation Sustainability Program SFMTA Board of Directors February 2012 Partnership of the San Francisco County Transportation Authority, San Francisco Planning Department, San Francisco
FACT SHEETS SAN BERNARDINO COUNTY
 FACT SHEETS SAN BERNARDINO COUNTY WHAT IS THE REGIONAL TRANSPORTATION PLAN/ SUSTAINABLE COMMUNITIES STRATEGY (RTP/SCS) Every four years the Southern California Association of Governments (SCAG) prepares
BAAQMD CEQA Guidelines Update
 BAAQMD CEQA Guidelines Update Supervisor Lockyer Informational Workshop SCS & CEQA March 19, 2011 Henry Hilken Henry Hilken Director of Planning and Research Bay Area Air Quality Management District Why
Tri-County Regional Planning Commission 2045 Regional Metropolitan Transportation Plan Goals and Objectives Adopted March 22, 2017
 Tri-County Regional Planning Commission 2045 Regional Metropolitan Transportation Plan Goals and Objectives Adopted March 22, 2017 One of the initial steps in the development of the TCRPC 2045 Metropolitan
Transportation and Utilities
 4 Section 4 Transportation and Utilities 4.0 Introduction Transportation and utility systems are essential to accommodate and support development proposed in the Future Land Use Map. The following pages
DIVERSIFIED RURAL COMMUNITY ROLE COUNCIL ROLE DIVERSIFIED RURAL ALL COMMUNITIES
 Orderly and Efficient Land Use Align land use, development patterns, and infrastructure to make the best use of public and private investment. Plan for growth not to exceed forecasts and in patterns that
12 Evaluation of Alternatives
 12 Evaluation of Alternatives This chapter evaluates the effectiveness of the No-Build Alternative and the proposed METRO Blue Line Light Rail Transit (BLRT) Extension project based on the information
MTP VISIONS, GOALS, AND OBJECTIVES
 2 MTP VISIONS, GOALS, AND OBJECTIVES El Paso MPO 2045 Metropolitan Transportation Plan 2. GUIDING PRINCIPLES This chapter describes the process by which the vision and goals of the planning process were
REGIONAL VISION REGIONAL GOALS
 REGIONAL VISION Greater Kansas City is a region of opportunity. Its robust economy, healthy environment and social capacity support the creativity, diversity and resilience of its people, places and communities.
Introduction. CHAPTER 2: Introduction 13
 02 Introduction CHAPTER 2: Introduction 13 14 2018 Draft Regional Transportation Plan/Sustainable Communities Strategy 2 INTRODUCTION The Stanislaus Council of Government s 2018 Regional Transportation
SCENARIO PLANNING 12
 12 SCENARIO PLANNING Scenario planning represents the next generation of analytical processes created to evaluate the influence of development intensities and land use patterns on the efficiency of a proposed
Strategy for a Sustainable Region. Randy Rentschler MTC January 22, 2014
 Strategy for a Sustainable Region Randy Rentschler MTC January 22, 2014 Plan Bay Area 25-year long-range transportation plan Updated every four years Guides transportation policies and investments in
2. Guiding Principles, Objectives, and Policies
 2. Guiding Principles, Objectives, and Policies INTRODUCTION The guiding principles for the 2040 MTP Update establish the vision and key focus areas for this planning effort. They combine the guidance
APPENDIX A - PLANS AND POLICY REVIEW FEBRUARY 2017
 APPENDIX A - PLANS AND POLICY REVIEW FEBRUARY 2017 DENVERMOVES Transit Denver Moves: Transit APPENDIX A PLANS AND POLICY REVIEW 2035 Metro Vision Regional Transportation Plan (MVRTP) (2011) 2040 Fiscally
Chapter 5 - Transportation
 Chapter 5 - Transportation Discussion Similar to the other elements in the Comprehensive Plan, the transportation element impacts the quality of life, economic development and public safety of the residents
Lincoln - OFFICIAL PLAN PART 1 INTRODUCTION 1.1. THE COMMUNITY VISION
 Lincoln - OFFICIAL PLAN PART 1 INTRODUCTION 1.1. THE COMMUNITY VISION The vision for Lincoln is to be a Centre of Excellence for Agriculture; an inclusive community that values diversity, partnerships,
The Level of Service Metric and. Alternatives for Multi-Modal Transportation. in Oakland
 The Level of Service Metric and Alternatives for Multi-Modal Transportation in Oakland By Jill Nevins For the City of Oakland, Public Works Agency Mills College Public Policy Program May 2012 Executive
CHAPTER 2.0: INTRODUCTION
 CHAPTER 2.0: INTRODUCTION 2.1 INTRODUCTION The Federal Transit Administration (FTA) and the Santa Clara Valley Transportation Authority (VTA) have prepared this Environmental Impact Statement/Environmental
Transportation Master Plan Introduction
 1. Introduction Building a Liveable Ottawa 2031 has set out a process to guide the completion of a fiveyear update of the City s Official Plan, Transportation Master Plan, Infrastructure Master Plan, Cycling
Reducing Greenhouse Gases in Portland Metro through Integrated Transportation & Land Use
 Reducing Greenhouse Gases in Portland Metro through Integrated Transportation & Land Use Asilomar Session IV - Smart Growth and VMT Reduction Mike Hoglund, Metro Portland, OR August 31, 2011 1 Presentation
report final Decennial Model Update Executive Summary Contra Costa Transportation Authority Cambridge Systematics, Inc.
 final report prepared for Contra Costa Transportation Authority prepared by with Dowling Associates Caliper Corporation June 2003 Table of Contents 1.0 Introduction... ES-1 2.0 Data Development... ES-5
City of Charlottesville MEMO
 City of Charlottesville MEMO TO: City Council FROM: Missy Creasy, Planning Manager DATE: August 7, 2013 SUBJECT: A World Class City www.charlottesville.org 2013 Comprehensive Plan Outline of updates made
LARKSPUR SMART STATION AREA PLAN. Public Workshop December 3, 2013
 LARKSPUR SMART STATION AREA PLAN Public Workshop December 3, 2013 0 PURPOSE OF Provide information about the regional planning context for the Larkspur Station Area, including Plan Bay Area, SMART, and
Case Report HEARING DATE: MARCH 21, 2018
 Central SoMa Plan HEARING DATE: MARCH 21, 2018 Project Name: Central SoMa Plan Date: March 14, 2018 Record Number: 2011.1356MTZU Staff Contact: Steve Wertheim, Principal Planner, Citywide Planning (415)
SAN FRANCISCO MUNICIPAL TRANSPORTATION AGENCY
 THIS PRINT COVERS CALENDAR ITEM NO. : 11 DIVISION: Director of Transportation BRIEF DESCRIPTION: SAN FRANCISCO MUNICIPAL TRANSPORTATION AGENCY Adopt the new San Francisco Municipal Transportation Agency
NOTICE OF PREPARATION
 City of Ceres City of Hughson City of Modesto City of Newman City of Oakdale City of Patterson City of Riverbank City of Turlock City of Waterford County of Stanislaus Date: January 4, 2013 NOTICE OF PREPARATION
BAY MEADOWS II TRAFFIC MANAGEMENT PLAN
 FINAL BAY MEADOWS II TRAFFIC MANAGEMENT PLAN Prepared For: WILSON MEANY SULLIVAN Four Embarcadero Center, Suite 3330 San Francisco, CA 94111 Prepared By: TABLE OF CONTENTS Executive Summary...4 1 Introduction...7
CHAPTER 1. A New Transportation Plan
 Chapter 1. A New Transportation Plan 1 CHAPTER 1. A New Transportation Plan Why develop a new plan? The year 2005 marks 90 years since Anchorage emerged as a community serving as headquarters for railroad
METROPOLITAN BAKERSFIELD GENERAL PLAN UPDATE GREATER BAKERSFIELD CHAMBER OF COMMERCE
 METROPOLITAN BAKERSFIELD GENERAL PLAN UPDATE GREATER BAKERSFIELD CHAMBER OF COMMERCE JUNE 12, 2009 PURPOSE OF WORKSHOP MAJOR INFLUENCES PUBLIC OUTREACH REPORT EXISTING CONDITIONS REPORT SB 375/AB 32/AB
SECTION 5: ALTERNATIVES TO THE PROPOSED PROJECT
 SECTION 5: ALTERNATIVES TO THE PROPOSED PROJECT 5.1 - Introduction In accordance with CEQA Guidelines Section 15126.6, this Draft Subsequent Environmental Impact Report (DSEIR) contains a comparative impact
TRANSIT CENTER DISTRICT PLAN
 TRANSIT CENTER DISTRICT PLAN Public Workshop #2: Initial Findings and Proposals 04.30.2008 San Francisco Planning Department In partnership with: San Francisco Redevelopment Agency Transbay Joint Powers
URBAN CENTER COMMUNITY ROLE COUNCIL ROLE ALL COMMUNITIES URBAN CENTER
 Orderly and Efficient Land Use Align land use, development patterns, and infrastructure to make the best use of public and private investment. Plan for forecasted population and household growth at average
Executive Summary. Figure ES-1. Historical and Forecasted Regional Population and Employment
 Source: PSRC Executive Summary VISION 2050 is a shared and integrated strategy for how and where the central Puget Sound region should grow. Population in the region has grown to 4.1 million, with more
Dogpatch-Central Waterfront Transit Demand Study Planning Study Key Takeaways
 EXECUTIVE SUMMARY The purpose of this memo is to assist the SFMTA Transit Division with its final recommendation for replacement service of the existing 22-Fillmore bus service. It is informed by Planning
2018 STATE LEGISLATIVE PROGRAM
 2018 STATE LEGISLATIVE PROGRAM The California Transit Association s 2018 State Legislative Program is an integral part of making our vision a reality, and is part and parcel of our mission to further the
wheaton s future Wheaton s Role in the County
 wheaton s future Wheaton is envisioned as a major mixed-use center for the Georgia Avenue corridor and eastern Montgomery County. It will have regional shopping, culturally diverse retail and entertainment,
Category 3, BART Capacity, Access and Parking Improvements. Contra Costa Transportation Authority STAFF REPORT Page 2 of 5 The Authority directed staf
 Meeting Date: Subject Summary of Issues Recommendations Financial Implications Options Attachments Changes from Committee Development of a Potential Transportation Expenditure Plan (TEP) Review and Discussion
regional strategy Integrating Land Use And Transportation Strategies climate & energy How It Works:
 regional strategy Integrating Land Use And Transportation Strategies Purpose To help reduce green house gas emissions by aligning transportation plans with sustainable land use strategies through strategic
El Cerrito Draft Climate Action Plan Public Comment and Responses April 9, 2013
 El Cerrito Draft Climate Action Plan Public Comment and Responses April 9, 2013 Summary of Changes Made to the Climate Action Plan Based on public comment received during the public review period of February
Attachment 2: Draft Business Plan Scope of Work
 Attachment 2: Draft Business Plan Scope of Work Background: The following pages present a high level draft scope of work for the Caltrain Business Plan along with a description of outreach plans, project
Final Land Use and Development Opportunities Report 5.0 Environmental Impact/Environmental Consequences
 Figure 5-6. Century City 1/4-Mile Station Area August 16, 2010 Page 5-14 Figure 5-7. Wilshire/Westwood 1/4-Mile Station Area August 16, 2010 Page 5-15 Alternative 1 would be constructed underneath existing
The Role of Transportation Systems Management & Operations in Supporting Livability and Sustainability
 The Role of Transportation Systems Management & Operations in Supporting Livability and Sustainability Michael Grant, ICF International February 7, 2012 NTOC Webinar Highlights of FHWA/FTA Primer Background:
Appendix C: Scenarios and Future Drivers Impacting Transportation
 Prepared for Washington County Prepared by David Evans and Associates, Inc. 2100 SW River Parkway Portland, Oregon 97201 TABLE OF CONTENTS 1. INTRODUCTION... 2 2. SCENARIOS PLANNING OVERVIEW... 2 3. SCENARIOS
1: INTRODUCTION AND PROCESS OVERVIEW
 GPATS Long-Range Transportation Plan 1: INTRODUCTION AND PROCESS OVERVIEW INTRODUCTION affects everyone in many ways and plays a critical role in shaping a region s physical and social infrastructure.
Validating VMT Reductions From Transportation Measures
 Validating VMT Reductions From Transportation Measures Extended Abstract #52 Ian R. Peterson Environmental Planner Bay Area Air Quality Management District 939 Ellis Street San Francisco, CA 94109 Tien-Tien
Purpose of the Countywide Transportation Plan SAN FRANCISCO COUNTY TRANSPORTATION AUTHORITY
 > 12 Purpose of the Countywide Transportation Plan SAN FRANCISCO COUNTY TRANSPORTATION AUTHORITY 13 SAN FRANCISCO S MULTIMODAL transportation network is crucial to San Francisco s status as a major regional
Transportation and Land Use Planning Connectivity
 Chapter 3 Transportation and Land Use Planning Connectivity CHAPTER 3 Transportation and Land Use Planning Connectivity INTRODUCTION Transportation systems and services are provided in the context of both
CHAPTER 3 THE BUILDING BLOCKS POLICIES AND SUPPORTIVE STRATEGIES REGIONAL TRANSPORTATION PLAN/SUSTAINABLE COMMUNITIES STRATEGY
 CHAPTER 3 THE BUILDING BLOCKS POLICIES AND SUPPORTIVE STRATEGIES REGIONAL TRANSPORTATION PLAN/SUSTAINABLE COMMUNITIES STRATEGY CHAPTER 3 THE BUILDING BLOCKS POLICIES AND SUPPORTIVE STRATEGIES INTRODUCTION
Your Bright Future: Municipal Development Plan
 Your Bright Future: Municipal Development Plan 2010-2020 Executive Summary OVERVIEW Municipalities face many challenges and opportunities. Central to a municipality s ability to provide a high standard
SBCAG is a Joint Powers Authority (JPA) of the nine county jurisdictions, which provides a forum for solving regional problems
 of the nine county jurisdictions, which provides a forum for solving regional problems") SBCAG is a Joint Powers Authority (JPA) of the nine county jurisdictions, which provides a forum for solving regional problems The SBCAG region is coextensive with the County of Santa Barbara SBCAG fulfills
SBCAG is a Joint Powers Authority (JPA) of the nine county jurisdictions, which provides a forum for solving regional problems The SBCAG region is coextensive with the County of Santa Barbara SBCAG fulfills
Planning for Growth and Change. Elective Course March 7 th 2015
 Planning for Growth and Change Elective Course March 7 th 2015 Planning for Growth & Change Darren Todd - City Wide Policy & Integration Liliana Vargas - Transportation Planning Presentation Objectives
PERFORMANCE-BASED PLANNING AND PROGRAMMING
 February 2017 performance-based planning and programming Boston Region MPO PERFORMANCE-BASED PLANNING AND PROGRAMMING WHAT IS PERFORMANCE-BASED PLANNING AND PROGRAMMING? Performance-based planning and
MEETING: DATE: TYPE OF ACTION: STAFF CONTACT: PHONE: Recommend to Board. Final Action
 RESOLUTION NO. R2012-24 Transit-Oriented Development Policy MEETING: DATE: TYPE OF ACTION: STAFF CONTACT: PHONE: Executive Committee Board PROPOSED ACTION 12/06/2012 12/20/2012 Recommend to Board Final
Mobility and System Reliability Goal
 Mobility and System Reliability Goal Provide surface transportation infrastructure and services that will advance the efficient and reliable movement of people and goods throughout the state. Background:
A more detailed description of Transportation, and its programs and initiatives can be found at
 Business Plan 2018 21 Transportation Accountability Statement This business plan was prepared under my direction, taking into consideration our government s policy decisions as of March 7, 2018. original