Water Quality Monitoring:
|
|
|
- Franklin Norris
- 6 years ago
- Views:
Transcription

1 Water Quality Monitoring: Lesson Plan for Exploring Time Series Data Presenters: Janet Vail, Fallon Januska, Dirk Koopmans

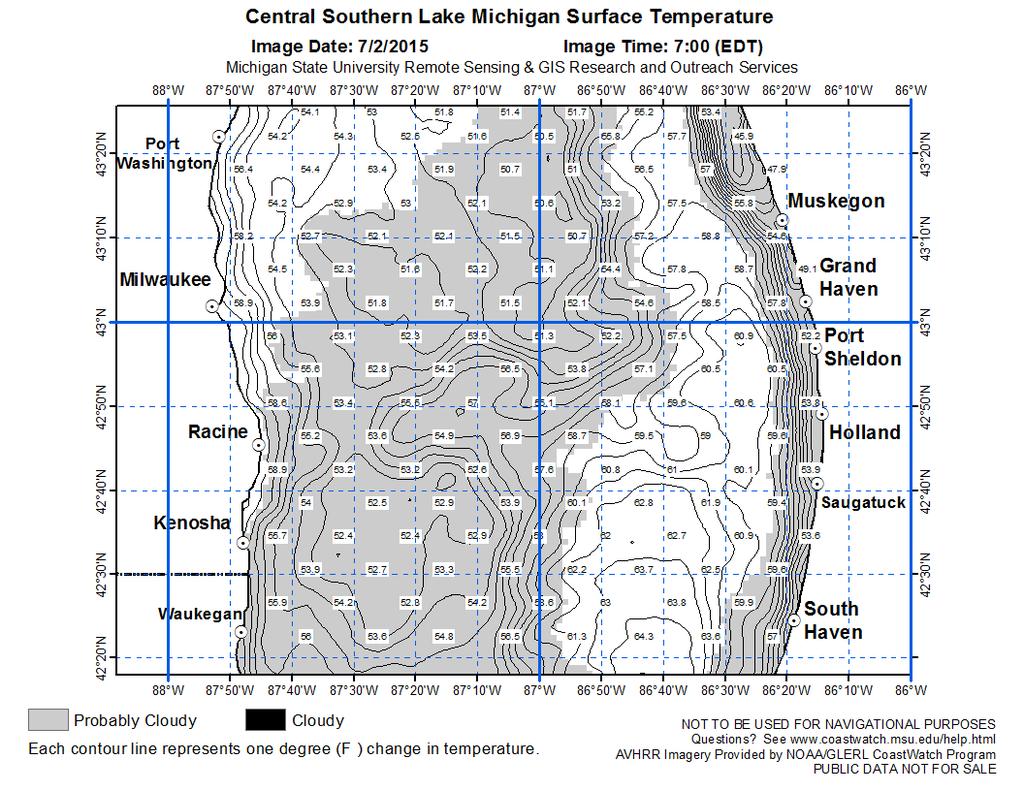
2 Lake Michigan Center in Muskegon, Michigan Home of Annis Water Resources Institute

3
4 What can time-series lake data tell us about seasonal ecosystem dynamics and upstream influences? Upon completion of this lesson, students will be able to Explain the advantages of using times-series data sets for water monitoring versus single (one time) measurements. Construct and interpret graphs of real-time environmental data. Formulate a question about water quality and select the appropriate data to answer the question. Explore patterns as well as cause and effect relationships.
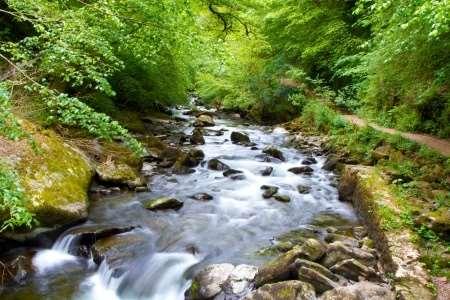
5 Engage
6 Engage

7 Lake Superior
8 Lake Erie
9 Water Quality Parameters Biological - Phytoplankton - Zooplankton - Benthic organisms - Detritus - Macrophytes - Fish* - Bacteria* Chemical - ph - Dissolved oxygen - Conductivity - Phosphorus* - Nitrogen* - Alkalinity* - Metals* - Organics* Physical - Depth - Water Clarity - Turbidity - Water Color - Bottom materials - Waves & Currents - Temperature
10 Table 1. Sources and associated pollutants U.S. EPA, 2015 Source Cropland Forestry harvest Grazing land Industrial discharge Mining Septic systems Sewage treatment plants Construction Urban runoff Common Associated Pollutants Turbidity, phosphorus, nitrates, temperature, total solids Turbidity, temperature, total solids Fecal bacteria, turbidity, phosphorus, nitrates, temperature Temperature, conductivity, total solids, toxics, ph ph, alkalinity, total dissolved solids Fecal bacteria (i.e., Escherichia coli), nitrates, phosphorus, dissolved oxygen/biochemical oxygen demand, conductivity, temperature Dissolved oxygen and biochemical oxygen demand, turbidity, conductivity, Phosphorus, nitrates, fecal bacteria, temperature, total solids, ph Turbidity, temperature, dissolved oxygen and biochemical oxygen demand, total solids, and toxics Turbidity, phosphorus, nitrates, temperature, conductivity, dissolved oxygen and biochemical oxygen demand


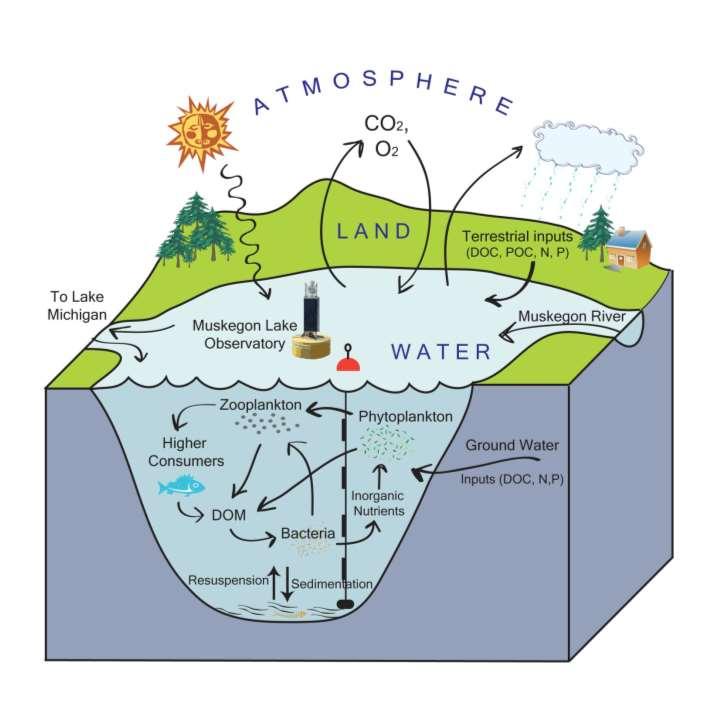
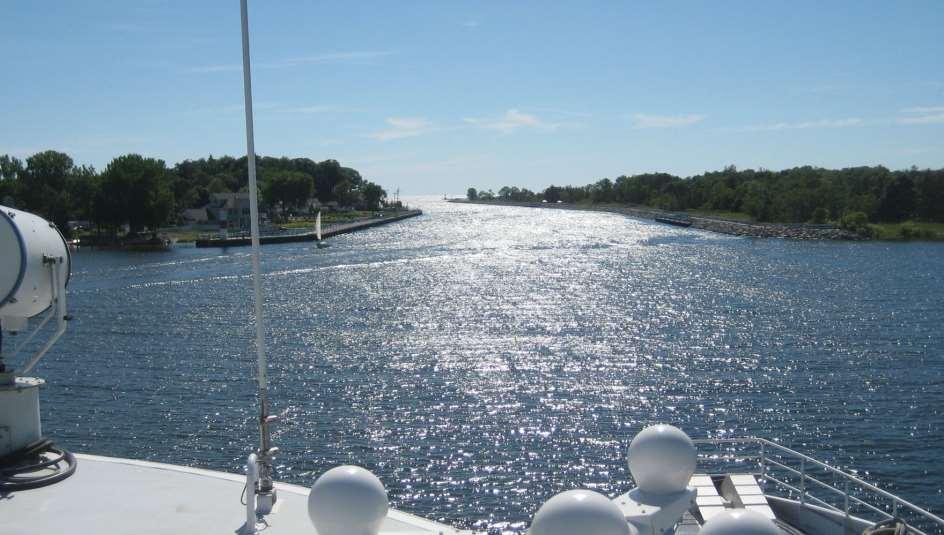
11 Explore About the Muskegon Lake Observatory

12 Location of the Muskegon Lake Observatory

13 Muskegon Lake Observatory Collects air/water data 4-12 times per hour Sends the data to GVSU computer, then to the internet

14 What s connected to the buoy?
15 What is being measured? Water sensors have measured over 13 parameters including temperature, oxygen, nutrients, light, ph, conductivity, algal pigments (chlorophyll), bacterial pigments (phycocyanin), and current speed and direction. Air sensors measured 8 parameters including temperature, wind, humidity, and precipitation.

16 Temperature Oxygen Light Nutrients Turbidity Algae Wind Rain Water speed Sensors
17
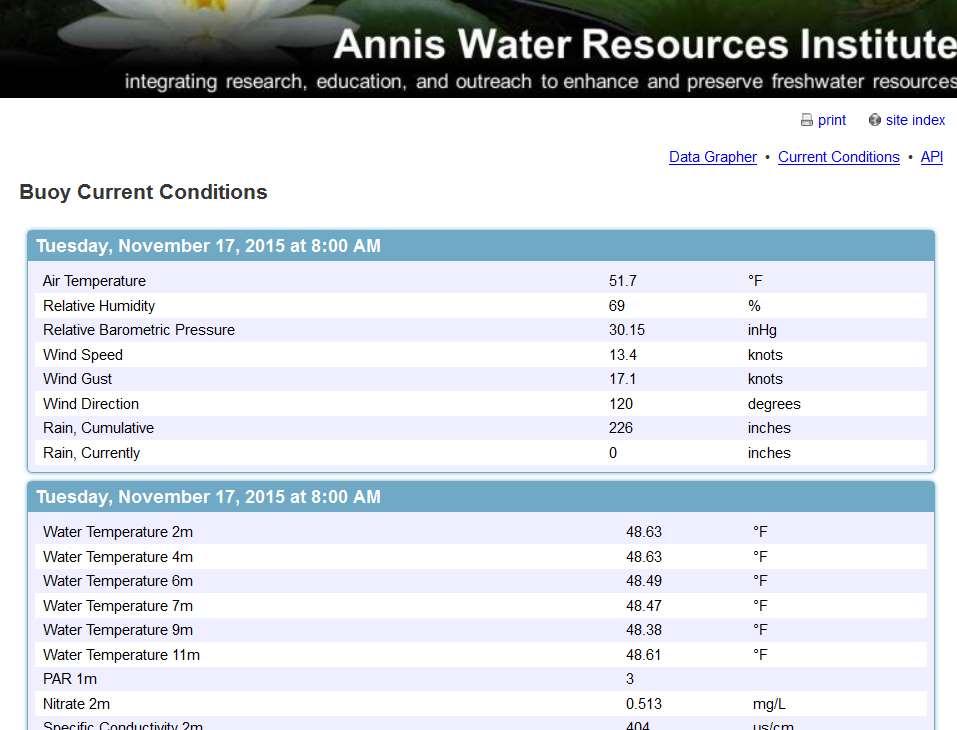
18 Current Conditions

19 Interactive Data Plotting Tool
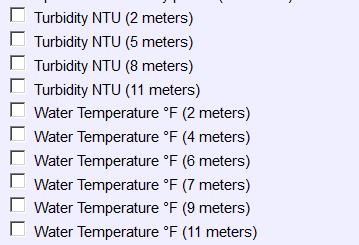
20
21 Interactive Data Plotting Tool Air Temperature at the Muskegon Lake Observatory
22 Let s Explore!

23 a. Water temperature at 2 M (specific date, every X minutes) There is a single point on the graph, which is the mean temperature, about 73.4 F.

24 b. Water temperature at 2 M (specific date, all day)
25 c. Water temperature at 2 M (range of dates for 1 month)
26 d. Water temperature at 2 M (range of dates for 5 months)
27 e. Water temperature at 2 M and Water temperature at 11 M (range of dates for 5 months)
28 Predict - Explain - Plot Explain Again What trends do the data show? Why do the data show those trends? Is the trend different or the same than you predicted? If it s the same, justify. If it s different, justify why?

29 When do algal blooms happen in Muskegon Lake? What parameter(s) would measure that? Make a prediction for the levels of your parameter between April and November. Parameter Amount April November
30 Chlorophyll
31 Phycocyanin


32 Muskegon Lake, September 2015

33 Elaborate > Patterns > Cause and effect
34 2011 Water Temperature and Chlorophyll
35 Water Temperature and Phycocyanin 2011
36 Evaluate Suppose each year a class can do one day of water monitoring. When should the monitoring be done? If we compare the data from one year to the next, how can we know that any trends are meaningful? How will we know if things have changed or remained the same? How can human activities impact the aquatic environment and what evidence do we have (or require) to evaluate and mitigate that impact?
37 Resources

38 Buoys are all over the world
39 Next Generation & Michigan Science Standards Using authentic data helps students to identify patterns, change through time, and cause and effect. The lesson sequence above follows the science and engineering practices of asking questions, defining problems, analyzing and interpreting data, constructing explanations, and engaging in argument from evidence.
40 So what do these sensors tell us about seasonal ecosystem dynamics and upstream influences?
41 So what do these sensors tell us about seasonal ecosystem dynamics and upstream influences? How do these sensors help make scientific discoveries?
42 How to make a scientific discovery Engage (to motivate the work ahead) Explore (patterns & study fundamentals) Explain (make guesses hypotheses and test them)
43 Engage Michalak, 2014 Proc. Natl. Acad. Sci.
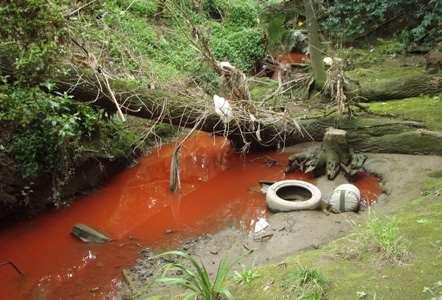
44 Engage
45 Engage
46 Engage Circle of Blue
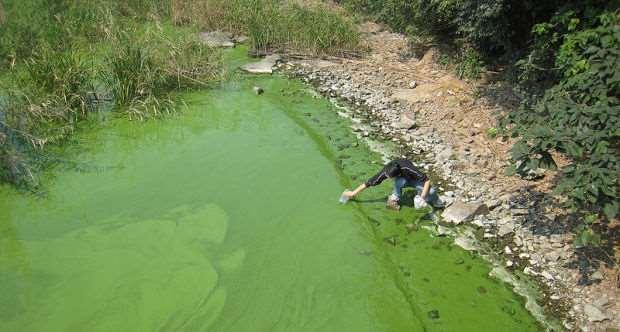
47 Engage Milwaukee Journal Sentinel
48 Engage What s causing this? Scientists don t know but they have guesses (hypotheses) Slow progress on nonpoint phosphorus sources (dissolved phosphorus) Quagga and zebra mussels eating everything but Microcystis Stronger thermal stratification as waters get warmer Hypoxia releasing phosphorus from sediments Milwaukee Journal Sentinel
49 Engage What s causing this? What can we do? Scientists don t know but they have guesses (hypotheses) Slow progress on nonpoint phosphorus sources (dissolved phosphorus) Quagga and zebra mussels eating everything but Microcystis Stronger thermal stratification as waters get warmer Hypoxia releasing phosphorus from sediments Milwaukee Journal Sentinel
50 Explore Theory: stratification drives hypoxia Does hypoxia get worse as the summer goes on?
51
52 Does hypoxia get worse as the summer goes on?
53 Does hypoxia get worse as the summer goes on?
54 Does hypoxia get worse as the summer goes on?
55 Does hypoxia get worse as the summer goes on?
56
57 65 F 55 F
58
59 21 C
60 65 F 55 F
61 65 F 55 F 65 F 47 F
62
Redwood Shores Lagoon November 2016 Monthly Water Quality Monitoring Report
 Redwood Shores Lagoon November 2016 Monthly Water Quality Monitoring Report Prepared for Redwood City Public Works Services Department 1400 Broadway Redwood City, CA 94063-2594 Prepared by Clean Lakes,
Redwood Shores Lagoon February 2019 Monthly Water Quality Monitoring Report
 Redwood Shores Lagoon February 2019 Monthly Water Quality Monitoring Report Prepared for Redwood City Public Works Services Department 1400 Broadway Redwood City, CA 94063-2594 Prepared by Clean Lakes,
EUTROPHICATION. Student Lab Workbook
 EUTROPHICATION Student Lab Workbook THE SCIENTIFIC METHOD 1. Research Background literature research about a topic of interest 2. Identification of a problem Determine a problem (with regards to the topic)
Redwood Shores Lagoon May 2017 Monthly Water Quality Monitoring Report
 Redwood Shores Lagoon May 2017 Monthly Water Quality Monitoring Report Prepared for Redwood City Public Works Services Department 1400 Broadway Redwood City, CA 94063-2594 Prepared by Clean Lakes, Inc.
Jackson Lake Analysis
 Jackson Lake Analysis Lake Zones Lake Zones Limnetic Zone- open water far from shore Light penetrates shallow, allowing photosynthesis Supports phytoplankton (algae, protists, cyanobacteria) which then
Factsheet: Town of Deep River Water Quality and Stormwater Summary
 79 Elm Street Hartford, CT 06106-5127 www.ct.gov/deep Affirmative Action/Equal Opportunity Employer Factsheet: Town of Deep River Water Quality and Stormwater Summary This document was created for each
Water Quality Monitoring for Lake Erie and the Great Lakes Nutrient Initiative (GLNI)
") Water Quality Monitoring for Lake Erie and the Great Lakes Nutrient Initiative (GLNI) 2011-2016 Water Quality Monitoring and Surveillance Division Alice Dove, Sean Backus, Vi Richardson Issues Facing the
Water Quality Monitoring for Lake Erie and the Great Lakes Nutrient Initiative (GLNI) 2011-2016 Water Quality Monitoring and Surveillance Division Alice Dove, Sean Backus, Vi Richardson Issues Facing the
Factsheet: City of West Haven Water Quality and Stormwater Summary
 79 Elm Street Hartford, CT 06106-5127 www.ct.gov/deep Affirmative Action/Equal Opportunity Employer Factsheet: City of West Haven Water Quality and Stormwater Summary This document was created for each
Factsheet: Town of East Lyme Water Quality and Stormwater Summary
 79 Elm Street Hartford, CT 06106-5127 www.ct.gov/deep Affirmative Action/Equal Opportunity Employer Factsheet: Town of East Lyme Water Quality and Stormwater Summary This document was created for each
Acidity and Alkalinity:
 Evaluation of Pollution Sources to Lake Glenville Quarterly Report December 2018 Kimberlee K Hall, PhD Environmental Health Program, Western Carolina University Summary Chemical and microbial analysis
Harmful Algal Blooms. A newly emerging pathogen in water. Juli Dyble. NOAA Great Lakes Environmental Research Lab Ann Arbor, MI
 Harmful Algal Blooms A newly emerging pathogen in water Juli Dyble NOAA Great Lakes Environmental Research Lab Ann Arbor, MI Harmful Algal Blooms (HABs) Harmful: : produce toxins Algal: : planktonic, photosynthetic
Factsheet: Town of Hamden Water Quality and Stormwater Summary
 79 Elm Street Hartford, CT 06106-5127 www.ct.gov/deep Affirmative Action/Equal Opportunity Employer Factsheet: Town of Hamden Water Quality and Stormwater Summary This document was created for each town
Factsheet: Town of Trumbull Water Quality and Stormwater Summary
 79 Elm Street Hartford, CT 06106-5127 www.ct.gov/deep Affirmative Action/Equal Opportunity Employer Factsheet: Town of Trumbull Water Quality and Stormwater Summary This document was created for each town
Redwood Shores Lagoon August Monthly Water Quality Monitoring Report
 Redwood Shores Lagoon August Monthly Water Quality Monitoring Report Prepared for Redwood City Public Works Services Department 1400 Broadway Redwood City, CA 94063-2594 Prepared by Clean Lakes, Inc. P.
Science Enhanced Scope and Sequence Grade 6. Water Quality
 Water Quality Strand Topic Living Systems Investigating water quality Primary SOL 6.7 The student will investigate and understand the natural processes and human interactions that affect watershed systems.
Lake Washington. Water Quality Assessment Report. Copyright 2012 PLM Lake & Land Management Corp.
 Lake Washington 2012 Water Quality Assessment Report Copyright 2012 PLM Lake & Land Management Corp. Water Quality Report On May 22nd, June 18th, July 30th, August 29th, and September 27 th, 2012, PLM
Envirothon Aquatics. Mike Archer, NE Dept. of Environmental Quality. Katie Pekarek, Nebraska Extension Jeff Blaser, Nebraska Game and Parks
 Envirothon Aquatics Mike Archer, NE Dept. of Environmental Quality Katie Pekarek, Nebraska Extension Jeff Blaser, Nebraska Game and Parks Lake Watersheds Watershed = area contributing water to pond Surface
A Close Look at Lake Erie HABS and Current Research Efforts
 --- Ohio Water Environment Association --- OHIO SEA GRANT AND STONE LABORATORY A Close Look at Lake Erie HABS and Current Research Efforts Dr. Christopher J. Winslow Interim Director, Ohio Sea Grant College
2012 Range Ponds Water Quality Report
 2012 Range Ponds Water Quality Report Prepared by Scott Williams, Aquatic Biologist Lake & Watershed Resource Management Associates The Range Ponds Environmental Association continued to monitor the health
The Who, Why, and What can be Done about Golden Brown Algae in Torch Lake
 The Who, Why, and What can be Done about Golden Brown Algae in Torch Lake Patrick Kociolek (University of Colorado & UMBS), Rex Lowe (University of Wisconsin & UMBS), and Jan Stevenson (Michigan State
This article is provided courtesy of the American Museum of Natural History.
 Zebra Mussels and the Hudson River This article is provided courtesy of the American Museum of Natural History. Zebra Mussels and the Hudson River A team of scientists at the Cary Institute of Ecosystem
He eia Fishpond Water Monitoring Project Due:
 He eia Fishpond Water Monitoring Project Due: While on your field trip to He eia Fishpond, you will be using a water monitoring kit. This kit was designed to provide a simple, affordable, non-hazardous
Water Quality Testing
 Field Experience Water Quality Testing How s the Water? Overview Students will use chemical tests to determine the water quality of a local pond. Teacher Background: Water Quality In 1972 the Clean Water
Water Pollution. Chapter 20
 Water Pollution Chapter 20 Water Pollution Comes from Point and Nonpoint Sources Water pollution Any chemical, biological, or physical change in water quality that harms living organisms or makes water
Josette M. La Hée, Ph.D. Limnologist Research and Development
 Aeration: A key tool in aquatic system restoration and management Josette M. La Hée, Ph.D. Limnologist Research and Development http://www.vertexwaterfeatures.com Aeration Aeration the process by which
Water Quality: Is Our Bay Safe?
 Grades 7-10 : Is Our Bay Safe? Background. Pollution is change in the estuary environment that has a negative impact on any of the living things in the estuary. The quality of an estuary can be measured
Water Monitoring in Spa Creek: A Summary
 Water Monitoring in Spa Creek: A Summary Written by: Alexis Jones & Blake Harden Edited by: Hannah Krauss Water monitoring is very important in order to determine the health of the Chesapeake Bay and its
Primer on Pond & Lake Ecology & Watershed Dynamics
 Primer on Pond & Lake Ecology & Watershed Dynamics The water quality of a lake is often described as a reflection of its surrounding watershed. The term lake collectively refers to reservoirs (man-made
Owasco Lake Day
 Introductions Halfman apologizes for not presenting this talk himself. A family reunion took precedent. Owasco Lake Day 6-25--14 1 The beginnings Preliminary water quality comparison of the Finger Lakes
Interpreting Lake Data
 Interpreting Lake Data Indiana Clean Lakes Program The Indiana Clean Lakes Program was created in 1989 as a program within the Indiana Department of Environmental Management's (IDEM) Office of Water Management.
Algae 101: An Introduction to Harmful Algal Blooms
 Algae 101: An Introduction to Harmful Algal Blooms Greg Boyer State University of New York College of Environmental Science and Forestry, Syracuse, NY What are blue-green algae? Specialized plant-like
Interpreting Lake Data
 Interpreting Lake Data Indiana Clean Lakes Program The Indiana Clean Lakes Program was created in 1989 as a program within the Indiana Department of Environmental Management's (IDEM) Office of Water Management.
Owasco Lake: The 2010 Update Owasco Lake Watershed Association August 4 th, 2010, Meeting Data Water Quality & Its Protection
 Lake: The Update Lake Watershed Association August th,, Meeting www.erh.noaa.gov/nerfc/basin_info/owsn.html John D Halfman Environmental Studies Program Department of Geoscience Finger Lakes Institute
Water Quality indicators and How Human Activities Affect Water Quality
 Water Quality indicators and How Human Activities Affect Water Quality Name: Online Assignment: Period: Date: Purpose: to learn how to evaluate water quality and how pollution can make water unavailable
Environmental Science 101 Water. Fall Learning Objectives: Reading Assignment:
 Environmental Science 101 Water Fall 2012 1 Lecture Outline: 16. SURFACE WATER OLLUTION A. Two Kinds of Aquatic lants B. Upsetting the Balance by Nutrient Enrichment C. Idaho Examples D. Sources of Nutrients
Kill the Weeds, Not the Fish!
 Kill the Weeds, Not the Fish! Dr. Chuck Cichra University of Florida / IFAS School of Forest Resources & Conservation Program in Fisheries & Aquatic Sciences My goal is for you to have a better understanding
NUTRIENT THE OHIO RIVER
 NUTRIENT MANAGEMENT FOR THE OHIO RIVER Why nutrient management is necessary Nutrients are necessary for a healthy aquatic community, but Excessive quantities of nutrients can have negative effects Negative
An Introduction to The Ecology of Lakes, Ponds and Reservoirs. Developing a Management Plan
 An Introduction to The Ecology of Lakes, Ponds and Reservoirs Developing a Management Plan Stephen J. Souza, Ph.D. Princeton Hydro, LLC 1108 Old York Road Ringoes, NJ 08551 ssouza@princetonhydro.com Objective
Aquatic Science Unit 2. Water Quality and Water Pollution
 Aquatic Science Unit 2 Water Quality and Water Pollution What is a healthy water body? In your own words, take a moment to describe what you believe are some of the characteristics of a healthy stream
THS Sci-O Water Quality Tryout Test. Partner 1: Partner 2: Total Score: /104
 THS Sci-O 2018-19 Water Quality Tryout Test Partner 1: Partner 2: Total Score: /104 1 Part One: 1-6. Label the times each part of the thermal stratification cycle occurs (ex: summer, spring turnover, etc.)
Lake & Watershed Resource Management Associates P O Box 65; Turner, ME
 Lake & Watershed Resource Management Associates P O Box 65; Turner, ME 207-336-2980 LWRMA@megalink.net 2008 Baseline Water Quality Monitoring and Assessment of Pemaquid and Biscay Ponds At the request
EUTROPHICATION. Teacher s Manual
 EUTROPHICATION Teacher s Manual Preface The following is a, hands on, and inquiry based lesson plan developed by COSEE Mid-Atlantic for teaching eutrophication. The National Education Science Standards
Effect of Turbidity on Dissolved Oxygen in the Lake Macatawa. Watershed
 Effect of Turbidity on Dissolved Oxygen in the Lake Macatawa Watershed Hope College GES 401 Research Project Group Members: Peter Van Heest, Rachel Burkhart, Wyatt Curry Advisor: Dr. G. Peaslee Introduction
2016 Summit Lake Water Quality Report Prepared by Thurston County Environmental Health Division
 ! 216 Summit Lake Water Quality Report Prepared by Thurston County Environmental Health Division PART OF TOTTEN INLET WATERSHED LENGTH OF LAKE: 2.2 miles SHORELINE LENGTH: 5.6 miles LAKE SIZE: 53 acres
How Ecosystems Work Section 2. Chapter 5 How Ecosystems Work Section 2: Cycling of Materials DAY 1
 Chapter 5 How Ecosystems Work Section 2: Cycling of Materials DAY 1 The Carbon Cycle The carbon cycle is the movement of carbon from the nonliving environment into living things and back Carbon is the
Use of Vollenweider-OECD Modeling to Evaluate Aquatic Ecosystem Functioning
 R. Anne Jones 1 and G. Fred Lee 1 Use of Vollenweider-OECD Modeling to Evaluate Aquatic Ecosystem Functioning REFERENCE: Jones, R. A. and Lee, G. F., Use of Vollenweider-OECD Modeling to Evaluate Aquatic
Dirty Water. Adapted from: Dirty Water in Living in Water. National Aquarium in Baltimore, Grade Level: all. Duration: 1-2 class periods
 Dirty Water Adapted from: Dirty Water in Living in Water. National Aquarium in Baltimore, 1997. Nitrogen and Phosphorus Grade Level: all Duration: 1-2 class periods Setting: classroom or laboratory Summary:
Water Pollution Overview. Sewage dumping
 Water Pollution Water Pollution Overview Sewage dumping Ocean Pollution Water Pollution Overview Urban Water Pollution Water Pollution Overview Water Pollution Overview Urban Runoff Water Pollution Overview
Continuous records for the Chariton River indicate that 2004 was an average water year, with total flow approximately equal to the average annual
 2004 Rathbun Report Iowa State University Limnology Laboratory John A. Downing, Ph.D. George Antoniou, Assistant Scientist For Rathbun Land and Water Alliance August 31, 2005 A. Tributaries Personnel of
Water Pollution. Objective: Name, describe, and cite examples of the eight major types of water pollution.
 Water Pollution Objective: Name, describe, and cite examples of the eight major types of water pollution. Types of Water Pollution Water pollutants are divided into eight categories: 1. Sediment pollution
Harmful Algal Bloom Research at Stone Lab: Monitoring Blooms and Determining. Drivers of Bloom Toxicity
 Harmful Algal Bloom Research at Stone Lab: Monitoring Blooms and Determining WMAO/OWRC Luncheon October 12, 2016 Drivers of Bloom Toxicity Justin Chaffin, PhD Stone Laboratory, Ohio Sea Grant Chaffin.46@osu.edu
Lake & Watershed Resource Management Associates P O Box 65; Turner, ME
 Lake & Watershed Resource Management Associates P O Box 65; Turner, ME 207-336-2980 LWRMA @megalink.net 2009 Baseline Water Quality Monitoring and Assessment of McCurdy Pond At the request of the Pemaquid
Nutrients, Algal Blooms and Red Tides in Hong Kong Waters. Paul J. Harrison and Jie XU
 Nutrients, Algal Blooms and Red Tides in Hong Kong Waters Paul J. Harrison and Jie XU Division of Environment, Hong Kong University of Science & Technology 1. Introduction The Pearl River is China's second
Laurel Lake water quality, nutrients, and algae, summer
 Laurel Lake water quality, nutrients, and algae, summer 2011 1 H.A. Waterfield, W.N. Harman and M.F. Albright SAMPLING ACTIVITIES Site visits to Laurel Lake were made on 16 June and 25 July 2011; water
Recent changes in Lake Erie Trophic Status? Jan J.H. Ciborowski University of Windsor & Gerald Matisoff Case Western Reserve University
 Recent changes in Lake Erie Trophic Status? Jan J.H. Ciborowski University of Windsor & Gerald Matisoff Case Western Reserve University Important Variables and Issues Phytoplankton - primary producers
LAKE OF THE WOODS PROGRAM
 LAKE OF THE WOODS PROGRAM Water quality and aquatic ecosystem health is of concern in OBJECTIVES the Lake of the Woods. The most critical issue affecting Lake of the Woods water quality and aquatic ecosystem
NOAA / CILER Great Lakes Environmental Research Laboratory
 NOAA / CILER Great Lakes Environmental Research Laboratory Marie Colton Director Lake Erie Millennium Network Windsor, ON April 28, 2010 1 Objective for Today Exploring Opportunities GLERL Update Facilities
CHAPTER 15 WATER POLLUTION. INTO THE GULF Researchers try to pin down what s choking the Gulf of Mexico
 CHAPTER 15 WATER POLLUTION INTO THE GULF Researchers try to pin down what s choking the Gulf of Mexico SAVING THE BAY Teams of researchers try to pin down what s choking the Chesapeake Water pollution
Wakefield Lake TMDL Public Meeting 3/17/2014. Jen Koehler, PE Barr Engineering
 Wakefield Lake TMDL Public Meeting 3/17/2014 Jen Koehler, PE Barr Engineering Outline Project Contacts Introduction to Wakefield Lake Thoughts/Questions/Concerns About TMDL Studies Lake Water Quality and
Ponds: Careful of the Fish!
 Ponds: Careful of the Fish! Dr. Chuck Cichra Extension Fisheries Specialist University of Florida / IFAS SFRC - Program of Fisheries & Aquatic Sciences All Plants Need Water, Light, and Nutrients Aquatic
After reviewing data collected from ISLAND POND, STODDARD, the program coordinators have made the following observations and recommendations.
 OBSERVATIONS & RECOMMENDATIONS After reviewing data collected from ISLAND POND, STODDARD, the program coordinators have made the following observations and recommendations. Thank you for your continued
Aquatic Plants in Lake Simcoe
 Aquatic Plants in Lake Simcoe LSRCA Board of Directors October 28, 2016 Brian Ginn Limnologist, Certified Lake Manager Member of Conservation Ontario Aquatic Plants - Plants growing above / below / floating
MARK TWAIN LAKE WATER QUALITY REPORT. for
 MARK TWAIN LAKE WATER QUALITY REPORT for 1997 U.S. ARMY CORPS OF ENGINEERS, ST. LOUIS DISTRICT ENVIRONMENTAL QUALITY SECTION - Water Quality Ted Postol, Section Chief Tori Foerste, Environmental Engineer
How may climate change affect shallow inland lakes of New York State? A simple question with a complex answer
 How may climate change affect shallow inland lakes of New York State? A simple question with a complex answer Bruce Gilman, Professor and Director Muller Field Station Finger Lakes Community College 3325
Pollutants in our Waters
 Pollutants in our Waters CARIWIN Advanced Course in IWRM September 17, 2007 Apurva Gollamudi Brace Centre for Water Resources Management McGill University It isn t the pollution that s harming the environment.
Cultural accelerated by anthropogenic activities
 EUTROPHICATION IMPLICATIONS OF N & P Intent of this lecture? Link our discussions of terrestrial N & P dynamics with its influences on receiving water bodies How the relative amounts of N & P can influence
Abuja, May 2008
 Waste Water Treatment and Water Quality Based on UNSD Questionnaire 2002 and 2004 United Nations Statistics Division Workshop on Environment Statistics Abuja, 19-23 May 2008 Waste water generation Total
Little Bay Water Quality Report Card Spring 2014
 Little Bay Water Quality Report Card Spring 2014 Little Bay is a small, semi-enclosed estuary located in the heart of Rockport, Texas. Estuaries, where freshwater from rivers and streams mixes with salt
Do Now. Take out your activity you completed on Friday when I wasn t here!
 Do Now Take out your activity you completed on Friday when I wasn t here! Biogeochemical Cycles 37.18-37.23 Objectives Identify and describe the flow of nutrients in each biogeochemical cycle Explain the
The Dead Zone. Use the notes provided (attached to this sheet) to answer the following questions.
 to answer the following questions.") The Dead Zone Use the notes provided (attached to this sheet) to answer the following questions. 1. Re-define Eutrophication: 2. What are the risks associated with an excess of Nitrogen? 3. What is a Dead
The Dead Zone Use the notes provided (attached to this sheet) to answer the following questions. 1. Re-define Eutrophication: 2. What are the risks associated with an excess of Nitrogen? 3. What is a Dead
Water Quality: The Basics
 Water Quality: The Basics Environmental Science Why is Water Quality Important? Effects all humans Safe drinking water Allows for food productions and SAFE food products Effects Wildlife Health domestic
Nutrient Issues in Lake Ontario. Lisa Trevisan Ontario Ministry of the Environment and Climate Change
 Nutrient Issues in Lake Ontario Lisa Trevisan Ontario Ministry of the Environment and Climate Change March 26, 2015 Outline Lake Ontario facts and figures Nutrient stressors in Lake Ontario Cyanobacteria
The Snapshot CONODOGUINET CREEK WATERSHED SNAPSHOT
 CONODOGUINET CREEK WATERSHED SNAPSHOT ABOVE: CONODOGUINET CREEK AT RT 74 BRIDGE FACING DOWNSTREAM The Snapshot The Conodoguinet Watershed Snapshot was a collaborative effort to engage local citizens in
LIMNOLOGY. Inland Water Ecosystems. JACOB KALFF McGill University. Prentice Hall. Upper Saddle River, New Jersey 07458
 LIMNOLOGY Inland Water Ecosystems JACOB KALFF McGill University Prentice Hall Prentice Hall Upper Saddle River, New Jersey 07458 Contents CHAPTER 1 Inland Waters and Their Catchments: An Introduction and
SECTION 1 FRESHWATER SYSTEMS UNIT 4: AQUATIC ECOLOGY
 SECTION 1 FRESHWATER SYSTEMS UNIT 4: AQUATIC ECOLOGY CENTRAL CASE STUDY: STARVING THE LOUISIANA COAST OF SEDIMENT LOUISIANA IS LOSING 25MI2 OF COASTAL WETLANDS ANNUALLY WETLANDS SUPPORT A DIVERSITY OF
Phosphorus in the. Minnesota River
 Phosphorus in the Minnesota Phosphorus has been identified as a major pollutant of the Minnesota. It s one of the main reasons the Minnesota is regarded as the most polluted river in the state. Phosphorus
Santa Rosa Creek Water Quality Results 2004
 Santa Rosa Creek Water Quality Results 24 Community Clean Water Institute Site Description: SRC4: Off 3rd Street in downtown Santa Rosa. Behind the Vineyard Hotel just West of Highway 11 along the Prince
WHY DO WE NEED NITROGEN?? Nitrogen is needed to make up DNA and protein!
 Nitrogen Cycle 2.2 WHY DO WE NEED NITROGEN?? Nitrogen is needed to make up DNA and protein! In animals, proteins are vital for muscle function. In plants, nitrogen is important for growth. NITROGEN Nitrogen
RECOMMENDED BINATIONAL PHOSPHORUS TARGETS TO COMBAT LAKE ERIE ALGAL BLOOMS
 June 2015 RECOMMENDED BINATIONAL PHOSPHORUS TARGETS TO COMBAT LAKE ERIE ALGAL BLOOMS Introduction Algae occur naturally in freshwater systems. They are essential to the aquatic food web and healthy ecosystems.
Master 5.1, Newspaper Articles. Special Edition December 14. Special Edition March 17
 Master 5.1, Newspaper Articles THE DAILY HERALD Special Edition December 14 Study Forecasts Future Food Shortage A new study published in the Journal of World Agriculture raises concerns that in the future
Welcome. Thank you for joining us! Lower Mississippi River Watershed Management Organization
 Welcome. Thank you for joining us! Lower Mississippi River Watershed Management Organization Lower Mississippi River Watershed Management Organization Watershed Restoration and Protection (WRAP) Study
LAKE AUBURN: THE EFFECT OF CLIMATE DRIVERS ON LAKE WATER QUALITY
 LAKE AUBURN: THE EFFECT OF CLIMATE DRIVERS ON LAKE WATER QUALITY Bernadette Kolb, Zachary Eichenwald and Daniel Bisson, CDM Smith John Storer, Auburn Water District* David Jones, Lewiston Water Division
Eutrophication. Pollution Effects on Society
 Eutrophication Pollution Effects on Society Eutrophication What is eutrophication? Eutrophication is a natural process by which lakes and reservoirs become more productive as a result of increased nutrient
Status and Trends of Water Quality in Wisconsin s Lakes, Streams, and Rivers
 Status and Trends of Water Quality in Wisconsin s Lakes, Streams, and Rivers Tim Asplund, Matt Diebel, Katie Hein, and Mike Shupryt Water Resources Program, WDNR AWRA Wisconsin Section Annual Meeting March
Ellen Bailey. UWW Educator training January 13,
 Ellen Bailey UWW Educator training January 13, 2017 ellen.bailey@usu.edu 801-536-4432 Utah Water Watch Partnership between USU Extension and the DWQ Started in 2012 Trained 750+ volunteers, monitoring
AP Lab 12--DISSOLVED OXYGEN & AQUATIC PRIMARY PRODUCTIVITY (LabBench)
") Name AP Biology AP Lab 12--DISSOLVED OXYGEN & AQUATIC PRIMARY PRODUCTIVITY (LabBench) Web address: http://www.phschool.com/science/biology_place/labbench Click on Lab 12: Dissolved Oxygen & Aquatic Primary
Name AP Biology AP Lab 12--DISSOLVED OXYGEN & AQUATIC PRIMARY PRODUCTIVITY (LabBench) Web address: http://www.phschool.com/science/biology_place/labbench Click on Lab 12: Dissolved Oxygen & Aquatic Primary
Water Pollution & Quality. Dr. Deniz AKGÜL Marmara University Department of Environmental Engineering
 Water Pollution & Quality Dr. Deniz AKGÜL Marmara University Department of Environmental Engineering IMPORTANCE OF WATER Life on planet Earth would be impossible without water. All life forms, from simple
Cycles of Matter. Slide 1 of 33. End Show. Copyright Pearson Prentice Hall
 Cycles of Matter 1 of 33 The purpose of this lesson is to learn the water, carbon, nitrogen, and phosphorus cycles. This PowerPoint will provide most of the required information you need to accomplish
Water Quality in Rice and Pike Lakes. Ryan Haney Water Resource Specialist Center for Watershed Science and Education UW Stevens Point
 Water Quality in Rice and Pike Lakes Ryan Haney Water Resource Specialist Center for Watershed Science and Education UW Stevens Point Tonight s discussion How do we measure water quality? How is the water
AP Environmental Science
 Name AP Environmental Science DISSOLVED OXYGEN & AQUATIC PRIMARY PRODUCTIVITY (LabBench) Web address: http://www.phschool.com/science/biology_place/labbench Click on Lab 12: Dissolved Oxygen & Aquatic
Experiment Modules Water Quality
 Experiment Modules Water Quality Page 2 of 18 Table of Contents 1 PH... 4 2 TEMPERATURE... 6 3 ELECTRICAL CONDUCTIVITY / TOTAL DISSOLVED SOLIDS... 8 4 BACTERIA (E. COLI, COLIFORM)... 9 5 DISSOLVED OXYGEN...
Impacts to Aquatic Habitats from Land-Use or Is It Polluted?
 Impacts to Aquatic Habitats from Land-Use or Is It Polluted? Water Pollution is: The addition of excessive carbon to a system The addition of large amounts of materials to water that causes adverse changes
REND LAKE WATER QUALITY
 REND LAKE 1999-2002 WATER QUALITY REPORT U.S. ARMY CORPS OF ENGINEERS, ST. LOUIS DISTRICT ENVIRONMENTAL QUALITY SECTION - Water Quality Billy Arthur, Section Chief Theodore Postol, Environmental Engineer
2018 WATER QUALITY MONITORING BLUE MARSH RESERVOIR LEESPORT, PENNSYLVANIA
 2018 WATER QUALITY MONITORING BLUE MARSH RESERVOIR LEESPORT, PENNSYLVANIA U.S. Army Corps of Engineers Philadelphia District Environmental Resources Branch January 2019 2018 Water Quality Monitoring Blue
The Hypoxic Zone in the Gulf of Mexico
 The Hypoxic Zone in the Gulf of Mexico References Council Committee on Environmental and Natural Resources. 2003. An Assessment of Coastal Hypoxia and Eutrophication in U.S. Water. National Science and
Lesson Overview. Cycles of Matter. Lesson Overview. 3.4 Cycles of Matter
 Lesson Overview 3.4 THINK ABOUT IT A handful of elements combine to form the building blocks of all known organisms. Organisms cannot manufacture these elements and do not use them up, so where do essential
Water Quality Monitoring Stations
 Water Quality Monitoring Stations Eastern Basin Race Narrows Western Basin Central Basin The CT Department of Environmental Protection (CT DEP) conducts a water quality CT DEP monitoring program for the
Hydrology and Water Quality. Water. Water 9/13/2016. Molecular Water a great solvent. Molecular Water
 Hydrology and Water Quality Water Molecular Water Exists as an equilibrium But equilibrium altered by what is dissolved in it Water Molecular Water a great solvent In reality, water in the environment
Part I: Salish Sea Introduction. Review:
 Part I: Salish Sea Introduction Review: The Salish Sea The Salish Sea was formed about 20,000 years ago during the last ice age by the carving action of glaciers. There are 3 major parts of the Salish
Activity 1: Using the Level of Oxygen- Saturation Chart graph Dissolved Oxygen vs. Temperature at 100% saturation. Start by making a 2 column table.
 Activity 1: Using the Level of Oxygen- Saturation Chart graph Dissolved Oxygen vs. Temperature at 100% saturation. Start by making a 2 column table. Number the first column with temperatures from 0 to