RUNOFF FLOWING WATER
|
|
|
- Abel Harrell
- 6 years ago
- Views:
Transcription
1 RUNOFF FLOWING WATER Unless otherwise noted the artwork and photographs in this slide show are original and by Burt Carter. Permission is granted to use them for non-commercial, non-profit educational purposes provided that credit is given for their origin. Permission is not granted for any commercial or for-profit use, including use at for-profit educational facilities. Other copyrighted material is used under the fair use clause of the copyright law of the United States.
2 Four things to consider about water in a stream: 1. How does the water get into the stream? 2. What are the ways that the water can move internally as it proceeds downstream? 3. How do we characterize how much water moves through the stream? 4. What factors affect the velocity (or the speed) of the stream water as if flows?
3 1. How does the water get into the stream? Sheetwash and Tributaries
4 Imagine a rain of consistent intensity across the side of a hill. Further, suppose that the ground is already saturated, so all the water runs off. At the top meter of the hill (m1) the runoff will be equal to the amount of water falling on that meter of hillside call it one unit of water. In the next meter downhill (m2) the water coming in from m1 will be added to the water falling in m2 for a total of 2 units of water. In m3 the combined flow will equal 3 units, and so on. The amount of water moving across the ground will increase down the hillside. m1 1 unit m2 2 units m3 3 units m4 4 units
5 Only a trickle of water will flow across m1, but across m2 there will be a noticeable sheet of water. However, there will be no pattern to this flow no channeling, nothing dry the entire surface will be covered in water. We call this sheetwash or overland flow. Lower, say in m3, the additional water will give the flow a little more erosive power and the stream will begin to excavate small, but noticeable channels for itself called rills. Here the water first begins to be channelized, with some drier places between the rills. Even lower, say by m4, the rills will join into larger channels that will be obvious even after the rain has stopped. Even though there will be no flow in them between rains they will obviously be stream channels. Such channels, only carrying water during and soon after a rain, are called intermittent channels. They can actually be fairly large.
6 Map view: Top of Hill Lower Part of Hill Base of Hill Farther Downstream (Headwaters) Sheetwash Rills Intermittent Permanent Tributaries Trunk Stream (or Tributary to Something Bigger) Water runs willy-nilly downslope Water collects into larger channels as smaller ones join.
7 2. What are the ways that the water can move internally as it proceeds downstream? Laminar and Turbulent Flow (Small scale characterization of water movement)
8 TYPES OF FLOW IN A CHANNEL: LAMINAR vs. TURBULENT
9 The word velocity is going to come up frequently as we talk about streams, and unfortunately it can be a little confusing if you don t keep up with the context in which it is used. A stream s velocity or average velocity is the rate at which it moves water down its course how fast it delivers water to its mouth for example. Counter-intuitively, streams tend to have higher average velocities farther downstream, even though the gradient (slope) is lower. They have lower velocities near their heads where it looks like they are rushing along at breakneck pace down the steep slope. Part of the explanation is that the flow of most of the water in the downstream segments is nearly laminar, so it makes more downstream progress in a given amount of time. Upstream, where the gradient is higher, the water is much more turbulent, so even though it is, in some sense, moving faster it is not moving downstream as much. Instead, it eddies, is diverted around obstacles (like big rocks), and tumbles over coarser gravel in its bed. Velocity and speed are not the same thing.
10 Here s a good analogy. A couple of times a year there is a NASCAR race at Atlanta Motor Speedway, west of I-75 near McDonough, GA. If a car on the freeway passes the racetrack just as the race starts and drives at a constant speed of 60 mph the driver will arrive at Florida in a little 4 hours (his odometer will show he has gone some 250 miles). Meanwhile, the racers drive at speeds averaging around twice that (120mph) of the person on the freeway. In a little over four hours their odometers will indicate they have gone 500 miles. But they will end up at exactly the same place they started. Their progress in any particular direction is zero miles in four hours. Who went faster? The average velocity of the driver on the interstate was greater because more progress in some direction was made. The moment or instantaneous velocities of the racers was much higher, even though they didn t make any progress in any particular direction. The next slide illustrates the concept.
11 North RACE DAY! Average speed of cars on track = 120 mph Start/ Finish Line Atlanta International Speedway Average speed of cars in southbound lane = 60mph I-75 Southward progress of any average individual car or cluster of cars traveling together for any hour of the race = 0 miles. Velocity = 0 mph! Southward progress of any average individual car or cluster of cars traveling together the same hour = 60 miles. Velocity = 60 mph!
12 At a large scale when we talk about a stream s velocity we mean the downstream progress of a certain volume of its water in a certain amount of time. At a very small scale (when we talk about the forces that move an individual piece of sediment) we also talk about the velocity of the water, but that usage is a little different. We are interested in how fast the water moves over a grain at the instant it is lifted (or not lifted). We don t much care if the water is moving directly downstream or not. Overall average velocity of a stream doesn t say anything about local moment velocity affecting sediment. Moment velocities of lowland streams at their beds are lower than those of mountain streams, so they cannot move sediment as coarse. The water has a higher downstream velocity, but it isn t moving as fast where it counts! For a variety of reasons turbulent flow is more effective at moving coarser sediment than laminar flow is. Even though a stream has a higher velocity downstream, the size of its bedload always decreases downstream!
13 3. How do we characterize how much water moves through the stream? Discharge (Large scale characterization of water movement)
14 Discharge means the total amount of water moving through a stream. It is mathematically expressed as a volume of water passing a point per unit of time. Usually we use m 3 (cubic meters) per second, but feet 3 /second or gallons per day are also commonly used, particularly when the intent is to emphasize just how much water is actually flowing through a large stream. We can determine a stream s discharge with a few simple measurements of the channel (with a meter ruler or tape) and the velocity (with a current meter or a float). We need to know the channel s average width (w), so we use a tape or other device to measure that (in meters) at various depths (say every meter) then average those values. We also need the average depth (d) and so measure that across the stream, perhaps, again, at every meter. Then we average those values. These two averages multiplied together give the cross-sectional area (A) in m 2. We also need to know the average velocity. Since this is lower at the bed and banks than in the top center we ideally use a current meter and measure on a grid. If we don t have a current meter we can still estimate the velocity by timing a float moving downstream in various places close to the sides, in the middle, etc. We do this many times and take the average. This will not tell us about the velocity at depth.
15 When we have these three values we simply multiply them together: Width (in m) x Depth (m) x Velocity (m/s) gives us Discharge (m 3 /s) or w x d x v = Q (or A x v = Q) (Q is usually used for discharge rather than big D since little d is depth.) Make sure you see how the units work: m x m x m/s = m 3 /s
16 Imagine that we have measured a stream and found the width, depth and velocity indicated in the diagram. What is the discharge? Float moves an average of 20m in 10 seconds (2 m/s) Average Width = 4m Average Depth = 2m Q = w x d x v in this case: Q = 4m x 2m x 2 m/s = 16m 3 /s
17 PAY CLOSE ATTENTION: This is very important. Unless the total amount of water in a stream changes the discharge will be constant throughout its course. We are about to explore how the flow of a stream changes under various conditions and there will probably be test questions about this material. Unless the question indicates that water is added or lost, the discharge changes is NEVER the answer! NEVER! I say this because, judging from past experience, whatever I do roughly a third of you will miss these questions because you will insist on having a stream s discharge change. It doesn t seem to matter how emphatically I say that the discharge cannot change. Any amount of water that flows into one stretch of a stream must also flow through every other downstream stretch. It cannot go away for a few meters or kilometers and then come back for others. It must flow through every meter of the stream. In this example 100m 3 /s flows in at the left end and 100m 3 /s flows out at the right end. At every point along the stream the discharge is 100m 3 /s.
18 Here are the ways all the ways that discharge can change. Q=50m 3 /s One way to increase discharge of a stream is to add water to it through a tributary. In the example a tributary stream with Q=50m 3 /s joins a stream with. The resulting trunk stream has a discharge beyond the confluence of exactly the sum of the two 150 m 3 /s. Q=50m 3 /s Q=150m 3 /s Q=150m 3 /s Q=50m 3 /s Q=150m 3 /s
19 Rainfall also adds water to a stream by both falling into the stream and sheetwash/tributaries from the sides. The discharge at the upstream end of a rain shower will go up by the amount of water added by the rain. At the downstream end of the shower Q goes up by that amount plus the additional water coming from upstream. Beyond the limits of the rain shower the discharge is constant. Q=110m 3 /s Q=120m 3 /s Q=120m 3 /s Q=120m 3 /s Q=120m 3 /s
20 Conversely, during drought the amount of water normally added to the stream by precipitation and springs is cut, and the stream gradually loses discharge as its store of water flows out the downstream end. Notice that the discharge is still constant along its length. Stream at beginning of drought Q=80m 3 /s Q=80m 3 /s Q=80m 3 /s Q=80m 3 /s Same stream during drought Q=80m 3 /s Q=80m 3 /s
21 Recall that some streams (like the Suwannee River) are gaining streams. In these, discharge goes up along the course as springs add water. Incidentally, during periods of low flow most streams become gaining streams. That is why they do not run dry even after prolonged drought. Q=110m 3 /s Q=130m 3 /s Q=150m 3 /s Q=140m 3 /s Q=120m 3 /s Losing streams (like the Colorado River) will see decreasing discharge along their course as water is lost to evaporation and to infiltration. Q=95m 3 /s Q=85m 3 /s Q=75m 3 /s Q=80m 3 /s Q=90m 3 /s
22 So the discharge of a stream changes, if and only if water is added to or removed from that stream.
23 4. What factors affect the velocity (or the speed) of the stream water as if flows?
24 1) Discharge We should make an observation here about discharge and its relationship to velocity. In addition to a greater degree of laminar flow most streams have higher discharge closer to their mouths. As discharge goes up, average velocity also goes up. Remember that this doesn t mean the stream can pick up bigger sediment particles, just that the water is making more downstream progress. Imagine two streams. One is 1m deep and 2m wide and flows at 2m/s (faster). The other is 4m wide and 8m deep, but only flows at 1m/s (slower). Q for the first stream is 1m x 2m x 2m/s = 4m 3 /s. For the second it is 4m x 8m x 1m/s = 32m 3 /s. Even though the second stream moves only half as fast, it carries 8 times as much water. It would, in other words, fill an empty lake 8 times faster, and so in some sense delivers water faster, even though it flows more slowly. It would also deliver sediment faster, though the sediment would be finer-grained. Moment velocity dictates grain size that can be lifted; discharge (and the average velocity attached to it) dictates volume of sediment carried.
25 Given that the discharge of a stream is constant along some stretch of that stream (absent water addition) the characteristics of the channel shape can have a pronounced effect on the flow velocity. Let s look at the discharge equation of this hypothetical stream again: Float moves an average of 20m in 10 seconds (2 m/s) Average Width = 4m Average Depth = 2m Q = w x d x v in this case: Q = 4m x 2m x 2 m/s = 16m 3 /s
26 2) Channel shape Remember that most that streams flow across surfaces of loose sediment create their own widths and depths to minimize the friction of the water against the bed and banks. Imagine that the stream in the previous diagram does exactly that in an upper stretch (left), but then flows into an area of solid rock that is more difficult to erode. The rock now controls how wide and deep the stream can erode (though not how high its level can rise. Gravity does that.) Let s say that the rock constrains the width and depth in this stretch to ½ what it was upstream. Discharge (16m 3 /s) must remain constant. The water that flows into the middle stretch from upstream must flow through at the same rate or else it would pile up to a gravitationally unstable level. Since both w and d decline, in order to keep Q at 16m 3 /s, v must increase from 2m/s to 8m/s. Here is the reason that whitewater raft and kayak courses are in gorges! Q = 4m x 2m x 2 m/s = 16m 3 /s Q = 2m x 1m x 8 m/s = 16m 3 /s Q = 4m x 2m x 2 m/s = 16m 3 /s Once out of the gorge (and free again to create its own form) the stream will return to its stable configuration 4m wide by 2m deep and flowing at 2 m/s.

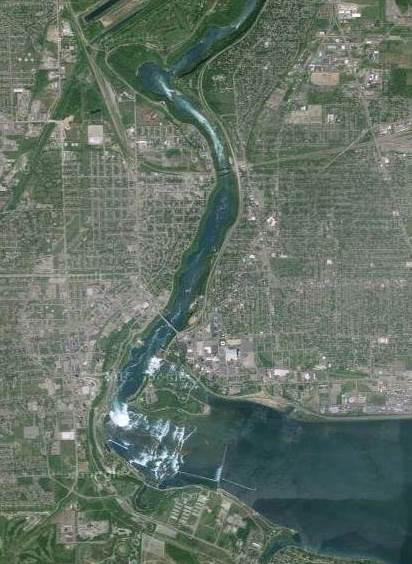
27 1. The Flint River enters the Sprewell Bluff area of Pine Mountain here. The Flint River at Pine Mountain is an excellent example of a stream that does exactly this. N All the way through the mountain the river is in a gorge, and provides a fast and exciting whitewater ride over numerous rapids, including Yellowjacket Shoal. 4. The coarse sediment it entrained on its fast ride through the gorge cannot be carried farther, and so drops as a series of midstream islands here. 3. It leaves the gorge here and slows back to its original velocity.
28
29 Take Home Message 1. Rainwater moves off slopes adjacent to a stream system and into the stream. 2. Near the tops of the slopes the flow is not obviously channelized, but moves as a sheet of water. This is called sheetwash or (less commonly) overland flow. 3. A little farther downslope the flowing water can be seen to have collected into tiny, subtle channels. However, these rills are not particularly evident when rain is not actively falling. 4. Eventually the water collects into small channels that are always obvious, though only carrying water during and for a short time after a rain. These are intermittent channels. 5. The smallest permanent streams join progressively into larger and larger channels. 6. The largest stream in a drainage basin is the trunk for that basin. We will talk more about drainage basins later. 7. The flow through a channel can be laminar (gentle and linear) or turbulent (rougher and with lots of eddies). Most natural stream flow is more or less turbulent, particularly upstream. 8. Discharge is the amount of water that moves past a point in a unit of time. It is usually expressed in cubic meters per second and measured as width x depth x velocity. 9. Discharge will remain constant through a stream s course despite changes in the channel shape and flow velocity. The only way discharge changes within a stream is through the addition or water (from rain, springs, or tributaries) or its loss (through evaporation or infiltration to the ground.) 10. If discharge does increase then depth, width, and velocity ordinarily will all increase. 11. The shape of the channel can influence velocity. Very narrow or very shallow channels make for higher velocity. 12. The velocity of a stream is not the same thing as how fast (or, better, how vigorously) the water moves.
RUNNING WATER AND GROUNDWATER
 NAME RUNNING WATER AND GROUNDWATER I. Introduction In this exercise we will investigate various features associated with streams and groundwater. Our drinking water ultimately comes from either streams
Porous Pavement Flow Paths
 POROUS PAVEMENT MODELING Clear Creek Solutions, Inc., 2010 Porous pavement includes porous asphalt or concrete and grid/lattice systems (nonconcrete) and paving blocks. The use of any of these types of
Ch 18. Hydrologic Cycle and streams. Tom Bean
 Ch 18. Hydrologic Cycle and streams Tom Bean Wednesday s outline 1. the hydrologic cycle reservoirs cycling between them Evaporation and the atmosphere 2. Surface hydrology infiltration and soil moisture
Timing Key Narrative Snapshots a) 00:44 How does groundwater recharge occur? How do streams form?
 00:44 How does groundwater recharge occur? How do streams form?") Module 4 Narration: Runoff and Recharge Timing Key Narrative Snapshots a) 00:44 How does groundwater recharge occur? How do streams form? These processes are closely linked. Lets first investigate how
Module 4 Narration: Runoff and Recharge Timing Key Narrative Snapshots a) 00:44 How does groundwater recharge occur? How do streams form? These processes are closely linked. Lets first investigate how
Dirt and Gravel Roads Assessment Guide
 I. INTRODUCTION 2007-08 Dirt and Gravel Roads Assessment Guide (modified version which removed references to the old GIS system) 1. Assessment purpose: The purpose of an unpaved road assessment is to identify
When it Rains it Pours
 Lesson Summary: Students will understand how water is absorbed into the ground. They will also be able to explain the difference between pervious and impervious surfaces. Students will also learn about
Recommended Resources: The following resources may be useful in teaching this lesson:
 Unit E: Basic Principles of Soil Science Lesson 7: Understanding Soil Erosion and Management Practices Student Learning Objectives: Instruction in this lesson should result in students achieving the following
Chapter 10 Project: Pollution in a Chain of Lakes. Name Name. Background:
 Chapter 0 Project: Pollution in a Chain of Lakes Name Name Background: There are a wide variety of water pollutants, including organic compounds (sewage, for example), inorganic compounds such as radioactive
Measuring Streamflow Lab
 1 Measuring Streamflow Lab Introduction Take a walk down to the banks of your local stream. What do you hear? Is it a lazily flowing river or a gurgling brook? What factors cause the velocity of a stream
Stream Hydrology. Watershed 8/29/13. Area that contributes water to a point on a stream Scale is user-defined Other names: Catchment Drainage basin
 Stream Hydrology Watershed Area that contributes water to a point on a stream Scale is user-defined Other names: Catchment Drainage basin http://warnercnr.colostate.edu/geo/front_range/poudre.php# 1 Basics
Teacher Resources: Watersheds 1. Watershed Mini-Unit
 Teacher Resources: Watersheds 1 Watershed Mini-Unit Main Ideas: Accounts Main Ideas: Structure: The surface water system is connected to the atmospheric system and the groundwater system. Water can exist
River Processes River action (fluvial)
") River action (fluvial) is probably the single most important geomorphic agent and their influence in geomorphology can hardly be overestimated. 1 To understand the complexity associated with river flow
River action (fluvial) is probably the single most important geomorphic agent and their influence in geomorphology can hardly be overestimated. 1 To understand the complexity associated with river flow
Water is everywhere on Earth oceans, glaciers, rivers, lakes, air,
 Section 6.1 6.1 Running Water 1 FOCUS Section Objectives 6.1 Explain how the water cycle circulates Earth s water supply in an unending cycle. 6.2 Explain how the water cycle is kept in balance. 6.3 Describe
Appendix D. Erosion Management Sub- Plan
 Appendix D Erosion Management Sub- Plan DRENNAN SOLAR ENERGY FACILITY EROSION MANAGEMENT PLAN PRODUCED FOR ERM ON BEHALF OF SOLAIREDIRECT BY Simon.Todd@3foxes.co.za JUNE 2013 PURPOSE The purpose of the
Chapter 2: Selecting Best Management Practices (BMPs)
") Chapter 2: Selecting Best Management Practices (BMPs) 2.1 - Temporary versus Permanent BMPs The same level of care should be taken to select both temporary BMPs and permanent BMPs. The same level of care
Chapter 2: Selecting Best Management Practices (BMPs) 2.1 - Temporary versus Permanent BMPs The same level of care should be taken to select both temporary BMPs and permanent BMPs. The same level of care
Velocity and Discharge of Soos Creek and the Green River
 IDS 101 Name Velocity and Discharge of Soos Creek and the Green River We will visit two streams on our field trip: Soos Creek (a small stream) and the Green River (a larger-sized stream). Our purpose will
CHAPTER 13 OUTLINE The Hydrologic Cycle and Groundwater. Hydrologic cycle. Hydrologic cycle cont.
 CHAPTER 13 OUTLINE The Hydrologic Cycle and Groundwater Does not contain complete lecture notes. To be used to help organize lecture notes and home/test studies. Hydrologic cycle The hydrologic cycle is
Chapter 3 Stream Discharge
 Chapter 3 Stream Discharge - Introductory Level Volunteer Water Quality Monitoring Training Notebook - What is Discharge (Flow)? Discharge, also called flow, is the amount of water that flows past a given
TEKS Lesson 7.8C: Effects of Human Activity on Surface Water and Groundwater
 Class ----- Date -------- TEKS Lesson 7.SC TEKS 7.8e Model the effects of human activity on groundwater surface water in a watershed. and TEKS Lesson 7.8C: Effects of Human Activity on Surface Water and
VI-1. The Water Cycle What is the water cycle? evaporate condenses surface runoff ground water
 Classroom Copy VI-1. The Water Cycle What is the water cycle? Did you know that the water we see all around us never gets destroyed, and new water never gets created? Instead, it constantly recycles and
Lab 3: Conservation Equations and the Hydraulic Jump
 Lab 3: Conservation Equations and the Hydraulic Jump CEE 330 - Fall 20 SAFETY The major safety hazard in this laboratory is a shock hazard. Given that you will be working with water and items running on
Pre-Event Activities. Blue River. Pre Field Trip Suggestions
 Blue River Have you heard we all live in a watershed? Well, it is true! This total body activity will allow students to demonstrate how water flows in a watershed while exploring how seasonal variations
CHANGES IN STREAM FLOW WITHIN A LINEAR CHANNEL
 CHANGES IN STREAM FLOW WITHIN A LINEAR CHANNEL Robert M. Johnson, Department of Earth Sciences Student, University of South Alabama, Mobile, AL 36688. E-mail: rmj702@jagmail.southalabama.edu. In this study,
WATERSHEDS. Env. Science and Ecology Standards 4.1
 WATERSHEDS Env. Science and Ecology Standards 4.1 WATER, WATER EVERYWHERE, BUT. Earth is known as the blue planet: 70% of the Earth s surface is covered in water. The Earth and its atmosphere contain ~336million
Water Budget III: Stream Flow P = Q + ET + G + ΔS
 Water Budget III: Stream Flow P = Q + ET + G + ΔS Why Measure Streamflow? Water supply planning How much water can we take out (without harming ecosystems we want to protect) Flood protection How much
Water Budget III: Stream Flow P = Q + ET + G + ΔS
 Water Budget III: Stream Flow P = Q + ET + G + ΔS Why Measure Streamflow? Water supply planning How much water can we take out (without harming ecosystems we want to protect) Flood protection How much
Understanding Soil Erosion and Management Practices
 Lesson C6 8 Understanding Soil Erosion and Management Practices Unit C. Plant and Soil Science Problem Area 6. Basic Principles of Soil Science Lesson 8. Understanding Soil Erosion and Management Practices
River Channel Characteristics
 River Channel Characteristics Storages and Transfers in Drainage Basins Precipitation Evapotranspiration SURFACE STORAGE INTERCEPTION STORAGE CHANNEL STORAGE Soil Moisture Storage Aeration Zone Storage
Water Budget III: Stream Flow P = Q + ET + G + ΔS
 Water Budget III: Stream Flow P = Q + ET + G + ΔS Why Measure Streamflow? Water supply planning How much water can we take out (without harming ecosystems we want to protect) Flood protection How much
Definitions 3/16/2010. GG22A: GEOSPHERE & HYDROSPHERE Hydrology
 GG22A: GEOSPHERE & HYDROSPHERE Hydrology Definitions Streamflow volume of water in a river passing a defined point over a specific time period = VxA discharge m 3 s -1 Runoff excess precipitation - precipitation
Unit E: Basic Principles of Soil Science. Lesson 7: Understanding Soil Erosion and Management Practices
 Unit E: Basic Principles of Soil Science Lesson 7: Understanding Soil Erosion and Management Practices 1 Important Terms Accelerated erosion Conservation tillage Cover crops Diversion ditches Geologic
Water Budget III: Stream Flow P = Q + ET + G + ΔS
 Water Budget III: Stream Flow P = Q + ET + G + ΔS Why Measure Streamflow? Water supply planning How much water can we take out (without harming ecosystems we want to protect) Flood protection How much
BUILDING A WATERSHED MODEL
 BUILDING A WATERSHED MODEL OBJECTIVES Define a watershed and describe how it functions Identify that students live in a watershed within the San Antonio River Basin TOPICS Watersheds Runoff TEKS ALIGNMENT
Izaak Walton League Creek Freaks Physical Observations and Measurements Procedures
 Izaak Walton League Creek Freaks Physical Observations and Measurements Procedures Materials o Boots o Rope o Tape Measure o Yard stick o Clothes pins o Timer o Data sheet on clip board with pencil o GPS
Construction. Analysis. Hydrographs
 Construction And Analysis Of Hydrographs Hydrographs Special graphs that show a changes in a river s discharge over a period of time, usually in relation to a rainfall event. River Discharge Is the amount
Bioreactors Prof G. K. Suraishkumar Department of Biotechnology Indian Institute of Technology, Madras. Lecture - 02 Sterilization
 Bioreactors Prof G. K. Suraishkumar Department of Biotechnology Indian Institute of Technology, Madras Lecture - 02 Sterilization Welcome, to this second lecture on Bioreactors. This is a mooc on Bioreactors.
River Talk Patterns. Student Copy Page PART I (1 of 1) 3. Human nervous system. Waters and drainage patterns. Road system.
 3. Human nervous system. Waters and drainage patterns. Road system.") River Talk Patterns Student Copy Page PART I (1 of 1) 3 Human nervous system photo credit: Hemera Thinkstock Photos Waters and drainage patterns photo credit: Comstock Getty Images Road system photo credit:
River Talk Patterns Student Copy Page PART I (1 of 1) 3 Human nervous system photo credit: Hemera Thinkstock Photos Waters and drainage patterns photo credit: Comstock Getty Images Road system photo credit:
UNIT HYDROGRAPH AND EFFECTIVE RAINFALL S INFLUENCE OVER THE STORM RUNOFF HYDROGRAPH
 UNIT HYDROGRAPH AND EFFECTIVE RAINFALL S INFLUENCE OVER THE STORM RUNOFF HYDROGRAPH INTRODUCTION Water is a common chemical substance essential for the existence of life and exhibits many notable and unique
Training on Roads for Water and Resilience
 Training on Roads for Water and Resilience 1 DRAINAGE FROM UNPAVED ROADS Outline 3 1. 2. 3. 4. 5. 6. 7. Introduction Important considerations Drainage management Surface drainage features Subsurface drainage
Best Practices for Building High-Performance Resource Roads. Road Drainage. Developed by: The Roads and Infrastructure Group
 Best Practices for Building High-Performance Resource Roads Road Drainage Developed by: The Roads and Infrastructure Group THIS GUIDE IS INTENDED FOR EQUIPMENT OPERATORS CONSTRUCTION CONTRACTORS FIELD
WinTR-55 Small Watershed Hydrology
 WinTR-55 Small Watershed Hydrology Intermediate WinTR-55 Training Modeling Watersheds with Structures SEE NOTES AT CLASS EXERCISE #4. 1 Course Outline Overview Review of Hydrology Terms Modeling Single
Conserve to Enhance: Linking Water Conservation to the Environment
 Conserve to Enhance Webinar Presentation Notes February 22, 2012 Conserve to Enhance: Linking Water Conservation to the Environment Thank you for your interest in Conserve to Enhance and this presentation.
groundwater. Because watersheds are complex systems, each tends to respond differently to natural or human activities.
 The private development of Altos del María is located at an altitude between 550 and 1,000 meters above sea level in the environmentally sensitive Cordillera Central of Panama that separates the Pacific
Freshwater. 260 Points Total
 9 SURFACE WATER SECTION 9.1 Surface Water Movement In your textbook, read about surface water and the way in which it moves sediment. Complete each statement. (13 points) 1. An excessive amount of water
Multiple Regression. Dr. Tom Pierce Department of Psychology Radford University
 Multiple Regression Dr. Tom Pierce Department of Psychology Radford University In the previous chapter we talked about regression as a technique for using a person s score on one variable to make a best
Review of Chapter 1. Taken from: Check Your Understanding sections p. 13, 21 and 33
 Review of Chapter 1 Taken from: Check Your Understanding sections p. 13, 21 and 33 In case you were curious: Henry Hudson The Last Voyage of Henry Hudson, 1611 Painted in 1880 by: John Collier Today Hudson
Chapter 2 Site Selection
 Chapter 2 Site Selection Before you start monitoring water quality, you must first select a site to monitor. This chapter will explore many factors for selecting an appropriate stream site to monitor.
The Hydrosphere. Introduction To Surface Water. What Do You Think?
 Introduction To Surface Water Unit Essential Questions: How does the Earth cycle its water through its major reservoirs? How does society s use of resources affect water quality? Presentation Objectives:
2. Action plan tasks. These tasks are more complicated and cannot be easily completed without good thought and planning. These are some examples:
 Tool 4 For Effective Action Plans, GAS IT At the most basic level, a manager s job is to get stuff done. The management part comes into play because a manager must get stuff done by directing the actions
Online Student Guide Types of Control Charts
 Online Student Guide Types of Control Charts OpusWorks 2016, All Rights Reserved 1 Table of Contents LEARNING OBJECTIVES... 4 INTRODUCTION... 4 DETECTION VS. PREVENTION... 5 CONTROL CHART UTILIZATION...
Science 8 Chapter 1 Section 1
 Science 8 Chapter 1 Section 1 Distribution of Water (pp. 8-13) How much fresh water do we have? The vast majority of water on Earth, about 97 percent, is salt water Two thirds of that fresh water supply
W A T E R F O R L I F E
 Module 4 The Hydrological Cycle Disclaimer: The contents of this presentation include original content as well as items compiled from a variety of sources. Though the sources are not attributed individually,
Science in the Schoolyard Guide: FOSS California Water Planet. Investigation 3 Evaporation Locations
 Water Planet Water Planet > Investigation 3: Water Vapor > Part 2: Evaporation Locations, page 120 Evaporation Locations Following Part 2, take students outside to expand this investigation. Refer to the
PROJECT SCREENING MATRIX: A User s Guide
 Version 2.0 Page 1 of 7 November 9, 2010 PROJECT SCREENING MATRIX: A User s Guide BACKGROUND The Project Screening Matrix (Screening Matrix) is one of several tools that comprise the River Restoration
Module 8: Weathering, Erosion, and Groundwater Topic 5 Content: The Water Cycle Presentation Notes. The Water Cycle
 The Water Cycle 1 Imagine taking a trip around the water cycle as a single drop of water. This cycle has no beginning or ending point, so it does not matter where the trip starts. Since over 70% of the
Brackitz Ramps I Engineering Lesson Grades K-2
 Objective: Brackitz Ramps I Engineering Lesson Grades K-2 Students will design ramps and observe how the slope and length of a ramp affects the speed of a ball traveling down the ramp. Each ramp must have
Androscoggin Lake's Outlet Delta System, Maine
 Maine Geologic Facts and Localities April, 2005 Androscoggin Lake's Outlet Delta System, Maine 44 19 27.86 N, 70 5 3.15 W Text by Daniel B. Locke, Department of Agriculture, Conservation & Forestry 1 Introduction
STELLA Assignment #2 - BOD
 STELLA Assignment #2 - BOD 1) In this problem, you will be tracking the biochemical oxygen demand (BOD) impact of a waste discharged from the Watapiti waste facility. The plant discharges 7.5 x 10 5 liters/day
East Maui Watershed Partnership Adapted from Utah State University and University of Wisconsin Ground Water Project Ages 7 th -Adult
 INTRODUCTION What is groundwater? Water contained in saturated soil and rock materials below the surface of the earth. It is not NEW water, but is recycled water through the hydraulic cycle. The source
STREAM EROSION. The Activity
 1 STREAM EROSION Erosion is an ongoing process on all bodies of water, especially moving water. Both natural and humancaused factors affect the amount of erosion a stream may experience. Natural factors
Introduction. Keywords: Oil Palm, hydrology, HEC-HMS, HEC-RAS. a * b*
 The Effect of Land Changes Towards in Sg. Pandan Perwira Bin Khusairi Rahman 1,a* and Kamarul Azlan bin Mohd Nasir 1,b 1 Faculty of Civil Engineering, Universiti Teknologi Malaysia, Malaysia a * wirakhusairirahman@gmail.com,
FORM B: DAMMING AND DIVERSION OF WATER
 APPLICATION FOR RESOURCE CONSENT FORM B: DAMMING AND DIVERSION OF WATER NOTES Resource use activities must meet all the conditions of any relevant Permitted Activity Rules in the Waikato Regional Plan
The Hydrological Cycle
 Hydrological Cycle The Hydrological Cycle What is the Hydrological Cycle? Hydrological cycle = The Water cycle What is precipitation, evaporation and condensation? Evaporation = Liquid to Gas (gains energy)
Analyzing Groundwater
 Analyzing Groundwater SUBJECTS: Science GRADE LEVELS: 7 th DURATION: approximately two 60 minute periods ACTIVITY SUMMARY: Students will compare the properties of different soil types including texture
Temporary Watercourse Crossing: Culverts
 Temporary Watercourse Crossing: Culverts DRAINAGE CONTROL TECHNIQUE Low Gradient Velocity Control Short Term Steep Gradient Channel Lining Medium-Long Term Outlet Control Soil Treatment Permanent Symbol
The Drainage Basin System
 The Drainage Basin System These icons indicate that teacher s notes or useful web addresses are available in the Notes Page. This icon indicates that the slide contains activities created in Flash. These
This PowerPoint presentation can be downloaded from Ditch_10.asp. Slide 1. Slide 2
 Slide 1 This PowerPoint presentation can be downloaded from http://ei.cornell.edu/watersheds/ditches/ Ditch_10.asp. Roadside Ditches A Watershed Curriculum Module Rebecca Schneider, Nancy Trautmann, &
Ousel Falls Interpretive Trail
 Ousel Falls Interpretive Trail Gallatin River Task Force Big Sky Community Organization gallytaskforce gallatinrivertaskforce bsco_mt WELCOME TO OUSEL FALLS Join us for an interpretive walk focused on
FAST WATER / SLOW WATER AN EVALUATION OF ESTIMATING TIME FOR STORMWATER RUNOFF
 FAST WATER / SLOW WATER AN EVALUATION OF ESTIMATING TIME FOR STORMWATER RUNOFF Factors Affecting Stormwater Runoff: Rainfall intensity % Impervious surfaces Watershed size Slope Soil type, soil compaction
SOUTH BRANCH SUBWATERSHED
 SOUTH BRANCH SOUTH BRANCH SUBWATERSHED The South Branch Subwatershed includes the South Branch drainage area plus all the drainage area along the main stream to the south from the mouth of Surrena Run
Managing furrow irrigation
 Section K Managing furrow irrigation The goal of every surface irrigator should be to apply the right amount of water as uniformly as possible to meet the crop needs and minimize leaching of nitrogen from
GROUNDWATER. Narrative
 GROUNDWATER Narrative BIG IDEAS: Groundwater. is between the grains of sand and gravel.. moves because gravity works underground just like it does above ground.. is connected to surface water. 4. is part
Stream Reaches and Hydrologic Units
 Chapter United States 6 Department of Agriculture Natural Resources Conservation Service Chapter 6 Stream Reaches and Hydrologic Units Rain clouds Cloud formation Precipitation Surface runoff Evaporation
Water Resources Engineering. Prof. R. Srivastava. Department of Water Resources Engineering. Indian Institute of Technology, Kanpur.
 Water Resources Engineering Prof. R. Srivastava Department of Water Resources Engineering Indian Institute of Technology, Kanpur Lecture # 13 Today we will continue to discuss some of the abstractions
Groundwater Flow Demonstration Model Activities for grades 4-12
 Groundwater Flow Demonstration Model Activities for grades 4-12 NR/WQ/2012-5 SET-UP Please allow time to practice using the groundwater model before conducting demonstrations. 1. Remove the groundwater
Temporary Watercourse Crossing: Fords
 Temporary Watercourse Crossing: Fords DRAINAGE CONTROL TECHNIQUE Low Gradient Velocity Control Short Term Steep Gradient Channel Lining Medium-Long Term Outlet Control Soil Treatment Permanent [1] [1]
PROJECT SCOPE OF WORK CITY OF TOWN AND COUNTRY STORMWATER PROGRAM
 PROJECT SCOPE OF WORK CITY OF TOWN AND COUNTRY STORMWATER PROGRAM Project Name: 194 Muir Woods Ln Project ID Number: 216-2 Problem: At 194 Muir Woods Lane, nearly two acres of watershed flow through the
General Groundwater Concepts
 General Groundwater Concepts Hydrologic Cycle All water on the surface of the earth and underground are part of the hydrologic cycle (Figure 1), driven by natural processes that constantly transform water
An Investigation into the 2012 drought on Apalachicola River. Steve Leitman, Bill Pine and Greg Kiker
 An Investigation into the 2012 drought on Apalachicola River Steve Leitman, Bill Pine and Greg Kiker Apalachicola-Chattahoochee-Flint (ACF) River basin 20,400 sq. mi. One of the most actively disputed
Hydro Electric Power (Hydel Power)
") Operating Principle Hydro Electric Power (Hydel Power) Hydro-electric power is generated by the flow of water through turbine, turning the blades of the turbine. A generator shaft connected to this turbine
Operating Principle Hydro Electric Power (Hydel Power) Hydro-electric power is generated by the flow of water through turbine, turning the blades of the turbine. A generator shaft connected to this turbine
LID PLANTER BOX MODELING
 LID PLANTER BOX MODELING Clear Creek Solutions, Inc., 2010 Low Impact Development (LID) planter boxes are small, urban stormwater mitigation facilities. They are rain gardens in a box. WWHM4 provides the
Glossary of Terms. Aquifer A permeable body of rock capable of yielding quantities of groundwater to wells and springs.
 Glossary of Terms 100-year flood A large, but infrequent, flood event that has a 1% chance of occurring in any given year (occurs, on average, once every 100 years). 100-year floodplain Areas adjacent
COMPUTER SIMULATION OF ENZYME KINETICS
 COMPUTER SIMULATION OF ENZYME KINETICS I. Introduction. Enzymes are biological catalysts. A catalyst alters the speed at which a chemical reaction reaches its completion or equilibrium point. It does not
Names: ESS 315. Lab #6, Floods and Runoff Part I Flood frequency
 Names: ESS 315 Lab #6, Floods and Runoff Part I Flood frequency A flood is any relatively high flow of water over land that is not normally under water. Floods occur at streams and rivers but can also
SteamDestroyer. The Ultimate Guide to Free Steam Games
 SteamDestroyer The Ultimate Guide to Free Steam Games Table of Contents I. What you can expect II. Requirement III. General Method Overview Steam Gifts IV. General Method Overview - TF2 Keys V. Steam Keys
Phosphorus carried by small culverts into Cusheon Lake, Salt Spring Island.
 Phosphorus load, kilograms per day Phosphorus carried by small into Cusheon Lake, Salt Spring Island. by John B. Sprague, Sprague Associates Ltd., Salt Spring Island, B.C. V8K 2L7 Background Report for
GCSE BITESIZE Examinations
 GCSE BITESIZE Examinations General Certificate of Secondary Education Geography Extended Marking Scheme Higher Level Time Allowed: 2 hours Answer all questions in the spaces provided Total marks for the
QU: How do human activities disrupt drainage basin processes. AIM: To example and explain the above through examining human uses of the Amazon basin.
 QU: How do human activities disrupt drainage basin processes. AIM: To example and explain the above through examining human uses of the Amazon basin. ST: Answer the How many countries is the basin part
Section 208. SOIL EROSION AND SEDIMENTATION CONTROL
 208.01 Section 208. SOIL EROSION AND SEDIMENTATION CONTROL 208.01. Description. This work consists of installing and maintaining erosion and sedimentation controls to minimize soil erosion and control
LAKE COUNTY HYDROLOGY DESIGN STANDARDS
 LAKE COUNTY HYDROLOGY DESIGN STANDARDS Lake County Department of Public Works Water Resources Division 255 N. Forbes Street Lakeport, CA 95453 (707)263-2341 Adopted June 22, 1999 These Standards provide
Application for resource consent Form B Damming and diversion of water
 Application for resource consent Form B Damming and diversion of water Notes Resource use activities must meet all the conditions of any relevant Permitted Activity Rules in the Waikato Regional Plan or
Activity 1: Flood Storage
 Activity 1: Flood Storage Overview Background Students will observe how different soil components peat, sand, gravel, and potting soil vary in their capacity to absorb and hold water. They will observe
What Are Floods? Floods 3 5 Flood Science LESSON PLAN 2. Key Terms and Concepts. Purpose. Objectives. Activities
 Flood Science The relationship of floods to the hydrologic cycle, terrain and types of soil can help children understand the risk of flood. Key Terms and Concepts flash flood flood flood plain flood stage
Designing Information Devices and Systems I Spring 2018 Lecture Notes Note Interpretation: Water Reservoirs and Pumps
 EES 6 Designing Information Devices and Systems I Spring Lecture Notes Note 5 5. Interpretation: Water Reservoirs and Pumps One way of visualizing matrix-vector multiplication is by considering water reservoirs
3rd Year Geography Higher Level
 3rd Year Geography Higher Level Rivers No part of this publication may be copied, reproduced or transmitted in any form or by any means, electronic, mechanical, photocopying, recording, or otherwise, without
Introduction to Erosion Control & Shoreland Property Management Part 1
 Introduction to Erosion Control & Shoreland Property Management Part 1 What is erosion on a lakeshore? 2014 Wisconsin Lakes Partnership Convention Quita Sheehan, Vilas County Conservation Specialist Talking
Building a Watershed Model
 9 Building a Watershed Model Purpose Students will build a model to identify the characteristics of a watershed. Students will learn how elevation determines the flow of water within a watershed. Overview
The critical information from this document has been included in the ARD Pipe Help system.
 Introduction This command is used to set the way is treated with respect to Pipe flow. There are three (3) methods, along with the ability to change the method on existing networks. flows have always been
Module 2, Add on Lesson Turbidity Sensor. Student. 90 minutes
 Module 2, Add on Lesson Turbidity Sensor Student 90 minutes Purpose Construct a sensor to measure the turbidity of water Graph data and reason about curves and linear relationships Calibrate the turbidity
Flood Plain Functions
 Flood Plain Functions Lesson Abstract Summary: MO GLE: Subject Areas: Students will connect knowledge from previous watershed lessons to understand the functions of flood plains by participating in group