Nigeria s Infrastructure: A Continental Perspective
|
|
|
- Claude Dixon
- 6 years ago
- Views:
Transcription
1 Public Disclosure Authorized Public Disclosure Authorized Public Disclosure Authorized Public Disclosure Authorized COUNTRY REPORT Nigeria s Infrastructure: A Continental Perspective Vivien Foster and Nataliya Pushak FEBRUARY 2011
2 2011 The International Bank for Reconstruction and Development / The World Bank 1818 H Street, NW Washington, DC USA Telephone: Internet: feedback@worldbank.org All rights reserved A publication of the World Bank. The World Bank 1818 H Street, NW Washington, DC USA The findings, interpretations, and conclusions expressed herein are those of the author(s) and do not necessarily reflect the views of the Executive Directors of the International Bank for Reconstruction and Development / The World Bank or the governments they represent. The World Bank does not guarantee the accuracy of the data included in this work. The boundaries, colors, denominations, and other information shown on any map in this work do not imply any judgment on the part of The World Bank concerning the legal status of any territory or the endorsement or acceptance of such boundaries. Rights and permissions The material in this publication is copyrighted. Copying and/or transmitting portions or all of this work without permission may be a violation of applicable law. The International Bank for Reconstruction and Development / The World Bank encourages dissemination of its work and will normally grant permission to reproduce portions of the work promptly. For permission to photocopy or reprint any part of this work, please send a request with complete information to the Copyright Clearance Center Inc., 222 Rosewood Drive, Danvers, MA USA; telephone: ; fax: ; Internet: All other queries on rights and licenses, including subsidiary rights, should be addressed to the Office of the Publisher, The World Bank, 1818 H Street, NW, Washington, DC USA; fax: ; pubrights@worldbank.org.
3 About AICD and its country reports This study is a product of the Africa Infrastructure Country Diagnostic (AICD), a project designed to expand the world s knowledge of physical infrastructure in Africa. The AICD provides a baseline against which future improvements in infrastructure services can be measured, making it possible to monitor the results achieved from donor support. It also offers a solid empirical foundation for prioritizing investments and designing policy reforms in Africa s infrastructure sectors. The AICD is based on an unprecedented effort to collect detailed economic and technical data on African infrastructure. The project has produced a series of original reports on public expenditure, spending needs, and sector performance in each of the main infrastructure sectors, including energy, information and communications technologies, irrigation, transport, and water and sanitation. Africa s Infrastructure A Time for Transformation, published by the World Bank and the Agence Française de Développement in November 2009, synthesized the most significant findings of those reports. The focus of the AICD country reports is on benchmarking sector performance and quantifying the main financing and efficiency gaps at the country level. These reports are particularly relevant to national policy makers and development partners working on specific countries. The AICD was commissioned by the Infrastructure Consortium for Africa following the 2005 G8 (Group of Eight) summit at Gleneagles, Scotland, which flagged the importance of scaling up donor finance for infrastructure in support of Africa s development. The first phase of the AICD focused on 24 countries that together account for 85 percent of the gross domestic product, population, and infrastructure aid flows of Sub-Saharan Africa. The countries are: Benin, Burkina Faso, Cape Verde, Cameroon, Chad, Côte d Ivoire, the Democratic Republic of Congo, Ethiopia, Ghana, Kenya, Lesotho, Madagascar, Malawi, Mozambique, Namibia, Niger, Nigeria, Rwanda, Senegal, South Africa, Sudan, Tanzania, Uganda, and Zambia. Under a second phase of the project, coverage was expanded to as many of the remaining African countries as possible. Consistent with the genesis of the project, the main focus is on the 48 countries south of the Sahara that face the most severe infrastructure challenges. Some components of the study also cover North African countries so as to provide a broader point of reference. Unless otherwise stated, therefore, the term Africa is used throughout this report as a shorthand for Sub-Saharan Africa. The World Bank has implemented the AICD with the guidance of a steering committee that represents the African Union, the New Partnership for Africa s Development (NEPAD), Africa s regional economic communities, the African Development Bank (AfDB), the Development Bank of Southern Africa (DBSA), and major infrastructure donors.

,")
.")


4 Financing for the AICD is provided by a multidonor trust fund to which the main contributors are the United Kingdom s Department for International Development (DFID), the Public Private Infrastructure Advisory Facility (PPIAF), Agence Française de Développement (AFD), the European Commission, and Germany s Entwicklungsbank (KfW). A group of distinguished peer reviewers from policy-making and academic circles in Africa and beyond reviewed all of the major outputs of the study to ensure the technical quality of the work. The Sub-Saharan Africa Transport Policy Program and the Water and Sanitation Program provided technical support on data collection and analysis pertaining to their respective sectors. The data underlying AICD s reports, as well as the reports themselves, are available to the public through an interactive Web site, that allows users to download customized data reports and perform various simulations. Many AICD outputs will appear in the World Bank s Policy Research Working Papers series. Inquiries concerning the availability of data sets should be directed to the volume editors at the World Bank in Washington, DC.
5 Contents Synopsis A continental perspective Why infrastructure matters The state of Nigeria s infrastructure Roads Rail Ports Air transport Water supply and sanitation Power Water resources Information and communications technologies Financing Nigeria s infrastructure How much more can be done within the existing resource envelope? Annual funding gap What else can be done? References and bibliography iii Acknowledgments This paper draws upon a wide range of contributions from sector specialists from the Africa Infrastructure Country Diagnostic Team; notably, Dick Bullock on railways, Mike Mundy on ports, Heinrich Bofinger on air transport, Rupa Ranganathan on power, Carolina Dominguez on water and sanitation, Michael Minges and Rebecca Meyer on information and communication technologies, Alberto Nogales on roads, Nataliya Pushak on public expenditure, and Alvaro Federico Barra on spatial analysis. The paper is based on data collected by local consultants and benefited greatly from feedback provided by colleagues in the relevant World Bank country teams; notably, Onno Ruhl (Country Director), Shobha Shetty (Sector Leader), Mavis Ampah (ICT), Francois Onimus (irrigation), Prasad Tallapragada and Waqar Haider (power), Pierre Pozzo di Borgo (railways), Binyam Reja and Justin Runji (roads), Hassan Kida and Andrew Makokha (water). iii
6 Synopsis Infrastructure has made a net contribution of around 1 percentage point to Nigeria s improved per capita growth performance in recent years, in spite of the fact that unreliable power supply held growth back. Raising the country s infrastructure endowment to that of the region s middle-income countries could boost annual growth by around 4 percentage points. Nigeria has made important strides toward improving much of its infrastructure. Compared to many African peers, Nigeria has relatively advanced power, road, rail, and information and communications technology (ICT) networks that cover extensive areas of the nation s territory. In recent years, Nigeria has conducted several important infrastructure sector reforms. The ports sector has been converted to a landlord model, and terminal concessions now attract private investment on a scale unprecedented for Africa. The power sector is undergoing a restructuring, paving the way for performance improvements; the sector is finally on a path toward raising tariffs to recover a larger share of costs. Bold liberalization measures in the ICT sector have resulted in widespread, low-cost mobile services, Africa s most vibrant fixed-line sector, and major private investments in the development of a national fiber-optic backbone. A burgeoning domestic air transport sector has emerged, with strong private carriers that have rapidly attained regional significance. But worrisome challenges persist in a number of areas, and loom the largest in the power sector. Inoperative generation capacity and lack of investment mean that the country has been able to meet only about half of its power demand. This, in turn, has resulted in an extremely unreliable supply; social costs can be conservatively estimated at 3.7 percent of gross domestic product (GDP). Meanwhile, the sector is hemorrhaging resources: historically, power users have been charged a fraction of the true cost of production, and the utility s operational efficiency is among the worst in Africa. On a promising note, recent tariff and institutional reforms in the power sector have helped to significantly reduce hidden costs, saving about $1.3 billion (or 1.8 percent of GDP) per year. Notwithstanding this important gain, however, the hidden costs of Nigeria s power sector remain the highest in West Africa. Less visible, but also disturbing, is the water and sanitation sector s lack of development, compared to other services. Piped water coverage is only a fraction of the nation s electrification rate, and access has been declining steeply in recent years, even as the practice of open defecation continues to rise. Moreover, water utilities appear no more efficient than the power utility. Irrigation development also remains low relative to the country s substantial potential. Last but not least, Nigeria s road networks are in relatively poor condition, testifying that assets are not being adequately maintained. The country s poor air transport safety record is reason for further concern. Addressing Nigeria s infrastructure challenges will require sustained expenditure of almost $14.2 billion per year over the next decade, or about 12 percent of GDP. (As a point of comparison, China spent about 15 percent of GDP on just infrastructure investment in the mid-2000s.) About $10.5 billion is needed for federal infrastructure alone, most of it for capital spending and power. Nigeria already spends $5.9 billion per year on federal infrastructure, equivalent to about 5 percent of GDP. Existing spending patterns are heavily skewed toward investment, with little provision for
7 operations and maintenance. (Information on the infrastructure spending of subnational governments was not available, and so could not be assessed.) A further $2.5 billion a year is being lost at the federal level due to inefficiencies of various kinds, most of them associated with the power sector. The underpricing of electricity is by far the single-largest source of inefficiency, even though cost-recovery tariffs would be affordable for the majority of the population. Low capital budget execution is also an issue across the infrastructure sector. When spending needs are set against current spending and potential efficiency gains an annual funding gap of $3.6 billion per year, or around 3 percent of GDP, is revealed. With its abundant oil revenues, Nigeria is relatively well placed to raise additional public finance for infrastructure. Given the size of the economy, more could also be done to leverage domestic capital markets, and there is scope to build on the comparative success of public-private partnerships. Nigeria has also attracted much interest from financiers outside the Organisation for Economic Co-operation and Development (non-oecd), notably China. In sum, Nigeria s infrastructure challenges, though substantial, are not daunting given the strength of the national economy. While recent policy measures suggest that the government is taking these challenges seriously, more remains to be done. The associated growth dividend is well worth pursuing. A continental perspective The Africa Infrastructure Country Diagnostic (AICD) has gathered and analyzed extensive data on infrastructure in more than 40 Sub-Saharan countries, including Nigeria. The results have been presented in reports covering different areas of infrastructure (ICT, irrigation, power, transport, water and sanitation) and policy (including investment needs, fiscal costs, and sector performance). This report presents key AICD findings for Nigeria, with the aim of benchmarking the country s infrastructure conditions against those of its African peers. Two peer groups are considered in the analysis of Nigeria s performance: (i) resource-rich, low-income countries and (ii) middle-income countries. Where possible and relevant, Nigeria s performance is compared with that of countries in other developing regions, such as Asia. Detailed comparisons will also be made with immediate neighbors in the Economic Community of West African States (ECOWAS). Several methodological issues should be borne in mind. First, because of the cross-country nature of data collection, a time lag is inevitable. The period covered by the AICD runs from 2001 to Most technical data presented are for 2006 (or the most recent year available), while financial data are typically averaged over the available period to smooth out the effects of short-term fluctuations. Second, when making comparisons across countries, we had to standardize the indicators and analyses to ensure their correspondence. This means that some of the indicators presented here may be slightly different from those that are routinely reported and discussed at the country level. 2
8 Why infrastructure matters As in the rest of the continent, West Africa s growth performance improved markedly between the 1990s and 2000s. The overall improvement in per capita growth rates has been estimated at just under 2 percentage points, of which 1.1 percent is attributable to better structural policies and 0.9 percent to improved infrastructure. During the decade , Nigeria s economy grew at an average annual rate of over 5 percent. Improvements in infrastructure added 1 percentage point to Nigeria s per capita growth rate for the period 2003 to 2007 (figure 1a). Interestingly, the impact was not as large as in neighboring West African countries such as Benin, Côte d Ivoire, and Senegal. We should note that the boost to Nigeria s growth came almost exclusively from the ICT revolution. Meanwhile, Nigeria s power sector held the per capita growth rate back by 0.13 percentage points over the same period. Raising Nigeria s infrastructure to the level of the African leader, Mauritius, would boost annual per capita growth rates by 4 percentage points, according to simulations. About half of this potential impact is associated with improvements in the power sector, which would contribute as much as 2 percentage points to the per capita growth rate (figure 1b). Overall, evidence from enterprise surveys suggests that infrastructure constraints are responsible for about 40 percent of the productivity handicap faced by African firms. Figure 1. Infrastructure has contributed much to economic growth but could contribute more a. Infrastructure s contribution to annual per capita economic growth in select countries, , in percentage points 3
9 b. Potential contribution of infrastructure to annual per capita economic growth in select countries, in percentage points Source: Calderón The state of Nigeria s infrastructure The spatial distribution of Nigeria s economy shows marked differences between north and south. The south is characterized by relatively high population density, and this is where many of the country s cities and larger towns are clustered (figure 2a, b). Meanwhile, there is an important concentration of both population and agricultural activity in the north of the country (figure 2a, c). What is particularly striking is how rapidly the incidence of poverty rises with distance from the coast. While poverty rates in the coastal states are typically under 40 percent, they rise above 70 percent in many parts of central Nigeria and particularly in the far north (figure 2b). Relative to other African countries, the development of agriculture is pronounced: there are relatively few areas of agricultural potential that are not already being tapped (figure 2d). This is true across the national territory and is particularly so in the north. The bulk of the national territory lies squarely in the Niger River basin, which is shared by a number of neighboring countries (figure 2c). Although Nigeria s infrastructure networks mirror the spatial concentration of economic activity in the south, the country (unlike some of its neighbors) has developed infrastructure backbones that are national in reach (figures 3a d). Few areas remain unconnected to national backbones, and those few are generally concentrated in the central west and east of the country (figures 3a d). That said, road network conditions are quite patchy, adversely affecting national connectivity. The conditions of many key routes alternate between good, fair, and poor across different sections (figure 3a). The national power transmission network is national; almost all major generation assets are on the interconnected system. While the global system for mobile communications (GSM) coverage is widespread, coverage gaps are more prevalent in the northern part of the country (figure 3c). Despite high levels of agricultural activity, irrigated areas are very limited and mainly flank river corridors, particularly in the north and northeast (figure 3d). 4
10 In terms of regional integration, the picture is mixed. Nigeria is connected to the South Atlantic 3 (SAT-3), MAIN-1, and Glo-1 submarine cables skirting the west coast of Africa, but lacks fiber-optic land links with its neighbors (figure 3c). There are five points where Nigeria s national road network intersects with the regional one: the east-west coastal routes and a handful of corridors to the landlocked hinterland. As far as power is concerned, there is the longstanding interconnector with Niger, to the north; there are plans to interconnect with Benin and Niger in the context of the West Africa Power Pool (WAPP); but there is no interconnection with Cameroon, to the east. The West Africa Gas Pipeline links Ghana to Nigeria and allows the export of gas for power generation. Table 1. Achievements and challenges in Nigeria s infrastructure sectors Air transport Achievements Recent expansion of domestic market Emergence of important regional carriers New routes to Europe and the United States Significant improvements in safety oversight Challenges Developing potential as regional air transport hub Concessioning of airport terminals ICT Ports Power Extensive low-cost GSM coverage Vibrant competitive fixed-line sector Extensive private fiber-optic backbones Adoption of modern landlord model Award of numerous concessions High rates of electrification Sector restructuring and tariff hikes in progress Increasing penetration of ICT services Reducing cost of Internet services Addressing market-efficiency gap Improving customs performance Improving land and marine access Planning for new capacity additions Investing to improve service reliability Addressing huge sector inefficiencies Railways Extensive national rail network Improving performance to recapture traffic Roads Extensive national road network Increasing funding for road maintenance Improving rural access Water resources Progress on institutional framework Developing huge high-return irrigation potential Water and sanitation Improving access to improved water services Reversing growth in open defecation Addressing utilities huge inefficiencies Paying greater policy attention to wells and boreholes Improving quality of traditional latrines Source: Authors elaboration of AICD findings. Note: ICT = information and communications technology; GSM = global system for mobile communications. In this report we begin by reviewing the main achievements and challenges in each of Nigeria s major infrastructure sectors (key findings are summarized in table 1). Thereafter, attention will turn to the problem of financing Nigeria s outstanding infrastructure needs. 5
11 Figure 2. Nigeria s population density tracks agricultural activity in the north and south, with wealth concentrated near the urbanized coastal strip a. Population 6

12 b. Poverty 7
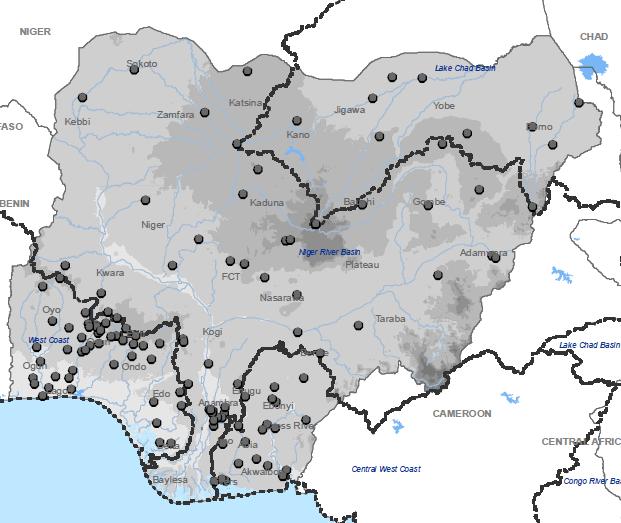
13 c. Topography 8


14 d. Natural resources Source: AICD Interactive Infrastructure Atlas for Ghana ( 9


15 Figure 3. Nigeria s infrastructure networks cover its national territory extensively a. Roads b. Power 10
.")
16 c. ICT d. Water Source: AICD Interactive Infrastructure Atlas for Ghana ( Note: ICT = information and communications technology. 11
17 Roads Achievements Nigeria has developed an extensive national road network. Both paved and unpaved road network densities are more than twice as high as those for the peer group of resource-rich African countries, although still only half of the levels found in Africa s middle-income countries. Traffic volumes on Nigeria s paved and unpaved networks are also relatively high compared with those of similar countries, and indicate that networks are being utilized. Table 2. Nigeria s road indicators benchmarked against Africa s low- and middle-income countries, 2006 Unit Resourcerich countries Nigeria Middle-income countries Paved road density km/1000 km 2 of arable land Unpaved road density km/1000 km 2 of arable land GIS rural accessibility % of rural population within 2 km of all-season road Paved road traffic Average annual daily traffic 1, , ,558.3 Unpaved road traffic Average annual daily traffic Paved network condition % in good or fair condition Unpaved network condition % in good or fair condition Perceived transport quality % firms identifying roads as major business constraint Overengineering % paved network with <300 vehicles per day Underengineering % unpaved network with >300 vehicles per day Source: Gwillliam and others Derived from the AICD national database ( Note: GIS = geographic information system. Challenges Nigeria has established a federal road maintenance agency (FERMA) as a stopgap before undertaking more substantive sector reforms, but continues to rely on traditional budget allocations to fund road maintenance and rehabilitation. In recent years a substantial number of African countries have taken measures to establish road-user charges or fuel levies of various kinds. These feed into a ring-fenced road fund, with the aim of providing a stable source of revenue for road maintenance. In many cases, the establishment of a road fund has been accompanied by the creation of a road agency, an autonomous entity charged with the implementation of road maintenance and rehabilitation works. In Nigeria s case, FERMA is responsible for the federal (or primary) network, but continues to rely on general budget resources for the funding of road maintenance. Its governance structures and procedures (human resource management, operational decision making, and so on) are still overshadowed by public service norms, presenting an obstacle to institutional independence, efficiency, and accountability. Considering these issues, the current arrangement would require review even if adequate funds for road maintenance were being secured through the budgetary process. Sadly, however, road maintenance remains underfunded. Nigeria has been allocating ample resources to federal road rehabilitation, but does not appear to have reserved enough of these resources for preventive maintenance (figure 4). In the years between 2001 and 2006, Nigeria spent just over $700 million on the federal network per year. Network simulations indicate that a yearly budget of around $580 million should be adequate both to maintain the federal network and 12
18 to complete pending rehabilitation works within a five-year horizon. Higher spending may simply indicate a more accelerated rehabilitation program, or relatively high unit costs; in any case, recent spending levels are nearing the right levels. The problem lies in the fact that only $50 million per year has been allocated to preventive maintenance, compared to a benchmark requirement of $240 million. The amount currently being allocated to maintenance is just about adequate for routine maintenance, but does not cover periodic, preventive activities. Thus, while the overall allocation is adequate, there appears to be a marked bias toward capital expenditure. This finding is borne out by the fact that only 75 percent of the federal network is in good or fair condition. Problems of road maintenance are apparently much more severe at the subnational level. Road condition indicators for the entire national network are much worse than for the federal network (table 2). Only 67 percent of paved roads are in good or fair condition. Even more worrisome is the fact that only 33 percent of unpaved roads are in good or fair condition. These indicators are themselves evidence that maintenance activities are not being adequately funded or implemented at the subnational level. While it was not possible to collect data on subnational road maintenance expenditures, estimates suggest that the annual maintenance and rehabilitation requirement for the subnational network is around $500 million, or approximately the same as that for the federal network. Rural accessibility remains a serious problem in Nigeria, with major repercussions for agricultural and rural development. As already noted, the country s unpaved roads are in particularly poor condition. Furthermore, there is evidence of substantial underengineering in the unpaved network, of which a quarter is above the economic traffic threshold usually used to justify the paving process (table 2). The evidence on rural access levels is somewhat conflicting. According to household survey evidence, about 47 percent of rural inhabitants live within 2 kilometers (km) of an all-season road. This is well above the average of around 34 percent for Sub-Saharan Africa, but still falls well short of the 67 percent average found in other developing countries. On the other hand, geographic information system (GIS) analysis suggests that only about 20 percent of rural Nigerians have access to an all-season road, a figure somewhat below the average for the peer group. (The survey and GIS analysis should not be expected to give consistent answers, each having its own limitations.) In any case, it is clear that Nigeria s rural road network falls well short of what is needed to service the rural economy. Realistic extension of rural access will require strategic alignment of road and agricultural development policies. Nigeria s classified road network amounts to 85,000 km. To provide all-season road coverage to just 75 percent of the rural population would require the classified network to be extended by a further 20,000 km a tall order. Nevertheless, if rural road development were to be closely aligned with agricultural priorities, a fully functional classified network of just 50,000 km would be adequate to provide connectivity to areas producing 80 percent of the country s agricultural output by value. 13

19 Figure 4. Nigeria s spending falls substantially short of maintenance needs, 2006 Source: Gwillliam and others Note: * Analysis of the adequacy of road-maintenance spending can be performed for only the primary network under federal jurisdiction. Rail Achievements Nigeria has one of the most extensive national rail networks in Africa, second only to South Africa in length. Rail lines run to the northwest, northeast, southwest, and southeast of the country. Historically, Nigeria s railway was among the best in West Africa, but it has since fallen into neglect. Challenges Despite Nigeria s potentially significant demand for rail, traffic volumes have all but collapsed much more so than in many other African countries. Nigeria s large population and economy create substantial demand for intercity passenger traffic as well as freight movements. But due to deficient performance and erratic service, traffic volumes have been on a long-term decline from 3 million tonnes in 1960 to 15,000 in 2005 equivalent to about five trucks per day. Similarly, passenger traffic has declined from 3 million to 500,000 passengers per year over the same period equivalent to about 25 buses per day. As of today, traffic density at only 15,000 tonnes per kilometer (tonne-kms) is a tiny fraction of the already-low levels found on other African railways. 14
20 Table 3. Railway indicators for Nigeria and select countries, 2006 NRC (Nigeria) Concessioned (1)/ state run (0) Traffic density, freight, 1,000 tonne-km/km ,091 5,319 Efficiency Staff: 1,000 UT per staff ,037 Coaches: 1,000 passenger-km per coach , Cars: 1,000 tonne-km per wagon , Locomotive availability in % Tariffs Average unit tariff, freight, US cents/tonne-km Average unit tariff, passenger, US cents/passenger-km GRC (Ghana) OCBN (Benin) SITARAIL (Côte d Ivoire Burkina Faso) Source: Bullock Derived from the AICD rail operator database ( Note: UT = unit tariff. = Not available. TRANSRAIL (Senegal Mali) CAMRAIL (Cameroon) SPOORNET (South Africa) Ports Achievements Nigeria s port system has traditionally put a brake on economic development, due to poor performance and high costs. As of 2006, the performance parameters for Nigeria s major ports were very poor by global and even African standards (table 4). The global benchmark for container dwell time was around 7 days, compared with 30 to 40 days in major Nigerian ports at that time. Similarly, for truck cycle time, global best practice is on the order of one hour, compared with around one day in some of Nigeria s major ports. And for container crane productivity, the figure for Apapa in 2006 was 12 moves per hour compared to moves internationally. Meanwhile, for general-cargo crane productivity, the figure was 8 9 tonnes per hour (tonnes/hr) for the major Nigerian ports compared to 30 tonnes/hr internationally. 15
21 Table 4. Benchmarking port indicators for Nigeria and select countries, 2006 Apapa (Nigeria) Port Harcourt (Nigeria) Onne (Nigeria) Abidjan (Côte d Ivoire) Cotonou (Benin) Tema (Ghana) Dakar (Senegal) Durban (South Africa) Capacity Actual containers handled ( 000sTEU/year) ,899 Container-handling capacity ( 000sTEU/year) ,450 Actual general cargo handled ( 000s tonnes/year) 3, ,630 General-cargo-handling capacity (tonnes/year) 5,000 2,000 4,000 n.a. 2,500 8,500 Efficiency Average container dwell time in terminal (days) Average truck-processing time for receipt and delivery of cargo (hours) General cargo vessel preberth waiting time (hours) General cargo vessel turnaround time (hours) Average container crane productivity (containers loaded/unloaded per crane working hour) Average general cargo crane productivity (tonnes loaded/unloaded per crane working hour) Tariffs Average container-handling charge, ship to gate ($/TEU) Average general-cargo-handling charge, ship to gate ($/tonne) Average dry-bulk-handling charge, ship to gate or rail ($/tonne) Average liquid-bulk-handling charge, ship to gate or rail ($/tonne) Source: Ocean Shipping Consultants Derived from the AICD ports database ( Note: TEU = 20-foot equivalent unit. = Not available. n.a. = Not applicable. A comprehensive reform of the port sector began in the year It was designed to remove the major impediments to efficient operation and thereby facilitate streamlined import and export activities. Nigeria s port sector reform program was wide ranging, detailed, and implemented on a scale unprecedented for this sector in Africa. The reforms undertaken were well planned, for the most part well implemented, and placed the country s port system on a much more sound footing. They included a shift of management toward the landlord port model and the extensive award of private sector concessions for frontline cargo-handling facilities. To fit the landlord model, the Nigerian Ports Authority (NPA) has been extensively restructured. This includes its decentralization into four new autonomous port authorities: Lagos, Calabar, Port Harcourt, and Delta. Under the new structure, the NPA s key functions were defined as planning and developing port infrastructure, facilitating the financing of new construction through build-operate-transfer (BOT) 16
22 arrangements, licensing private operators to provide port services, collecting port authority tariffs, and generally acting as a landlord on behalf of the federal government. Furthermore, extensive provisions were made for the retrenchment of human resources in case of overstaffing. At the same time, a comprehensive program of concessions for key cargo terminals, including container-terminal facilities, was implemented. In all, 25 concessions were identified among the 11 ports under the NPA s control. The concessions awarded in have raised as much as $716 million for capital investment in the sector more than half of the cumulative total of private port financing ever raised in Sub-Saharan Africa. Challenges Despite the important progress made by Nigeria s port sector reforms, a number of key challenges remain (see box 1 for the example of Apapa). Box 1. Impact of reforms at Lagos s Apapa port The Lagos port has long been notorious for inadequate facilities and congestion. As part of a broader program of port reform, in early 2006 the Nigerian Ports Authority (NPA) awarded a concession to APM Terminals to manage, operate, and develop the Apapa container terminal, increasing capacity from 220,000 TEUs per year to 1.6 million TEUs. Within months of the award of that concession, berthing space delays dwindled significantly, and shipping lines reduced their congestion surcharge from 525 to 75 per TEU, saving the Nigerian economy $200 million a year. By early 2009, new gantry cranes had been acquired to triple the original capacity. But that was not the end of the story. Although the port s equipment was able to process more than 500 containers per day for customs examinations, the majority of containers were returned to stacking by the end of each day. By January 2009, the port was clogged by uncollected containers, and at the end of February, the head of the NPA announced a temporary suspension of ship entry with immediate effect, lasting until mid-april, to enable terminals to clear alarming backlogs. The controller of the Nigeria Customs Service for Apapa blamed the low clearance volume on the need to physically examine every container due to the high incidence of concealment and false declaration by importers. But even cleared containers were not being collected. At the end of January, of the reported 9,741 containers waiting in the port for delivery to importers, 851 had been cleared by customs with all charges paid and documentation completed but had not been picked up by agents. The NPA consequently proposed introducing demurrage charges of 680 naira per TEU in a bid to force owners to move their containers out of the ports. In turn, however, many agents blamed a lack of trucks, arguing that the number needed to empty containers exceeded current supply. Although the moratorium on entry of new vessels was lifted in early March, some backlogs and delays and significant organizational and regulatory problems remained. Source: Foster and Briceño-Garmendia 2009: chapter 12. Note: TEU = 20-foot equivalent unit. The reforms have not managed to circumvent some of the broader-based problems that negatively impact the port system, such as poor customs performance and corruption. For example, the Onne port actually had to close at one point due to the slow clearance of cargo by customs. There is also the need to improve both marine and landside access to port, as well as to plan for new capacity infrastructure (particularly at Lagos s Apapa port). In this context, there is a clear need for detailed long-term planning, to be headed by the NPA in its new landlord role. There have also been recent complaints about rising cargo-handling costs. 17
23 Air transport Achievements Nigeria s air transport market tripled in size between 2004 and 2007, largely due to the rapid expansion of domestic services. The number of seats serving the Nigerian market was almost stable, at around 4 million a year over the period 2001 to 2004, but mushroomed thereafter to reach over 12 million annually by This growth was driven almost entirely by a dramatic expansion in the domestic air transport market. Among its Sub-Saharan peers, the size of Nigeria s market is second only to South Africa. Moreover, with a Herfindahl index 1 of 18 percent, Nigeria s domestic air transport market is much more competitive than that of most other countries in the region. Figure 5. Nigeria s domestic air traffic has mushroomed in recent years Source: Gwillliam and others Some of Nigeria s private carriers have also become major players regionally. As of 2001, the regional air transport market in West Africa was dominated by three carriers Air Afrique, Ghana Airways, and SN Brussels that together accounted for 54 percent of the market. Following the demise of Air Afrique and Ghana Airways, as well as Nigeria Airways itself, there was a major shift in the regional air transport market. Three new players Air Senegal, Virgin Nigeria, and Bellview Airlines have emerged, accounting for 44 percent of the regional market. Virgin Nigeria and Bellview Airlines were both privately owned registered operators that each held a roughly 11 percent share of the regional market. Virgin Nigeria s share continued to grow, until by 2007 it had over 50 percent of the seat capacity in the West African air transport market (taking both domestic and intraregional flights into account). But a major shift occurred when Bellview ceased operations in 2009, and Virgin decided to sell its 49 percent stake in Virgin Nigeria (the airline went on to rebrand itself as Air Nigeria in September 2009). In the meantime, Arik Air rapidly rose to prominence with a broadened domestic network and new destinations that include Johannesburg, London, and New York. 1 The Herfindahl index, a measure of market concentration, is computed by summing the squares of the market share of each market participant. 18
24 Nigeria is one of the few countries in Africa whose safety standards support direct flights to the United States. In August 2010 Nigeria became one of the few countries in Sub-Saharan Africa (Cape Verde, Ethiopia, and South Africa) whose safety oversight is considered good enough for the United States to allow direct flights by Nigerian carriers from Nigeria to the United States. By passing the U.S. Federal Aviation Administration (FAA) International Aviation Safety Assessment (IASA) program audit, Nigeria proved itself after a deliberate and determined effort. A string of fatal accidents between 2005 and 2006 had prompted the government to demand all airlines in Nigeria to recapitalize and reregister themselves to obtain a valid operating certificate. Challenges While traffic has mushroomed, connectivity has remained largely unchanged, and remains limited within ECOWAS. As of 2007 Nigeria s network consisted of some 20 domestic city pairs and 50 international city pairs. In terms of intraregional connectivity within the ECOWAS, by far the best-served route is between Lagos and Accra, with 44 flights per week in Among domestic pairs, Abuja/Lagos registered 208 flights per week in Thereafter, connectivity drops off markedly: both Bamako/Abidjan and Accra/Abidjan registered 17 flights per week. No other regional destination comes close to having a daily service, which is striking given that Nigeria is a major regional player. Lagos has not yet assumed its place as an air transport hub for the region. On the eastern and southern side of the continent, a strong hub-and-spoke structure has developed around Johannesburg, Nairobi, and Addis Ababa. By contrast, a functioning hub system is conspicuously absent in West Africa. Due to its size and location, an airport such as Lagos has the potential to play such a role, one that it has not yet fulfilled, mainly because the Federal Airport Authority of Nigeria has not been reformed and has not been allowed to proceed with the private sector concessioning of key airport terminals in dire need of investment, such as Lagos International Terminal II. Intense competition may herald further industry consolidation. Nigeria s aviation industry now boasts the most modern aircraft fleet in the region and has the only regional carrier offering wide-body aircraft services (for example, Arik s Airbus A340 and 330). Meanwhile, a rapid increase in seat supply has exerted downward pressure on domestic fares within Nigeria and, in a highly leveraged industry, is likely to result in some much-needed consolidation. Table 5. Benchmarking air transport indicators for Nigeria and other select countries, 2007 Country Nigeria Ghana Côte d Ivoire Senegal Kenya Tanzania Traffic (2007) Domestic seats (millions per year) Seats for international travel within Africa (millions per year) Seats for intercontinental travel (millions per year) Seats available per capita Herfindahl Index domestic market (%) Herfindahl Index international market
25 Quality Percent of seat-km in medium or smaller aircraft Percent of seat-km in newer aircraft Registered carriers on EU blacklist FAA/IASA audit status No audit Fail Fail No audit No audit No audit Percent of carriers passing IATA/IOSA audit Source: Bofinger Derived from the AICD national database ( Note: EU = European Union; FAA = U.S. Federal Aviation Administration; IASA = International Aviation Safety Assessment; IATA = International Air Transport Association; IOSA = IATA International Safety Audit. = Not available. Water supply and sanitation Achievements Nigeria s performance in sanitation is somewhat better than that of the resource-rich country peer group. Access to flush toilets, at 23 percent, is twice the average for resource-rich countries in Africa, even if still half that in middle-income countries. More than one-third of Nigerians rely on improved latrines as their main source of sanitation, a level comparable to other resource-rich countries. Access to traditional latrines, at 13 percent of the population, is below the level of resource-rich countries. But one in three Nigerians continues to practice open defecation (table 6). Challenges The practice of open defecation continues to increase, and little net progress is being made toward improving sanitation overall. In 1998, 24 percent of the population practiced open defecation; within 10 years this had increased to 29 percent. Progress with higher-end modalities is mixed. Although the expansion of septic tanks has been significant, it has been largely offset by the decline in both improved and traditional latrines. Whereas about 1.3 percent of the population gained access to septic tanks between 2003 and 2008, about 1.2 and 0.3 percent of the population lost access to improved and traditional latrines, respectively, each year. The use of septic tanks also looks low relative to annual population growth, at 2.4 percent per year (figure 6b). Meanwhile, around 2.3 percent of the population fell into the practice of open defecation during the same period. Relative to its neighbors, Nigeria s water performance scores are significantly worse than its sanitation. According to the Demographic and Health Survey (DHS) 2008, only 5 percent of the population have access to a private tap and only 8 percent to a public standpost (table 6). By contrast, about 12 percent of the population have access to each of these modalities in Africa s resource-rich countries, and in Africa s middle-income countries more than 60 percent have access to piped water. By far the most important sources of water are wells and boreholes, which serve 63 percent of Nigeria s population. But as many as one in four Nigerians continue to rely on surface water, without access to any better alternative. Particularly worrying is a decrease in access to utility water. By comparing results from successive DHS surveys between 2003 and 2008, it is possible to estimate the rate at which different types of 20
26 services are expanding (figure 6a). During this period, the percentage of the population with access to utility water whether through private taps or standposts was actually declining, by around 0.4 percentage points each year. By contrast, more than 3 percent of the population each year has been gaining access to wells and boreholes, making this by far the fastest-growing source of water supply in Nigeria. A particularly positive finding is that the percentage of the population relying on surface water has been on the decline, with 0.4 percent of the population moving away from this unsafe practice every year. Figure 6. Rural access to water and sanitation versus population growth, Share of population gaining access per year a. Water b. Sanitation Source: WHO (2010), from the DHS (2003 and 2008). 21
27 Table 6. Benchmarking water and sanitation indicators Unit Resourcerich countries Nigeria Middle-income countries Mid-2000s Mid-2000s Access to piped water % pop Access to standposts % pop Access to wells/boreholes % pop Access to surface water % pop Access to septic tanks % pop Access to improved latrines % pop Access to traditional latrines % pop Open defecation % pop Domestic water consumption liter/capita/day Revenue collection % sales Distribution losses % production Cost recovery % total costs Operating cost recovery % operating costs Labor costs connections per employee Total hidden costs as % of revenue % Nigeria U.S. cents per m Scarce water resources Other developing regions Average effective tariff Source: AICD water and sanitation utilities database ( access figures from DHS (1999, 2003, and 2008). 22
28 Access to utility water is inequitable. Access to various types of water supply is strongly correlated with household purchasing power. Access to utility water, in particular, is almost nonexistent at the bottom half of the income distribution, and strongly skewed toward higher-income households. But even among these, access to utility water is far from universal, reaching at best 20 percent of this group. Thus, even those able to pay for piped water are unlikely to have access. Particularly striking is the fact that access to standposts is just as inequitable as access to private taps, even though standposts supposedly represent a Figure 7. Access to water sources is highly inequitable lower-cost option for the poor. Access to wells and boreholes, on the other hand, is much more equitable and reaches over half of the population, across the socioeconomic spectrum. As is to be expected, reliance on surface water is heavily concentrated among the poor (figure 7). Access to improved water is much higher in urban than in rural areas. Access to improved water in urban areas is 75 percent, versus 45 percent in rural areas (figure 8a). The main reasons behind this are the higher prevalence of surface water dependence in rural areas, and the fact that 21 percent of the wells and springs in rural areas are unprotected versus only 6 percent in urban areas. Figure 8. Access to water sources is highly inequitable across urban and rural communities a. Water supply b. Sanitation Source: Banerjee and others 2009, based on DHS Note: Q1 first budget quintile, Q2 second budget quintile, and so on. Source: AICD water supply and sanitation utilities database ( access figures calculated 23
29 by AICD using data from the 2008 DHS Survey published by the JMP in March Nigeria s water utilities suffer high levels of inefficiency, both in absolute terms and relative to their neighbors. Available data on the performance of Nigeria s water utilities are limited. Although Nigeria has as many as 36 state water utilities, it was possible to obtain reasonably sound data for only a handful of them Borno, the Federal Capital Territory, Kaduna, Katsina, Lagos, and Platea at a single point in time in These data were later complemented with data for Nasarawa from the IbNet database. Together these utilities serve a substantial customer base of 25 million people, comprising about half of the urban population of Nigeria. The indicators presented are a weighted average for this sample (table 7). They indicate that the Nigerian utilities perform as poorly, and in some areas worse, than utilities in the resource-rich peer group. In particular, performance on revenue collection and labor productivity is substantially worse than the peer group. Revenue collection is as low as 44 percent of billed amounts, and labor productivity at 57 connections per employee is just a quarter that of a well-performing utility in Africa. Distribution losses, at 59 percent, are also substantially worse than the 39 percent reported for the peer group. Cost-recovery tariffs for water appear to be perfectly affordable for those enjoying access today. The average effective residential tariff, at just under $0.38 per cubic meter (m 3 ), more than covers average operating costs of around $0.21/m 3, but falls significantly short of the estimated $0.61 cost-recovery level (table 7). This raises the important question of whether cost-recovery tariffs would be affordable to utility customers. Considering subsistence consumption of 4 m 3 /month which amounts to an absolutely minimal consumption of 25 liters per capita per day for a family of five a monthly water bill charged at cost-recovery tariffs would be $3.20. With a somewhat more generous definition of subsistence consumption of around 10 m 3 /month, the cost of a monthly water bill charged at cost-recovery tariffs would be $8.00. Based on an affordability threshold of 5 percent of the household budget, and looking at the distribution of purchasing power across Nigeria s households, a monthly bill of $3.20 would be affordable to 95 percent of the population, while a bill of $8.00 would be affordable to 60 percent of the population (figure 7). Given that, as of today, access to water is confined to less than 10 percent of the population at the high end of distribution, there do not appear to be any significant problems in the affordability for cost-recovery tariffs. Nor would such problems arise until access to piped water had expanded significantly, to reach about 50 percent of the population. Table 7. Operational indicators associated with select Nigerian utilities, as of 2005 Water delivered System losses Collection ratio Average total cost Average effective tariff Total hidden costs Total hidden costs Utility (million (%) (%) (US$/m 3 ) (US$/m 3 ) (US$ (% revenues ) m 3 /year) millions/year) FCT Kaduna Katsina Lagos Nasarawa Nigeria Source: Derived from Briceño-Garmendia, Smits, and Foster (2009). Note: For Nigeria water delivered (million m 3 /year) and total hidden costs (US$/year) are reported as the sum of the utilities; the other indicators are calculated as weighted averages. 24
30 By comparing Nigerian utilities with well-performing benchmarks, it is possible to quantify the hidden costs that arise from these inefficiencies. Here three types of such costs are considered: first, those associated with distribution losses in excess of the good-practice benchmark of 20 percent of production; second, those associated with revenue collection that falls short of the 100 percent best-practice benchmark; and, third, any shortfall in the average effective tariff relative to what is needed to fully recover operating and capital costs. The hidden costs of Nigerian water utilities look to be among the highest in the region. The combined effects of underpricing, overstaffing, undercollection, and distribution losses imply a sizeable financial hemorrhage. In the case of the Nigerian utilities sampled, the value of these hidden costs is estimated to be almost three times as great as the utilities turnover. In the worst-performing utility of the sample (Katsina), the hidden costs are seven times as large as the utility s turnover. Even for the most efficient of the sample utilities (FCT), hidden costs are still worse than those among other utilities in West Africa (figure 9). Figure 9. Hidden costs of select water utilities, as percentage of revenues Source: Derived from Banerjee and others (2008b) and Briceño-Garmendia, Smits, and Foster (2009). While improving utility performance will be a key to expanding access, more attention needs to be given to those alternatives that are most widely used. In the medium term, Nigeria needs to work hard to provide more of its population with access to utility services for water and sanitation. To this end, addressing the performance deficiencies of service providers is key. Nevertheless, it is important to recognize that for the foreseeable future the bulk of Nigeria s population will continue to rely on boreholes for water and traditional latrines for sanitation services. Policy makers therefore need to give some attention to ways of improving the quality and effectiveness of these basic services. In the case of 25
31 boreholes, there are many policy issues surrounding their unregulated and uncoordinated use. In the case of traditional latrines, policy makers should promote the use of better design and building techniques among artisans. Furthermore, there are potential health issues that arise when groundwater and low-grade in situ sanitation are found in close proximity in urban areas. Power Achievements Nigeria has achieved relatively high rates of electrification, particularly in urban areas, and access is expanding rapidly. As of 2003, Nigeria had electrified over 50 percent of its population, just slightly ahead of the peer group of resource-rich countries (table 8). Power coverage in urban areas, at 84 percent, was well ahead of the resource-rich peer group, and on par with Africa s middle-income countries. Even rural electrification, at almost 35 percent, represents strong performance. Not only does Nigeria have high access to power, but electrification expanded relatively rapidly between the mid-1990s and the mid- 2000s. The pace of electrification seems to have slowed subsequently. Challenges Despite high levels of electrification, Nigeria s power sector has struggled to provide an adequate supply of reliable power. The country s installed power capacity, at around 42 megawatts (MW) per million people, is typical of the resource-rich peer group (table 7), but it is only about 5 percent of the installed capacity of 800 MW per million people found in Africa s middle-income group. Moreover, in Nigeria s case as much as 35 percent of this capacity is not in functioning order. As a result, the country was able to meet only 67 percent of peak demand as of 2007, and the power system was able to supply only 55 percent of total estimated demand as of Indeed, electricity generated in 2007 was actually lower than in As a result, indicators such as generation capacity per million population and power consumption per capita actually deteriorated slightly between the mid- and late 2000s. The economic impacts of Nigeria s power deficit are substantial. According to enterprise surveys, Nigeria is affected by power outages more than 320 days a year, a level many times higher than that found in other African countries. As a result, the percentage of Nigerian firms owning their own backstop generators is 60 percent, again substantially higher than elsewhere in Africa. Formal private sector revenues lost as a result of power outages come close to 10 percent. If we (very conservatively) estimate the value of lost load as the cost of backstop generation to the private sector (approximately $0.40 per kilowatt-hour, kwh), then the aggregate social cost of power outages in recent years amounts to as much as 3.7 percent of GDP, well beyond levels found in other African countries (figure 10). If the value of lost load is instead estimated with reference to the likely economic losses in production (of easily $1.00 per kwh), then the aggregate social cost of power outages could be two to three times as high. 26
32 Figure 10. Power outages are a major tax on Africa s economies Economic cost of power outages in select countries Source: Derived from Eberhard and others (2009). Nigeria s power sector has been characterized by a high degree of operational inefficiency and underpricing. As of 2005 only 64 percent of billed revenues were collected, compared with 81 percent in the resource-rich peer group (table 6). Distribution losses were as high as 30 percent, compared to bestpractice levels of 10 percent. Tariffs covered about 28 percent of the historic costs of power production, on average, compared with over 50 percent for the peer group. Nigeria s power tariffs are set very low, both by global standards and relative to any relevant cost benchmark. With respect to power pricing, as of 2005, Nigeria s residential power tariffs, at around $0.03/kWh, were among the lowest in Africa and well below the average of $0.16/kWh found in African countries predominantly reliant on thermal generation technologies (figure 8). Nigeria s rates were also well below the range typically between $0.05 and $0.10 per kwh found in other parts of the developing world (table 8). According to the Nigerian government, the average total historic cost of producing power in the country has been on the order of $0.15/kWh (22 naira). Looking ahead to 2015, the long-run marginal cost of producing additional power is projected to be slightly lower, at around $0.13/kWh. As a result, Nigeria faces enormous hidden costs in the power sector, by far the worst in Africa. Each of the inefficiencies in the power sector results in hidden costs, which when tallied amount to more than five times the sector turnover (figure 11). In absolute terms, these hidden costs amount to a staggering $3.3 billion annually, equivalent to 2.9 percent of GDP. While substantial hidden costs are typical of African power utilities, the scale of the problem in Nigeria is much higher than anywhere else (figure 12). Following the sector reforms, tariffs have been increasing and sector performance improving. A major reform program initiated in 2005 had significant repercussions for the sector. The reforms led to the horizontal and vertical unbundling of the national power utility into six generating companies, one transmission company, and eleven distribution companies. In August 2010, the Nigerian government issued the Road Map for Power Sector Reform (Presidency 2010) to galvanize the reform process. The road map points to the difficulties ahead if status quo operations are maintained, and recommends removing obstacles to the private sector participation that promises to fill the sector s large investment 27
33 gaps. Meanwhile, the government set appropriate pricing mechanisms to ensure the financial viability of the public distribution companies and any offtaker in power purchase arrangements. The government also committed to a Multi-Year Tariff Order (MYTO), introduced in 2005, whose initial objective was to gradually raise the power tariff to $0.07/kWh (10 naira) by The government, however, is currently revising the MYTO to specify an aim of $0.14/kWh (22 naira) over the next 5 to 10 years. Meanwhile, the Nigeria Bulk Electricity Trading Company has been established to act as a single buyer purchasing power on behalf of distribution companies and other bulk customers until the sector reaches financial sustainability. The government expects that it will take several years before the benefits of the reforms will effectively transform the sector s financial performance and creditworthiness. The benefits of the reform process can already be clearly seen in the dramatic reduction of the sector s hidden costs, even if these remain high in both relative and absolute terms. As a result of the MYTO, the average effective tariff increased from around $0.04/kWh in 2005 to $0.06/kWh in At the same time, institutional reforms led to significant improvements in operational efficiency. Revenue collection rates increased from 64 to 88 percent, even as system losses fell from 30 to 20 percent (table 9). The overall effect of this was the reduction of hidden costs from 548 percent to 247 percent of sector revenues (figure 11). This led to savings of $1.3 billion annually, or 1.8 percent of GDP. While these gains are very important, there is still a long way to go: Nigeria s power utilities still present the highest hidden costs of any in West Africa (figure 12), with an equivalent economic value of nearly $2 billion annually, or 1.2 percent of GDP. Table 8. Benchmarking power indicators Unit Resource-rich countries Nigeria Middle-income countries Mid-2000s Late 2000s Installed power generation capacity MW/million people Power consumption kwh/capita ,479.3 Power outages Day/year Firms reliance on own generator % consumption Firms value lost due to power outages % sales Access to electricity % population Urban access to electricity % population Rural access to electricity % population Growth access to electricity % population/year Revenue collection % billing Distribution losses % production Cost recovery % total cost Total hidden costs as % of revenue % U.S. cents Nigeria Predominantly thermal generation Mid-2000s 28 Late 2000s Other developing regions Average effective power tariff Source: Eberhard and others 2009; derived from AICD electricity database (
34 Note: Mid-2000s data are for 2005 in the case of power sector indicators and 2003 in the case of access figures; late 2000s data are for 2009 in the case of power sector indicators and 2008 in the case of access figures. kwh = kilowatt-hour; MW = megawatts. = Not available. Table 9. Evolution of hidden costs associated with the national power utility Load served System losses Collection ratio Average total cost Average effective tariff Total hidden costs Total hidden costs (GWh/year) (%) (%) (US$/kWh) (US$/kWh) (US$ million/year) (% revenue) , , , , , , , , Source: Eberhard and others Note: GWh = gigawatt-hour; kwh = kilowatt-hour. Figure 11. Evolution of hidden costs in Nigeria s power sector Source: Eberhard and others Note: It was not possible to obtain all the relevant parameters for
35 Figure 12. Nigeria s power sector presents high hidden costs Hidden costs of power utilities in select countries Source: Eberhard and others Figure 13. Comparison of electricity tariffs across Africa Source: Derived from Eberhard and others Water resources Achievements Nigeria has made some progress toward developing an institutional framework suitable for irrigation development. The country has adopted a water policy, together with an irrigation strategy and action plan. There are specialized agencies for basin-level management, and water-user associations have been empowered. Nevertheless, there is still no specialized entity dedicated to the development of irrigation infrastructure. 30
36 Challenges Even compared to its African peers, Nigeria s water storage capacity is low. It stands at 339 m 3 per capita, compared with 838 m 3 per capita for Sub-Saharan Africa as a whole. Nigeria has just under 300,000 hectares equipped for irrigation today. This is less than 1 percent of the country s cultivated area, although a further 2 percent of the cultivated area is subject to some degree of water management, falling short of irrigation. The existing irrigated area is thinly spread across the national territory, most of it in narrow strips flanking the nation s rivers (recall figure 3d). Even in the areas where some irrigation is taking place, the level of intensity is low; only a fraction is being irrigated. Furthermore, of the limited area equipped for irrigation, only 75 percent is actually operating. The 1 percent of land that is irrigated produces 4.4 percent of the value of Nigeria s agricultural produce. The rate of expansion of irrigated area, though historically slow, has been picking up in recent years. Over the period 1973 to 2003, irrigated area expanded slowly, by only 1.2 percent each year about half the pace of Sub-Saharan Africa. Since 2003, however, the rate of expansion has increased to 3.1 percent annually, more than twice as high as in the rest of Sub-Saharan Africa. Nigeria has huge unexploited potential for economically attractive irrigation schemes. A simulation exercise exploring the economic viability of further expanding large- and small-scale irrigation schemes concluded that Nigeria has by far the best prospects for irrigation development of any country in Sub- Saharan Africa (table 10). If all land with a positive rate of return is considered, the potential is as high as 5.7 million hectares which is almost as much as the total irrigated land in Sub-Saharan Africa today. About half of the potential lies in large-scale schemes. Nevertheless, the internal rate of return on the large-scale schemes, at 7 percent, is not even one-third the estimated 22 percent return on small-scale schemes. The viable area for irrigation is highly sensitive to the hurdle rate of return used. As the hurdle rate is increased beyond zero, the number of viable hectares shrinks dramatically to just over 2 million for hurdle rates in the 6 12 percent range. Moreover, the composition of viable schemes shifts markedly toward smaller-scale projects that offer higher rates of return overall. The overall internal rate of return for surviving projects rises to around 30 percent. If the hurdle rate is raised further to 24 percent, the number of viable hectares shrinks to 0.8 million, almost all of them for small-scale schemes. More generally, it has been found that the viability of irrigation schemes depends on crops mainly cash crops and horticulture that are capable of generating in excess of $2,000 per hectare. 31
 Investment needs (US$ million) Average IRR (%) Large scale Small scale Total Large scale IRR >0% 3,169")
37 Figure 14. Irrigation schemes are viable across much of the country, with pockets of higher returns Areas viable for irrigation Source: You and others Table 10. Sensitivity of irrigation potential to thresholds for economic return Potential ( 000s hectares) Investment needs (US$ million) Average IRR (%) Large scale Small scale Total Large scale IRR >0% 3,169 2,505 5,674 6,185 12,942 19, IRR >6% 370 1,945 2, ,048 10, IRR >12% 609 1,538 2,147 1,188 7,948 9, IRR >24% ,070 4, Small scale Source: You and others Notes: Simulations based on assumptions that large-scale irrigation can be developed at a cost of $3,000 per hectare and small-scale irrigation can be developed at a cost of $2,000 per hectare. Should these costs be significantly exceeded, the number of viable hectares falls sharply. IRR = internal rate of return. Results are also highly sensitive to the costs of irrigation development. The results presented are based on unit-cost assumptions of $3,000 per hectare for large-scale schemes and $2,000 per hectare for small-scale schemes. These represent best-practice cost benchmarks, though actual development costs experienced in West Africa might be substantially higher, which would dramatically reduce the estimated Total Large scale Small scale Total 32
38 number of viable hectares. Based on these cost assumptions, the required one-time investment to develop all viable schemes (based on a hurdle rate of 12 percent) would be on the order of $9.1 billion. Information and communications technologies Achievements In common with the rest of Africa, Nigeria has made good progress in expanding GSM signal coverage. The percentage of Nigeria s population living within range of a GSM signal has expanded rapidly, reaching some 60 percent in 2006 and nearly 70 percent in Nigeria has attracted over half the $28 billion in private capital that has gone into the development of new mobile networks across Africa. 2 Nigeria stands out among African countries for its creation of a competitive fixed-line sector. The key reason for this is market liberalization: there were 30 active, fixed-wireless operators as of December 2009 (NCC 2010). Most are providing service using fixed-wireless technology (with four fixed-wireless operators competing head on with GSM operators by providing full mobility functionality). As a result, only a minority of fixed-line subscribers are associated with the stagnating national incumbent Nigerian Telecommunications Limited (NITEL), which, as of 2009, remained unprivatized (IHS Global Insight 2008). Intense competition in the mobile and fixed-line segments has driven prices down. Nevertheless, the 2009 prices of a monthly fixed-line subscription ($9) and prepaid mobile subscription ($11) were only average compared with other Sub-Saharan African countries. As of 2010 significant tariff reductions were following the lower interconnection rates introduced by the regulator. This, combined with the depreciation of the naira, should make ICT services more affordable. Nigeria has also made great progress in the development of a national fiber-optic network by harnessing private sector investment. Many African countries have pursued publicly sponsored national fiber-optic backbone networks, some of them quite expensive and of relatively low quality. Nigeria, on the other hand, has taken full advantage of the scale of its market. By liberalizing the market for fiberoptic infrastructure, the country has seen substantial private sector investment in this area, leading to the development of a solid backbone network interconnecting the major cities (figure 15). Multiple parallel cables have been laid on the highest-traffic routes, which has resulted in intense competition and a decrease in costs. Evidently the private sector will not of its own accord extend cables into smaller towns and rural areas, where a business case does not exist. But by first allowing the private sector to develop the major components of the backbone, the government can limit the use of public funds to areas where no other solution is possible, thereby saving significant fiscal resources. 2 Over the past decade, some $16 billion has been invested in projects related to mobile services in Nigeria. See Pyramid Research (2010). 33

39 Figure 15. Private sector investment in Nigeria s national fiber-optic backbone Challenges Nigeria still faces a substantial market-efficiency gap in the mobile market. While Nigeria s existing level of GSM signal coverage is impressive practically all urban areas are fully covered and around half of the rural population is within reach of a signal simulations suggest that the GSM signal might profitably be extended to 100 percent of the national population (figure 12). It is puzzling that coverage is not greater, given that with nine mobile operators, Nigeria arguably has the most competitive mobile market on the continent. But the price of mobile licenses, coupled with the challenge of extending infrastructure in a large country, pushes up operators costs. Another bottleneck is a lack of electricity in rural areas, which further inflates the costs of network rollout (Mayer 2010). Only around one-third of rural households had electricity in 2008, about the same fraction as rural households with a mobile telephone (NPC and ICF Macro 2009). The price of Internet access remains high, but can be expected to fall with the arrival of new submarine cables. Internet access is relatively expensive considering that Nigeria has access to the SAT-3 submarine cable. But NITEL has had a de facto monopoly over the international gateway. The launch of the Main One undersea fiber-optic cable in 2010, with landing stations in Nigeria and Ghana, was forecast to reduce wholesale prices by 50 percent (TradeInvestNigeria 2010). As of 2010, the imminent arrival of additional submarine cable projects along the West African coast has already placed downward pressure on costs. If costs effectively fall, Nigeria could emerge as a leading regional bandwidth supplier (Business Day 2010). Evidence from across Africa suggests that only when there is competitive access to submarine cable infrastructure are the full cost advantages felt by consumers (table 11). 34
Nigeria s Infrastructure
 Public Disclosure Authorized Public Disclosure Authorized Public Disclosure Authorized Public Disclosure Authorized Policy Research Working Paper 5686 The World Bank Africa Region Sustainable Development
Ghana s Infrastructure: A Continental Perspective
 Public Disclosure Authorized Public Disclosure Authorized Public Disclosure Authorized Public Disclosure Authorized COUNTRY REPORT Ghana s Infrastructure: A Continental Perspective MARCH 2010 iii 2010
Ethiopia s Infrastructure: A Continental Perspective
 COUNTRY REPORT Ethiopia s Infrastructure: A Continental Perspective Vivien Foster and Elvira Morella MARCH 2010 2010 The International Bank for Reconstruction and Development / The World Bank 1818 H Street,
Vivien Foster & Cecilia Briceño-Garmendia, World Bank
 Vivien Foster & Cecilia Briceño-Garmendia, World Bank Africa Infrastructure Country Diagnostic: a multi-stakeholder effort Banque Africaine de Developpement African Union Agence Française de Développement
Niger s Infrastructure
 Public Disclosure Authorized Public Disclosure Authorized Public Disclosure Authorized Public Disclosure Authorized Policy Research Working Paper 5698 The World Bank Africa Region Sustainable Development
Beyond the Bottlenecks: Ports in Sub-Saharan Africa
 BACKGROUND PAPER 8 AFRICA INFRASTRUCTURE COUNTRY DIAGNOSTIC Beyond the Bottlenecks: Ports in Sub-Saharan Africa Ocean Shipping Consultants, Ltd. June 2008 This report was produced by Ocean Shipping Consultants,
Kenya s Infrastructure: A Continental Perspective
 Public Disclosure Authorized COUNTRY REPORT Public Disclosure Authorized Kenya s Infrastructure: A Continental Perspective Public Disclosure Authorized Cecilia M. Briceño-Garmendia and Maria Shkaratan
Cameroon s Infrastructure: A Continental Perspective
 COUNTRY REPORT Cameroon s Infrastructure: A Continental Perspective Carolina Dominguez-Torres and Vivien Foster JUNE 2011 2011 The International Bank for Reconstruction and Development / The World Bank
Kenya s Infrastructure: A Continental Perspective
 COUNTRY REPORT Kenya s Infrastructure: A Continental Perspective Cecilia M. Briceño-Garmendia and Maria Shkaratan MARCH 2010 2010 The International Bank for Reconstruction and Development / The World Bank
Ethiopia s Infrastructure
 Public Disclosure Authorized Policy Research Working Paper 5595 WPS5595 Public Disclosure Authorized Public Disclosure Authorized Ethiopia s Infrastructure A Continental Perspective Vivien Foster Elvira
Sierra Leone s Infrastructure: A Continental Perspective
 COUNTRY REPORT Sierra Leone s Infrastructure: A Continental Perspective Nataliya Pushak and Vivien Foster MARCH 2011 2010 The International Bank for Reconstruction and Development / The World Bank 1818
Sierra Leone s Infrastructure: A Continental Perspective
 Public Disclosure Authorized Public Disclosure Authorized Public Disclosure Authorized Public Disclosure Authorized COUNTRY REPORT Sierra Leone s Infrastructure: A Continental Perspective Nataliya Pushak
Procuring Infrastructure Public-Private Partnerships. Executive Summary
 Procuring Infrastructure Public-Private Partnerships Executive Summary 2018 2018 International Bank for Reconstruction and Development / The World Bank 1818 H Street NW Washington, DC 20433 Telephone:
6. Africa. 6.1 Overview
 6. Africa This chapter presents water and sanitation data. Urban and rural water and sanitation figures are shown by country, area or territory for both 199 and 2. Maps of current are also presented. Graphs
Three African Futures. John Page The Brookings Institution University of Nevada at Las Vegas 7 April 2014
 Three African Futures John Page The Brookings Institution University of Nevada at Las Vegas 7 April 2014 The Next Frontier? Africa has become the new frontier market Africa is the world s fastest-growing
Public and Private Partnerships for the Development of Infrastructure to Facilitate Trade and Transport. SSATP Program Initiatives
 Multi-year Expert Meeting on Transport and Trade Facilitation: Public and Private Partnerships for the Development of Infrastructure to Facilitate Trade and Transport 8-10 December 2009 SSATP Program Initiatives
Kenya s Infrastructure
 Public Disclosure Authorized Public Disclosure Authorized Public Disclosure Authorized Public Disclosure Authorized Policy Research Working Paper 5596 The World Bank Africa Region Sustainable Development
I am very pleased to join H.E. Alassane Ouattara, the President. of Cote d Ivoire, in welcoming you to this second International
 Helen Clark, UNDP Administrator Opening Speech at the Second International Conference on the Emergence of Africa Abidjan, Cote d Ivoire 28 March 2017 at 10:10am Word count: 1700, or 13.5 minutes I am very
Dry ports as an enabler of trade - UNCTAD s experience
 Dry ports as an enabler of trade - UNCTAD s experience by Vincent Valentine, Officer-in-Charge, Transport Section, Trade Logistics Branch, Division on Technology and Logistics, United Nations Conference
Senegal s Infrastructure: A Continental Perspective
 COUNTRY REPORT s Infrastructure: A Continental Perspective Clemencia Torres, Cecilia M. Briceño-Garmendia, and Carolina Dominguez JUNE 2011 2011 The International Bank for Reconstruction and Development
Sudan s Infrastructure: A Continental Perspective
 Public Disclosure Authorized Public Disclosure Authorized Public Disclosure Authorized Public Disclosure Authorized COUNTRY REPORT Sudan s Infrastructure: A Continental Perspective Rupa Ranganathan and
The Central African Republic s Infrastructure
 Public Disclosure Authorized Public Disclosure Authorized Public Disclosure Authorized Public Disclosure Authorized Policy Research Working Paper 5697 The Central African Republic s Infrastructure The
Angola s Infrastructure
 Public Disclosure Authorized Public Disclosure Authorized Public Disclosure Authorized Public Disclosure Authorized Policy Research Working Paper 5813 The World Bank Africa Region Sustainable Development
Growing Intra-Africa Trade and Investment. By: Oluwatoyin Sanni Group CEO, United Capital Plc
 Growing Intra-Africa Trade and Investment By: Oluwatoyin Sanni Group CEO, United Capital Plc Introduction Introduction Africa s export trade heavily concentrated in primary commodities characterized by
Climate and Infrastructure in Africa s Major River Basins
 Climate and Infrastructure in Africa s Major River Basins ClimDev-Africa Dr. Nagaraja Rao Harshadeep The World Bank Presentation at Second Climate Change and Development in Africa Conference Sub-Theme
Sierra Leone s Infrastructure
 Public Disclosure Authorized Public Disclosure Authorized Public Disclosure Authorized Public Disclosure Authorized Policy Research Working Paper 5713 Sierra Leone s Infrastructure The World Bank Africa
WORLD BANK GROUP INFRASTRUCTURE ACTION PLAN AFRICA REGION FY
 WORLD BANK GROUP INFRASTRUCTURE ACTION PLAN AFRICA REGION FY2012-2015 Access Indicators Energy Electrification rate (% of population with access) 1 30.5 Delay in obtaining electrical connection (days)
Transport Solution 26 /10 /
 Transport Solution 26 /10 / 2010 www.nepadbusinessfoundation.org Presentation Layout Global overview Infrastructure & Transport Challenges Elements of Vision 2025 Investment option Strategy Benefit Critical
Uganda s Infrastructure
 Public Disclosure Authorized Public Disclosure Authorized Public Disclosure Authorized Public Disclosure Authorized Policy Research Working Paper 5963 The World Bank Africa Region Sustainable Development
AFRICA REGIONAL INTEGRATION CONSULTATION ON STATUS AND EMERGING WORLD BANK GROUP PRIORITIES
 AFRICA REGIONAL INTEGRATION CONSULTATION ON STATUS AND EMERGING WORLD BANK GROUP PRIORITIES PURPOSE OF THE CONSULTATION Discuss the case for and status of integration in Africa; Provide an update on World
Africa, along with Asia, is the epicentre of
 xx ECONOMIC REPORT ON AFRICA 2017 OPPORTUNITIES AND POLICY PRIORITIES Africa, along with Asia, is the epicentre of global urbanization. It is undergoing a rapid urban transition and is set to be the fastest
REVIEW OF SANITATION STATUS IN AFRICA FROM THREE PERSPECTIVES
 REVIEW OF SANITATION STATUS IN AFRICA FROM THREE PERSPECTIVES (Joint Monitoring Program, Africa Infrastructure Country Diagnostic, Country Status Reviews) Wambui Gichuri Water and Sanitation Program-Africa
Workshop on trade in services negotiations in the CFTA
 Workshop on trade in services negotiations in the CFTA The role of services in Africa s economic transformation and trade Ottavia Pesce Economist, Regional Integration and Trade Division United Nations
Mali s Infrastructure
 Public Disclosure Authorized Public Disclosure Authorized Public Disclosure Authorized Public Disclosure Authorized Policy Research Working Paper 5688 The World Bank Africa Region Sustainable Development
Concept Note Expert Working Group on PPPs in Africa s Electricity Sector
 UNITED NATIONS ECONOMIC COMMISSION FOR AFRICA Concept Note Expert Working Group on PPPs in Africa s Electricity Sector Introduction This initiative is intended to launch an effort by the United Nations
IDC s role in boosting private investment in Energy Infrastructure
 Day Month Year IDC s role in boosting private investment in Energy Infrastructure Lindi Toyi PPP SBU Head : Industrial Development Corporation NEPAD-OECD AFRICA INVESTMENT INITIATIVE 11-12 November 2009
REGIONAL ANALYSIS OF SMALL RESERVOIRS Potential for expansion in Sub-Saharan Africa
 Agricultural Water Management Regional Analysis Document REGIONAL ANALYSIS OF SMALL RESERVOIRS Potential for expansion in Sub-Saharan Africa JULY 2012 Introduction Sub-Saharan Africa (SSA) faces great
Submissions from entities in the United Nations system and elsewhere on their efforts in 2016 to implement the outcome of the WSIS
 COMMISSION ON SCIENCE AND TECHNOLOGY FOR DEVELOPMENT (CSTD) Twentieth Session Geneva, 8 to 12 May 2017 Submissions from entities in the United Nations system and elsewhere on their efforts in 2016 to implement
African Export-Import Bank Afreximbank
 African Export-Import Bank Afreximbank Gwen Mwaba Director Trade Finance Geneva, 2017 African Export-Import Bank Banque Africaine D Import-Export Transforming Africa s Trade Trade Finance The Trade Finance
SECTOR ASSESSMENT (SUMMARY): TRANSPORT, AND INFORMATION AND COMMUNICATION TECHNOLOGY
: TRANSPORT, AND INFORMATION AND COMMUNICATION TECHNOLOGY") Central Asia Regional Economic Cooperation Corridor 3 (Bishkek Osh Road) Improvement Project, Phase 4 (RRP KGZ 45169) SECTOR ASSESSMENT (SUMMARY): TRANSPORT, AND INFORMATION AND COMMUNICATION TECHNOLOGY
Central Asia Regional Economic Cooperation Corridor 3 (Bishkek Osh Road) Improvement Project, Phase 4 (RRP KGZ 45169) SECTOR ASSESSMENT (SUMMARY): TRANSPORT, AND INFORMATION AND COMMUNICATION TECHNOLOGY
Economic and Social Council
 United Nations Economic and Social Council E/ECA/CGSD/1/2 Distr.: General 30 November 2015 Original: English Economic Commission for Africa Committee on Gender and Social Development First session Addis
ENTERPRISE SURVEYS WHAT BUSINESSES EXPERIENCE. Cameroon 2016 Country Profile ENTERPRISE SURVEYS
 ENTERPRISE SURVEYS ENTERPRISE SURVEYS WHAT BUSINESSES EXPERIENCE Cameroon 1 Country Profile 1 Contents Introduction... 3 Firms Characteristics... Workforce... Firm Performance... Physical Infrastructure...
ENTERPRISE SURVEYS WHAT BUSINESSES EXPERIENCE. Lesotho 2016 Country Profile ENTERPRISE SURVEYS
 ENTERPRISE SURVEYS ENTERPRISE SURVEYS WHAT BUSINESSES EXPERIENCE Lesotho 1 Country Profile 1 Contents Introduction... 3 Firms Characteristics... 4 Workforce... Firm performance... Physical Infrastructure...
SECTOR ASSESSMENT (SUMMARY): ROAD TRANSPORT
: ROAD TRANSPORT") Road Asset Management Project (RRP AFG 50062-001) Sector Road Map SECTOR ASSESSMENT (SUMMARY): ROAD TRANSPORT 1. Sector Performance, Problems, and Opportunities 1. Background. Afghanistan s fragile and
Road Asset Management Project (RRP AFG 50062-001) Sector Road Map SECTOR ASSESSMENT (SUMMARY): ROAD TRANSPORT 1. Sector Performance, Problems, and Opportunities 1. Background. Afghanistan s fragile and
ENTERPRISE SURVEYS WHAT BUSINESSES EXPERIENCE. Papua New Guinea 2015 Country Profile ENTERPRISE SURVEYS
 ENTERPRISE SURVEYS ENTERPRISE SURVEYS WHAT BUSINESSES EXPERIENCE Papua New Guinea 2015 Country Profile 1 Contents Introduction... 3 Firms Characteristics... 4 Workforce... 5 Firm performance... 5 Physical
SECTOR ASSESSMENT (SUMMARY): TRANSPORT
: TRANSPORT") Country Partnership Strategy: Pakistan, 2015 2019 SECTOR ASSESSMENT (SUMMARY): TRANSPORT Sector Road Map 1. Sector Performance, Problems, and Opportunities 1. Sector performance and problems. The transport
Country Partnership Strategy: Pakistan, 2015 2019 SECTOR ASSESSMENT (SUMMARY): TRANSPORT Sector Road Map 1. Sector Performance, Problems, and Opportunities 1. Sector performance and problems. The transport
PLENARY PANEL 1. A brief on the. African Union Commodities Strategy and Industrialization
 PLENARY PANEL 1 A brief on the African Union Commodities Strategy and Industrialization [Type here] The African Union Commodities Strategy and Industrialization 1. Africa has about 12 per cent of the world
SECTOR ASSESSMENT (SUMMARY): TRANSPORT 1
: TRANSPORT 1") Country Partnership Strategy: Azerbaijan, 2014 2018 SECTOR ASSESSMENT (SUMMARY): TRANSPORT 1 Sector Road Map 2 1. Sector Performance, Problems, and Opportunities 1. Sector performance. Azerbaijan s transport
Country Partnership Strategy: Azerbaijan, 2014 2018 SECTOR ASSESSMENT (SUMMARY): TRANSPORT 1 Sector Road Map 2 1. Sector Performance, Problems, and Opportunities 1. Sector performance. Azerbaijan s transport
INTERNATIONAL WATERS IN AFRICA COOPERATION AND GROWTH
 INTERNATIONAL WATERS IN AFRICA COOPERATION AND GROWTH April 11, 2013 Gustavo Saltiel Program Manager, CIWA A Multi-Donor Program Supporting Cooperation in International Waters in Africa DEVELOPMENT CHALLENGES:
ENTERPRISE SURVEYS WHAT BUSINESSES EXPERIENCE. Niger 2017 Country Profile ENTERPRISE SURVEYS
 ENTERPRISE SURVEYS ENTERPRISE SURVEYS WHAT BUSINESSES EXPERIENCE Niger 17 Country Profile 1 Contents Introduction... 3 Firms Characteristics... 4 Workforce... Firm Performance... Physical Infrastructure...
ENTERPRISE SURVEYS WHAT BUSINESSES EXPERIENCE. Sweden 2014 Country Profile ENTERPRISE SURVEYS
 ENTERPRISE SURVEYS ENTERPRISE SURVEYS WHAT BUSINESSES EXPERIENCE Sweden 2014 Country Profile 1 Contents Introduction... 3 Firms Characteristics... 4 Workforce... 5 Firm performance... 5 Physical Infrastructure...
Maritime Transport; Increasing African Ports Capacity and Efficiency for Economic Growth
 The First Ordinary Session of the African Union Specialized Technical Committee on Transport, Intercontinental and Interregional Infrastructures, Energy and Tourism THEME: Financing Infrastructure in Africa
Therefore, we need to advocate for increased volume and quality of investment of public fund through national budget.
 The Comprehensive Africa Agriculture Development Programme (CAADP) is a critical Pan African initiative launched by the New Partnership for African Development (NEPAD) concerning the agricultural sector
Introduction and Overview
 CHAPTER 1 Introduction and Overview The objective of the study is to examine, identify, and quantify the factors behind Africa s high prices for road transport. Such prices are a major obstacle to economic
ENTERPRISE SURVEYS WHAT BUSINESSES EXPERIENCE. The Gambia 2018 Country Profile ENTERPRISE SURVEYS
 ENTERPRISE SURVEYS ENTERPRISE SURVEYS WHAT BUSINESSES EXPERIENCE The Gambia 218 Country Profile 1 Contents Introduction... 3 Firms Characteristics... 4 Workforce... Firm Performance... Physical Infrastructure...
Water Access in Sub-Saharan Saharan Africa Challenges and Opportunities
 Water Tribune - Week 3 Water and Society Water Access in Sub-Saharan Saharan Africa Challenges and Opportunities Presented by: Ventura Bengoechea Lead Water and Sanitation Specialist WORLD BANK EXPO Zaragoza
UNITED NATIONS ECONOMIC COMMISSION FOR AFRICA. Meeting of African Ministers responsible for Energy. Meeting of Experts. Statement
 UNITED NATIONS ECONOMIC COMMISSION FOR AFRICA Meeting of African Ministers responsible for Energy Meeting of Experts Statement By Joseph Atta-Mensah Director, Regional Integration, Infrastructure and Trade
Zimbabwe s Infrastructure: A Continental Perspective
 Public Disclosure Authorized Public Disclosure Authorized Public Disclosure Authorized Public Disclosure Authorized COUNTRY REPORT Zimbabwe s Infrastructure: A Continental Perspective Nataliya Pushak and
BENCHMARKING PUBLIC PROCUREMENT 2017
 BENCHMARKING PUBLIC PROCUREMENT 2017 ASSESSING PUBLIC PROCUREMENT REGULATORY SYSTEMS IN 180 ECONOMIES EXECUTIVE SUMMARY 2016 International Bank for Reconstruction and Development / The World Bank 1818
Developing Climate-Smart Cities
 B2: Physical Capital Sarah Farhat/World Bank. Further permission required for reuse. Chapter 7 Developing Climate-Smart Cities The World Bank will support climate- and disaster-resilient development in
30 October Transnet s performance on an upward trajectory
 30 October 2017 Transnet s performance on an upward trajectory Revenue up 13,8% to R37,1 billion, underlined by: a 7,9% increase in general freight volumes; a 6,5% increase in export coal railed volumes;
Ipad Presentation: TFR Operation in SADC Countries
 Ipad Presentation: TFR Operation in SADC Countries Presentation Layout Overview of Transnet Freight Rail Role Played in SADC Infrastructure & Transport Challenges Elements of Vision 2025 Strategy Benefit
AID FOR TRADE: CASE STORY
 AID FOR TRADE: CASE STORY WORLD BANK East Africa Trade and Transport Facilitation 1 AID FOR TRADE CASE STORY: THE WORLD BANK A World Bank effort in East Africa has lowered transit costs and transport times
EnterpriseSurveys Mozambique: Country Profile 2007
 EnterpriseSurveys Mozambique: Country Profile 2007 Region: Sub-Saharan Africa Income Group: Low income Population: 21,372,202 GNI per capita: US$320.00 Contents Introduction Snapshot Corruption Tax, Regulations,
ACHIEVING SDG7 IN AFRICA
 AFRICA REGIONAL FORUM ON SUSTAINABLE DEVELOPMENT Transformation towards sustainable and resilient societies in Africa ACHIEVING SDG7 IN AFRICA 03-04 May 2018 Dakar, Senegal Affordable and clean energy
Infrastructure endowment
 Infrastructure endowment Most public investment in Member States as well as that supported by the Structural Funds goes on infrastructure. An adequate endowment of infrastructure is a necessary, but not
Ghana s sustained agricultural growth: Putting underused resources to work
 Ghana s sustained agricultural growth: Putting underused resources to work Henri Leturque and Steve Wiggins Key messages 1. With agricultural growth averaging more than 5% a year during the past 25 years,
Logistics augmentation and coordination for humanitarian corridors into Central African Republic Standard Project Report 2017
 Fighting Hunger Worldwide Project Number: 200934 Project Category: Regional Special Operation Project Approval Date: February 11, 2016 Planned Start Date: January 15, 2016 Actual Start Date: January 15,
Industry and infrastructure can contribute substantially to African economic growth
 Industry and infrastructure can contribute substantially to African economic growth Sindiso Ndema Ngwenya Paper prepared for presentation at the Mining, Agriculture And Development: Bread from stones?
SUB-SAHARAN AFRICA (SSA) POWER SECTOR STRATEGY. October 2016
 POWER SECTOR STRATEGY. October 2016") SUB-SAHARAN AFRICA (SSA) POWER SECTOR STRATEGY October 2016 Table of Contents Table of Contents 1. How we approach assessment of a regional market? 2. Example: Sub-Sahara Africa (SSA) 3. SSA strategy on
SUB-SAHARAN AFRICA (SSA) POWER SECTOR STRATEGY October 2016 Table of Contents Table of Contents 1. How we approach assessment of a regional market? 2. Example: Sub-Sahara Africa (SSA) 3. SSA strategy on
Trade and Transport Corridor Management A Toolkit for Performance Improvement
 WORLD BANK Trade and Transport Corridor Management A Toolkit for Performance Improvement Monica Alina Mustra International Trade Department World Bank November 1, 2012 Colombo New Solutions for an Old
Michael Kilgariff Speech to the Queensland Infrastructure Summit Tuesday 8 December 2015
 Michael Kilgariff Speech to the Queensland Infrastructure Summit Tuesday 8 December 2015 Slide 1 Thank you for the invitation to speak with you at the Queensland Infrastructure Summit. Today, it will be
Using ODA for facilitating private investment in African energy sector
 Using ODA for facilitating private investment in African energy sector Yoshiro Kurashina Director, Regional Strategy Unit for Africa Japan International Cooperation Agency (JICA) Johannesburg, 11/11/2009
ENTERPRISE SURVEYS WHAT BUSINESSES EXPERIENCE ENTERPRISE SURVEYS. Guinea 2016 Country Profile
 ENTERPRISE SURVEYS ENTERPRISE SURVEYS WHAT BUSINESSES EXPERIENCE Guinea 16 Country Profile 1 Contents Introduction... 3 Firms Characteristics... Workforce... Firm Performance... Physical Infrastructure...
The Trade Finance Bank for Africa
 The Trade Finance Bank for Africa Prospects for Cocoa Processing and Consumption in Africa Yusuf Daya Senior Manager Research and International Cooperation 3 rd World Cocoa Conference Bavaro, Dominican
ENTERPRISE SURVEYS WHAT BUSINESSES EXPERIENCE. Sierra Leone 2017 Country Profile ENTERPRISE SURVEYS
 ENTERPRISE SURVEYS ENTERPRISE SURVEYS WHAT BUSINESSES EXPERIENCE Sierra Leone 17 Country Profile 1 Contents Introduction... 3 Firms Characteristics... 4 Workforce... Firm Performance... Physical Infrastructure...
Time for Africa. Capturing the African meat and poultry investment opportunity
 Time for Africa Capturing the African meat and poultry investment opportunity Nan-Dirk Mulder, 4 October 2017 Rabobank: The world s leading global F&A bank Rabobank group global presence Rabobank in Africa
Africa is lagging behind in terms of energy use, with limited access to electricity and biomass often remaining the main energy source
 Africa is lagging behind in terms of energy use, with limited access to electricity and biomass often remaining the main energy source Power consumption per capita in Africa remains very low, especially
Boosting youth employment in Africa: what works and why?
 Boosting youth employment in Africa: what works and why? Summary and highlights of the synthesis report for the INCLUDE/MFA conference, 30 May 2017 in The Hague 1 To download the full synthesis report
TRANSPORT. Networks that move Zimbabwe forward
 TRANSPORT Networks that move Zimbabwe forward Zimbabwe has one of the most developed transport networks in Africa. Much of this was inherited at independence in 1980, but it has been significantly extended
Ex-Ante Evaluation Africa Division 4, Africa Department, JICA 1. Basic Project Information 2. Background and Necessity of the Project
 Ex-Ante Evaluation Africa Division 4, Africa Department, JICA 1. Basic Project Information Country: Republic of Côte d Ivoire Project: Abidjan Port Cereal Berth Construction Project Loan Agreement: March
Table of contents. Executive summary Part I The traffic growth challenge... 25
 TABLE OF CONTENTS 7 Table of contents Abbreviations... 13 Executive summary... 15 Part I The traffic growth challenge... 25 Chapter 1 The global and regional outlook for the economy, trade and transport...
ENTERPRISE SURVEYS WHAT BUSINESSES EXPERIENCE. Timor-Leste 2015 Country Profile ENTERPRISE SURVEYS
 ENTERPRISE SURVEYS ENTERPRISE SURVEYS WHAT BUSINESSES EXPERIENCE Timor-Leste Country Profile 1 Contents Introduction... 3 Firms Characteristics... 4 Workforce... Firm performance... Physical Infrastructure...
ENTERPRISE SURVEYS WHAT BUSINESSES EXPERIENCE. Papua New Guinea 2015 Country Profile ENTERPRISE SURVEYS
 ENTERPRISE SURVEYS ENTERPRISE SURVEYS WHAT BUSINESSES EXPERIENCE Papua New Guinea 21 Country Profile 1 Contents Introduction... 3 Firms Characteristics... 4 Workforce... Firm performance... Physical Infrastructure...
The Democratic Republic of Congo s Infrastructure
 Public Disclosure Authorized Policy Research Working Paper 5602 WPS5602 Public Disclosure Authorized Public Disclosure Authorized The Democratic Republic of Congo s Infrastructure A Continental Perspective
Corridor Logistics Inititatives. Jean Kizito Kabanguka
 Corridor Logistics Inititatives Jean Kizito Kabanguka In this presentation. Introduction Logistics Costs vs Trade Competitiveness Landlocked Countries Vs Transit Corridors Logistics Cost and Delays Transport
How freight transport can contribute to the achievement of sustainable economic development in Zimbabwe
 UNCTAD Multiyear Expert Meeting on Transport, Trade Logistics and Trade Facilitation 21-23 November 2018, Geneva Sustainable freight transport in support of the 2030 Agenda for Sustainable Development
ENTERPRISE SURVEYS WHAT BUSINESSES EXPERIENCE. Honduras 2016 Country Profile ENTERPRISE SURVEYS
 ENTERPRISE SURVEYS ENTERPRISE SURVEYS WHAT BUSINESSES EXPERIENCE Honduras 216 Country Profile 1 Contents Introduction... 3 Firms Characteristics... Workforce... Firm Performance... Physical Infrastructure...
Situation as of November 2016
 Situation as of November 2016 - - The FAO/GIEWS Country Cereal Balance System (CCBS) is a database of annual supply and utilization balances for main cereals, covering all countries of the world. It has
Learning to Compete Accelerating Industrial Development in Africa
 Learning to Compete Accelerating Industrial Development in Africa A COLLABORATIVE RESEARCH PROGRAM OF THE AFRICAN DEVELOPMENT BANK, THE BROOKINGS INSTITUTION, AND THE UNU WORLD INSTITUTE OF DEVELOPMENT
The Comprehensive Africa Agricultural Development Program (CAADP) Recent Developments in Implementation at the Country Level
 Recent Developments in Implementation at the Country Level") The Comprehensive Africa Agricultural Development Program (CAADP) Recent Developments in Implementation at the Country Level IFA Africa Forum 3 rd June, 2010 Paris, France Presentation Outline The NEPAD
The Comprehensive Africa Agricultural Development Program (CAADP) Recent Developments in Implementation at the Country Level IFA Africa Forum 3 rd June, 2010 Paris, France Presentation Outline The NEPAD
F E A T U R E V O L U M E 8 I S S U E 3 A M B E R WAV E S E C O N O M I C R E S E A R C H S E R V I C E / U S D A. WFP/Tom Haskell
 A M B E R WAV E S V O L U M E 8 I S S U E 3 16 WFP/Tom Haskell E C O N O M I C R E S E A R C H S E R V I C E / U S D A A Positive Path for Food Security in Sub-Saharan Africa Options and Challenges Stacey
ENTERPRISE SURVEYS WHAT BUSINESSES EXPERIENCE. Thailand 2016 Country Profile ENTERPRISE SURVEYS
 ENTERPRISE SURVEYS ENTERPRISE SURVEYS WHAT BUSINESSES EXPERIENCE Thailand 6 Country Profile Contents Introduction... 3 Firms Characteristics... 4 Workforce... Firm performance... Physical Infrastructure...
Agriculture Sector Dialogue Phase II
 Agriculture Sector Dialogue Phase II Lecture 1 Introduction & Overview of the Training Why Evaluate Agricultural Projects Challenges in Evaluating Agricultural Projects Overview Goal: To provide an orientation
SECTOR ASSESSMENT (SUMMARY): ENERGY 1
: ENERGY 1") Country Partnership Strategy: Azerbaijan, 2014 2018 SECTOR ASSESSMENT (SUMMARY): ENERGY 1 Sector Road Map A. Sector Performance, Problems, and Opportunities 1. Azerbaijan is rich in energy resources. The
Country Partnership Strategy: Azerbaijan, 2014 2018 SECTOR ASSESSMENT (SUMMARY): ENERGY 1 Sector Road Map A. Sector Performance, Problems, and Opportunities 1. Azerbaijan is rich in energy resources. The
ENTERPRISE SURVEYS WHAT BUSINESSES EXPERIENCE. Myanmar 2016 Country Profile ENTERPRISE SURVEYS
 ENTERPRISE SURVEYS ENTERPRISE SURVEYS WHAT BUSINESSES EXPERIENCE Myanmar Country Profile 1 Contents Introduction... 3 Firms Characteristics... Workforce... Firm Performance... Physical Infrastructure...
SECTOR ASSESSMENT (SUMMARY): TRANSPORT, AND INFORMATION AND COMMUNICATION TECHNOLOGY. 1. Sector Performance, Problems, and Opportunities
: TRANSPORT, AND INFORMATION AND COMMUNICATION TECHNOLOGY. 1. Sector Performance, Problems, and Opportunities") Anhui Intermodal Sustainable Transport Project (RRP PRC 45021-002) SECTOR ASSESSMENT (SUMMARY): TRANSPORT, AND INFORMATION AND COMMUNICATION TECHNOLOGY 1. Sector Performance, Problems, and Opportunities
Anhui Intermodal Sustainable Transport Project (RRP PRC 45021-002) SECTOR ASSESSMENT (SUMMARY): TRANSPORT, AND INFORMATION AND COMMUNICATION TECHNOLOGY 1. Sector Performance, Problems, and Opportunities
Transnet delivers a sterling set of financial results
 20 August 2018 Transnet delivers a sterling set of financial results Revenue increased by 11,3% to R72,9 billion for the year ending in March 2018, driven by: a 4,3% increase in railed export coal volumes;
SADC ENERGY PROGRAMMES AND PROJECTS.
 SADC ENERGY PROGRAMMES AND PROJECTS. GABORONE, BOTSWANA October 2006 1. SECTORAL OBJECTIVES 1.1 The overall objective of the SADC Energy Sector is to ensure the availability of sufficient, reliable, least
Banking onmunicipalities
 Banking onmunicipalities World Bank Support in Sub-Saharan Africa With 280 million people 36 percent of the total population living in cities, the Sub- Saharan Africa Region is experiencing rapid urban