or through any bookseller.
|
|
|
- Alexina O’Neal’
- 6 years ago
- Views:
Transcription
1 Published by the Stationery Office, Dublin, Ireland. To be purchased from the: Central Statistics Office, Information Section, Skehard Road, Cork. Government Publications Sales Office, Sun Alliance House, Molesworth Street, Dublin 2, Ireland. or through any bookseller. Prn A12/0467 Price 5.00 March 2012
2 Government of Ireland 2012 Material compiled and presented by the Central Statistics Office. Reproduction is authorised, except for commercial purposes, provided the source is acknowledged. ISSN ISBN Cover photographs: Creagha, Co. Galway, courtesy of Gerry Walker; Grey partridges at Lough Boora parklands complex, Co. Offaly, courtesy of Thomas Egan, Bord na Mona
3 Contents Page Introduction.. 4 Main findings... 5 Domains 1. Air Greenhouse Gases and Climate Change Water Land Use Energy Transport Waste Biodiversity and Heritage Environmental Economy...75 Appendices Definitions and notes Data sources... 97
4 Introduction The National Statistics Board (NSB) Strategy for Statistics recommended that the CSO expand the move towards evidence-based policy-making by developing a set of indicators based around environmental data. The NSB requested that the selected indicators should be consistent with international statistical concepts and facilitate international comparison. In comparison with social and economic statistics, the environment domain is undeveloped in terms of depth and coverage. The intention is to publish this report on a biennial basis and it is expected that the 2014 report will contain changes and enhancements arising from user feedback and an increase in data availability. Hence, this report should be seen as a preliminary analysis rather than a definitive or comprehensive report. A total of 92 indicators covering nine separate domains have been selected for this publication. The CSO consulted with various departments and agencies in order to ensure the most appropriate indicators were used. Most of the indicators are presented in a time-series format for Ireland, while the international context is shown by comparing Ireland with other EU Member States for the latest year for which data are available. The environment area is wide-ranging and the nine domains cover areas as diverse as greenhouse gases, waste, and biodiversity. There is a large number of EU legal requirements to compile environment related statistics in areas such as energy balances, waste materials, special habitats, and material flow accounts. This report attempts to bring together the most important indicators from these domains to facilitate easy access for users. The CSO wishes to thank: Birdwatch Ireland; Coillte; Department of Agriculture, Food and the Marine; Department of Arts, Heritage and the Gaeltacht; Department of the Environment, Community and Local Government; Department of Transport, Tourism and Sport; DKM Economic Consultants; Environmental Protection Agency; Forest Service; Met Éireann; Office of Public Works; Sea Fisheries Protection Authority, Sustainable Energy Authority of Ireland and University College Dublin for providing us with data and technical advice on the most appropriate indicators for Ireland. Photographs in this publication are supplied courtesy of Bord na Mona, Department of Agriculture, Food and the Marine, Dave Lester, Gerry Brady, Gerry Walker, Niall Brew, Paul Molony, Sea Fisheries Protection Authority and Thornton s Recycling. 4
5 Main findings Air Air quality in Ireland has improved quite considerably over the last decade. By 2010, emissions for three of the four pollutants (sulphur dioxide, ammonia and non-methane volatile organic compounds) under the National Emission Ceiling (NEC) Directive were below their respective emissions ceilings. Emissions of nitrogen oxides (NO x ) were 12% above the prescribed ceiling in Benchmarking EU Member States 2010 emissions, in comparison with the NEC Directive targets, showed Ireland ranked 17 th for sulphur dioxide, 22 nd for nitrogen oxides, 19 th for ammonia, and 12 th in terms of NMVOC emissions. Greenhouse Gases and Climate Change Water Greenhouse gas emissions fell substantially in 2009 and by 2010 Ireland was only slightly above the five years average limit set by the Kyoto Protocol. Energy (22%), agriculture (30%), and transport (19%) accounted for just over 70% of Ireland s greenhouse gas emissions in Ireland s greenhouse gas emissions on a per capita basis were the second highest in the EU in Ireland ranked fourth among EU Member States (after Cyprus, Malta and Greece) in terms of compliance with bathing water quality guide values in In 2010, 99.8% of public drinking water supplies in Ireland and 95.9% of group water supplies complied with E.coli standards. 93% of urban waste water in Ireland received secondary treatment in Land Use In 2010, 10.7% of Ireland s land was covered by forestry. This was the second lowest proportion of forest cover in the EU. Although the area farmed organically increased by over 150% between 1997 and 2009, Ireland had the third lowest percentage of agricultural land designated as organic in the EU in Ireland had the fifth largest cattle herd in the EU in 2010 with 6.8% of total cattle numbers. House completions in Ireland peaked in 2006 with 93,400 completions and have since fallen to 10,500 in In 2010, there were 3.3 house completions per 1,000 population in Ireland. Energy Ireland s primary energy requirement increased from 9.5 million tonnes of oil equivalent in 1990 to 16.5 million t.o.e. in 2008 but then decreased to 14.8 million in Transport accounted for 40% of Ireland s final energy consumption in Renewable energy accounted for 2% of Ireland s total final energy consumption in Ireland had an imported energy dependency ratio of 89% in 2009, the fourth highest in the EU. 5
6 Transport Waste There has been a substantial increase in the number of low emission vehicles licensed since the introduction in 2008 of motor taxation rates based upon emissions. In 2011, 90% of new private vehicles licensed were in emission bands A and B. There was a substantial fall in the number of air passengers travelling through Irish airports from 29.2 million in 2008 to 21.7 million in The proportion of women aged 15 or over at work who drove to work increased from 27% in 1986 to 62% in In contrast the corresponding proportions for men were 42% in 1986 and 54% in % of working women aged 15 or over walked to work in 2006 compared with 9% of working men aged 15 or over. The amount of municipal waste generated fell from 800 kilograms per capita in 2006 to 620 kgs per capita in Municipal waste sent to landfill was just below 1.5 million tonnes in 2010 which was an improvement on the two million tonnes in In 2008, there were 9 kgs per capita of electrical waste collected from Irish households, which is more than twice the 4 kgs specified in the EU Waste Electrical and Electronic Equipment (WEEE) directive. Biodiversity and Heritage Ireland had the smallest percentage of land in the EU designated as a Special Protected Area, under the EU Birds Directive, at only 3% of total land area in Ireland at 11% had less land designated as a Special Protected Area under the EU Habitats Directive than the EU average of 14% in Environmental Economy Revenue from environmental related taxes fell by 660 million between 2007 and The consumer price index for petrol and diesel increased by 13.5% and 16.5% respectively between December 2010 and December In 2011, Ireland imported 6.8 billion of fuel. 76

7 1. Air 7
8 Contents 1.1 Ireland: Particulate matter (PM 2.5 ) emissions EU: Particulate matter (PM 2.5 ) emissions Ireland: Sulphur dioxide emissions EU: Sulphur dioxide emissions 2010 and NEC 2010 ceiling 1.5 Ireland: Nitrogen oxides emissions EU: Nitrogen oxides emissions 2010 and NEC 2010 ceiling 1.7 Ireland: Ammonia emissions EU: Ammonia emissions 2010 and NEC 2010 ceiling 1.9 Ireland: NMVOC emissions EU: NMVOC emissions 2010 and NEC 2010 ceiling 1.11 Ireland: Atmospheric deposition rates Ireland: Ozone threshold exceedances EU: Ozone threshold exceedances April-September 2010 Photographs: South Bull Island, Co. Dublin courtesy of Paul Molony; Poolbeg power station, Ringsend, Dublin courtesy of Niall Brew 8
9 1.1 Ireland: Particulate matter (PM 2.5) emissions EU: Particulate matter (PM 2.5) emissions tonnes PM Czech Republic Belgium Cyprus Netherlands United Kingdom Germany France Spain Ireland Italy 2000= Austria Estonia Portugal Slovenia Power stations Industrial Transport Residential & Commercial Agriculture, Forestry and Fishing Other Source: Environmental Protection Agency Poland Finland Sweden Romania Hungary Emissions of PM 2.5 varied between 10,000 and 11,500 tonnes between 1990 and Emissions then decreased by 19% between 2007 and 2010 to 8,200 tonnes. Lithuania Bulgaria Denmark Transport accounted for 31% of emissions of PM 2.5 in 2010, with Industry accounting for 30%. Slovakia Latvia Malta 9 Ireland ranked 9th in 2009 among EU Member States for emissions of PM 2.5 in terms of the relative change since Source: European Environment Agency Domain 1 Air
10 Ireland: Sulphur dioxide emissions tonnes SO Power stations Industrial Transport NEC 2010 target Residential & Commercial Agriculture, Forestry & Fishing Other Source: Environmental Protection Agency Ireland s sulphur dioxide emissions have fallen from 182,300 tonnes in 1990 to 25,900 tonnes in Emissions from Power stations fell by 93,700 tonnes in the same period. The fall in the emissions from Power stations is mainly due to a switch from oil and coal to gas and the installation of technologies which reduce sulphur emissions. Ireland was below the National Emissions Ceiling (NEC 2010) for sulphur dioxide for the first time in All 27 Member States were below their ceiling level of emissions in Ireland ranked 17th among EU Member States in terms of 2010 emissions relative to the 2010 NEC ceiling. 1.4 EU: Sulphur dioxide emissions 2010 and NEC 2010 ceiling Country 2010 emissions 000 tonnes SO 2 NEC 2010 ceiling % Below 2010 ceiling Hungary % Latvia % Denmark % Lithuania % Slovenia % Romania % Portugal % Luxembourg % Italy % Bulgaria % Austria % Greece % Sweden % Cyprus % Spain % Finland % Ireland % Slovakia % Czech Republic % Netherlands % Belgium % Poland 970 1,397-31% United Kingdom % France % Estonia % Germany % Malta % Source: European Environment Agency Domain 1 Air
11 Ireland: Nitrogen oxides emissions Power stations Industrial Transport NEC 2010 target 000 tonnes NOx 140 Source: Environmental Protection Agency Ireland s nitrogen oxides emissions have fallen from 121,000 tonnes in 2005 to 72,600 tonnes in This is still 12% above the NEC ceiling of 65,000 tonnes. In 2010, 16 of the EU Member States were below their emissions ceiling. Ireland ranked 22nd among EU Member States in 2010 in terms of emissions relative to the 2010 NEC ceiling Residential & Commercial Agriculture, Forestry & Fishing Other EU: Nitrogen oxides emissions 2010 and NEC 2010 ceiling 000 tonnes NOx Country 2010 emissions NEC 2010 % Above/Below ceiling ceiling Bulgaria % Lithuania % Latvia % Estonia % Romania % Slovakia % Portugal % Cyprus % Hungary % Czech Republic % Greece % United Kingdom 1,106 1,167-5% Finland % Italy % Slovenia % Poland % Malta 8 8 1% Denmark % Netherlands % Spain % Sweden % Ireland % Belgium % Germany 1,323 1,051 26% France 1, % Austria % Luxembourg % Source: European Environment Agency Domain 1 Air
12 Ireland: Ammonia emissions tonnes NH EU: Ammonia emissions 2010 and NEC 2010 ceiling Country 2010 emissions 000 tonnes NH 3 NEC 2010 ceiling % Above/Below ceiling Estonia % Lithuania % Latvia % Bulgaria % Domain 1 Air 80 Malta % Portugal % 60 Luxembourg % 40 Cyprus % Poland % 20 Slovakia % Hungary % Romania % France % Dairy cattle Other livestock N-excreted on pasture Residential Other cattle Synthetic fertiliser use Road transport NEC 2010 target Czech Republic % Slovenia % Greece % Italy % Source: Environmental Protection Agency Sweden % Ireland was 8% below the NEC 2010 emissions ceiling for ammonia in Ireland % Belgium % Austria % All but two EU Member States were at or below their respective 2010 ceilings. Ireland ranked 19th in 2010 in terms of emissions relative to the NEC 2010 ceiling. Netherlands % United Kingdom % Germany % Denmark % Spain % Finland % Source: European Environment Agency
13 Ireland: NMVOC emissions tonnes NMVOC Transport Power stations Industrial Other Fugitive and solvents Residential & Commercial Source: Environmental Protection Agency Ireland s emissions of Non-Methane Volatile Organic Compounds fell below the NEC 2010 ceiling for the first time in The majority of these emissions are derived from Fugitive and solvents. Emissions from transport have fallen from 50,500 tonnes in 1990 to 9,000 tonnes in Ireland ranked 12th among EU Member States in 2010 in terms of emissions relative to the 2010 NEC ceiling. Two EU Member States were still above their emission ceiling in Agriculture, Forestry & Fishing NEC 2010 target EU: NMVOC emissions 2010 and NEC 2010 ceiling 000 tonnes NMVOC NEC 2010 % Above/Below Country 2010 emissions ceiling ceiling Malta % Slovakia % Latvia % Bulgaria % United Kingdom 789 1,200-34% Czech Republic % Greece % Lithuania % Belgium % Estonia % Hungary % Ireland % Cyprus % France 852 1,050-19% Netherlands % Poland % Sweden % Austria % Slovenia % Romania % Finland % Portugal % Italy 1,103 1,159-5% Luxembourg 9 9-2% Denmark % Spain % Germany 1, % Source: European Environment Agency Domain 1 Air
14 Ireland: Atmospheric deposition rates Year Rainfall volume mm Concentration Deposition NH 4 mg/l NO 3 mg/l SO 4 mg/l NH 4 mg m 2 NO 3 mg m 2 SO 4 mg m , mg/l Rainfall volumes and pollutant concentration rates mms 1,400 1,200 1, Domain 1 Air , , , , , Rainfall volume NH₄ mg/l NO₃ mg/l SO₄ mg/l , , , Source: Met Éireann, University College Dublin and Coillte Atmospheric deposition rates mg m Deposition of sulphate (SO 4 ) has fallen from 332 mgs per m 2 in 1991 to 173 mgs per m 2 in Similarly, the concentration of SO 4 in rainwater has also almost halved from 21 mgs per litre in 1991 to 12 mgs per litre in The level of concentration and deposition of NH 4 and NO 3 in rainfall has varied widely from year to year, mainly due to variations in rainfall NH₄ mg m² NO₃mg m² SO₄ mg m²
15 1.12 Ireland: Ozone threshold exceedances EU: Ozone threshold exceedances April-September 2010 Year Days Source: Environmental Protection Agency Under EU Directive 2008/50/EC, every EU Member State is permitted a maximum of 25 days per year in which an ozone threshold of 120 µg/m 3 may be exceeded. Ireland did not exceed this number of days in any year during the period 1998 to The year with the highest number of exceedances was 2003, when 18 days were recorded as being above the threshold value. 15 During the months of April to September 2010, both Ireland and Latvia had the fewest number of days exceeding the ozone threshold, when four days were above the 120 µg/m 3 limit. Nineteen EU Member States exceeded the maximum 25 days limit. Number of days exceeding limit < < < < Source: European Environment Agency Domain 1 Air
16


17 2. Greenhouse Gases and Climate Change 17
18 Contents 2.1 Ireland: Greenhouse gas emissions EU: Greenhouse gas emissions Ireland: Greenhouse gas emissions per capita EU: Greenhouse gas emissions per capita Ireland: Greenhouse gas emissions by gas EU: CO 2 emissions Ireland: Greenhouse gas emissions by sector Ireland: Average annual temperature Ireland: Annual rainfall Photographs: Lough Ennell, Co. Westmeath and Kilmainham, Co. Dublin courtesy of Paul Molony 18
19 2.1 Ireland: Greenhouse gas emissions EU: Greenhouse gas emissions 2009 million tonnes CO 2 eq. 70 Country Indexed to Kyoto base year 2009 emissions index Kyoto limit index % Above/Below target 19 Total national emissions Kyoto limit Source: Environmental Protection Agency Under the Kyoto Protocol, Ireland's total emissions are limited to an average of 62.8 million tonnes carbon dioxide (CO 2 ) equivalent per annum in the period After the first three years of this period Ireland is currently 5.5 million tonnes above the target when the impact of the EU Emissions Trading Scheme and approved forest sinks are taken into account. Greenhouse gas emissions for Ireland in 2009, at 61.7 million tonnes CO 2 equivalent, fell below the five year ( ) average annual Kyoto limit. Emissions fell again to 61.3 million tonnes CO 2 equivalent in Ireland s 2009 emissions ranked 19 th among EU countries relative to the Kyoto limit. In 2009, six EU Member States were above their respective Kyoto emissions limits Estonia % Latvia % Lithuania % Bulgaria % Romania % Hungary % Slovakia % Poland % Czech Republic % Sweden % United Kingdom % Belgium % Greece % France % Finland % Germany % Portugal % Netherlands % Ireland % Italy % Slovenia % Spain % Denmark % Austria % Luxembourg % Note: Data not available for Cyprus or Malta Source: Eurostat Domain 2 Greenhouse Gases and Climate Change
20 Ireland: Greenhouse gas emissions per capita EU: Greenhouse gas emissions per capita 2009 tonnes CO 2 eq. per capita Source: Environmental Protection Agency and CSO Although Ireland s emissions of greenhouse gases per capita have been falling steadily since 2001, Ireland had the second highest level in the EU in 2009, exceeded only by Luxembourg. The high emissions levels for Luxembourg can be attributed to the large number of people who travel to and from neighbouring countries to work and contribute to the national emissions. At 13.8 tonnes of CO 2 equivalent per capita, Ireland was 50% higher than the EU average of 9.2 tonnes of CO 2 equivalent per capita in Latvia Romania Lithuania Sweden Hungary Malta Portugal Bulgaria Slovakia Spain France Italy United Kingdom EU Slovenia Austria Poland Norway Greece Denmark Germany Belgium Cyprus Netherlands Finland Estonia Czech Republic Ireland Luxembourg tonnes CO 2 eq. per capita Domain 2 Greenhouse Gases and Climate Change Source: European Environment Agency
21 2.5 Ireland: Greenhouse gas emissions by gas EU: CO 2 emissions % of total 000 tonnes CO 2 eq. Year CO 2 CH 4 N 20 HFC, PFC, SF 6 Total % 25% 17% 0% 55, % 24% 16% 0% 58, % 20% 14% 1% 68, % 19% 13% 1% 70, % 20% 13% 1% 68, % 20% 12% 1% 68, % 19% 12% 1% 68, % 18% 12% 1% 69, % 19% 12% 1% 68, % 18% 11% 1% 68, % 18% 11% 1% 67, % 19% 12% 1% 61, % 19% 13% 1% 61,314 Source: Environmental Protection Agency Carbon dioxide (CO 2 ), which accounted for 59% of Ireland s greenhouse gas emissions in 1990 increased to 67% in Ireland ranked second highest in the EU in terms of per capita greenhouse gas emissions in 2009 and ninth highest for per capita carbon dioxide emissions in the same period. The difference in ranking shows the contribution of the agriculture sector to Ireland s greenhouse gas emissions, where methane and nitrous oxides accounted for 19% and 13% respectively of Ireland s total greenhouse gas emissions in Latvia Lithuania Romania Hungary Sweden Portugal France Bulgaria Malta Spain Slovakia Italy EU United Kingdom Slovenia Austria Poland Denmark Greece Ireland Germany Cyprus Belgium Netherlands Finland Estonia Czech Republic Luxembourg tonnes CO 2 per capita Source: European Environment Agency Domain 2 Greenhouse Gases and Climate Change
22 Ireland: Greenhouse gas emissions by sector % of total 000 tonnes CO 2 eq. Year Energy Residential Average Industry & Agriculture Transport Waste Total annual % Commercial change % 14% 17% 37% 9% 2% 55, % 11% 17% 36% 11% 3% 58, % % 9% 18% 31% 16% 2% 68, % % 10% 18% 29% 16% 2% 70, % % 10% 17% 30% 17% 2% 68, % % 10% 17% 30% 17% 2% 68, % % 10% 17% 30% 18% 2% 68, % % 10% 17% 29% 19% 2% 69, % % 10% 17% 29% 20% 2% 68, % % 10% 18% 28% 21% 2% 68, % % 11% 17% 28% 20% 2% 67, % % 12% 15% 30% 20% 1% 61, % % 13% 15% 30% 19% 1% 61, % Agriculture accounted for 30% of Ireland s greenhouse gas emissions in The transport share of greenhouse gas emissions in Ireland increased from 9% of in 1990 to 21% in 2007, before falling to 19% in Domain 2 Greenhouse Gases and Climate Change Ireland: Share of greenhouse gas emissions by sector tonnes CO 2 eq. 100% 90% 80% 70% 60% 50% 40% 30% 20% 10% 0% Energy Residential Industry & Commercial Agriculture Transport Waste Source: Environmental Protection Agency
23 2.8 Ireland: Average annual temperature degrees Celsius Average temperatures in Ireland varied between 8 o and 10.5 o Celsius since The warmest year was 2007 with an average temperature of 10.4 o Celsius. The thirty years moving average shows that the average temperature for is 0.5 o Celsius higher than the average for The wettest year in the period shown was 2009, when 1,503 mms of rain were recorded, whereas the driest year in this period was 1971, when 915 mms of rain were recorded. Average annual temperature 30 years moving average temperature 2.9 Ireland: Annual rainfall mm 1,600 1,400 1, Annual rainfall (mm) 1, years moving average rainfall Source: Met Éireann Domain 2 Greenhouse Gases and Climate Change
24

25 3. Water 25
26 Contents 3.1 Ireland: Bathing water quality EU: Bathing water quality Ireland: Drinking water quality Ireland: Urban waste water treatment Ireland: River water quality Ireland: Nitrates in groundwater EU: Chemical status of groundwater bodies 2009 Photographs: Dun Briste, Co. Mayo, Gougane Barra, Co. Cork, courtesy of Paul Molony; Powerscourt Waterfall, Co. Wicklow, courtesy of Niall Brew
27 3.1 Ireland: Bathing water quality EU: Bathing water quality 2010 % of total sites surveyed % compliance with guide values Year Sufficient water quality Good water quality % 80.8% % 89.2% % 91.5% % 87.8% % 84.7% % 84.7% % 87.8% % 90.8% % 90.1% % 80.2% % 77.9% % 82.4% % 90.1% Source: Environmental Protection Agency During the 1998 to 2010 period, the proportion of sites with good bathing water quality has varied from a high of 91.5% in 2000 to a low of 77.9% in The proportion stood at 90.1% in Ireland had the fourth best bathing water quality in the EU in 2010, when 90% of sites complied with guide values. This comprises both coastal and inland bathing sites. The EU average was 74% compliance. Cyprus Malta Greece Ireland Bulgaria Portugal Finland United Kingdom Latvia Denmark Germany Spain Sweden Slovenia Italy EU Estonia Austria France Lithuania Czech Republic Luxembourg Netherlands Hungary Slovakia Belgium Poland Romania 27 0% 20% 40% 60% 80% 100% Source: European Environment Agency Domain 3 - Water
28 Ireland: Drinking water quality Year Compliance of public water supplies with E. coli standard Compliance of group water supplies with E. coli standard Compliance of public water supplies with THM standard % of total tested Compliance of group water supplies with THM standard % 74.1% : : % 70.8% : : % 74.1% : : % 80.9% : : % 83.2% : : % 85.5% 96.3% 99.2% % 77.5% 96.2% 99.7% % 82.3% 95.7% 98.8% % 85.2% 97.3% 99.0% % 89.6% 96.4% 99.4% % 93.5% 87.4% 89.4% % 95.9% 89.3% 85.5% Source: Environmental Protection Agency Ireland: Drinking water quality % of total tested 100% 90% 80% 70% 60% 50% 40% 30% 20% 10% Domain 3 - Water The quality of public drinking water supplies has increased from 96% compliance with the E.coli standard in 1999 to almost 100% since While group water schemes did not have as high levels of compliance in earlier years, the quality of group water schemes has improved to 96% compliance in Before 2004, there was no parametric limit for compliance with levels of trihalomethanes (THM). Public water supplies had a compliance rate of around 96% between 2004 and This fell in 2009 when the limit changed from 150 ug/l to 100 ug/l. Group water supplies also had a high compliance rate between 2004 and 2008 of over 99%. This fell in 2009 when the more stringent parametric limit was enforced Compliance of public water supplies with E. coli standard Compliance of group water supplies with E. coli standard Compliance of public water supplies with THM standard Compliance of group water supplies with THM standard 0%
29 3.4 Ireland: Urban waste water treatment Ireland: Urban waste water treatment Years No treatment / Preliminary treatment Primary treatment % waste water treated Secondary treatment % 38% 26% % 41% 29% % 2% 67% % 2% 82% % 1% 90% % 1% 93% Source: Environmental Protection Agency There has been a significant improvement in the level of treatment of urban waste water at agglomerations of over 500 persons. In , 93% of urban waste water received at least secondary treatment compared with only 26% in the period. Only 6% of urban waste water received none or only preliminary treatment in compared with 36% in % waste water treated 100% 90% 80% 70% 60% 50% 40% 30% 20% 10% % No treatment/preliminary treatment Secondary treatment Primary treatment. Domain 3 - Water 29
30 Ireland: River water quality % of channel length surveyed Year Unpolluted Slightly polluted Moderately polluted Seriously polluted % 12% 10% 1% % 17% 11% 1% % 18% 14% 1% % 17% 12% 1% Ireland: River water quality % of channel length surveyed 100% 90% 80% 70% Domain 3 - Water % 18% 12% 1% % 18% 10% 1% % 21% 10% 0% Source: Environmental Protection Agency 60% 50% 40% The proportion of unpolluted river water has fallen from 77% in to 69% in However, the percentage of slightly polluted water has increased from 12% in to 21% in % 20% 10% The level of seriously polluted river water has remained at 1% or less during the same 1987 to 2009 period. 0% Unpolluted Moderately polluted Slightly polluted Seriously polluted
31 3.6 Ireland: Nitrates in groundwater EU: Chemical status of groundwater bodies 2009 NO 3 mg/l (% of total) Year < > % 18% 48% 14% 5% 0% % 16% 48% 10% 5% 2% % 17% 47% 12% 7% 2% % 12% 49% 11% 9% 2% % 20% 41% 12% 4% 1% Source: Environmental Protection Agency Around 50% of cases had between 10 and 25 mg/l of nitrates in groundwater until the period, when the proportion fell to 41%. The less than 5 mg/l category increased from 14% in to 22% in From the latest data available for 20 EU Member States, Ireland ranked ninth in the chemical status of groundwater, with 86% of groundwater bodies deemed to be in good condition. Ireland had 776 bodies sampled, of which 664 were of good status. Latvia Lithuania Sweden Austria Estonia Poland Finland Romania Ireland Hungary United Kingdom Bulgaria Spain Germany Slovakia Netherlands France Italy Belgium Czech Republic % of total surveyed 0% 20% 40% 60% 80% 100% Good Poor Unknown 31 Note: Data available for 20 EU Member States Source: European Environment Agency Domain 3 - Water
32

33 4. Land Use 33
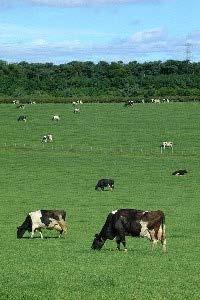
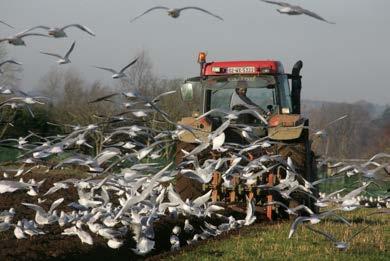
34 Contents 4.1 Ireland: Land use categories Ireland: Forest cover EU: Forest cover Ireland: Planting period in public forestry Ireland: Public forest Ireland: Organic agricultural land EU: Organic agricultural land Ireland: Fertiliser sales EU: Fertiliser sales Ireland: Livestock numbers June 1980-June EU: Share of total livestock numbers December Ireland: House completions EU: House completions Photographs: Grazing cattle and winter ploughing courtesy of Department of Agriculture, Food and the Marine 33 34
35 4.1 Ireland: Land use categories Ireland: Land use categories % of total land area Year Grassland Forest Land Cropland Exploited Peatland Unexploited Wetland Settlement Other Land % 7% 6% 1% 17% 1% 9% % 8% 6% 1% 16% 1% 9% % of total land area 100% 90% % 9% 6% 1% 16% 1% 10% % 9% 6% 1% 15% 1% 10% % 9% 6% 1% 15% 1% 11% % 10% 6% 1% 16% 2% 10% % 10% 6% 1% 15% 2% 12% % 10% 5% 1% 15% 2% 12% % 10% 5% 1% 15% 2% 12% % 10% 5% 1% 15% 2% 11% % 10% 6% 1% 14% 2% 13% % 10% 6% 1% 15% 2% 13% Source: Environmental Protection Agency Grassland accounts for the majority of land use in Ireland, although it has fallen from 58% to 55% of the total land area between 1990 and Grassland Forest Land Cropland Exploited Peatland Unexploited Wetland Settlement Other Land 80% 70% 60% 50% 40% 30% 20% 10% 0% Domain 4 Land Use 35
36 Ireland: Forest cover Year 000 ha 000 ha 000 ha Private forest % of total Public forest % of total Total forest Average annual % change % % 385 : % % % % % % % % % 4.3 EU: Forest cover 2010 Cyprus Finland Sweden Slovenia Lativa Estonia % of total land cover Domain 4 Land Use % % % % % % % % % % % % % % % % % % % % % % % % % % % Austria Slovakia Portugal Spain Bulgaria EU Lithuania Czech Republic Luxemburg % % % Germany % % % Source: Department of Agriculture, Food and the Marine (Forest Service) Italy Poland Ireland s total forest cover area increased by 91% between 1980 and The area of forest owned privately increased from 23% of the total in 1980 to 46% in Greece France Romania Hungary Belgium Forestry accounted for 10.7% of Ireland s total land area in In contrast, 35.5% of the total land area of the EU in 2010 was under forest cover. Ireland ranked 26th among EU countries in terms of the proportion of land area under forest cover. Denmark United Kingdom Netherlands Ireland Malta 0% 20% 40% 60% 80% 100% Source: Forest Europe
37 4.4 Ireland: Planting period in public forestry hectares 4.5 Ireland: Public forest hectares Planting period Coillte Farm partners Total < Total planting Temporarily Unstocked / Being Restocked Total Source: Coillte hectares 120, ,000 Year Area of Afforestation Area of Reforestation Area Clearfelled Source: Coillte Of the 387,000 hectares of public forestry planted since records began, over 20% was planted since the year A total of 33,000 hectares or 9% of forest land is currently either unstocked or being restocked. In the period 2004 to 2010, 56,800 hectares of trees on public forest land were felled. In the same period, just over 49,000 hectares were reforested. 80,000 60, ,000 20,000 0 Domain 4 - Land Use
38 Ireland: Organic agricultural land Year Organic land area 000 hectares Agricultural land area Organic as % of total agricultural land , % , % , % , % 4.7 EU: Organic agricultural land 2009 Austria Sweden Estonia Czech Republic Latvia Italy % of total agricultural land Domain 4 - Land Use , % Slovakia , % Finland , % Slovenia , % Denmark , % Germany , % Spain , % , % , % Source: Department of Agriculture, Food and the Marine Lithuania United Kingdom Portugal Greece Hungary The amount of land used for organic farming in Ireland has grown by 156% between 1997 and It now accounts for 48,000 hectares. Land used for organic farming accounted for 1.2% of total agricultural land in the third smallest percentage of agricultural land given over to organic farming in the EU. Austria, with 18.5%, had the highest percentage of agricultural land farmed organically. Belgium Luxembourg Netherlands Cyprus France Poland Romania Ireland Bulgaria Malta 0% 2% 4% 6% 8% 10% 12% 14% 16% 18% 20% Source: Research Institute of Organic Agriculture FiBL
39 4.8 Ireland: Fertiliser sales tonnes 000 tonnes 000 tonnes Average Average Total Year Nitrogen annual % change Phosphorus annual % change : 68 : % % % % % % % % % % % % % % % % % % % % % % % % % % % % % % 342 Source: Department of Agriculture, Food and the Marine 4.9 EU: Fertiliser sales 2009 Romania Greece Portugal Latvia Austria Spain Cyprus Estonia Hungary Slovakia Bulgaria Italy Sweden Lithuania Czech Republic United Kingdom Finland Slovenia tonnes per 1,000 hectares agricultural land 39 Sales of fertilisers fell on a year by year basis every year from 2000 to 2009, barring a small increase in The sales of fertilisers increased substantially in 2010, due mainly to lower prices, better weather leading to an improved response and higher prices for cattle, sheep and milk leading to a better return on usage. The measure for annual fertiliser sales is from October to September. Ireland had the third highest usage of fertiliser in the EU in 2009, at 105 tonnes per 1,000 hectares of agricultural land. The highest was the Netherlands at 144 tonnes per 1,000 hectares of agricultural land. Denmark France Poland Ireland Germany Netherlands Source: Eurostat (Fertiliser Europe) Domain 4 Land Use
40 Ireland: Livestock numbers June 1980-June Year Total cattle Average annual % change Total sheep Average annual % change Total pigs Average annual % change ,909 : 3,292 : 1,031 : , % 4, % 1, % , % 8, % 1, % , % 8, % 1, % 4.11 EU: Share of total livestock numbers December 2010 % of total Country Cattle Pigs Malta 0.0% 0.0% Cyprus 0.1% 0.3% Luxembourg 0.2% 0.1% Estonia 0.3% 0.2% Latvia 0.4% 0.3% Slovakia 0.5% 0.5% Domain 4 Land Use , % 7, % 1, % Slovenia 0.5% 0.3% , % 7, % 1, % Bulgaria 0.6% 0.4% , % 7, % 1, % Greece 0.8% 0.7% , % 6, % 1, % Hungary 0.8% 2.1% , % 6, % 1, % , % 6, % 1, % , % 5, % 1, % , % 5, % 1, % , % 5, % 1, % , % 4, % 1, % , % 4, % 1, % , % 4, % 1, % Source: CSO Lithuania 0.9% 0.6% Finland 1.0% 0.9% Czech Republic 1.5% 1.2% Portugal 1.6% 1.4% Sweden 1.7% 1.0% Denmark 1.9% 8.1% Romania 2.3% 3.6% Austria 2.3% 2.1% Belgium 2.9% 4.1% Netherlands 4.6% 8.1% Sheep numbers declined from a record of 8.5 million in 1990 to 4.8 million in 2011 a fall of 44%. Cattle numbers increased marginally from 6.9 million in 1980 to 7 million in 1995, before falling to 6.5 million in Poland 6.4% 9.8% Italy 6.7% 6.2% Ireland 6.8% 1.0% Spain 7.0% 17.0% In 2010, Ireland had 6.8% of the total cattle population of the EU and 1% of the total pig population. United Kingdom 11.4% 2.9% Germany 14.7% 17.8% France 21.9% 9.3% Total 100.0% 100.0% Total livestock (000) 86, ,054 Source: Eurostat
41 4.12 Ireland: House completions Year Local Authority % of total completions 000 Voluntary and cooperative Private Total Average annual % change % 0% 73% 13.9 : % 0% 67% % % 0% 78% % % 0% 73% % % 0% 95% % % 3% 87% % % 2% 94% % % 2% 91% % % 2% 90% % % 2% 91% % % 2% 93% % % 2% 93% % % 1% 94% % % 2% 92% % % 4% 87% % % 8% 80% % 2010 : : : % 2011 : : : % Source: Department of the Environment, Community and Local Government Ireland: House completions completions 100,000 90,000 80,000 70,000 60,000 50,000 40,000 30,000 20,000 10,000 Local Authority Voluntary and co-operative Private Total In 2006 the peak year for house completions private houses accounted for 94% of all house completions. This has since declined to 80% in Total house completions rose steadily from 19,500 in 1990 to 93,400 in 2006 before falling sharply to just 10,500 in The percentage of house completions by Local Authorities has risen from 4% in 2006 to 13% in Over the same period the percentage of Voluntary and co-operative house completions has risen from 1% to 8%. Domain 4 Land Use
42 EU: House completions per 1,000 population Country Germany United Kingdom Slovak Republic Hungary Sweden Czech Republic Poland Netherlands Denmark EU: House completions Germany United Kingdom Slovak Republic Hungary Sweden Czech Republic Poland per 1,000 population Domain 4 Land Use Italy Belgium Austria Portugal Netherlands Denmark Italy Finland Belgium France Spain Ireland Source: DKM, Euroconstruct, Eurostat Austria Portugal Finland Ireland and Spain had the highest levels of house completions per 1,000 population over the period 2006 to France Spain In 2010, there were 3.3 house completions per 1,000 population in Ireland. Although this was considerably lower than in the 2006 to 2009 period, it was still the tenth highest of the 17 EU countries that data were available for. Ireland

43 5. Energy 43
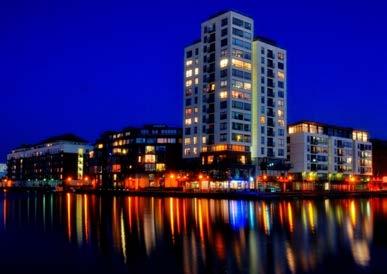
44 Contents 5.1 Ireland: Primary energy requirement and final energy consumption EU: Final energy consumption by economic sector EU: Final energy consumption by fuel type EU: Energy intensity Ireland: Primary energy production Ireland: Renewable energy production Ireland: Electricity consumption from renewable sources EU: Electricity consumption from renewable sources Ireland: Heat consumption from renewable sources Ireland: Transport use from renewable sources Ireland: Imported energy dependency EU: Imported energy dependency Ireland: Fuel imports Photographs: Lough Nahanagan, Wicklow Gap, lower lake of the Turlough Hill hydroelectric power plant, courtesy of Gerry Brady; Grand Canal Basin, Dublin, courtesy of Paul Molony 44
45 5.1 Ireland: Primary energy requirement and final energy consumption tonnes oil eq. Year Primary energy requirement Final energy consumption Final energy consumption as % of Primary energy requirement ,497 7, % 5.2 EU: Final energy consumption by economic sector 2010 % of total final energy consumption Country Transport Industry Residential Agriculture Services Other Finland 19% 44% 22% 3% 7% 5% Romania 22% 31% 36% 2% 8% 1% Slovakia 23% 38% 20% 1% 18% 0% ,568 7, % Czech Republic 25% 34% 26% 2% 12% 1% Sweden 25% 37% 22% 2% 14% 0% ,780 10, % Hungary 26% 17% 34% 3% 19% 0% ,579 11, % Poland 27% 23% 32% 6% 13% 0% ,756 11, % Estonia 27% 20% 35% 3% 14% 0% ,629 11, % Netherlands 28% 27% 21% 6% 18% 0% ,150 12, % Belgium 28% 31% 25% 2% 14% 0% ,794 12, % ,948 13, % ,202 13, % ,454 13, % ,815 12, % ,763 12, % Source: Sustainable Energy Authority of Ireland Latvia 28% 18% 35% 4% 14% 0% Germany 28% 28% 29% 0% 15% 0% Austria 31% 32% 25% 2% 10% 0% EU 32% 25% 27% 2% 13% 1% France 32% 20% 28% 2% 15% 4% Bulgaria 33% 29% 25% 2% 11% 0% Lithuania 33% 19% 33% 2% 13% 0% Ireland s primary energy requirement increased from 9.5 million tonnes of oil equivalent (t.o.e.) in 1990 to 16.5 million t.o.e. in 2008 before falling to 14.8 million t.o.e. in Denmark 33% 16% 32% 6% 14% 0% Italy 34% 25% 25% 3% 14% 0% Slovenia 36% 26% 26% 2% 10% 1% Final energy consumption as a proportion of the primary energy requirement has grown from 76% in 1990 to 82% in United Kingdom 37% 20% 31% 1% 10% 1% Ireland 40% 16% 27% 2% 14% 0% 45 Transport accounted for 40% of Ireland s final energy consumption in Oil accounted for 60% of Ireland s total final energy consumption in 2010 (see Table 5.3). Portugal 41% 30% 16% 3% 11% 0% Spain 41% 26% 18% 3% 11% 1% Greece 43% 18% 24% 4% 10% 0% Cyprus 54% 12% 15% 2% 12% 4% Luxembourg 61% 17% 11% 1% 10% 0% Malta 62% 11% 14% 0% 12% 1% Source: Eurostat Domain 5 - Energy
46 EU: Final energy consumption by fuel type 2010 % of total final energy consumption Country Oil Solid fuel Gas Electricity Renewable energy Derived heat Cyprus 72% 1% 0% 22% 5% 0% Malta 69% 0% 0% 31% 0% 0% Luxembourg 67% 2% 16% 13% 2% 1% Greece 64% 2% 4% 24% 6% 0% Ireland 60% 5% 14% 18% 2% 0% 5.4 EU: Energy intensity 2010 Denmark United Kingdom Ireland Italy Austria Germany kgoe per 1,000 GDP Domain 5 - Energy Spain 52% 1% 16% 25% 6% 0% Sweden Portugal 51% 0% 9% 24% 14% 2% Slovenia 49% 1% 13% 21% 12% 4% Denmark 44% 1% 12% 18% 8% 18% United Kingdom 42% 3% 33% 20% 2% 1% France 42% 3% 20% 24% 8% 2% Belgium 41% 3% 31% 20% 4% 2% EU 40% 4% 23% 21% 7% 5% Luxembourg France Spain Greece Portugal Malta Netherlands Cyprus Belgium Italy 39% 2% 31% 21% 4% 3% Finland Austria 39% 4% 18% 19% 14% 6% Slovenia Germany 38% 4% 25% 21% 6% 5% Bulgaria 36% 5% 11% 26% 11% 11% Latvia 34% 2% 12% 13% 25% 14% Lithuania Poland Latvia Hungary Netherlands 34% 2% 41% 17% 1% 4% Slovakia Lithuania 34% 4% 12% 15% 16% 19% Czech Republic Estonia 33% 3% 7% 20% 19% 18% Poland 31% 20% 14% 15% 8% 11% Finland 30% 3% 4% 27% 18% 18% Romania Estonia Bulgaria Sweden 29% 3% 2% 33% 18% 15% ,000 Hungary 28% 3% 38% 18% 7% 7% Romania 27% 4% 28% 16% 18% 7% Source: Eurostat Czech Republic 26% 12% 26% 19% 7% 9% Slovakia 20% 14% 36% 18% 5% 7% Ireland had the third lowest energy intensity in the EU in 2010, at 113 kgs of oil equivalent (kgoe) per 1,000 of GDP. Source: Eurostat
47 5.5 Ireland: Primary energy production Ireland: Renewable energy production % of total primary energy production Year Peat products Natural gas Renewable energy % 54% 5% % 55% 4% % of total primary energy production 45% 40% 35% % 44% 11% % 37% 13% 30% % 44% 17% 25% % 30% 13% % 37% 15% % 28% 23% 20% 15% % 25% 26% 10% % 25% 32% % 22% 35% % 21% 41% % 17% 31% Source: Sustainable Energy Authority of Ireland The use of renewable energy sources as a proportion of total primary energy production in Ireland increased from 5% in 1990 to 41% in This fell to 31% in Natural gas, as a proportion of total primary energy production has fallen from 54% in 1990 to 17% in Hydro Wind Biomass Landfill gas Biogas Liquid Biofuel Solar Geothermal Source: Sustainable Energy Authority of Ireland Wind has become the main source of renewable energy production in recent years, increasing from less than 1% of total production in 1995 to over 40% in % 0% 47 The production of peat increased from 37% to 51% of total final energy production between 2009 and The use of water and biomass has fallen over the same period and they now account for 9% and 33% respectively of the total renewable energy being produced. This is in contrast to the early 1990s when they comprised virtually all of Ireland s renewable energy production. Domain 5 Energy
48 Ireland: Electricity consumption from renewable sources % of total electricity consumption Year Hydro Wind Biomass Total % 0.0% 0.0% 5.3% % 0.1% 0.0% 4.6% % 1.0% 0.4% 4.8% % 1.3% 0.4% 5.0% % 1.4% 0.3% 5.0% 5.8 EU: Electricity consumption from renewable sources 2009 % of total electricity consumption Austria Sweden Latvia Slovenia Portugal Romania Denmark Finland Domain 5 Energy % 1.8% 0.3% 5.2% Spain % 2.7% 0.4% 6.0% % 4.0% 0.5% 7.2% % 5.6% 0.4% 8.7% % 6.8% 0.6% 9.9% % 7.9% 0.7% 11.1% % 10.2% 0.9% 13.7% % 11.1% 1.1% 14.8% Source: Sustainable Energy Authority of Ireland Italy EU Slovakia Germany Ireland France Greece Bulgaria Netherlands The use of renewable energy sources in the consumption of electricity increased from 5.3% in 1990 to 14.8% in The EU Renewable Energy Directive 2010 target for electricity for Ireland was 13.2%. Wind is the main source of renewable energy used in the consumption of electricity, with its share growing to 11.1% of electricity consumption in Hungary Czech Republic United Kingdom Estonia Belgium Poland Lithuania Luxembourg Ireland s use of renewable energy in total electricity consumption in 2009 at 13.7% was 13th highest among EU countries. Cyprus Malta 0% 10% 20% 30% 40% 50% 60% 70% Austria had the highest proportion of renewable energy in total electricity consumption; 67% of its electricity consumption was from renewable energy sources in Source: Eurostat
49 5.9 Ireland: Heat consumption from renewable sources % of total heat consumption Year Biomass Biogas Solar Geothermal Total % 0.1% 0.0% 0.0% 2.6% % 0.1% 0.0% 0.0% 2.1% % 0.1% 0.0% 0.0% 2.4% % 0.1% 0.0% 0.0% 2.6% % 0.1% 0.0% 0.0% 2.6% % 0.1% 0.0% 0.0% 2.5% % 0.1% 0.0% 0.1% 2.8% % 0.1% 0.0% 0.2% 3.5% % 0.1% 0.0% 0.2% 3.6% % 0.1% 0.0% 0.3% 3.7% % 0.1% 0.1% 0.4% 3.6% % 0.1% 0.1% 0.4% 4.3% % 0.1% 0.1% 0.4% 4.4% Source: Sustainable Energy Authority of Ireland 5.10 Ireland: Transport use from renewable sources % of total transport energy consumption Year Biodiesel Biogasoline Pure plant oil Total % 0.0% 0.0% 0.1% % 0.1% 0.0% 0.5% % 0.4% 0.1% 1.2% % 0.5% 0.0% 1.8% % 0.8% 0.1% 2.4% Source: Sustainable Energy Authority of Ireland Renewable energy sources for transport have only been used since 2006 and have grown to 2.4% of total transport energy consumption in Biodiesel and biogasoline accounted for almost all of the renewable energy sources. The national and EU targets for transport use from renewable energy sources is 10% by This target was announced in the 2007 Energy White Paper. Consumption of heat from renewable energy sources has grown from 2.6% in 1990 to 4.4% in Biomass accounted for 3.7% of the total heat consumption in There is a national target of 12% of heat from renewable energy sources by Domain 5 Energy 49
50 Ireland: Imported energy dependency % of total energy requirement Year Oil Gas Coal Peat, electricity and other fuels Total import dependency % 0% 20% 0% 69% % 1% 17% 0% 69% % 15% 12% 0% 84% 5.12 EU: Imported energy dependency 2009 % of total energy requirement Denmark Romania Estonia United Kingdom Czech Republic Poland Domain 5 Energy % 17% 13% 0% 89% Netherlands % 18% 12% 0% 89% Sweden % 21% 11% 1% 90% Bulgaria % 19% 12% 1% 89% Slovenia % 19% 12% 1% 90% % 22% 10% 1% 90% % 24% 9% 1% 89% % 25% 10% 0% 89% % 27% 9% 1% 89% Lithuania France EU Finland Hungary Latvia % 29% 6% 1% 86% Germany Source: Sustainable Energy Authority of Ireland Austria Slovakia Ireland s imported energy dependency increased from 69% in 1990 to 90% in 2005 then fell to 86% in Greece Belgium Gas accounted for 29% of Ireland s imported energy dependency in The import dependency on oil has fallen from 60% in 2001 to 50% in In 2009, Ireland had the fourth highest level of imported energy dependency in the EU, at 89%. Spain Portugal Italy Ireland Cyprus Luxembourg Malta -20% 0% 20% 40% 60% 80% 100% Source: Eurostat
51 5.13 Ireland: Fuel imports % of total 000 tonnes oil eq. Year Coal Crude oil Other oil products Natural gas Total % 29% 42% 0% 10, % 30% 45% 1% 11, % 25% 41% 20% 12, % 25% 40% 21% 13, % 25% 40% 22% 13, % 25% 39% 24% 13, % 22% 43% 22% 13, % 24% 41% 21% 14, % 23% 41% 25% 14, % 24% 38% 27% 14, % 22% 38% 28% 14, % 22% 38% 30% 13, % 24% 34% 34% 12,805 Source: Sustainable Energy Authority of Ireland Ireland s imports of fuel have been falling since The proportion accounted for by imports of natural gas has grown from 20% in 2000 to 34% in Other oil products, (such as diesel, gasoline, LPG, kerosene and jet kerosene) accounted for 34% of Ireland s fuel imports in Domain 5 Energy 51
52

53 6. Transport 53
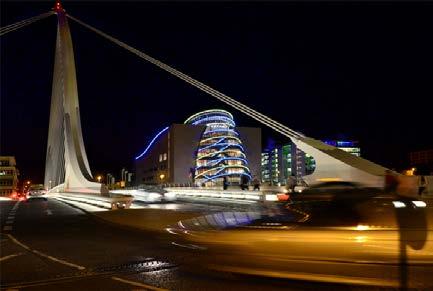
54 Contents 6.1 Ireland: Vehicles under current licence EU: Passenger cars Ireland: New private vehicles licensed by emission class Ireland: Road freight transport EU: Road freight transport Ireland: Rail and bus passenger and vehicle traffic EU: Rail passenger traffic Ireland: International passengers through Irish ports EU: International air passengers Ireland: Means of travel to work Photographs: Aircraft, courtesy of Gerry Walker; Samuel Beckett Bridge, Dublin, courtesy of David Lester 53 54
55 6.1 Ireland: Vehicles under current licence EU: Passenger cars Average Average Average Year Private annual Goods annual Other annual cars % vehicles % vehicles % Total change change change : 93 : 112 : % % % 1, % % % 1,263 Romania Slovakia Hungary Bulgaria Latvia Denmark per 1,000 population aged 15 and over , % % % 1,682 Estonia , % % % 1,770 Czech Republic , % % % 1, , % % % 1, , % % % 2, , % % % 2, , % % % 2, , % % % 2, , % % % 2, , % % % 2, , % % % 2,416 Source: Department of Transport, Tourism and Sport The number of licensed vehicles increased by 164%, from 915,000 to 2.4 million, between 1985 and Private cars accounted for the majority of this growth with an increase of almost 1.2 million between 1985 and The number of goods vehicles licensed has grown by 130% in the same period from 93,000 to 327,000. As with private cars, the numbers peaked in 2008 and there were subsequently decreases in 2009 and Ireland had 540 passenger cars per 1,000 of the population aged 15 or over in This was the 11th lowest in the EU. Luxembourg had the highest ratio, at 817 and Romania the lowest at 233. Poland Greece Ireland United Kingdom Sweden Netherlands Spain Belgium Germany Lithuania France Slovenia Austria Finland Malta Cyprus Italy Luxembourg ,000 Note: Data for Denmark and United Kingdom refer to 2008 Data not available for Portugal Source: Eurostat Domain 6 - Transport 55
56 Ireland: New private vehicles licensed by emission class Year Bands A and B Bands C and D Bands E, F and G % of total 000 Unclassified % 8% 2% 0% 86.9 Source: CSO On July 1 st 2008, the basis for motor taxation charges changed from engine size to the emission rating of the vehicle. Total % 49% 37% 2% % 48% 37% 1% % 48% 34% 1% % 44% 25% 1% % 33% 9% 2% % 16% 3% 0% 84.9 Ireland: New private vehicles licensed by emission class new private vehicles 90,000 80,000 70,000 60,000 50,000 40,000 30,000 20,000 Domain 6 - Transport The proportion of new vehicles registered in emission bands A and B increased from 12% in 2005 to 90% in ,000 0 Bands A and B Bands C and D Bands E, F and G
57 Ireland: Road freight transport Year million million million Average Average Tonnekilometres annual Tonnes annual Vehiclechange % carried % kilometres change Average annual % change ,130 : 81,440 : 783 : , % 85, % % , % 191, % 1, % , % 199, % 1, % , % 224, % 1, % , % 251, % 1, % , % 273, % 2, % , % 291, % 2, % , % 299, % 2, % , % 299, % 2, % , % 245, % 2, % , % 148, % 1, % , % 125, % 1, % Source: CSO Road freight transport in Ireland peaked in 2007, when there were just under 300 billion tonnes carried and over 18.7 billion tonne-kilometres travelled. This fell significantly in the next three years, with only 126 billion tonnes carried and just under 11 billion tonne-kilometres travelled in Relative to 2005, Ireland had the lowest tonne-kilometres and vehicle-kilometres travelled of EU Member States for which data were available in Tonne-kilometres were at 61% of the level in EU: Road freight transport =100 Country Tonne-kilometres Vehicle-kilometres Ireland Denmark Austria Cyprus Belgium Italy Portugal France Spain Netherlands United Kingdom Finland Sweden Estonia Luxembourg Germany Czech Republic Greece Lithuania Slovakia Latvia Hungary Slovenia Poland Note: Data not available for Bulgaria, Romania or Malta Greece data refers to 2009 Source: Eurostat Domain 6 - Transport
58 Ireland: Rail and bus passenger and vehicle traffic EU: Rail passenger traffic 2009 Year Rail passengerkilometres million million % change Bus and coach vehicle-kilometres ,295 : % change , % : : , % : : , % : : , % 255 : France Sweden Austria Denmark Germany Netherlands Belgium United Kingdom kms per capita Domain 6 - Transport , % % Italy , % % , % % , % % , % % , % % , % % , % % Hungary EU Finland Luxembourg Czech Republic Spain Poland Slovakia , % % Portugal , % % Source: CSO Rail usage increased in Ireland between 1996 and 2007, growing from almost 1.3 billion passenger-kilometres to just over 2 billion passenger-kilometres. However, it decreased to just under 1.7 billion passenger-kilometres in Bus and coach travel in Ireland increased by 22% in the period 2000 to 2008, from 255 million vehicle-kilometres in 2000 to 310 million vehicle-kilometres in Slovenia Ireland Latvia Romania Bulgaria Estonia Greece Lithuania ,000 1,200 1,400 The average kilometres per capita travelled by rail passengers in Ireland in 2009 was 378, compared with an EU average of 791. France, at 1,378 had the highest kilometres per capita travelled in Note: Data for Greece, Italy and Luxembourg refers to 2008 Data for Netherlands and EU refers to 2007 No data available for Cyprus or Malta Source: Eurostat
59 6.8 Ireland: International passengers through Irish ports EU: International air passengers 2010 Year Average Air Sea annual % passengers passengers change Average annual % change ,560 : 4,244 : Slovakia Romania Poland Slovenia passengers per capita , % 4, % , % 4, % , % 4, % , % 4, % , % 3, % Lithuania Bulgaria Hungary Estonia Czech Republic EU , % 3, % Italy , % 3, % , % 3, % , % 2, % , % 2, % , % 2, % Source: CSO France Germany Latvia Belgium Portugal Finland Austria Air passengers travelling to and from Ireland increased by over 19.5 million, or 206% between 1995 and 2008 when there were over 29 million passengers. Passenger numbers have since fallen by 26% between 2008 and Greece Sweden Netherlands United Kingdom Passenger numbers travelling to and from Ireland by sea fell by 41% between 2000 and 2010, from 4.5 million to 2.6 million passengers. In 2010, Ireland had 5.2 air passengers per capita which was over three times the EU average of 1.6 passengers per capita. The highest were Cyprus and Malta (two other small islands) with 8.7 and 7.9 respectively air passengers per capita. Luxembourg Spain Denmark Ireland Malta Cyprus Source: Eurostat Domain 6 - Transport 59
60 Ireland: Means of travel to work % of total female population aged over 15 at work Females Year On foot 19% 17% 16% 15% 14% Bicycle 6% 4% 3% 1% 1% Bus, minibus or coach 15% 13% 12% 9% 8% Train, DART or LUAS 2% 2% 2% 2% 3% Motor cycle or scooter 1% 1% 0% 0% 0% Motor car: Driver 27% 35% 44% 58% 62% Motor car: Passenger 16% 14% 13% 8% 6% Other means (incl. Lorry or van) 1% 1% 1% 0% 0% Work mainly at or from home 8% 9% 6% 4% 5% Not stated 6% 4% 3% 1% 1% Between 1986 and 2006, the proportion of females driving to work has increased from 27% to 62%. The proportion of females travelling to work as car passengers fell from 16% to 6% in the same period. The proportion of males driving to work rose from 42% to 54% between 1986 and The proportion of males working mainly at or from home has fallen from 22% in 1986 to 6% in The proportion of females working mainly at or from home fell from 8% to 5%. There were 14% of working women aged 15 or over who walked to work in 2006 compared with 9% of working men aged 15 or over. This data takes account only of people working, and does not include students, unemployed or retired people. Domain 6 - Transport % of total male population aged over 15 at work Males Year On foot 9% 8% 9% 9% 9% Bicycle 5% 5% 4% 3% 3% Bus, minibus or coach 6% 5% 5% 5% 5% Train, DART or LUAS 1% 1% 1% 2% 3% Motor cycle or scooter 2% 1% 1% 2% 1% Motor car: Driver 42% 41% 48% 53% 54% Motor car: Passenger 5% 4% 6% 6% 5% Other means (incl. Lorry or van) 4% 6% 7% 12% 13% Work mainly at or from home 22% 26% 16% 8% 6% Not stated 4% 3% 3% 2% 2% Source: CSO Census of Population

61 7. Waste 61
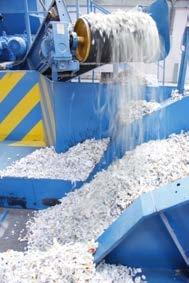
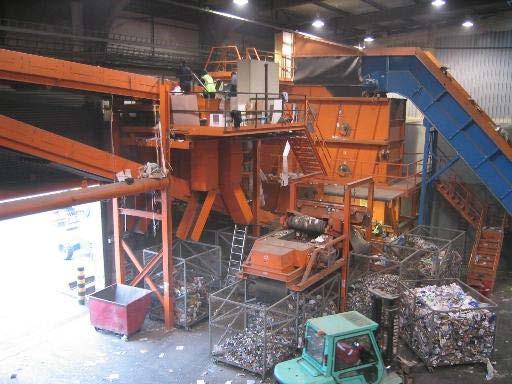
62 Contents 7.1 Ireland: Municipal waste generated EU: Municipal waste generated Ireland: Municipal waste sent to landfill EU: Municipal waste sent to landfill Ireland: Recovery of packaging waste EU: Recovery of packaging waste Ireland: Electrical waste collected EU: Electrical waste collected from private households Ireland: Collection of construction and demolition waste Photographs: Baled steel and aluminium cans, paper recycling and mixed dry recycling process, courtesy of Thornton s recycling 62
63 7.1 Ireland: Municipal waste generated EU: Municipal waste generated 2010 Year 000 tonnes Municipal waste % change kgs per capita % change ,704 : 690 : , % % , % % , % % , % % , % % , % % , % % Latvia Estonia Poland Czech Republic Slovakia Romania Lithuania Bulgaria Hungary Slovenia kgs per capita , % % Greece , % % Source: Environmental Protection Agency Sweden Belgium Finland Municipal waste generated in Ireland was at its highest in 2007, when there were 3.4 million tonnes, compared with 2.7 million tonnes in It has fallen each year since 2007 and there were just over 2.8 million tonnes generated in Waste generated per capita declined by 180 kgs in the period. EU Portugal United Kingdom Italy France Spain Ireland had the fourth highest level of municipal waste per capita in The lowest level of waste generation per capita was in Latvia with 302 kgs, while Cyprus had the highest level at 778 kgs per capita. The EU average for municipal waste generated in 2010 was 503 kgs per capita. Germany Austria Malta Netherlands Ireland 63 Denmark Luxembourg Cyprus Source: Eurostat Domain 7 - Waste
64 Ireland: Municipal waste sent to landfill EU: Municipal waste sent to landfill 2010 Year Waste managed 000 tonnes Waste sent to landfill % change Municipal waste disposal rate ,390 1,992 : 87% ,559 1, % 80% ,559 1, % 72% ,704 1, % 67% Germany Netherlands Austria Sweden Belgium Denmark % of municipal waste sent to landfill Domain 7 - Waste ,779 1, % 66% Luxembourg ,100 1, % 64% France ,175 2, % 64% EU ,104 1, % 63% Finland ,825 1, % 61% United Kingdom ,580 1, % 58% Italy Source: Environmental Protection Agency Spain The amount of municipal waste sent to landfill was between 1.8 and 2 million tonnes between 2001 and 2008, but it fell sharply in both 2009 and 2010 to 1.5 million tonnes. The main reason for the fall is the overall reduction in waste generated due to the economic downturn. Slovenia Ireland Portugal Czech Republic Hungary The disposal rate of municipal waste, which is the amount sent to landfill as a proportion of the amount of waste managed, has fallen every year since However, at 58%, Ireland was above the EU average of 38% for the municipal waste disposal rate in EU Member States such as Germany, Netherlands, Austria, and Sweden send little or no waste to landfill, as waste disposal in these countries is based almost entirely upon incineration. Poland Estonia Slovakia Greece Malta Cyprus Latvia Lithuania Romania Bulgaria 0% 20% 40% 60% 80% 100% Source: Eurostat
65 7.5 Ireland: Recovery of packaging waste EU: Recovery of packaging waste tonnes Year Managed Recovered Recovery rate % % , % % % , % , % , % % % Source: Environmental Protection Agency Over the past decade, Ireland has substantially increased its rate of recovery of packaging waste such as cardboard, paper, glass, plastic, steel, aluminium and wood. The Packaging Directive (94/62/EC) target of 50% set for 2005 was reached in 2004 and the 2011 target of 60% has been exceeded since By 2010, the recovery rate for packaging waste had reached 74%. In 2009, Ireland recovered 152 kgs of packaging waste per capita, which was the third highest level in the EU. Germany Luxembourg Ireland Netherlands Belgium Denmark Italy Austria France Sweden United Kingdom EU Spain Finland Portugal Estonia Czech Republic Slovenia Hungary Poland Greece Slovakia Lithuania Cyprus Latvia Romania Bulgaria Malta kgs per capita Note: Malta data refers to 2007 Source: Eurostat Domain 7 - Waste
66 Ireland: Electrical waste collected EU: Electrical waste collected from private households 2008 Year Large household appliances Fridges and freezers TVs and monitors Lighting equipment % of total tonnes Other WEEE Total % 13% 13% 1% 23% 51, % 13% 14% 1% 28% 51, % 14% 15% 1% 33% 45, % 14% 14% 2% 34% 45,012 Source: Environmental Protection Agency The proportion of fridges and freezers in the total Waste Electrical and Electronic Equipment (WEEE) has been steady at around 14% between 2007 and 2010, while large household appliances, such as washing machines and cookers have fallen from 50% of the total to 36% in the same period. There has been an increase in the proportion of other WEEE between 2007 and 2010 from 23% to 34%. Expressed in kgs per capita, Ireland had the fourth highest level of WEEE collected from private households in 2008, behind only the three Scandinavian Member States. At 9 kgs per capita, this is more than twice the 4 kgs per capita specified by the WEEE Directive. Sweden Denmark Finland Ireland Austria Luxembourg Belgium Germany United Kingdom Spain Netherlands Bulgaria Hungary France Estonia Czech Republic Greece Portugal kgs per capita Domain 7 - Waste Slovakia Lithuania Cyprus Latvia Italy Poland Romania Note: Data not available for Malta and Slovenia Source: Eurostat
67 7.9 Ireland: Collection of construction and demolition waste Year Soil and stones Other construction and demolition waste 000 tonnes Total % change ,492 2,676 11,168 : ,646 2,286 14,931 34% ,883 2,937 16,820 13% ,560 4,232 17,792 6% ,537 2,986 13,523-24% ,771 1,323 5,094-62% , ,465-32% Source: Environmental Protection Agency The collection of construction and demolition waste increased from 11.2 million tonnes in 2004 to almost 17.8 million tonnes in The amount collected fell substantially between 2007 and 2010, when only 3.5 million tonnes were collected, reflecting the decline in the building industry over that period. Domain 7 - Waste 67
68
69 8. Biodiversity and Heritage 69
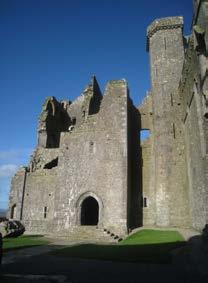
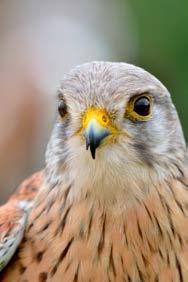
70 Contents 8.1 Ireland: Countryside birds EU: Common farmland birds EU: Protected areas under EU Birds Directive EU: Protected areas under EU Habitats Directive Ireland: National monuments Ireland: Record of protected structures 2011 Photographs: Cahir Abbey, courtesy of Gerry Brady; Sparrow hawk, courtesy of Paul Molony: Grey partridges at Lough Boora parklands complex, Co. Offaly, courtesy of Thomas Egan, Bord na Mona 69 70
71 8.1 Ireland: Countryside birds EU: Common farmland birds Swift Kestrel Skylark Mistle Thrush Northern Wheatear Stock Pigeon Magpie Rook Mallard Meadow Pipit Cuckoo Grey Wagtail Starling Various species (10) Chaffinch Blackbird Hooded Crow Linnet Song Thrush Sparrowhawk Sedge Warbler Reed Bunting White Wagtail Wren Blue Tit Grasshopper Warbler Jackdaw Feral Pigeon Woodpigeon Coal Tit House Sparrow Whitethroat Pheasant Willow Warbler Great Tit Goldcrest Collared Dove Long-tailed tit Bullfinch Stonechat Goldfinch Redpoll Blackcap % change 2008/ Source: Birdwatch Ireland Latvia Finland Hungary Poland Czech Republic France EU Ireland Netherlands Belgium Sweden Spain United Kingdom Denmark Austria Germany 2000= Note: Data available for 15 EU Member States Source: Eurostat Of a total of 52 bird species surveyed over the period, of which 42 are shown in graph 8.1, eight were found to be in decline, 22 were increasing, and 22 were stable. The biggest increases were in blackcaps and redpolls, while swifts and kestrels showed the biggest declines. Of the 15 countries for which there were data available in 2008 on 36 species of common farmland birds, Ireland s index relative to 2000, at 92.4, was slightly lower than the average index for the EU of 94. Domain 8 Biodiversity and Heritage
72 EU: Protected areas under EU Birds Directive 2010 Slovakia Slovenia Greece Spain Bulgaria Poland Hungary Italy Estonia Netherlands Czech Republic Germany Austria EU Portugal Latvia Belgium Lithuania France Finland United Kingdom Sweden Denmark Luxembourg Malta Ireland % of total land area 0% 5% 10% 15% 20% 25% 30% 8.4 EU: Protected areas under EU Habitats Directive 2010 Slovenia Bulgaria Spain Portugal Estonia Greece Luxembourg Hungary Italy Lithuania Sweden EU Malta Romania Cyprus Finland Slovakia Latvia Poland Ireland Austria Belgium Czech Republic Germany France Netherlands Denmark United Kingdom % of total land area 0% 5% 10% 15% 20% 25% 30% 35% Domain 8 Biodiversity and Heritage Note: Data not available for Romania Source: European Commission Source: European Commission Ireland, at 3%, had the smallest area designated as a Special Protected Area under the EU Birds Directive in The EU average was 11.4%. In 2010, Ireland had 10.7% of its land area designated as a Special Protected Area under the EU Habitats Directive. This was the ninth smallest proportion of land area in the EU. The EU average was 13.7%.
73 8.5 Ireland: National monuments Ireland: Record of protected structures Meath Galway Kerry Mayo Limerick Cork Tipperary Clare Kilkenny Dublin Sligo Wicklow Louth Roscommon Wexford Donegal Kildare Westmeath Carlow Offaly Waterford Laois Monaghan Leitrim Cavan Longford Source: Office of Public Works Ireland had 749 national monuments in County Meath had the highest number with Dublin Cork Tipperary Limerick Galway Louth Meath Wexford Kildare Kerry Offaly Kilkenny Laois Clare Carlow Monaghan Waterford Wicklow Roscommon Sligo Mayo Longford Cavan Westmeath Leitrim Donegal ,492 1,437 1,414 1,323 1,294 1,124 1,103 1,079 1,057 2,611 2,375 3, ,500 5,000 7,500 10,000 12,500 11,966 Source: Department of Arts, Heritage and the Gaeltacht (Heritage Ireland) There were 39,380 protected structures recorded in Ireland in May Of these 11,966 or 30% were in Dublin. Domain 8 Biodiversity and Heritage
74
75 9. Environmental Economy 75
Published by the Stationery Office, Dublin, Ireland.
 An Phríomh-Oifig Staidrimh Central Statistics Office Published by the Stationery Office, Dublin, Ireland. To be purchased from the: Central Statistics Office, Information Section, Skehard Road, Cork. Price
Global Warming Potential increased 6.8% in 2015, above the growth of economic activity
 Economic-environmental Indicators Air emissions accounts 1995-18 October 2017 Global Warming Potential increased 6.8% in, above the growth of economic activity In, the Global Warming Potential increased
Background and objectives
 Workshop on greenhouse gas emission projections 12-13 December 2006, European Environment Agency, Copenhagen Background and objectives André Jol Head of Group climate change and energy European Environment
CAP CONTEXT INDICATORS
 CAP CONTEXT INDICATORS 2014-2020 24. AGRICULTURAL TRAINING OF FARM MANAGERS 2017 update CONTEXT INDICATOR 24: AGRICULTURAL TRAINING OF FARM MANAGERS Learning by doing is still the main form of for the
Environmental statistics in Europe Facts and figures on the environment: from environmental taxes to water resources
 STAT/10/189 10 December 2010 Environmental statistics in Europe Facts and figures on the environment: from environmental taxes to water resources What share of fresh water resources is being abstracted
Joint owner of the research company Profu Research leader of the waste management group at Chalmers University of Technology , Ph.D
 Joint owner of the research company Profu Research leader of the waste management group at Chalmers University of Technology 1993-2005, Ph.D. 1993. Profu Profu was established 1987 and has since then been
COMMISSION OF THE EUROPEAN COMMUNITIES REPORT FROM THE COMMISSION TO THE EUROPEAN PARLIAMENT AND THE COUNCIL
 EN EN EN COMMISSION OF THE EUROPEAN COMMUNITIES Brussels, 12.11.2009 COM(2009)630 final REPORT FROM THE COMMISSION TO THE EUROPEAN PARLIAMENT AND THE COUNCIL PROGRESS TOWARDS ACHIEVING THE KYOTO OBJECTIVES
138 ENVIRONMENTAL PROFILE OF SPAIN 2011
 2.9 ENERGY At the end of 2011, the EU Commission launched the Energy Road Map 2050, a communication analysing the challenges of decarbonising the EU, while at the same time ensuring security of energy
AP3a EEA31 NH 3 emissions
 AP3a EEA31 NH 3 emissions Key messages is responsible for the vast majority of EU15 NH 3 emissions, 93% in 21. Ammonia emissions in the EU15 have been reduced by 7.6% since 199 largely due to decreases
CAP CONTEXT INDICATORS
 CAP CONTEXT INDICATORS 2014-2020 45. EMISSIONS FROM AGRICULTURE 2017 update CONTEXT INDICATOR 45: EMISSIONS FROM AGRICULTURE 1. GHG emissions from agriculture GHG emissions from agriculture represent 9.8%
Trends and drivers in greenhouse gas emissions in the EU in 2016
 EU greenhouse gas inventory Trends and drivers in greenhouse gas emissions in the EU in 2016 Official data for 2016 confirm the longterm reduction in greenhouse gas emissions across Europe. This briefing
CAP CONTEXT INDICATORS
 CAP CONTEXT INDICATORS 2014-2020 44. ENERGY USE IN AGRICULTURE, FORESTRY AND THE FOOD INDUSTRY 2017 update BE BG CZ DK DE EE IE EL ES FR HR IT CY LV LT LU HU MT NL AT PL PT RO SI SK FI SE UK CONTEXT INDICATOR
COMMISSION OF THE EUROPEAN COMMUNITIES REPORT FROM THE COMMISSION
 COMMISSION OF THE EUROPEAN COMMUNITIES Brussels, 28.11.2003 COM(2003) 735 final REPORT FROM THE COMMISSION under Council Decision 93/389/EEC as amended by Decision 99/296/EC for a monitoring mechanism
REPORT FROM THE COMMISSION TO THE COUNCIL AND THE EUROPEAN PARLIAMENT
 EUROPEAN COMMISSION Brussels, 4.10.2013 COM(2013) 683 final REPORT FROM THE COMMISSION TO THE COUNCIL AND THE EUROPEAN PARLIAMENT on the implementation of Council Directive 91/676/EEC concerning the protection
ANNEXES. to the. Proposal for a REGULATION OF THE EUROPEAN PARLIAMENT AND OF THE COUNCIL
 EUROPEAN COMMISSION Brussels, 20.7.2016 COM(2016) 479 final ANNEXES 1 to 6 ANNEXES to the Proposal for a REGULATION OF THE EUROPEAN PARLIAMENT AND OF THE COUNCIL on the inclusion of greenhouse gas emissions
Integrated assessment of air pollution and greenhouse gases mitigation in Europe
 See discussions, stats, and author profiles for this publication at: https://www.researchgate.net/publication/230709458 Integrated assessment of air pollution and greenhouse gases mitigation in Europe
EN01 Energy and non energy-related greenhouse gas emissions
 EN01 Energy and non energy-related greenhouse gas emissions Key message Total EU-25 greenhouse gas emissions fell by 4.8 % between 1990 and 2004. During the same period, energy-related emissions fell considerably
Emissions Trading System (ETS): The UK needs to deliver its share of the total EU ETS emissions reduction of 21% by 2020, compared to 2005;
: The UK needs to deliver its share of the total EU ETS emissions reduction of 21% by 2020, compared to 2005;") Emissions Trading System (ETS): The UK needs to deliver its share of the total EU ETS emissions reduction of 21% by 2020, compared to 2005; Non-ETS emissions: The Effort Sharing Decision sets a target
Emissions Trading System (ETS): The UK needs to deliver its share of the total EU ETS emissions reduction of 21% by 2020, compared to 2005; Non-ETS emissions: The Effort Sharing Decision sets a target
Recent trends and projections in EU greenhouse gas emissions
 Approximated greenhouse gas emissions Recent trends and projections in EU greenhouse gas emissions Greenhouse gas (GHG) emissions in the European Union (EU) increased by 0.6 % in 2017, according to preliminary
Assessing the 02 external impacts of freight transport
 1 Assessing the 02 external impacts of freight transport Chapter summary This chapter examines various externalities associated with logistics, and discusses how their impact can be assessed. It starts
Environmental impact assessment of CAP greening measures using CAPRI model
 Environmental impact assessment of CAP greening measures using CAPRI model JM Terres, C. Bulgheroni, A. Leip, ML Paracchini 19 th MARS conference Vilnius Plenary session: Environmental aspects of the CAP
Over the whole year 2011, GDP increased by 1.4% in the euro area and by 1.5% in the EU27, compared with +1.9% and +2.0% respectively in 2010.
 35/2012-6 March 2012 Second estimates for the fourth quarter of Euro area and EU27 down by 0.3% +0.7% and +0.9% respectively compared with the fourth quarter of 2010 decreased by 0.3% in both the euro
Slovenia. Highlights in Climate change and energy
 216 2008 ENVIRONMENT POLICY REVIEW ANNEX Ljubljana Highlights in 2008 With the Climate and Energy Package negotiations and preparations for the Biodiversity and Biosafety COPs in June 2008 as major environmental
Photo: Karpov. Wind in power 2009 European statistics. February 2010 THE EUROPEAN WIND ENERGY ASSOCIATION
 Photo: Karpov Wind in power 29 European statistics February 21 1 WIND IN POWER: 29 EUROPEAN STATISTICS Contents Executive summary 29 annual installations Wind map 29 Wind installations 29 Power capacity
Data, tables, statistics and maps ENERGY IN DENMARK
 Data, tables, statistics and maps ENERGY IN DENMARK 215 1 1 GENERAL INFORMATION ON DENMARK Energy in Denmark, 215 Contents General information on Denmark 3 Energy production 4 Imports and exports of energy
Data, tables, statistics and maps ENERGY IN DENMARK
 Data, tables, statistics and maps ENERGY IN DENMARK 216 Energy in Denmark, 216 Contents General information on Denmark 3 Energy production 4 Imports and exports of energy 8 Electricity and heat 9 Danish
Greenhouse Gas Emissions Per Capita of Annex B Parties to the Kyoto Protocol
 THE AUSTRALIA INSTITUTE Background Paper No. 19 Greenhouse Gas Emissions Per Capita of Annex B Parties to the Kyoto Protocol Hal Turton and Clive Hamilton Submission to Senate Environment References Committee
Background paper. Electricity production from wind and solar photovoltaic power in the EU
 Background paper Electricity production from wind and solar photovoltaic power in the EU February 2018 1 The 2009 Lisbon Treaty gave the European Union (EU) the authority to develop an energy policy containing
Resource efficiency and waste
 Municipal Municipal management across European See also: Country profiles on municipal management 1. Introduction Over the last two decades, European have increasingly shifted their focus with regard to
Ireland s Provisional Greenhouse Gas Emissions
 Ireland s Provisional Greenhouse Gas Emissions 1990-2017 December 2018 CONTENTS KEY HIGHLIGHTS... 3 Introduction... 4 Ireland s Greenhouse Gas Emissions in 2017... 4 Changes in Emissions from Sectors between
Technical Paper Kyoto Ambition Mechanism Report
 Technical Paper Kyoto Ambition Mechanism Report 30 April 2014 EN EN Table of Contents 1. Summary... 2 2. Progress towards meeting the Kyoto targets in the first commitment period (2008-2012)... 4 2.1.
CAP CONTEXT INDICATORS
 CAP CONTEXT INDICATORS 2014-2020 40. WATER QUALITY 2017 update CONTEXT INDICATOR 40: WATER QUALITY Water quality is assessed through the Gross Nutrient Balance and nitrates in freshwater The nitrogen surplus
Energy demand dynamics and infrastructure development plans in the EU. October 10 th, 2012 Jonas Akelis, Managing Partner - Baltics
 Energy demand dynamics and infrastructure development plans in the EU October 10 th, 2012 Jonas Akelis, Managing Partner - Baltics Forecasted energy demand dynamics of EU-11 will be significantly higher
NATIONAL RENEWABLE ENERGY ACTION PLAN FOR LITHUANIA
 NATIONAL RENEWABLE ENERGY ACTION PLAN FOR Tomas Garasimavičius Kaunas, 2010 50 45 40 35 30 25 20 15 10 5 0 ENERGY AGENCY EU and national RES targets 49 39,8 32,6 40 38 28,5 34 23,3 31 20,5 25 24 30 25
Analysis of greenhouse gas emission trends and projections in Europe 2004
 EEA Technical report No 7/2004 Analysis of greenhouse gas emission trends and projections in Europe 2004 Final draft version, 30 November FINAL DRA RA AF FT Cover design: EEA Layout: EEA Legal notice The
EU Climate and Energy Policy Framework: EU Renewable Energy Policies
 EU Climate and Energy Policy Framework: EU Renewable Energy Policies Buenos Aires 26-27 May 2015 Dr Stefan Agne European Commission DG Climate Action Energy 1 EU Climate and Energy Policy Framework 2 Agreed
Figures of Catalonia Generalitat de Catalunya Government of Catalonia
 www.idescat.cat Figures of Generalitat de Catalunya Government of POPULATION POPULATION STRUCTURE 5-9 % 0-4 % 5 4 3 2 1 0 0 1 2 3 4 5 Population (1 000) (1) 7 434 46 508 507 417 men 49.1 49.3 48.8 women
Photo: Thinkstock. Wind in power 2010 European statistics. February The European Wind energy association
 Photo: Thinkstock Wind in power 21 European statistics February 211 1 WIND IN POWER: 21 EUROPEAN STATISTICS Contents Executive summary 21 annual installations Wind map 21 Wind power capacity installations
12. Waste and material flows
 1 Environmental signals 22 12. Waste and material flows policy issue indicator assessment decoupling resource use from economic activity decoupling waste generation from economic activity reducing generation
(c) The terms of the agreement are set out in the Annex to this Note Verbale.
 The terms of the agreement are set out in the Annex to this Note Verbale.") Note Verbale No EDD/2018/001 Her Britannic Majesty's Foreign and Commonwealth Office presents its compliments to the Secretariat of the United Nations Framework Convention on Climate Change and has the
Note Verbale No EDD/2018/001 Her Britannic Majesty's Foreign and Commonwealth Office presents its compliments to the Secretariat of the United Nations Framework Convention on Climate Change and has the
Decision 16/CMP.1 Land use, land-use change and forestry
 Page 3 Decision 16/CMP.1 Land use, land-use change and forestry The Conference of the Parties serving as the meeting of the Parties to the Kyoto Protocol, Affirming that the implementation of land use,
Approximated greenhouse gas emissions in 2016
 Approximated greenhouse gas emissions Approximated greenhouse gas emissions in 2016 This briefing presents early approximated (proxy) estimates of greenhouse gas (GHG) emissions for 2016 in the European
ENERGY PRIORITIES FOR EUROPE
 ENERGY PRIORITIES FOR EUROPE Presentation of J.M. Barroso, President of the European Commission, to the European Council of 4 February 2011 Contents 1 I. Why energy policy matters II. Why we need to act
EUROPEAN POLICIES TO PROMOTE ENERGY CROPS
 EUROPEAN POLICIES TO PROMOTE ENERGY CROPS Hilkka Summa European Commission DG Agriculture and Rural Development Outline 1) EU policy for renewable energy 2) Energy crops production and land use 3) The
IRELAND S GREENHOUSE GAS EMISSIONS IN 2012 KEY HIGHLIGHTS
 EPA Headquarters PO Box 3000 Johnstown Castle Estate County Wexford, Ireland T +353 53 9160600 LoCall 1890 33 55 99 www.epa.ie 15 th April 2014 IRELAND S GREENHOUSE GAS EMISSIONS IN 2012 KEY HIGHLIGHTS
Latvia. Highlights in Climate change and energy
 2008 ENVIRONMENT POLICY REVIEW ANNEX 159 Rïga Highlights in 2008 In 2008, the n government launched preparations for a new Environment Policy Strategy 2009-2015. It will include targets and propose actions
Greenhouse gas emission trends and projections in Europe 2006
 EEA Report No 9/2006 Greenhouse gas emission trends and projections in Europe 2006 ISSN 1725-9177 EEA Report No 9/2006 Greenhouse gas emission trends and projections in Europe 2006 Cover design: EEA Cover
European air quality data exchange and assessment in the framework of EIONET
 European air quality data exchange and assessment in the framework of EIONET Jaroslav Fiala, European Environment Agency Kongens Nytorv 6, Copenhagen Monitoring, data exchange and reporting Monitoring,
COMMISSION OF THE EUROPEAN COMMUNITIES COMMISSION STAFF WORKING DOCUMENT. Annex to the
 COMMISSION OF THE EUROPEAN COMMUNITIES Brussels, 22.3.2007 SEC(2007) 363 COMMISSION STAFF WORKING DOCUMENT Annex to the COMMUNICATION FROM THE COMMISSION TO THE EUROPEAN PARLIAMENT AND THE COUNCIL 'Towards
Submission by Hungary and the European Commission on behalf of the European Union and its Member States
 Submission by Hungary and the European Commission on behalf of the European Union and its Member States Budapest, 17 May 2011 Subject: Submission of information on forest management reference levels by
Imperatives to address the Climate Change Challenge
 Imperatives to address the Climate Change Challenge Imperatives to Address Climate Change The United Nations Framework Convention on Climate Change (UNFCCC) Laid the foundations of the contemporary global
Quality of life indicators - natural and living environment
 Quality of life indicators - natural and living environment Statistics Explained Data from January 2018. Most recent data: Further Eurostat information, Main tables and Database. Planned update: January
COMMISSION STAFF WORKING DOCUMENT
 EN EN EN EUROPEAN COMMISSION Brussels, 9.2.2010 SEC(2010) 118 final COMMISSION STAFF WORKING DOCUMENT On implementation of Council Directive 91/676/EEC concerning the protection of waters against pollution
Trends and projections in Europe 2018
 Trends and projections in Europe 2018 Tracking progress towards Europe s climate and energy targets (First release, 26 October 2018) Introduction 1 Introduction 1.1 Objective This early release of the
10. ENVIRONMENT. Air pollution and climate change Water Waste Environment and agriculture Environmental expenditure
 YBK_EN.qxp 16/01/2007 09:26 Page 267. ENVIRONMENT Air pollution and climate change Water Waste Environment and agriculture Environmental expenditure YBK_EN.qxp 16/01/2007 09:26 Page 269 Environment Air
Approximated EU greenhouse gas inventory
 EEA Report No 23/2016 Approximated EU greenhouse gas inventory Proxy GHG emission estimates for 2015 ISSN 1977-8449 EEA Report No 23/2016 Approximated EU greenhouse gas inventory Proxy GHG emission estimates
Greenhouse gas emission trends in Europe,
 1 Topic report 7/2002 Greenhouse gas emission trends in Europe, 19 2000 Prepared by: Bernd Gugele, Manfred Ritter, Katarína Marečková European Topic Centre on Air and Climate Change Project manager: André
Trends in waste generation and management in Europe. Özgür Saki European Environment Agency
 Trends in waste generation and management in Europe Özgür Saki European Environment Agency The European Environment Agency An EU institution situated in Copenhagen since 1994 Provides the information necessary
FCCC/SBI/2014/INF.20/Add.1
 United Nations FCCC/SBI/2014/INF.20/Add.1 Distr.: General 24 November 2014 English only Subsidiary Body for Implementation Forty-first session Lima, 1 8 December 2014 Item 3(b) of the provisional agenda
energy in figures Energy
 EU energy in figures Statistical pocketbook 2015 Energy This publication does not involve the European Commission in liability of any kind. Europe Direct is a service to help you find answers to your questions
Germany. Highlights in Climate change and energy
 124 2008 ENVIRONMENT POLICY REVIEW ANNEX Berlin Highlights in 2008 2008 was an active period for German environment policy and important policy commitments of prior years have been followed up with concrete
Energy and CO 2 emissions in the OECD
 Energy and CO 2 emissions in the OECD With detailed supply and demand data up to 216 1 1. Data based on the 218 preliminary editions of the IEA World energy balances, and the IEA CO 2 Emissions from fuel
Finnish forest industry commitments to environmental and responsibility issues
 Finnish forest industry commitments to environmental and responsibility issues 1 RESPONSIBILITY REQUIRES ACTION he Finnish forest industry has been actively developing its conduct in environmental and
PPI Training. MODULE 2 The need to innovate in municipal waste management. PPI training Location of the training Date of the training.
 PPI Training MODULE 2 The need to innovate in municipal waste management PPI training Location of the training Date of the training Contents Status quo Waste management in Europe Drivers for innovation
Instruments of environmental policy
 Instruments of environmental policy Instruments of environmental policies are related to methods, environmental legislation and administrative procedures developed with a view to reduce negative impacts
ANNUAL PUBLICATION: detailed data. VOLUME OF EXPORTS FELL BY 4,7 PER CENT IN 2015 Export prices rose 0,7 per cent. 24 March 2016
 ANNUAL PUBLICATION: detailed data 2 March 216 VOLUME OF EXPORTS FELL BY,7 PER CENT IN 21 Export prices rose,7 per cent According to Finnish Customs preliminary data, the value of Finland s goods exports
under the clean development mechanism with a view to forwarding a draft
 Decision 2/CMP.7 Land use, land-use change and forestry The Conference of the Parties serving as the meeting of the Parties to the Kyoto Protocol, Affirming that the implementation of land use, land-use
Decision 11/CP.7. Land use, land-use change and forestry. Recalling its decisions 1/CP.4, 8/CP.4, 9/CP.4 and 16/CP.5,
 Page 54 The Conference of the Parties, Decision 11/CP.7 Land use, land-use change and forestry Recalling its decisions 1/CP.4, 8/CP.4, 9/CP.4 and 16/CP.5, Recalling also its decision 5/CP.6, containing
Figure 1. Energy dependency of EU member states in 2004 (%)
") The ESTONIAN ENERGY SECTOR IN COMPARISON TO OTHER COUNTRIES Einari Kisel The n energy sector has undergone several significant changes in the past few years. The following article represents an effort
The ESTONIAN ENERGY SECTOR IN COMPARISON TO OTHER COUNTRIES Einari Kisel The n energy sector has undergone several significant changes in the past few years. The following article represents an effort
Bathing water results 2010 Slovenia
 Bathing water results 2010 Slovenia 1. Reporting and assessment This report gives a general overview of water quality in Slovenia during the 2010 season. In 2010 Slovenia reported under the Directive 2006/7/EC.
Better Waste Management Can Avoid GHG Emissions Significantly
 GMI MSW Subcommittee Meeting March 2013 Better Waste Management Can Avoid GHG Emissions Significantly Marlene Sieck Federal Environment Agency GERMANY 1 Federal Environment Agency Waste Technology Waste
ISSN energy. in figures. Energy
 ISSN 1977-4559 EU energy in figures STATISTICAL POCKETBOOK 2014 Energy EU ENERGY IN FIGURES POCKETBOOK 2014 1 This publication does not involve the European Commission in liability of any kind. Europe
THE RENEWABLE ENERGY CONTRACTOR MARKET IN EUROPE THE POWER INDEX
 THE RENEWABLE ENERGY CONTRACTOR MARKET IN EUROPE THE POWER INDEX There are 1.2 million jobs in renewable energy across the European Union In the European energy market, the shift towards renewables is
TERM EEA-31 Transport emissions of greenhouse gases by mode
 Indicator factsheet TERM 2003 02 EEA-31 Transport emissions of greenhouse gases by mode In the area of EEA-31, emissions of greenhouse gases (GHGs) from transport (excluding international transport) increased
Ireland s Final Greenhouse Gas Emissions
 Ireland s Final Greenhouse Gas Emissions 1990-2016 April 2018 CONTENTS KEY HIGHLIGHTS... 2 Introduction... 3 Ireland s Greenhouse Gas Emissions in 2016... 3 Changes in Emissions from Sectors between 2015
European Commission. Communication on Support Schemes for electricity from renewable energy sources
 European Commission Communication on Support Schemes for electricity from renewable energy sources External Costs of energy and their internalisation in Europe Beatriz Yordi DG Energy and Transport External
The EU Renewable Energy Framework for Biogas. Giulio Volpi Renewable Energy and CCS Unit DG Energy, European Commission
 The EU Renewable Energy Framework for Biogas Giulio Volpi Renewable Energy and CCS Unit DG Energy, European Commission The 20-20-20 EU policy, by 2020-20% -20% 100% 20% Greenhouse gas levels Energy consumption
Published by the Stationery Office, Dublin, Ireland. To be purchased from the:
 Published by the Stationery Office, Dublin, Ireland. To be purchased from the: Central Statistics Office, Information Section, Skehard Road, Cork. Government Publications Sale Office, Sun Alliance House,
The need for better statistics for climate change policies
 The need for better statistics for climate change policies Jacqueline McGlade Greenhouse gas emission data: more timely and more spatial data needed EEA annual report on GHG trends and projections in Europe
Bathing water results 2010 Lithuania
 Bathing water results 2010 Lithuania 1. Reporting and assessment This report gives a general overview of water quality in Lithuania during the 2010 season. Lithuania has reported under the Directive 2006/7/EC
How effective will the EU s largest post-2020 climate tool be?
 Understanding the Climate Action Regulation How effective will the EU s largest post-2020 climate tool be? Carbon Market Watch Policy Brief, April 2018 Introduction The Climate Action Regulation (CAR),
Implementation of mitigation measures for N 2 O emissions
 Implementation of mitigation measures for N 2 O emissions Peter Kuikman with colleagues at Alterra Oene Oenema, Jan Peter Lesschen, Gerard Velthof, Jan Willem van Groenigen, Rene Schils Nitrogen losses
Ireland s Provisional Greenhouse Gas Emissions
 Ireland s Provisional Greenhouse Gas Emissions 1990-2016 November 2017 CONTENTS KEY HIGHLIGHTS... 2 Introduction... 3 Ireland s Greenhouse Gas Emissions in 2016... 3 Changes in Emissions from Sectors between
CAP CONTEXT INDICATORS
 CAP CONTEXT INDICATORS 2014-2020 33. FARMING INTENSITY 2017 update CONTEXT INDICATOR 33: FARMING INTENSITY Intensification is an important restructuring process that has characterised European agriculture
Highlights. Figure 1. World Marketed Energy Consumption by Region,
 Highlights World energy consumption is projected to increase by 71 percent from 3 to 23. Fossil fuels continue to supply much of the energy used worldwide, and oil remains the dominant energy source. In
Bathing water results 2011 Romania
 Bathing water results 2011 Romania 1. Reporting and assessment This report gives a general overview of water quality in Romania during the 2011 season. Romania reported nine parameters under the Directive
Alternative Waste Management can reduce Greenhouse Gas emissions
 Alternative Waste Management can reduce Greenhouse Gas emissions Experiences from Germany and the European Union Marlene Sieck Federal Environment Agency Germany Federal Environment Agency Division III
REPORT FROM THE COMMISSION TO THE COUNCIL AND THE EUROPEAN PARLIAMENT
 EUROPEAN COMMISSION Brussels, 4.5.2018 COM(2018) 257 final REPORT FROM THE COMMISSION TO THE COUNCIL AND THE EUROPEAN PARLIAMENT on the implementation of Council Directive 91/676/EEC concerning the protection
Sea freight data indicate weak import demand both in US and EU27. Data on inland road and rail freight indicate weak domestic activity
 Statistics Brief Global Trade and Transport July 2013 Global Freight Volumes Indicate Increasing Dependency on -led Growth The latest update of global freight data collected by the International Transport
9. Climate change. Climate change, and avoiding its potential consequences, is addressed by. Environmental signals 2002
 66 9. Climate change policy issue indicator assessment achieving the Kyoto Protocol targets controlling emission reduction - contributions across sectors maintaining average temperatures below provisional
Energy Statistics 2017 edition
 Energy Statistics 2017 edition COMPACT GUIDES Energy Union Lighting, heating, transport, industrial output: without energy we would have none of these essential day-to-day services that make we and our
The Cancun Agreements: Land use, land-use change and forestry
 Decision 2/CMP.6 The Cancun Agreements: Land use, land-use change and forestry The Conference of the Parties serving as the meeting of the Parties to the Kyoto Protocol, Affirming that the implementation
10. Air Pollution. Air pollution. policy issue indicator assessment. - - urban air quality exceedances for particulates
 Air pollution 73 1. Air Pollution policy issue indicator assessment human health: protecting the population against pollution exposures urban air quality exceedances for ground-level ozone - - urban air
Wind energy in Europe markets
 Wind energy in Europe markets Turkish Wind Energy Congress (TWEC 2012), 7 November 2012, Istanbul Christian Kjaer CEO European Wind Energy Association (EWEA) More than 600 members from almost 60 countries
RENEWABLE H&C: BREAK-THROUGH NEEDS?
 RENEWABLE H&C: BREAK-THROUGH NEEDS? Tobias Fleiter, Jan Steinbach, Fraunhofer ISI Brussels, 2017/10/17, EUFORES Based on 3 EU H&C projects Mapping and analyses of the H/C fuel deployment EC tender study
Energy consumption, GDP and energy intensity '85 '90 '95 '00 '05
 Index 198=1 The Danish example the way to an energy efficient and energy friendly economy February 29 Danish experience shows that through persistent and active energy policy focus on enhanced energy efficiency,
REPORT FROM THE COMMISSION TO THE EUROPEAN PARLIAMENT, THE COUNCIL, THE EUROPEAN ECONOMIC AND SOCIAL COMMITTEE AND THE COMMITTEE OF THE REGIONS
 EUROPEAN COMMISSION Brussels, 27.2.2017 COM(2017) 88 final REPORT FROM THE COMMISSION TO THE EUROPEAN PARLIAMENT, THE COUNCIL, THE EUROPEAN ECONOMIC AND SOCIAL COMMITTEE AND THE COMMITTEE OF THE REGIONS
COMMISSION STAFF WORKING DOCUMENT. Review of greening after one year
 EUROPEAN COMMISSION Brussels, 22.6.2016 SWD(2016) 218 final PART 3/6 COMMISSION STAFF WORKING DOCUMENT Review of greening after one year EN EN Annex 2 Initial results of the implementation of green direct
PATTERNS OF THE AGRICULTURAL INCOME AND IMPACT OF STRUCTURAL CHANGES POST-ENLARGEMENT AMONG EU STATES
 CES Working Papers Volume VII, Issue 2A PATTERNS OF THE AGRICULTURAL INCOME AND IMPACT OF STRUCTURAL CHANGES POST-ENLARGEMENT AMONG EU STATES Mirela-Adriana RUSALI * Abstract: The article presents the
Environmental Best Practices, It Begins with Us: Business, Local Governments and International Community Should Work Together
 Environmental Best Practices, It Begins with Us: Business, Local Governments and International Community Should Work Together Jung Wan Lee, PhD Boston University, United States Objectives of the Paper