Session A4: Healthy-Polis Workshop on Climate Change and Urban Health II
|
|
|
- Milton Doyle
- 6 years ago
- Views:
Transcription


1 Session A4: Healthy-Polis Workshop on Climate Change and Urban Health II Experimental Campaign in a Heavily Trafficked Roundabout in Madrid for the Assessment of Air Quality Monitoring Station Representativeness in Terms of Population Exposure to NO 2 R. Borge, C. Quaassdorff, D. de la Paz, A. Narros, J. Pérez, J.M. de Andrés, R. Viteri, M. Paredes Laboratory of Environmental Modelling Technical University of Madrid (UPM) rborge@etsii.upm.es
2 OUTLINE 1. Introduction 2. Methodology 2.1. NO 2 concentration 2.2. Pedestrian simulation 2.3. Exposure assessment 3. Results and discussion 4. Conclusions
3 1. INTRODUCTION Poor urban air quality is one of the main environmental concerns worldwide According to WHO (WHO, 2014) outdoor air pollution caused 3.7 million premature deaths in 2012, most of them in urban areas where both, emission sources and population concentrate As a consequence, increasingly stringent air quality standards for the protection of human health are being put into force: e.g. Directive 2008/50/EC on ambient air quality and cleaner air for Europe Summary of the AQ Directive s limit values, target values, long-term objectives, information and alert threshold for the protection of human health. Source: EEA (2014)

 Annual mean NO 2 (2012).")
4 Many urban areas in Europe are struggling to meet these air quality standards, particularly for NO 2 Exceedances imply excessive population exposure Percentage of the urban population in the EU-28 exposed to air pollutant concentrations above EU and WHO reference levels ( ). Source: EEA (2014) Annual mean NO 2 (2012). Red and dark dots correspond to exceedances of the annual limit value (40 µg/m 3 ). Source: EEA (2014)


5 However, exceedances are determined from routinely measurements of urban air quality monitoring stations Industrial It is unclear what is the temporal and spatial representativeness of such monitoring stations It is difficult to assess the actual population exposure Urban background Traffic To what extent information from air quality monitoring stations is representative for population exposure and therefore the assessment of AQ limit values compliance?
 as a case study: Madrid city (Spain): 3.2 million inhabitants in the city, more than 5 million people in the metropolitan area")
6 This study presents a methodology to assess the representativeness of air quality monitoring stations in terms of population exposure to ambient air pollution It uses a particular location in Madrid (Spain) as a case study: Madrid city (Spain): 3.2 million inhabitants in the city, more than 5 million people in the metropolitan area

 19th highest hourly NO 2 concentration (µg/m 3 ) 400 350 300 250 200 150 100 50 0 400 0 10 20 30 40 50 60 70 80 350 300 250 200 150 100 50 2010 400 Annual mean NO 2")
7 19th highest hourly NO 2 concentration (µg/m 3 ) 19th highest hourly NO 2 concentration (µg/m 3 ) 19th highest hourly NO 2 concentration (µg/m 3 ) 2 nd Healthy Polis Workshop (during Kunshan Forum) Measures and policies are being implemented in the city and a positive trend of AQ levels is observed Observed NO 2 values (corresponding to the annual and hourly NO 2 limit values defined in the European AQ Directive) in the Madrid air quality monitoring network for the years NO 2 annual mean (Annual LV) th highest hourly NO 2 concentration (µg/m 3 ) 19th highest hourly NO 2 concentration (µg/m 3 ) Annual mean NO 2 concentration (µg/m 3 ) Annual mean NO 2 concentration (µg/m Traffic 3 ) stations 19th highest hourly NO 2 concentration (µg/m 3 ) 19th highest hourly NO 2 concentration (µg/m 3 ) Annual mean NO 2 concentration (µg/m 3 ) 0 Traffic stations Urban Annual background mean NO 2 concentration stations (µg/m 3 ) Traffic stations Urban background stations Suburban background stations Urban background stations Suburban background stations Suburban 40 background Annual 50 stations mean NO concentration (µg/m 3 ) 80 0 Annual mean NO concentration (µg/m 3 ) Annual mean NO 2 concentration (µg/m 3 ) Expected (modelled) NO 2 ambient concentration in the Madrid metropolitan area as a result of Madrid s Air Quality Plan NO 2 annual 1h 99.8th percentile (1-h LV)
 However")
 square, remain")

8 NO 2 Annual mean (2014) 2 nd Healthy Polis Workshop (during Kunshan Forum) However issues in specific traffic-related hot-spots such as Fernandez Ladreda (FL) square, remain FL air quality monitoring station Traffic stations in the Madrid City Council Air Quality Network
 Unexpensive method useful to understand spatial (not temporal) gradients in urban areas with high resolution Airbore pollutants (e.g. NO 2 ) are diffused into the tube and captured by an absorbent (e.")
9 2. METHODOLOGY NO 2 concentration 206 passive samplers (diffusion tubes) were deployed in the area 21 days (9 Feb. 2 Mar. 2015) Unexpensive method useful to understand spatial (not temporal) gradients in urban areas with high resolution Airbore pollutants (e.g. NO 2 ) are diffused into the tube and captured by an absorbent (e.g. triethanolamine TEA-)


 and")
 The")


10 10 Three tubes in the FL air quality monitoring station to compute relative error (10.1%) and correction factor (0.91) The resultant specie is assess in a spectrophotometer and related to knowconcentration patterns to derive concentration results
 NO 2")
11 A concentration map was created by interpolating individual tube results through a spline with barriers algorithm (minimum curvature method) NO 2 (µg/m 3 )
12 Observed NO 2 (µg/m 3 ) average- Observed NO 2 (µg/m 3 ) 2 nd Healthy Polis Workshop (during Kunshan Forum) M T W T F S S M T W T F S S M T W T F S S Day 90 Hourly NO 2 concentration values were taken from the FL air quality monitoring station An average daily variation pattern was computed Hour
 NO 2 (µg/m 3 ) This")

13 Spatial information from the passive tubes was combined with the temporal information from the air quality monitoring station to produce 24 hourly concentration maps Results were interpolated to a 5 meter resolution grid to cross the results with those from the pedestrian simulation NO 2 (µg/m 3 ) NO 2 (µg/m 3 ) This assumes that temporal concentration variations recorded by the air quality monitoring station are representative all over the domain (this hypothesis is deemed reasonable since concentration values in the area are directly related to road traffic that follows a similar temporal pattern everywhere in the domain, but needs to be tested)

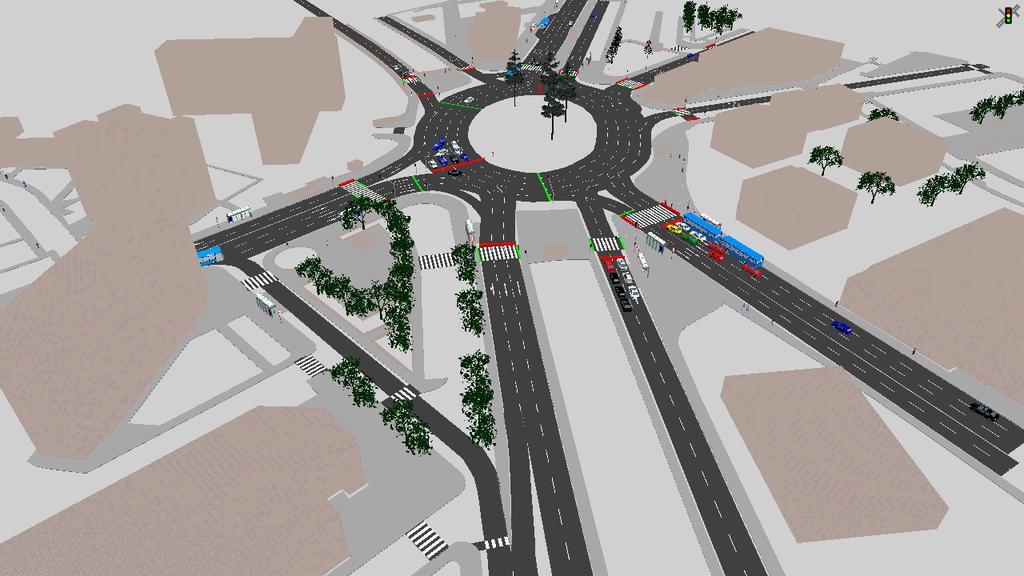
14 Average traffic intensity Average traffic intensity 2 nd Healthy Polis Workshop (during Kunshan Forum) Pedestrian simulation Both traffic and pedestrian fluxes were simulated with a micro-scale modelling system The PTV VISSIM microscale traffic flow model was selected to generate realistic traffic data while the VISWALK module was used for pedestrian simulation 15 representative scenarios (1 hour length) were simulated Week days Weekends


15 An intensive field campaign was made to compile all the information needed to feed the traffic model: Detailed network (lanes): 19 links, 22 connectors Movements EMT buses Traffic lights location and phases


16 The additional information provided for the pedestrian simulation includes: - Definition pedestrian areas (sidewalks), conflict areas (crosswalks) and obstacles - Routes and number of pedestrians in each of them - Bus lines, stops and frequency. Pedestrians boarding and exiting the bus. Sub-domain definition 300x300m Pedestrian areas Roads and crosswalks


17 Every possible route along the square was defined as a Pedestrian Static Route Decission using the collected data as input or output of the areas from the simulation. The social force approach generates the shortest path for the pedestrians to connect the defined beginning and end of each route trough the pedestrian areas. Pedestrian speed distribution in the range [ ] km/h


18 Pedestrian counts were made in all the 8 sampling areas defined to provide representative inputs for all the 15 scenarios defined Data (counts) from each scenario were post processed to assure consistency and flux continuity
 PT Stops PT Route PT Frequency Also metro stations were included in the simulation as input/output")
19 Pedestrian counts included quantification of bus passengers getting on and off the buses This observations were combined with the information regarding bus routes, stops and frequencies provided by the Municipal Transport Company (EMT) PT Stops PT Route PT Frequency Also metro stations were included in the simulation as input/output areas
20
21 Pedestrians (person s) 2 nd Healthy Polis Workshop (during Kunshan Forum) The location of each individual pedestrian was computed with 2 second resolution Pedestrian locations were interpolated to a 5 meter resolution grid and integrated throughout 1 hour time for each scenario From the result of the 15 representative scenarios an average day of pedestrian fluxes was derived Hour
 In addition, total")
22 Exposure assessment NO 2 concentration values and pedestrians figures were multiplied for every grid cell (5x5 meters) within the pedestrian simulation sub-domain (300 x 300 m) to compute total exposure every hour of the day Total exposure in the area can be computed by aggregating individual grid cell results for every hour or for the whole day (total exposure TE ) In addition, total theoretical exposure TTE was computed as the product of the total number of pedestrians (persons s) and the concentration recorded in the air quality monitoring station The TTE/TE ratio is propose as an index to assess the representativeness of the air quality monitoring station to assess population exposure


23 3. RESULTS AND DISCUSSION Total exposure Daily total exposure (person s µg/m 3 )
24 Total exposure (person s µg/m 3 ) 2 nd Healthy Polis Workshop (during Kunshan Forum) Maximum exposure in the roundabout area, especially in the crosswalks of the main streets High exposure figures also in bus stops and gathering areas Strong variation throughout the day: traffic emissions (and therefore concentration values) and pedestrian temporal patterns rather similar maximum exposure during the morning peak hour H1 H2 H3 H4 H5 H6 H7 H8 H9 H10 H11 H12 H13 H14 H15 H16 H17 H18 H19 H20 H21 H22 H23 H24 Hour

 4-5 AM Total exposure")
25 Although general spatial patterns are similar throughout the day, changes on traffic fluxes, pedestrian routes and public transportation schedules also have an effect on exposure distribution Total exposure (person s µg/m 3 ) 4-5 AM Total exposure (person s µg/m 3 ) 8-9 AM
26 TTE/TE index 2 nd Healthy Polis Workshop (during Kunshan Forum) This implies that it is difficult to provide exposure-representative information for a single air quality monitoring station In this particular case, the TTE/TE ratio was below 1 (0.78 as an average), indicating that recorded NO 2 levels in FL monitoring station would underestimate population exposure in that particular 300x300 m domain Hour


27 The TTE/TE ratio could be used to compute the concentration that the monitoring station should measure for a value of 1 If the spatial concentration pattern is known this allows the definition of a exposurerepresentative location for the air quality monitoring station (area in blue in the examples) 4-5 AM 8-9 AM
28 4. CONCLUSIONS The methodology presented constitutes a preliminary case study for the assessment of the representativeness of air quality monitoring stations from the population exposure point of view The methods used to simulate pedestrians and to obtain concentration maps can only be applied at microscale and may be used to support studies of monitoring station micrositing However, if pedestrians location and concentration values are provided by other means, the methodology based on the TTE/TE index assessment may be applied to larger areas and contribute to the definition monitoring points that may be representative of population exposure and thus, assessment of the compliance of health-related ambient air quality legal standards Meaningful criteria to define the extend of these areas, a critical factor for this kind of analysis, should also be defined in the future

 www.tecnaire-cm.")


,")

29 Acknowledgments: The TECNAIRE-CM research project was funded by the Madrid Greater Region (S2013/MAE-2972) The Madrid City Council provided the traffic cameras and partially funded this study The micro-scale traffic modelling was possible thanks to the collaboration of the national traffic authority (DGT), the Municipal Transport Company (EMT, S.A.), Madrid Calle 30, S.A. VISSIM and VISWALK ware licensed by PTV Group
30 Session A4: Healthy-Polis Workshop on Climate Change and Urban Health II Thank you for your attention!
Evaluation of a CFD modeling approach by means of an intensive experimental campaign using passive samplers in an urban area of Madrid
 Evaluation of a CFD modeling approach by means of an intensive experimental campaign using passive samplers in an urban area of Madrid Jose Luis Santiago 1, Rafael Borge 2, Fernando Martin 1, David de
TECNAIRE NEWS, OCTOBER 2016
 ISSUE 2, OCTOBER 2016 TECNAIRE NEWS, OCTOBER 2016 http://tecnaire-cm.org UNIÓN EUROPEA Fondos Estructurales Programas de Actividades de I + D entre grupos de investigación de la Comunidad de Madrid en
Application of CONDUITS-DST in Brussels
 Application of CONDUITS-DST in Brussels CONDUITS training workshop 26 November 2014 Madrid Pierre Schmitz, Brussels Mobility Antonios Tsakarestos, Technische Universität München Ioannis Kaparias, City
EMISSION NEEDS AT LOCAL SCALE FOR AIR QUALITY MODELLING
 Emission needs at local scale for AQ modelling Lumbreras, J., Borge, R., Tarrason, L., and Rodriguez, M.E. Parallel session FAIRMODE 5th October 2011 EMISSION NEEDS AT LOCAL SCALE FOR AIR QUALITY MODELLING
Challenges for a New Air Quality Directive: The Role of Monitoring and Modelling Techniques
 European Network on New Sensing Technologies for Air Pollution Control and Environmental Sustainability - EuNetAir COST Action TD1105 INTERNATIONAL WG1-WG4 MEETING on New Sensing Technologies and Methods
Ambient NO 2 -concentrations in Germany Spatio-temporal distribution, effects, mitigations measures and scenarios
 For our Environment 46 th Session, Task Force on Integrated Assessment Modelling (TFIAM) in Paris Ambient NO 2 -concentrations in Germany Spatio-temporal distribution, effects, mitigations measures and
Fostering clean vehicles through the new Madrid Air Quality & Climate Change Plan. Air quality and clean vehicles procurement Workshop
 Fostering clean vehicles through the new Madrid Air Quality & Climate Change Plan Air quality and clean vehicles procurement Workshop Paris, 12th September 2016 Population: Municipality - 3.166.130 -More
NOISE MAPPING AND NOISE ACTION PLANS IN LARGE URBAN AREAS
 NOISE MAPPING AND NOISE ACTION PLANS IN LARGE URBAN AREAS PACS: 43.50.Ba J. L. Bento Coelho and D. Alarcão CAPS-Instituto Superior Técnico P-1049-001 Lisbon, Portugal Tel. +351 21 8419393 Fax +351 21 8465303
Indicator Fact Sheet Signals 2001 Air Pollution
 Indicator Fact Sheet Signals 1 Air Pollution AP12b Exceedance days of air quality threshold value of Particulate Matter AP12 PM: in urban areas (black smoke 24h >12, TSP 24 h > 1, PM 24h > ug/m3) 4 4 3
Monitoring air pollution and public information in Paris Region. Karine LEGER, Directrice Partenariats et communication EIONET 24-25/10/16
 Monitoring air pollution and public information in Paris Region Karine LEGER, Directrice Partenariats et communication EIONET 24-25/10/16 Air pollution monitoring in France According to the French air
Impact of measures to improve urban air quality in Spain. Studies to estimate impact of measures for improving air quality in Spain and in some cities
 Impact of measures to improve urban air quality in Spain. Studies to estimate impact of measures for improving air quality in Spain and in some cities Fernando Martín, Marta G. Vivanco, José Luis Santiago,
Dispersion Modelling Tools for Urban Air Quality and Climate Amy Stidworthy, Jenny Stocker and David Carruthers
 Dispersion Modelling Tools for Urban Air Quality and Climate Amy Stidworthy, Jenny Stocker and David Carruthers 28 th April 2016 London CERC Software ADMS 5 ADMS-Urban ADMS-Roads ADMS-Airport EMIT FLOWSTAR-Energy
Controlling Pollution Episodes In Paris
 Controlling Pollution Episodes In Paris King s College London LAQNC 13/07/2017 Summary 1. State of the air quality in Paris region 2. December 2016 PM pollution episode and emergency measures 3. Crit Air
WG1 ASSESSMENT: KEY TOPICS & RECOMMENDATIONS STIJN JANSSEN & JOOST WESSELING
 WG1 ASSESSMENT: KEY TOPICS & RECOMMENDATIONS STIJN JANSSEN & JOOST WESSELING CONTENT» Fitness for purpose and quality objectives in assessment modelling WG1 recommendation» Spatial representativeness of
«Innovations for environmental monitoring and health; Systems with synergies for policies and research»
 «Innovations for environmental monitoring and health; Systems with synergies for policies and research» (the who, when, where and from what issues for Health) Andreas N. Skouloudis (*) andreas.skouloudis@jrc.it
Determination of Air Pollution Monitoring Stations
 Int. J. Environ. Res., 2(3): 313-318, Summer 2008 ISSN: 1735-6865 Determination of Air Pollution Monitoring Stations Motesaddi Zarandi, S. *1, Khajevandi, M. 2, Damez Fontaine, D. 3 and Ardestani, M. 4
European air quality data exchange and assessment in the framework of EIONET
 European air quality data exchange and assessment in the framework of EIONET Jaroslav Fiala, European Environment Agency Kongens Nytorv 6, Copenhagen Monitoring, data exchange and reporting Monitoring,
Clean Air. for. Kaliningrad
 Clean Air for Kaliningrad Clean Air for Kaliningrad The urban air pollution induced by traffic in Kaliningrad is raising increasing concern. KALAIR is a LIFE-Third Countries Project, co-funded by the European
REPRESENTATIVENESS OF URBAN MONITORING STATIONS
 REPRESENTATIVENESS OF URBAN MONITORING STATIONS JL Santiago, F Martín, A Martilli Atmospheric Pollution Division, Environmental Department, CIEMAT, Spain jl.santiago@ciemat.es fernando.martin@ciemat.es
Noise and air quality action plans and mitigation measures. Núria Castell and Núria Blanes
 Noise and air quality action plans and mitigation measures Núria Castell and Núria Blanes EIONET Workshop, Bern, 2014 1 Objectives Compare action plans and measures for both air quality and noise related
Creating a Transit Supply Index. Andrew Keller Regional Transportation Authority and University of Illinois at Chicago
 Creating a Transit Supply Index Andrew Keller Regional Transportation Authority and University of Illinois at Chicago Presented at Transport Chicago Conference June 1, 2012 Introduction This master's project
Proceedings Urban Air Quality Monitoring with Networked Low-Cost Sensor-Systems
 Proceedings Urban Air Quality Monitoring with Networked Low-Cost Sensor-Systems Michele Penza *, Domenico Suriano, Valerio Pfister, Mario Prato and Gennaro Cassano ENEA Italian National Agency for New
Ambient Air Quality Directives. Fitness Check
 Ambient Air Quality Directives Fitness Check February 2018 European Commission Clean Air Air pollution in Europe - Overview Europe s air quality is slowly improving, but fine particulate matter and nitrogen
SHERPA and SHERPA-city: screening tools for air quality modelling in Europe
 SHERPA and SHERPA-city: screening tools for air quality modelling in Europe B. Degraeuwe, E. Peduzzi, E. Pisoni, P. Thunis The European Commission s science and knowledge service Joint Research Centre
Simulation for urban design, evacuation, traffic & architecture. by Savannah Simulations AG
 SimWalk PRO Simulation for urban design, evacuation, traffic & architecture Copyright by Savannah Simulations AG Powerful analysis of people flows in the built environment What is SimWalk PRO in a nutshell?
4 Air quality
 4 Air quality 2 23 Key messages Significant improvements in air quality are expected by 23. However, long-term air quality objectives are unlikely to be met in all Member States by 23. This would still
Experimental study of NO x depolluting capabilities of a photocatalytic coating tested under suburban ambient conditions
 Experimental study of NO x depolluting capabilities of a photocatalytic coating tested under suburban ambient conditions M. Germán a ; M. Palacios a ; M. Pujadas a ; L. Núñez a ; J. Fernández-Pampillón
AIRBORNE PARTICULATE MATTER AT A BUS STATION: CONCENTRATION LEVELS AND GOVERNING PARAMETERS
 AIRBORNE PARTICULATE MATTER AT A BUS STATION: CONCENTRATION LEVELS AND GOVERNING PARAMETERS M Jamriska 1, * L Morawska 1, M Yip 2 and P Madl 2 1 International Laboratory for Air Quality and Health, Queensland
Sweden Air Quality Policies ??? Sweden Air Quality Policy Matrix Goals Status Current Policies & Programmes
 Sweden Air Quality Policies This document is based on research that UNEP conducted in 2015, in response to Resolution 7 of the UNEA 1. It describes country-level policies that impact air quality. Triple
Multilevel transport model for transport analysis of CIVITAS DYNAMO tasks
 Multilevel transport model for transport analysis of CIVITAS DYNAMO tasks Summer University Developing Mobility 2.0 systems and services Palma (Mallorca), 4-6 November 2015 Jacek Oskarbski Gdańsk University
THAT Council adopt the Congestion Management Strategy as outlined in this report
 RR3 ADMINISTRATIVE REPORT Report Date: May 2, 2017 Contact: Winston Chou Contact No.: 604.873.7913 RTS No.: 011564 VanRIMS No.: 08200020 Meeting Date: May 16, 2017 TO: FROM: SUBJECT: Vancouver City Council
Congestion Management Strategy
 Congestion Management Strategy Vancouver as of 2018 50% of trips are made on foot, by bike or transit. 6 major bridges in Vancouver. 32% decrease in distance driven per person since 2007. 4.6% population
Macroscopic and Microscopic Simulation for the Evaluation of People Mover Systems. Dr.-Ing. Peter Mott Sven Beller PTV AG, Karlsruhe, Germany
 Macroscopic and Microscopic Simulation for the Evaluation of People Mover Systems Dr.-Ing. Peter Mott Sven Beller PTV AG, Karlsruhe, Germany 1. Introduction This paper is intended to show how a comprehensive
Combatting Air Pollution Learning from Success in Germany
 For our Environment Roundtable National Clean Air Programme: Combatting Air Pollution in India 26 th November 2018, New Delhi Combatting Air Pollution Learning from Success in Germany Technical Session
ROAD TRANSPORT EMISSIONS EVOLUTION IN URBAN AREAS; THE CASE OF THESSALONIKI, GREECE
 Proceedings of the 14 th International Conference on Environmental Science and Technology Rhodes, Greece, 3-5 September 2015 ROAD TRANSPORT EMISSIONS EVOLUTION IN URBAN AREAS; THE CASE OF THESSALONIKI,
#IGPollution17. Matthew O Neill Lead Air Quality Officer Transport for Greater Manchester
 #IGPollution17 Matthew O Neill Lead Air Quality Officer Transport for Greater Manchester Air Quality in Greater Manchester Matthew O Neill, Lead Air Quality Officer Ambitions for Greater Manchester We
Ozone pollution management:! regulatory compliance, public information and atmospheric impact due to new industrial activities
 Ozone pollution management:! regulatory compliance, public information and atmospheric impact due to new industrial activities Núria Castell Balaguer, Enrique Mantilla and Millán M. Millán Fundación CEAM
The Secrets to HCM Consistency Using Simulation Models
 The Secrets to HCM Consistency Using Simulation Models Ronald T. Milam, AICP David Stanek, PE Chris Breiland Fehr & Peers 2990 Lava Ridge Court, Suite 200 Roseville, CA 95661 r.milam@fehrandpeers.com (916)
Impact of traffic composition and street canyon on the street level air quality and pedestrian exposure in Central, Hong Kong
 Impact of traffic composition and street canyon on the street level air quality and pedestrian exposure in Central, Hong Kong Agata Rakowska, Ka Chun Wong, Thomas Townsend, Chan Ka Lok, Dane Westerdahl,
Multi-Resolution Traffic Modeling for Transform 66 Inside the Beltway Projects. Prepared by George Lu, Shankar Natarajan
 Multi-Resolution Traffic Modeling for Transform 66 Inside the Beltway Projects Prepared by George Lu, Shankar Natarajan 2017 VASITE Annual Meeting, June 29, 2017 Outline Transform I-66 Inside the Beltway
10. Air Pollution. Air pollution. policy issue indicator assessment. - - urban air quality exceedances for particulates
 Air pollution 73 1. Air Pollution policy issue indicator assessment human health: protecting the population against pollution exposures urban air quality exceedances for ground-level ozone - - urban air
Air quality sensing in europe
 Air quality sensing in europe Round Table: New opportunities for air quality sensing lower cost sensors for public authorities and citizen science initiatives Frankfurt, 24 October 2018 European Commission
ASSESSMENT OF AMBIENT AIR QUALITY IN ESKISEHIR, TURKEY
 Proceedings of the Third International Symposium on Air Quality Management at Urban, Regional and Global Scales. pp. 2-29, 26-3 September 25, Istanbul Turkey ASSESSMENT OF AMBIENT AIR QUALITY IN ESKISEHIR,
Evolution of Air Pollution Monitoring in Ottawa
 Evolution of Air Pollution Monitoring in Ottawa Natty Urquizo and Martha Robinson Environmental Sustainability & Public Health City of Ottawa Hamilton February 2012 Reasons for Air Quality Monitoring Although
Content of the module
 Content of the module Methodology approach Planning process Definition of working area Population and territorial context Supply Infrastructure Transport service Demand On board / at the stations or bus
Multiscale modelling system for pollutant concentration predictions in urban areas
 Multiscale modelling system for pollutant concentration predictions in urban areas Stefano Bande1, Massimo Muraro1, Matteo Giorcelli2, Roberta De Maria1, Monica Clemente1, Sandro Finardi2, Maria Grazia
Exceedance modelling and exposition
 For our environment FAIRMODE Technical Meeting 19-21th June 2017, Athens Exceedance modelling and exposition Dr. Stephan Nordmann Unit II 4.1 General aspects of air pollution control Statutory regulations
Advanced Transportation Management System (ATMS)
") Advanced Transportation Management System (ATMS) Presentation to the ITS Technology Workshop for Municipalities February 15, 2017 ATMS Project Background Increasing traffic volumes Roadway network is near
Advanced Transportation Management System (ATMS) Presentation to the ITS Technology Workshop for Municipalities February 15, 2017 ATMS Project Background Increasing traffic volumes Roadway network is near
ESTIMATING THE IMPACT OF URBAN VEGETATION ON AIR QUALITY IN A NEIGHBORHOOD: REAL CASE VS NEW VEGETATION SCENARIOS
 17th International Conference on Harmonisation within Atmospheric Dispersion Modelling for Regulatory Purposes, 9-12 May 2016 Budapest, Hungary ESTIMATING THE IMPACT OF URBAN VEGETATION ON AIR QUALITY
Hear perspective and receive input for plan from all affected stakeholders and subject matter experts Provide committee members with resources to
 1 January 11, 2017 Hear perspective and receive input for plan from all affected stakeholders and subject matter experts Provide committee members with resources to reach out to constituents that you represent
Spatial Extent of Mobile Source Air Pollution
 Spatial Extent of Mobile Source Air Pollution Ying Zhou, Sc.D. Harvard School of Public Health Northern Transportation and Air Quality Summit Baltimore, MD August 13 1, 28 1 Introduction Hot spot Spatial
Air Pollution at Street Level in European Cities with Emphasis on PM 10 and PM 2.5
 Air Pollution at Street Level in European Cities with Emphasis on PM 10 and PM 2.5 Professor Nicolas Moussiopoulos Aristotle University Thessaloniki Laboratory of Heat Transfer and Environmental Engineering
National Ambient Air Quality Monitoring Norms & Standards: Authority Perspective Session 2.3
 National Ambient Air Quality Monitoring Norms & Standards: Authority Perspective Session 2.3 8 th Annual Air Quality Governance Lekgotla 30 September 2013 Cape Town International Convention Centre Presented
uemep: concept and application
 uemep: concept and application Bruce Rolstad Denby Peter Wind Hilde Fagerli AIRQUIP kickoff meeting 19.04.2017 23.05.2017 Norwegian Meteorological Institute What is uemep? uemep is a methodology for calculating
Reporting on natural events under the AQ Directive
 Reporting on natural events under the AQ Directive Review of years 2008 and 2009 M. Viana, J. Pey, F. de Leeuw, X. Querol, A. Alastuey, M. dall Osto, T. Moreno mar.viana@idaea.csic.es Legislative background
Air quality monitoring and modelling techniques for street canyons: the Paris experience
 Air quality monitoring and modelling techniques for street canyons: the Paris experience S. Vardoulakis^, N. Gonzalez-Flesca^ & B.E.A. Fisher* *Institut National de I'Environnement Industriel et des Risques
Go! Express & logistics
 Go! Express & logistics ECLF CONFERENCE Donostia San Sebastian Spain 15-17 October 2015 Wolfgang Sacher CEO GO! General Express & City Logistics GmbH Berlin INTRODUCTION GO! EXPRESS & LOGISTICS IMPLEMENTATION
CHILDREN EXPOSURE TO TRAFFIC RELATED POLLUTION: ASSESSMENT OF A TYPICAL SCHOOLDAY
 HARMO 15, Madrid, May 2013 15th International Conference on Harmonisation within Atmospheric Dispersion Modelling for Regulatory Purposes CHILDREN EXPOSURE TO TRAFFIC RELATED POLLUTION: ASSESSMENT OF A
Resolving Community Scale in Air Toxics Modeling Applications
 Resolving Community Scale in Air Toxics Modeling Applications Vlad Isakov Air-Surface Processes Modeling Branch Atmospheric Modeling Division National Exposure Research Laboratory EPA Office of Research
ASSESSMENT OF EXPOSURE TO TRAFFIC-RELATED AIR POLLUTION IN A LARGE URBAN AREA: IMPACTS OF INDIVIDUAL MOBILITY AND TRANSIT INVESTMENT SCENARIOS
 ASSESSMENT OF EXPOSURE TO TRAFFIC-RELATED AIR POLLUTION IN A LARGE URBAN AREA: IMPACTS OF INDIVIDUAL MOBILITY AND TRANSIT INVESTMENT SCENARIOS Maryam Shekarrizfard, McGill University Marianne Hatzopoulou,
SampaNoShape. São Paulo Bus Movement Model
 MAC6922 [Advanced Topics in Smart Cities Research] 2018, Feb 8th SampaNoShape São Paulo Bus Movement Model Camilla Almeida [USP] Lucas Sá [USP] Mariana de Souza [UFMS] Melissa Wen [USP] Robson Aleixo [USP]
Sensor networks for public (and regulatory) information
 information") Sensor networks for public (and regulatory) information A. Bartonova, N. Castell, F. R. Dauge, M. F. Fredriksen, H.-Y. Liu, S. Grossberndt, W. Lahoz, J.-M. Lepioufle, P. Schneider and the CITI-SENSE team
Sensor networks for public (and regulatory) information A. Bartonova, N. Castell, F. R. Dauge, M. F. Fredriksen, H.-Y. Liu, S. Grossberndt, W. Lahoz, J.-M. Lepioufle, P. Schneider and the CITI-SENSE team
An integrative modeling approach for predicting exposures to traffic-related air pollution during commuting
 An integrative modeling approach for predicting exposures to traffic-related air pollution during commuting Extended Abstract #511 Ryan Michael *, Amy L. Stuart *, Getachew Dagne *, John Volckens, Jennifer
The results of CAIMANs project FUTURE TIME AIR DISPERSION MODEL RESULTS FOR THE TREND SCENARIO. Anastasia Poupkou AUTH
 The results of CAIMANs project FUTURE TIME AIR DISPERSION MODEL RESULTS FOR THE TREND SCENARIO Anastasia Poupkou AUTH Mitigation Air Pollution in the Mediterranean Port Cities Venice, 12th June 2015 Air
Goals Status Current Policies & Programmes GENERAL OVERVIEW
 Malta Air Quality Catalogue This document is based on research that UNEP conducted in 2015, in response to Resolution 7 of the UNEA 1. It describes countrylevel policies that impact air quality. Triple
The role of light duty vehicles in future air pollution: a case study of Sacramento
 Transportation Planning and Technology Vol. 33, No. 6, August 2010, 541549 The role of light duty vehicles in future air pollution: a case study of Sacramento Guihua Wang* Institute of Transportation Studies,
The London Hybrid Exposure Model
 The London Hybrid Exposure Model The Environmental Research Group King s College London Dr David Dajnak david.dajnak@kcl.ac.uk 21 217 224 231 238 245 252 259 266 273 28 287 294 211 218 Cumulative Life
CCA3 Modeling & Monitoring
 CCA3 Modeling & Monitoring Ana Isabel Miranda University of Aveiro, Portugal FAIRMODE Plenary Meeting Baveno 11-12 February 2014 WG2-SG1 To promote best practices on the combined use of models and monitoring
GUIDE FOR THE PREPARATION OF TRAFFIC IMPACT STUDIES
 GUIDE FOR THE PREPARATION OF TRAFFIC IMPACT STUDIES Adopted by Town Council on November 25, 2008 Prepared By: HNTB Engineering Department Planning Department TABLE OF CONTENTS I. INTRODUCTION... 1 II.
Low Emission Zone. An East European City point of view. BESTUFS Workshop. Madrid 14 March 2008
 Low Emission Zone An East European City point of view BESTUFS Workshop Madrid 14 March 2008 2 Romania - Geographic position 3 Romania Suceava County - Geographic position 4 Romania Suceava City - Geographic
Ambient air quality in Norway Line Merete Karlsøen & Silje Aksnes Bratland Section for Transport and Air Quality 13 th June 2018
 Ambient air quality in Norway Line Merete Karlsøen & Silje Aksnes Bratland Section for Transport and Air Quality 13 th June 2018 Background 5 302 778 inhabitants EU EEA 2. longest coastline in the world
GIS Services & Open Data in Public Transit. Sergio Fernández Balaguer (EMT Madrid) Enrique Diego Bernardo (EMT Madrid)
 Enrique Diego Bernardo (EMT Madrid)") GIS Services & Open Data in Public Transit Sergio Fernández Balaguer (EMT Madrid) Enrique Diego Bernardo (EMT Madrid) MADRID: A DINAMIC ECOSYSTEM WITH A COMPLEX TRANSPORT SYSTEM Capital and largest city
GIS Services & Open Data in Public Transit Sergio Fernández Balaguer (EMT Madrid) Enrique Diego Bernardo (EMT Madrid) MADRID: A DINAMIC ECOSYSTEM WITH A COMPLEX TRANSPORT SYSTEM Capital and largest city
Austria Air Quality Policy Catalogue Goals Status Current Policies & Programmes GENERAL OVERVIEW
 Austria Air Quality Catalogue This document is based on research that UNEP conducted in 2015, in response to Resolution 7 of the UNEA 1. It describes countrylevel policies that impact air quality. Triple
DEVELOPMENT OF LIEPAJA CITY MACROSCOPIC MODEL FOR DECISION-MAKING
 Transport and Telecommunication, 2007, Volume 8, No 2, 38 46 Transport and Telecommunication Institute, Lomonosov 1, Riga, LV-1019, Latvia DEVELOPMENT OF LIEPAJA CITY MACROSCOPIC MODEL FOR DECISION-MAKING
Zenith Model Recalibration and Validation Version Review of VISTA. February Public Transport Victoria
 Zenith Model Recalibration and Validation Version 3.0.0 Review of VISTA February 2014 Public Transport Victoria Page Intentionally Left Blank Review of VISTA Draft Report Project No. ZML-VIC-Year4 COPYRIGHT:
Air quality Monitoring (in the Urban context): modeling, monitoring and using proxy data
: modeling, monitoring and using proxy data") Air quality Monitoring (in the Urban context): modeling, monitoring and using proxy data Olav Peeters Belgian Interregional Environment Agency (IRCEL CELINE) peeters@irceline.be Outline 101: Introduction
Air quality Monitoring (in the Urban context): modeling, monitoring and using proxy data Olav Peeters Belgian Interregional Environment Agency (IRCEL CELINE) peeters@irceline.be Outline 101: Introduction
Multi-objective Optimization of Urban Energy Systems Considering High Shares of Renewable Energy Generation
 Multi-objective Optimization of Urban Energy Systems Considering High Shares of Renewable Energy Generation Andreas Fleischhacker Georg Lettner Hans Auer 15 th IAEE European Conference 2017 Session 2F:
VS-PLUS Introduction. Even this knotty problem can be solved. Dr. Thomas Riedel. April 2001 page 1
 VS-PLUS Introduction Even this knotty problem can be solved Dr. Thomas Riedel April 2001 page 1 Presentation Contents Company introduction The traffic engineering workflow The workflow support tools Basic
Impact assessment of PM and BC emissions from residential wood combustión in Osorno, Chile
 Impact assessment of PM and BC emissions from residential wood combustión in Osorno, Chile report elaborated by Swedish Meteorological and Hydrological Institute & Centro Mario Molina Chile 30/04/2014
LINN COUNTY PUBLIC HEALTH DEPARTMENT
 LINN COUNTY PUBLIC HEALTH DEPARTMENT Air Quality Division M E M O R A N D U M DATE: MARCH 13, 2009 TO: FROM: RE: CC: TONY DAUGHERTY PM2.5 PREDICTED MODELING IMPACTS OF OUTDOOR WOOD BOILERS INTRODUCTION
DEVELOPMENT OF LIFE MONZA PROJECT: INTRODUCTION AND MANAGEMENT OF NOISE LOW EMISSION ZONES
 DEVELOPMENT OF LIFE MONZA PROJECT: INTRODUCTION AND MANAGEMENT OF NOISE LOW EMISSION ZONES Salvatore Curcuruto Rosalba Silvaggio Enrico Mazzocchi Giuseppe Marsico Summary The first objective of LIFE MONZA
FAIRMODE The Forum for Air Quality Modelling in Europe Implications for the United Kingdom
 FAIRMODE The Forum for Air Quality Modelling in Europe Implications for the United Kingdom Emily Connolly, Dispersion Modellers User Group Wednesday 5 th December 2012 Outline Air quality management in
APPENDIX B. Public Works and Development Engineering Services Division Guidelines for Traffic Impact Studies
 APPENDIX B Public Works and Development Engineering Services Division Guidelines for Traffic Impact Studies Revised December 7, 2010 via Resolution # 100991 Reformatted March 18, 2011 TABLE OF CONTENTS
EXPERIMENTAL INVESTIGATION OF URBAN CANOPY LAYER FLOW AND DISPERSION
 EXPERIMENTAL INVESTIGATION OF URBAN CANOPY LAYER FLOW AND DISPERSION Schatzmann, M. 1, Bächlin, W. 2,Emeis, S. 3, Kühlwein, J. 4, Leitl, B. 1, Müller, W.J. 5, Schäfer, K. 3 1 University of Hamburg, Centre
SR 99 Incident Response After- Action Plan
 SR 99 Incident Response After- Action Plan Background On June 10, 2014 at 1:52 PM, a pickup truck and a passenger car collided on southbound SR 99 (E Marginal Way S), just south of S Spokane St. The SDOT
NO2, SO2, PM2.5, Oh my!?! Information Session EPA R/S/L Modelers Workshop May 10, 2010
 NO2, SO2, PM2.5, Oh my!?! Information Session EPA R/S/L Modelers Workshop May 10, 2010 Purpose & Outline Provide background and updates on permit modeling processes and technical aspects related to new
Response of the Road Haulage Association to Transport for London. Consultation on Mayor s Transport Strategy.
 Response of the Road Haulage Association to Transport for London. Consultation on Mayor s Transport Strategy. Background about the RHA 2 October 2017 1. The Road Transport Industry is a dynamic, business
PROJECT: EURO-AUDITS THE EUROPEAN ROAD SAFETY AUDITOR TRAINING SYLLABUS APPENDIX A PROPOSED COURSE PROGRAMMES. October 2007
 PROJECT: EURO-AUDITS THE EUROPEAN ROAD SAFETY AUDITOR TRAINING SYLLABUS APPENDIX A PROPOSED COURSE PROGRAMMES October 2007 A European Commission co-funded project Appendix A Proposed Course Programmes
Clean Air Policies in a European Context
 Clean Air Policies in a European Context OSLO, Norway 8 November 2016 Roald Wolters Unit Clean Air European Commission DG ENV.C.3 Topic of air pollution high in the public interest Sources: Various online
Work Zone Impacts. Basic Concept 1/6/2011. What is a WZ Impact Assessment? Module 5
 Work Zone Impacts Module 5 What is a WZ Impact Assessment? WZ Impact Assessment is the process of understanding the safety and mobility impacts of a road construction or maintenance project Basic Concept
Transit Service Guidelines
 G R E AT E R VA N CO U V E R T R A N S P O RTAT I O N A U T H O R I T Y Transit Service Guidelines PUBLIC SUMMARY REPORT JUNE 2004 Greater Vancouver Transportation Authority TRANSIT SERVICE GUIDELINES
Defining urban mobility indicators
 POLIS Conference 2009 10 December 2009, Flagey, Bruxelles Session B1. Tools to support decision making in sustainable transport Defining urban mobility indicators Fabio Nussio Mobility Agency of the City
Transportation, Parking & Urban Design Study Draft Transportation Recommendations. Presented by: Bill Campie & Jeff Tumlin
 Transportation, Parking & Urban Design Study Draft Transportation Recommendations Presented by: Bill Campie & Jeff Tumlin June 2016 Town Goals Communication with Town Improve Guest Experience Get People
1003 K Street NW, Suite 209 Washington, DC MEMORANDUM. Matthew Ridgway, Nat Bottigheimer, and Alex Rixey, Fehr & Peers
 1003 K Street NW, Suite 209 Washington, DC 20001 202.854.2750 MEMORANDUM Date: To: From: Subject: Eric Graye, M-NCPPC Matthew Ridgway, Nat Bottigheimer, and Alex Rixey, Fehr & Peers Performance Metrics
SUTRA : Sustainable Urban Transportation for the City of Tomorrow
 Preliminary Report SUTRA : Sustainable Urban Transportation for the City of Tomorrow WP 03: Multi-modal Transportation Modelling D03.3 User Manual and Example Test Data Sets First Draft Karlsruhe, January
Principles of a Sustainable Traffic Management
 Principles of a Sustainable Traffic Management Manfred Boltze Transport Planning and Traffic Engineering Technische Universität Darmstadt 2nd International Conference on Traffic Engineering (ICTE 17) April
INTELLIGENT TRANSPORTATION SYSTEMS APPENDIX
 INTELLIGENT TRANSPORTATION SYSTEMS APPENDIX Southern California Association of Governments ADOPTED APRIL 2012 INTELLIGENT TRANSPORTATION SYSTEMS Introduction 1 Existing System Description 1 Existing System
5.39 AN EVALUATION OF THE URBAN DISPERSION MODELS SIRANE AND ADMS URBAN, USING FIELD DATA FROM LYON.
 5.39 AN EVALUATION OF THE URBAN DISPERSION MODELS SIRANE AND ADMS URBAN, USING FIELD DATA FROM LYON. Soulhac, L. 1., Pradelle, F. 2 & Perkins, R.J. 1 1 Laboratoire de Mécanique des Fluides et d Acoustique,
ASSESSMENT OF TRAFFIC INDUCED POLLUTION FROM THE NEW HIGHWAY OF ATHENS (ATTIKI ODOS) Observatory of Athens, Athens, Greece
 Observatory of Athens, Athens, Greece") ASSESSMENT OF TRAFFIC INDUCED POLLUTION FROM THE NEW HIGHWAY OF ATHENS (ATTIKI ODOS) Michael Petrakis 1, Ilias Kavouras 1, Basil Psiloglou 1, Spyros Lykoudis 1 and Theodora Kopania 1 1 Institute for Environmental
ASSESSMENT OF TRAFFIC INDUCED POLLUTION FROM THE NEW HIGHWAY OF ATHENS (ATTIKI ODOS) Michael Petrakis 1, Ilias Kavouras 1, Basil Psiloglou 1, Spyros Lykoudis 1 and Theodora Kopania 1 1 Institute for Environmental
Transit Market and Travel Demand Regional Service Councils June 2018
 Transit Market and Travel Demand Regional Service Councils June 2018 So, what is NextGen? Why are we doing this? Outdated bus network It s been 25 years since last redesign! A new bus network More People