Northeastern Illinois Regional Water Supply/Demand Plan. Water Northeastern Illinois Regional Water Supply/Demand Plan.
|
|
|
- Colleen Allison
- 6 years ago
- Views:
Transcription

1 Water 2050 Northeastern Illinois Regional Water Supply/Demand Plan March 2010 III

2 IV
3 Northeastern Illinois Regional Water Supply/Demand Plan March 2010 III

4 IV Image courtesy of istockphoto
5 Table of Contents Table Of Contents Executive Summary Chapter 1 Introduction 1 Background 2 State Planning 2 Regional Planning 3 Northeastern Illinois Regional Water Supply Planning Group 5 Purpose 7 Chapter 2 Framework for Regional Water Supply Planning and Management 11 Planning Paradigms 12 Adaptive Management 12 Sustainability 13 Planning and Management in the Region Today 15 Lake Michigan Service Region 15 Groundwater Dependent Users 18 Inland Surface Water Dependent Users 19 Drought Planning And Management 19 Great Lakes Compact 20 Other Laws: Water Authorities Act 22 Water Rates in Northeastern Illinois 23 How Much Water is Currently Being Used? 28 Illinois Water Inventory Program 28 Regional Water Demand Scenarios for Northeastern Illinois: How Much Water Will be Needed in the Future? 33 Future Water Availability 37 Climate Variability and Change 37 Surface Water: Variability and Change 39 Summary of Regional Groundwater Modeling Study 40 Water Quality and Aquatic Ecosystems 44 Water Quality Considerations 44 Wetlands/Riparian Area Protection 49 Instream-Flow Protection 50 V IX Chapter 3 Land and Water 57 Relationship Between Land Use Decisions and Water Resources 57 The Impact of Land-Use Decisions on Water Resources 59 Towards Integration 63 Programs/Tools for Integration 63 Regional Approach 63 Local Planning Technical Assistance Act 63 Water Revolving Funds 64 Developments of Regional Importance 65 go to Section 208 Planning 66 Aquifer-Recharge Areas 67 Stormwater Retention 68 Conservation Design 69 Lake Michigan Service Region Approach 71 Stormwater Retention 71 Add New Lake Michigan Permittees within the Service Region 72 Proactive IDNR/OWR/LMMS Conservation Efforts 72 Groundwater-Dependent Subregion 73 Water Use Act of Stormwater Retention 74 Inland Rivers 75 Watershed Planning 75 Stormwater Retention 76 Innovations 76 Zero Water Footprint 76 Addressing Water Quality and Aquatic Ecosystem Needs 78 Water Quality Protection 78 Chlorides 79 Nutrients 80 Wetlands/Riparian Area Protection 81 Instream-Flow Protection 81 V
6 Table of Contents Chapter 4 Demand Management and Other Strategies 85 Planning Framework 85 Managing the Use of Water 88 Water-use Conservation 88 1) Conservation Coordinator 92 2) Water Surveys for Single-Family and Multifamily Residential Customers 94 3) Residential Plumbing Retrofit 96 4) Residential High Efficiency Toilet Program 98 5) High Efficiency Clothes Washer Program 99 6) System Water Audits, Leak Detection, and Repair 100 7) Metering with Commodity Rates for New Connections and Retrofit of Existing Connections 101 8) Water Waste Prohibition 102 9) Large Landscape Conservation Programs and Incentives ) Conservation Programs for Commercial, Industrial, and Institutional Accounts ) Wholesale Agency Assistance Programs ) Public Information ) School Education 111 Potential Water Savings for Conservation Measures 112 Energy and Water 116 Conservation Financing 117 Targeted Conservation 122 Evaluating Measures for Proper Planning of a Conservation Program 124 Water-rate Structures for Full-Cost Pricing 125 Graywater 131 Wastewater Reuse 134 Potential Users 135 Demand Estimation 135 Supply 137 Distribution 137 Regulation and Permitting 140 Implementation Scenarios 140 Chapter 5 Water Management in the 21 st Century 143 Cooperative Management 143 Drought Preparedness 147 Funding Regional Water Supply Planning and Plan Implementation 148 Monitoring/Data Collection 150 Next Planning Cycle 151 Sustainability 151 Integrated Water Resource Planning 151 Other Issues and Users to be Addressed 153 Appendices 157 Appendix A: Regional Water Supply Planning Group Membership 158 Appendix B: Complete List of Plan Recommendations 159 State Recommendations 159 CMAP Recommendations 162 County Recommendations 165 Public Water Supplier/ Municipality Recommendations 167 Private Well User Recommendations 170 Agriculture Community Recommendations 170 Wastewater Treatment Facilities and Sanitary Districts Recommendations 170 Wholesale Water Utility Recommendations 170 Appendix C: SARA Methodology 171 Appendix D: Summary of Water Savings Calculations 175 Appendix E: List Of Abbreviations and Acronyms 179 Appendix F: Index of Figures 181 Appendix G: Index of Tables 182 Appendix H: Dissenting Views 183 Acknowledgements 186 VI
7 VII

8 Afton Forest Preserve Wetlands, DeKalb, IL VIII Image courtesy of Terry Hannan
9 Executive Summary Introduction The prosperity of the greater Chicago region and its status as a global center depend on water availability. Historically blessed with ample fresh water, the region can no longer assume that water supplies are infinite. While other parts of the country struggle to meet growing water demand and some cities are losing their economic competitiveness due to shortage or inadequate planning, the Chicago region must act now to carefully plan and manage its surface and groundwater resources in a coordinated fashion. Nothing less than economic development, environmental protection, and social equity is at stake. It is for these reasons that the region s water supply plan is timely and important. The Northeastern Illinois Regional Water Supply/Demand Plan (referred to hereafter as the Water Plan) is the result of a threeyear planning effort undertaken by the Chicago Metropolitan Agency for Planning (CMAP) and the Regional Water Supply Planning Group (RWSPG) in response to Executive Order Issued in January 2006 by Governor Rod Blagojevich, EO called for development of Regional Water Supply Plans in two Priority Water Quantity Planning Areas. The 11-county northeastern Illinois region was identified as a priority planning area due to the degree of population growth occurring regionally. Prior to EO , the northeastern Illinois region did not have an active interest-group led and state endorsed or funded water supply planning process in place. CMAP formed the Northeastern Illinois RWSPG in 2006 as part of the scope-of-work contract with the Illinois Department of Natural Resources (IDNR). The RWSPG was advisory in nature and included 35 delegates representing nine different stakeholder-interest groups. CMAP and the RWSPG held near-monthly public meetings. The mission statement of the RWSPG is: To consider the future water supply needs of northeastern Illinois and develop plans and programs to guide future use that provide adequate and affordable water for all users, including support for economic development, agriculture, and the protection of our natural ecosystems. The RWSPG adopted the following goals in order to achieve their mission: 1. Ensure water demand and supply result in equitable availability through drought and non-drought conditions alike. 2. Protect the quality of ground- and surface-water supplies. 3. Provide sufficient water availability to sustain aquatic ecosystems and economic development. 4. Inform the people of northeastern Illinois about the importance of water-resource stewardship. 5. Manage withdrawals from water sources to protect long-term productive yields. 6. Foster intergovernmental communication for water conservation and planning. 7. Meet data collection needs so as to continue informed and effective water supply planning. 8. Improve integration of land use and water use planning and management. It is beyond the scope of this initial planning cycle to make recommendations aimed at changing the existing governance structure for water supply planning and management. Furthermore, IDNR indicated that the two pilot processes would not focus on capital projects. This plan makes recommendations that are designed to be implemented by a variety of stakeholders within the existing institutional structure of water supply planning and management. This regional water plan is designed to maintain or enhance regional prosperity to include economic development, environmental protection, and social equity. The plan depends entirely on voluntary action and cooperation among those entities identified by recommendations. In that vein, this regional water plan honors the spirit and intent of EO This Executive Summary provides a brief outline of the Water Plan and summarizes some of the major focus areas and recommendations of the plan: the methodology for determining regional water demands and supplies, the importance of integrating land-use and water supply planning, and demand management and other water-saving strategies. IX
10 Executive Summary How the Water Plan is Organized The Water Plan includes the following sections: Chapter 1 is an introduction that provides background about how the regional water planning effort began, the context in which it takes place, and the Northeastern Illinois RWSPG s purpose. Chapter 2, Framework for Regional Water Supply Planning and Management, describes in detail the existing paradigms for planning and managing water in the region today, including adaptive systems geared toward achieving sustainability. It summarizes the current types of water users and the laws governing water management. With an unprecedented level of detail that includes computer modeling of groundwater, the section also quantifies current consumption and demand scenarios for water use through To determine how much water will be needed in the future, this chapter looks at variable factors such as climate change, water rates, water quality, and ecosystem impacts. Chapter 3, Land and Water, describes the intricate relationship between land use and water resources, looking at how development decisions profoundly affect demand for and availability of water. It details the need to integrate planning of land and water use and explores a number of existing programs and tools toward that objective. The chapter also addresses the need to protect water quality and aquatic ecosystems. Chapter 4, Demand Management and Other Strategies, offers a detailed regional framework for water planning and management. It describes specific programmatic strategies, including creation of Conservation Coordinator positions at the regional and local levels. The chapter includes recommended water-use conservation measures for individuals and other entities, including plumbing retrofits, leak detection and repair, incentives to purchase high-efficiency toilets and appliances, and more. Using full-cost pricing and reusing wastewater are also among the suggested conservation strategies. Furthermore, a public information campaign and a school education program should accompany any implementation of water-use conservation measures or demand-management strategies. Finally, Chapter 5, Water Management in the 21st Century, looks at next steps that include methods for cooperative management across jurisdictions, drought preparedness, sustainable water-planning funding, and monitoring and data collection. This chapter looks forward to the next regional water-planning cycle, with an eye toward achieving true sustainability through integrated water-resource planning. Regional Water Demands Addressing water availability in northeastern Illinois involved forecasting regional population, modeling water demand, examining the impact of demand scenarios on water supplies, and identifying demand management and other strategies for addressing potential water shortages. Accordingly, a study of regional-water demand was completed in June The Regional Water Demand Scenarios for NE IL: : Project Completion Report (referred to hereafter as the Demand Report) feature three water-demand scenarios representing 1) water withdrawals under current demand conditions and reflecting recent trends in development (CT scenario), 2) a less-resourceintensive scenario (LRI), and 3) a more-resource-intensivescenario (MRI). The baseline (i.e., normal weather) 2005 water use for the region, including all five water-use sectors studied (Public Supply, Power Generation, Industrial and Commercial, Agricultural and Irrigation, and Domestic Self-supplied), is estimated as gallons per capita per day (gpcd), with total annual withdrawal of 1,480.3 millions of gallons per day (mgd), 69% of which is withdrawn from Lake Michigan, 17% from groundwater sources, and 14% from rivers. Absent a commitment to ongoing formal planning and implementation of the current and future regional water plans, maintaining the status quo in northeastern Illinois could result in an increase in water demand ranging from 36% under the CT scenario to 64% under the MRI scenario. Only with active intervention (i.e., LRI scenario) might the region keep overall water demand relatively flat (7.24% growth over 45 years) while population increases as much as 38% by The LRI scenario is different from the CT scenario across most factors that affect water demand. The Water Plan explores distribution of population growth (discussed in relation to land use planning), water conservation, and future water prices. Of particular note in the Demand Report s analysis are groundwater and inland surface water dependent communities, where demand will continue to grow considerably in the absence of an especially aggressive commitment to conservation. In an effort to link climate change to regional water supply planning, the Demand Report uses climate model output to examine water withdrawals under five different climate change scenarios. Under the worst-case scenario, a warmer and drier climate could require an additional 229 MGD or ~12% increase in demand across all water-use sectors excluding power generation above and beyond the increase in demand by 2050 associated with the CT scenario. Drought in Illinois has not historically been found to negatively impact public water supplies in northeastern Illinois primarily because the majority of the region relies on a relatively drought-resistance water source, Lake Michigan. The Demand Report considers drought conditions as those occurring during the drought of 2005, which was the X
11 11th driest on record in the state. During this time, demand was found to be 8% higher across all water-use sectors as compared to baseline demand. The RWSPG recommends (see Chapter 5 for more) that drought preparedness for northeastern Illinois be addressed by CMAP providing assistance in the preparation and implementation of regional drought plans. Regional Water Supplies Water supplies in the region are provided by Lake Michigan, inland surface water (Fox River and Kankakee River), and groundwater sources. The majority of the region s water use comes from Lake Michigan water allocations to about 200 communities, including the City of Chicago. Governed by a U.S. Supreme Court Consent Decree that limits Illinois withdrawal to 3,200 cubic feet/second or about 2.1 billion gallons/day, Lake Michigan water availability is adequate to the year 2030 with some additional potential 50 to 75 MGD to serve new communities that currently use groundwater. The permit system and allocation of Lake Michigan water is administered by the IDNR, with certain conservation measures required as a condition of permit. Groundwater within the deep-bedrock aquifer and shallow aquifer system beneath the Fox River Basin was assessed by the Illinois State Water Survey (ISWS). Their report, Opportunities and Challenges of Meeting Water Demand in Northeastern Illinois (referred to hereafter as the Groundwater Report) applies the regional water-demand scenarios to the groundwater resources described above to indicate likely impacts over time. The Groundwater Report finds drawdown interference commonplace throughout the deep-bedrock aquifer due to regional withdrawals exceeding the recharge rate. Drawdown is greater in the deep-bedrock aquifer than in the shallow aquifers in response to differing replacement water availability. Drawdown in the Ancell and Ironton-Galesville Units in southeastern Kane County and northern Will County suggest high potential for adverse impacts by 2050: decreasing well yields, increasing pumping expenses, increases in salinity, and increased concentrations of radium, barium and arsenic. The southwestern part of the region appears to be most at risk given that, for this particular area, the models predict these impacts across all demand scenarios including the LRI. The ISWS concludes, Model results suggest the deep bedrock aquifers cannot be counted on (indefinitely) to meet all future demand scenarios across the entire 11-county area. There is time in the short term to pursue alternative sources (e.g. Fox River or Lake Michigan water) and demand management. Shallow aquifer drawdown appears to be most significant in northeastern Kane County and southeastern McHenry County in response to pumping by Algonquin, Carpentersville, East Dundee, Lake in the Hills, and Crystal Lake. The next most vulnerable areas are located within a north-south corridor along the Fox River linking South Elgin, St. Charles, Geneva, and Batavia in Kane County, and Woodstock in McHenry County. The vicinity of Plano (Kendall County) and Marengo (McHenry County) also appear to be vulnerable by The most immediate and problematic consequences are likely to be greater drawdown interference, additional streamflow capture, and attendant degradation of local surface water quality. In the long term, it is conceivable that inadequate local water supplies will limit growth and development opportunities in some parts of the region without utilizing new sources of water. It will be prudent, therefore, for these communities to consider options that go beyond demand management. The ISWS has determined that the Fox River could provide as much as 50% of new water demands in Kane and Kendall counties, which is equivalent to an additional 40 to 45 MGD. The Kankakee River has not yet undergone a similar study, but is utilized less than the Fox despite a higher (low) flow. Integrating Land-Use and Water Supply Planning While demand-management strategies have potential to play a very important role in the region and are addressed later in this summary, plan recommendations also involve strategies addressing the manner in which the region accommodates future growth through land-use decisions and future investments. Land-use decisions affect water resources in three major areas: aquifer-recharge capacity, per capita water demand, and infrastructure investments. Aquifer-recharge capacity is affected by the location and extent of impervious surfaces: parking lots, sidewalks, rooftops, driveways and roads that block infiltration and recharge and result in increased stormwater runoff. Regarding per capita water demand, the 2009 report prepared by Southern Illinois University Carbondale, Residential Water Use in Northeastern Illinois, finds that higher per capita residential water use rates tend to be found in affluent communities with low housing densities and homes with residential landscapes. The same study finds that lower per capita rates tend to be found in communities with average or low income, higher water prices, and higher housing densities. Additional infrastructure costs may be incurred by water systems serving lower density housing areas located far from water system service centers. The recommended strategies addressing land-use decisions that foster more effective watersupply planning include: maximizing reinvestment growth within and contiguous to existing communities and service areas rather than the urban/rural fringe; optimizing community-appropriate densities to ensure cost efficiencies in water and wastewater infrastructure construction and maintenance; providing transportation options to encourage compact devel- XI
12 Executive Summary opment; promotion of conservation design principles and practices; and preservation of open lands for the many associated quality-of-life benefits, protection of sensitive aquifer-recharge areas, and for land application of wastewater effluent as well. Recommended strategies address water availability and quality by leveraging existing regional planning processes, institutions, and programs where possible to achieve greater integration of land-use planning and water-resource planning and management. A regional approach includes the utilization of: the Local Planning Technical Assistance Act, Water Revolving Funds, Developments of Regional Importance (DRI) Process, go to 2040 Plan, and Section 208 Planning as potential tools that could help to align future land- and water-use planning. In addition, the protection of Sensitive Aquifer Recharge Areas (SARA), Stormwater Retention using green infrastructure, and application of Conservation Design Principles are emphasized for the region. In recognition of the heterogeneity of the region, the plan provides recommendations at various levels organized by chief water source: Lake Michigan, Inland Rivers, and Wells/ Groundwater Sources. Of particular importance is the potential to reduce the 26% average debit against the Illinois diversion of Lake Michigan that is attributed to stormwater runoff from the 673 square mile diverted-watershed; the area where water now flows to the Mississippi River by way of the Chicago River. Reducing this component of the Illinois diversion could make additional water available for domestic pumpage; allowing for new Lake Michigan permittees and thus, reducing withdrawals from the deep-bedrock aquifer. Watershed planning is recommended for the entire region and is especially important for communities whose primary water source is an inland river. The RWSPG recommends that IDNR revise guidance to incent design applications that include water-resource features for Open Space Land Acquisition and Development (OSLAD) Program funds; and the Land and Water Conservation Funds (LWCF) program should add ranking criteria for areas identified in watershed plans or in the Green Infrastructure Vision as being critical for water quality protection (see Chapter 3 for more). On a regional scale, the RWSPG recommends that go to 2040 address the retention of open space. Additionally, CMAP will encourage communities to include the conservation of open space within their planning efforts. The RWSPG additionally recommends that counties participate in watershed planning efforts and actively support plan implementation; modify zoning and subdivision codes to include the conservation of open space and natural areas identified in watershed plans; and establish overlay zones where best management practices (BMP) are required for lands identified as critical to source-water quality protection when land conservation through acquisition or easements is not an available option. XII Water Quality and Quantity The Water Plan acknowledges the intertwined nature of water quality and quantity in the region. The quality of drinking water provided by public-water suppliers is regulated by the U.S. Environmental Protection Agency (U.S. EPA), most notably via the Safe Drinking Water Act (SDWA), which authorizes the U. S. EPA to set national health-based standards to protect against contaminants that may be found in drinking water. U.S. EPA also has a process for evaluating unregulated contaminants which are known or are anticipated to occur in public-water systems. The quality of raw source water, however, is the shared responsibility of regional stakeholders. Thus, several regional water quality issues are discussed in the Water Plan, including contaminants such as chloride; nutrients (i.e., nitrogen and phosphorous); and pharmaceuticals and personal care products. Related recommendations concern wetlands protection, and instream-flow. Two additional benefits streams, aquatic ecosystem health and economic development, are specifically of concern to the RWSPG. There are four primary strategies recommended by the Water Plan to ensure water availability to sustain aquatic ecosystems. The first addresses chloride contamination and recommends that those responsible for winter-highway maintenance and private-well owners adopt practices that collectively result in decreased chloride reaching groundwater and surface waters. Second, achieve better control of nonpoint-source pollution and nutrient removal from wastewater effluent and through best management practices aimed at agriculture practices, sanitary districts and municipal wastewater treatment plants, and municipal governments throughout the planning region. Third, develop and implement a study to monitor and improve understanding of the relationship between the hydrology of wetlands and groundwater levels as affected by local/regional pumping. Such information could also serve to inform the two State Surveys as they fulfill their review obligation of the proposed point of (new well) withdrawal s effect upon other users of the water as outlined in the Water Use Act of Fourth, the RWSPG recommends (see Chapter 3 for more) that Biologically Significant Streams (BSS) within the region receive the priority monitoring and study necessary to improve understanding of the relationship between natural streamflow, biological integrity, and shallow groundwater withdrawals. Study results can then be tested for applicability throughout the region where shallow groundwater pumping occurs to identify at-risk streams and develop strategies to avoid or minimize impacts.
13 Demand Management and Other Water-Saving Strategies To ensure water availability for economic development and regional prosperity, the primary strategy chosen by the RWSPG in this first planning cycle is water-demand management. Four broad water-use management techniques explored in the Water Plan include water-use conservation, water-rate structures, graywater, and wastewater reuse. Each management technique is outlined in the plan and followed with an integrated set of detailed recommendations aimed at the various levels of decision-making and/or implementation responsibility: state, regional planning agency, county government, and public water supplier. There are 13 locally appropriate conservation measures extensively addressed in the Water Plan, including conservation coordinator, high-efficiency toilets, water waste prohibition, metering, system water audits leak detection and repair, residential plumbing retrofits, programs for commercial and industrial accounts, high-efficiency clothes washers, large landscape programs, residential water surveys, wholesale agency assistance programs, public information, and school education. Potential region-wide water savings were calculated for nine of these measures, based on two-tiers of implementation, low conservation (10% adoption rate) and high conservation (50% adoption rate). The calculated water savings potential of both the low- and high-conservation programs is in addition to the contribution of passive conservation that is embedded within the CT scenario. The LRI scenario assumes that the region implements the lowconservation program at a minimum. Measured against the CT scenario, implementation of the low-conservation program translates into meeting 38% of increased demand expected through 2030, while implementation of the high-conservation program translates into meeting 133% of total demand expected at Water savings as measured against a MRI scenario will be lower: low conservation could meet 23% of demand through 2030, and high conservation, 78%. The suite of water conservation measures therefore has strong potential to make a considerable contribution to meeting incremental demand between 2005 and In effect, water savings from conservation has the potential to provide an important new supply of water, but only if the political will and other support factors exist to follow through with plan recommendations. Several conservation measures are notable when evaluating water savings on a regional scale. Following a low-conservation program, high efficiency toilets account for 19% of water savings, followed by water-waste prohibitions (16%), with the other seven measures together comprising the remaining 65% of water savings. Toilets are the largest indoor residential water user, accounting for nearly 30% of total indoor use. Complete toilet replacement is recommended in lieu of toilet retrofits because a new and more efficient toilet is a permanent solution with a greater guarantee of water savings. Water-waste prohibition consists of enforceable measures that are designed to prevent specific wasteful water-use activities including residential irrigation, nonrecirculation systems, and customer-leak repair. Most water-waste prohibition ordinances are enforced through a system of citations and fines. With wider participation in a conservation movement the high-conservation program toilet replacement with High Efficiency Toilets (HET) account for 28% of the water savings, followed by water-waste prohibitions (22%), with the other seven measures together comprising the remaining 50% of water savings. Regional water savings estimates of particular water conservation strategies do not necessarily translate into local effectiveness, but serve as a guideline to understand how conservation can impact water supply and demand in the region. More detailed water savings information will be captured at the local level through the implementation of these measures as part of a water conservation program. However, it is acknowledged that water conservation has associated costs as well as benefits. To this point, energy savings have also been calculated for two of the water-use conservation measures (clothes washers and showerheads) to estimate secondary resource benefits. Additionally conservation financing options such as partnerships, loan programs, and full-cost pricing are included to address water conservation costs. Ideally this information would serve to assist local entities and public water suppliers who will ultimately decide whether to pursue conservation in lieu of or in conjunction with other supply strategies. As a result of supplementary studies and additional research, including Residential Water Use in Northeastern Illinois and CMAP s Survey of Water Utilities (2008) and Household Water Use Survey (2008), the plan identifies four local factors that should be considered to target conservation efforts at the local level and produce the most notable impacts in demand reduction. The four local factors include: communities with a median-home value of $500,000 or greater, houses built before 1994, utilities with substantial water loss, and utilities with a peak demand that is 80% or higher than peak-system capacity. For each of the four local factors, complimentary water-use conservation measures were also identified from the plan. Assuming that a median-home value of $500,000 or greater equates to a larger lot size with a larger requirement for irrigation, programs that include landscaping with native vegetation, rain sensors, and water reuse for landscaping, among others are suggested. Plumbing retrofits, high-efficiency toilets and clothes washers will be more effective strategies in communities with larger portions of pre-1994 housing stock, as XIII
14 Executive Summary system water audits and leak detection and repair will be more effectively used in utilities experiencing substantial water loss. The Alliance for Water Efficiency recently developed a Conservation Tracking Tool that provides a means for public-water suppliers to analyze the benefits, costs, and water savings potential of numerous conservation measures. The benefits of implementing an overall water-conservation program will be greater for communities that are approaching or at peak capacity and who are potentially able to avoid capacity expansion and infrastructure-capital costs as a result of implementing a new demand-management program. Integral to use of the Conservation Tracking Tool and other resources is having a designated conservation coordinator who will be responsible for managing, implementing, and maintaining a comprehensive water-conservation program on behalf of their community. The RWSPG recommends that public-water suppliers in the northeastern region designate a staff person to serve as the conservation coordinator, with CMAP providing technical assistance, including a model-water-conservation ordinance (see Chapter 4 for more). In addition to the conservation coordinator, success of regional and local conservation measures will involve concurrent implementation of information and education programs. Public information programs can support technological approaches to water conservation, increase public acceptance of rate increases necessary to fund conservation programming and infrastructure investment, and can create greater awareness of the importance of conservation. The purpose of a public information program (PIP) is to increase the public s awareness regarding the value of water and to promote more efficient water use. For example, public-water suppliers can evaluate their billing structure and frequency to provide more detailed and timely water-use information to the customer. The purpose of a school-education program is to reach the youngest water users in order to increase awareness of the value of water so that lifelong water-conservation behavior is created. These programs will benefit from, if not require, regional coordination. Strategies recommended by the RWSPG for public information and education include state-level funding and coordination; regional development of appropriate materials; and local support of state and regional initiatives. Water Rate Structures, Graywater and Wastewater Reuse An effective public information and outreach campaign that imparts an understanding of the value of water can also garner support for full cost of water provision, thereby encouraging efficient use of water resources. Water pricing is increasingly becoming a tool for managing demand, with certain pricing options carrying more of an incentive for customers to use water efficiently. The Demand Report shows that attaining a regional LRI Scenario will require a 2.5% annual increase in real water prices. Price increases are generally more effective in encouraging conservation where the use of water is discretionary or seasonal, such as residential outdoor use. The RWSPG recommends that IDNR and its Office of Water Resouces (OWR) encourage permitees to assess the feasibility of adopting seasonal water pricing; and that CMAP provide information on full-cost pricing, assist public-water suppliers throughout the region that are interested implementing conservation-oriented rate structures, and develop and share information on pricing of new water connections and infrastructure investment to help inform planning processes. On a local level, water-rate structures should be considered as part of a comprehensive water-conservation program (see Chapter 4 for more). Another approach to water conservation that is becoming more popular elsewhere in the country is graywater. Graywater is water from laundry machines, bathtubs, showers, and bath sinks. The reuse of graywater for toilet flushing (primarily) and outdoor irrigation purposes (potentially) could conserve a large amount of potable water and energy. The RWSPG recommends that the State of Illinois establish regulations permitting graywater-reuse systems, provide general education materials to the public about graywater use, and create a graywater tax credit for homeowners who install a graywater-reuse system. CMAP can create a model ordinance for adoption by county/ local government to guide local implementation of graywaterreuse systems for which counties can specify performancebased standards, and provide general education materials to the public about graywater use. Reclaimed wastewater can also replace some use of potable water to free up potable water for other higher-value uses. CMAP undertook an assessment of wastewater reuse potential, concluding that currently existing centralized treatment plants and turf irrigation are the most likely opportunities for wastewater reuse in the region. The RWSPG recommends that Illinois Environmental Protection Agency (IEPA) develop comprehensive rules for reuse, and, as the state develops nutrient standards to protect surface-water quality, irrigation with reclaimed wastewater be encouraged. CMAP should provide technical assistance, encourage wastewater-reuse opportunities through the Section 208 or Areawide Water Quality Management Planning process, and explore setting wastewater-reuse goals for the region within the next planning cycle. Counties can provide XIV
15 additional incentives for reclaimed water system installation and consider reclaimed water for large landscape irrigation at public institutions. On a local level, public wastewater treatment facilities can consider wastewater reuse and/or land application as a potential alternative to upgrading treatment facilities to meet state antidegradation requirements and/or more stringent effluent-water-quality standards. Water Management in the 21st Century Throughout the planning process, the need to address the interrelated monitoring, data collection, and funding needs of the region necessary to continue effective planning became clear. The RWSPG recommends (see Chapter 5 for more) that the state fund the ISWS to conduct impact analysis of new withdrawals on groundwater supplies as required by the Water Use Act of 1983; that ISWS provide updated well-withdrawal data and impacts to counties and to CMAP annually to facilitate comprehensive water supply planning efforts. In addition, the RWSPG recommends study of the relationship between shallow groundwater pumping and groundwater contributions to the baseflow of headwater streams. Additional recommendations include expansion of the shallowaquifer study beyond the Fox River Basin; establish a shallow aquifer well network throughout the 11-county region, similar to the McHenry County network to aid in water management; establish a water quality and quantity monitoring network for the deep-bedrock aquifer; explore a means of collecting data on water used for irrigation and self-supplied water; explore new-model simulations that could include optimization of shallow aquifer withdrawal scenarios in combination with new Fox River withdrawals; optimization of deep-aquifer withdrawals; Kankakee River withdrawal simulations; and validation of current and future model output. Intergovernmental agreements should be considered among counties and municipalities that establish water withdrawal standards in accordance with projected growth, e.g., communities commit to specific withdrawal limits based on their future populations and with knowledge from ISWS on groundwater supplies for the purpose of water resources management as provided for in 50 Illinois Compiled Statutes (ILCS) 805/4, Local Land Resource Management Plans. Lastly and per a Demand Report recommendation, CMAP should collect a variety of data from public-water suppliers to add value to those data reported to the Illinois Water Inventory Program (IWIP) maintained by ISWS and enhance regional understanding of water use. Such data should be publicly available, but collection will nonetheless require the cooperation of water suppliers. More fundamentally, the RWSPG recommends that, either through new legislation or amended legislation, the Governor and General Assembly should make an annual appropriation to a state/regional water supply planning program directed by IDNR. In addition, CMAP should study and develop cost estimates for the regional planning agency, in coordination with a regional deliberative body, to ensure an ongoing regional planning effort and implement the regional agency s portion of water plan recommendations; and study and develop, in concert with others, the cost of implementing other plan recommendations. In this regard, this plan recommends that a continuous process of regional water supply/demand planning should be implemented and regional water supply plans should be updated on a five-year cycle. Conclusion This initial phase of planning does not address all possible issues, some of which can be explored in planning cycles that follow. Regional water planning will likely need time to mature in order to discover the utility, if not the imperative, of sustainability and other planning models and a more comprehensive or holistic approach to managing various aspects of the hydrologic cycle. While there is great interest in implementing this regional plan, there is also the recognition of the iterative nature of water-resource planning. Thus, the next five-year planning cycle, commencing in February 2010, will aim to address the ongoing need for refinement in the many areas under current consideration. In the meantime, it behooves all parties to maintain an ongoing planning effort to include at a minimum, a forum of discussion for the evolving water planning and management landscape. What remains to be seen is which parties choose to participate productively in that discussion and thus, shape the future that will undoubtedly feature new water-use circumstances and challenges to be resolved. In the interim, the Water Plan presents an opportunity for those decision makers in the region who wish to lead. XV

16 XVI Image courtesy of Terry Hannan
17 Chapter 1 Introduction This document fulfills Executive Order (EO) issued by the Governor of Illinois in January EO calls for a comprehensive program for state and regional water supply planning and management, a strategic plan for the program s implementation, and development of Regional Water Supply Plans in two Priority Water Quantity Planning Areas. The 11 counties of northeastern Illinois represent one of those two priority planning areas, and the plan that follows captures the work performed during the last four years. The reader is also advised to review two documents that served to inform the planning process: 1) Regional Water Demand Scenarios for Northeastern Illinois: , and 2) Regional Groundwater Modeling for Water Supply Planning in Northeast Illinois. These two reports contribute significantly to this document and contain valuable water-related information. Full reference information for these documents is provided in footnotes below. The report is divided into five chapters plus appendices. Chapter 1 provides the reader with information necessary for understanding past events that lead to today s planning activities. Background information is also provided on the regional planning body and process that led to development of this plan. Chapter 2 explores the institutional framework for planning/management and a host of issues that collectively provide context for plan recommendations. Those recommendations follow in Chapters 3 and 4. Where the former explores the relatedness between land-use decisions and water resources, the latter offers demand management and other strategies for managing water demand and augmenting supplies. Chapter 5 provides ideas related to alternate or additional institutional mechanisms for water management moving forward. The chapter also includes discussion of drought preparedness, funding, monitoring and data collection, and closes with a look towards some of the issues to be addressed during the next planning cycle. 1
18 Chapter 1 Introduction Background State Planning Water supply planning in the state of Illinois has a long history, to which the Illinois State Water Survey (ISWS) has contributed greatly since its founding in Planning activity has often been initiated by a governor s directive or executive order. Governor Otto Kerner, Jr., for example, launched such an effort in 1965 and the resultant 1967 plan, Water for Illinois A Plan of Action, offered among its recommendations a regional approach and structure for water resources management. 2 In 1980, Governor James R. Thompson appointed a task force to produce a new state water plan. The Illinois State Water Plan Task Force formed five regional advisory councils, addressed problems of statewide importance, and has provided a coordination role among state agencies ever since. 3 Both the Illinois State Water Plan Task Force and the Illinois Drought Response Task Force, a group of state agency representatives that are convened by the Governor as needed, are managed through the Illinois Department of Natural Resources (IDNR), Office of Water Resources (OWR), Division of Program Management. 4 With the dawn of the 21st century, Governor George H. Ryan established a Governor s Water Resources Advisory Council (WRAC) in 2000 to study water resource usage, including water usage by peaker-power plants. (The WRAC was somewhat short lived as it was subsequently abolished by Governor Blagojevich in his plans to reduce state spending and close an estimated $5 million budget shortfall for fiscal years 2003 and 2004.) Governor Ryan followed with EO that invoked the Illinois Groundwater Protection Act, 415 ILCS 55/4, and the Interagency Coordinating Committee on Groundwater (ICCG) to designate a subcommittee to develop an integrated groundwater and surface water resources agenda and assessment report. The Subcommittee on Integrated Water Planning and Management issued their report in December Their report featured the 12 consensus principles developed by the WRAC, which are as follows: 1. Better science and more funding for science is needed. 2. A system for identifying water resource problem areas is needed. 3. Water resource problem areas should not be too large; could be based on ground or surface water sources or both; should be based on supply and demand; a drop below sustainable yield should be a criteria; pollution could be a criteria. 4. Need to see details of how such areas will be identified both short-term, based on existing information, and longterm, as better data become available. 5. Emphasize regional water management authorities boundary should have some relationship to scale of the water resource (watershed and/or aquifer boundary). 6. State s role: for later resolution; should support, provide science, establish or appoint regional authorities. 7. Is there a role for water authorities established under the Water Authorities Act? 8. Phased approach to implementation would be received better by a broader group of interests. 9. Immediately begin pilot programs in willing areas; pilot programs should be site-based, located in problem areas. 10. Sunsets should be established for #8 and #9. 1 Derek Winstanley, Nani G. Bhowmik, Stanley A. Changdon, and Mark E. Peden History of the Illinois State Water Survey, pp in J.R. Rogers and A.J. Fredrich (ed.), Proceedings and Invited Papers for the ASCE 150th Anniversary ( ), November 3-7, 2002, Washington, D.C., ASCE, Reston, VA. 2 Developed by the Illinois Technical Advisory Committee on Water Resources, Springfield, IL, 1967, as cited in Water Quantity Issues Facing Illinois; a paper presented by Derek Winstanley to the 2002 Illinois Environmental Conference of the Illinois State Bar Association, Chicago, August 16, Executive Order for the Interagency Coordinating Committee on Groundwater to Establish a Water Quantity Planning Program. Executive Order Number 5 (2002). Executive Department, State of Illinois, Springfield. April 22, Report to the Interagency Coordinating Committee on Groundwater from the Subcommittee on Integrated Water Planning and Management With Recommendations Pursuant to Executive Order Number 5, December 20, Derek Winstanley, A brief history of water-supply planning in Illinois (draft). Unpublished manuscript. 4 Illinois Department of Natural Resources. Office of Water Resources Division of Program Development. See 2
19 11. There should be an ongoing role for the Water Resources Advisory Committee in developing the details associated with establishing regional water management authorities. 12. Both groundwater and surface water should be considered. Together with the Groundwater Advisory Council, the ICCG was directed to use the subcommittee s six-point agenda 7 and report, including the principles enumerated above, to establish a water-quantity planning procedure for the State. It is against this historical backdrop that Governor Rod Blagojevich issued EO Regional Planning Planning for the regional water supplies of northeastern Illinois dates back to 1966 when the Northeastern Illinois Planning Commission (NIPC) published Technical Report No. 4: The Water Resource in Northeastern Illinois: Planning its Use. 8 That report was updated in 1974 with Technical Report No. 8: Regional Water Supply Report. Report No. 8 features several principle findings and strategy statements that continue to resonate today. More recently, representatives from four planning agencies in Illinois, Indiana, and Wisconsin signed the Wingspread Multi- State Regional Accord in The Wingspread Accord was an agreement between NIPC, Southeastern Wisconsin Regional Planning Commission, Northwestern Indiana Regional Planning Commission, and the Chicago Area Transportation Study to cooperate and coordinate more closely on matters concerning regional interdependence. In addition to promoting integrated regional planning and economic development in an expanded spatial context, the Accord spawned the Southern Lake Michigan Regional Water Supply Consortium (SLMRWSC). The mission of the SLMRWSC is to advance a more comprehensive regional approach to sustainable water supply planning and management. Consortium activity has tapered off considerably since the Straddling the Divide conference held in February 2005, but has the potential to revive itself through the Wingspread Accord at any time. In 2002, NIPC adopted the Strategic Plan for Water Resource Management (referred to hereafter as the Strategic Plan). This plan presented the work of over 100 experts from the region who served on an advisory committee and three task forces: stormwater and flooding; water quality; and water supply. Several of the recommended water-supply strategies featured in the Strategic Plan have either been partially implemented or remain viable today. The Kane County Water Supply Study has also played an important role in the current regional planning initiative, though at the subregional-scale. 9 Spurred by concern that rapid population growth could strain local water supplies, particularly groundwater, the countywide effort involved the ISWS and State Geological Survey in a study of shallow groundwater, deep groundwater, and the Fox River. Beginning in 2002, the multiple-year study led to new knowledge of the hydrogeology of Kane County, making it one of the best understood in the nation currently. Of consequence to the region, the Kane County study provides a science-based and data-rich foundation for a much improved understanding of the deep-bedrock aquifer (i.e., Ancell Unit, Ironton-Galesville Unit, and Mt. Simon Unit) that lies beneath the entire 11-county planning region. Additionally, the study provided an enhanced understanding of the shallow aquifer 7 Ibid. The six-point agenda states: 1) By March 1, 2003 formally establish an interim water quantity planning and management process and develop a draft strategic plan for water quantity planning and management statewide. 2) By April 1, 2003 provide agency and public review of the draft strategic plan for water quantity planning and management, modify as necessary, develop an implementation plan, seek necessary funding, and begin implementation on July 1, ) Strengthen the scientific basis for planning and management by funding needed scientific studies that answer the following questions: (see report). 4) Develop a package of financial and technical support for and encourage the formation of regional water management corsortia in Priority Water Quantity Planning areas which can be identified using existing information. 5) Compile available information and make it useful and easily accessible. 6) Implement a phased approach in establishing a sound scientific basis and an administrative framework for water quantity management. 8 Northeastern Illinois Metropolitan Area Planning Commission s The Water Resource in Northeastern Illinois: Planning its Use. Technical Report No. 4. Prepared by John R. Sheaffer, Project Director and Arthur J. Zeizel, Asst. Project Director. June, Strategy for Developing a Sustainable Water Supply Plan for Kane County See Developing_a_Sustainable_Water_Supply_Plan_for_Kane_County.pdf. 3
20 Chapter 1 Introduction system (i.e., Quaternary Unit and Shallow-Bedrock Aquifer) beneath the Fox River, and new knowledge of Fox River water accounting (i.e., effects of discharges and withdrawals on the spatial and temporal characteristics of flow). Thus, the State Surveys were prepared by this study (and previous work) to address the broader regional impacts of ongoing and/or increased groundwater withdrawals. A new understanding of the impacts of increased Fox River water withdrawals and discharges on low flow was also achieved. Other actors in the region have also been vocal about the need for a more substantive program for addressing regional water needs. 10 Most recently, in the midst of a drought that started in 2005, Governor Rod Blagojevich issued EO enumerating the following actions to be executed: Consistent with the authority granted to the Department of Natural Resources under the Rivers, Lakes, and Streams Act, 615 ILCS 5/5 et seq. and the Level of Lake Michigan Act, 615 ILCS 50/1 et seq., the authority of the Department of Natural Resources Office of Water Resources under 20 ILCS 801/5-5, the Office of Water Resources, in coordination with the State Water Survey, shall: 1. Define a comprehensive program for state and regional water supply planning and management and develop a strategic plan for its implementation consistent with existing laws, regulations and property rights; 4. Develop a package of financial and technical support for, and encouragement of, locally based regional water supply planning committees. These committees, whether existing or new entities, shall be organized for participation in the development and approval of regional plans in the Priority Water Quantity Planning Areas; 5. By December 31, 2006, ensure that Regional Water Quantity Plans are in process for at least two Priority Water Quantity Planning Areas. One such Priority Water Quantity Planning Area is the 11-county northeastern Illinois region (Figure 1). During the summer of 2006, the IDNR OWR, approached the Chicago Metropolitan Agency for Planning (CMAP) with a request to lead the new planning effort in northeastern Illinois. CMAP agreed and followed with a scope-of-work document that was ultimately incorporated into a three-year contract. 12 The scope-of-work included an agreement to 1) create and facilitate the work of a new planning body and to develop a regional water supply plan, 2) study regional water demand, 3) conduct outreach and education, and 4) provide project management and act as fiscal agent. 2. Provide for public review of the draft strategic plan for a water supply planning and management program; 3. Establish a scientific basis and an administrative framework for implementing state and regional water supply planning and management; 10 Troubled Waters: Meeting Future Water Needs in Illinois. Campaign for Sensible Growth, Metropolitan Planning Council, and Openlands Project. Undated. 12 See 80fa7b_8_18_3314_ : Executive Order for the Development of State and Regional Water-Supply Plans. Issued by Governor Rod R. Blagojevich: January 9,
21 Northeastern Illinois Regional Water Supply Planning Group CMAP s commitment to orchestrate the regional planning process included the creation of a new planning entity that was to be both diverse and representative of key stakeholder groups in the region. In addition to input from planners throughout the region and best professional judgment, the State of Texas model for stakeholder representation was also considered during development of the structure and composition of a regional planning body. 13 In November 2006, an Open Forum was held in Oak Brook, Illinois to publicly launch the regional planning initiative. The afternoon session organized people into seven interest groups that were identified for representation on the regional planning body. Each group was facilitated to discuss and reveal those issues that were most important to them. This information served as a useful starting point for matters that the emerging planning process could be sensitive to and address as appropriate. The following month, seven nonelected-official groups were reconvened at the offices of CMAP for purposes of selecting delegates to represent their constituencies. For county government delegates, county board chairs received a letter from CMAP asking that either they appoint themselves or another board member to represent the interests of county government on the emerging planning body. 14 Delegates to represent municipal government/municipal water suppliers were appointed by the appropriate Council of Government (COG). Upon completion of this process, the Northeastern Illinois Regional Water Supply Planning Group (RWSPG) was formed to be the representative body for deliberation of issues, ideas, and plan recommendations. Thus, CMAP and regional partners met a requirement of EO that a plan would be in process by the end of The RWSPG is designed to be composed of thirty-five delegates. Delegates represent the following stakeholder-interest groups: 1. Academia and public interest in regional planning (2) 2. Agriculture (2) 3. Business, industry, and power (2) 4. Conservation and resource management (2) 5. County government (11) 6. Environmental advocacy (2) 7. Municipal government and municipal water suppliers (10) 8. Real estate and development (2) 9. Wastewater treatment and nonmunicipal water suppliers (2) Most stakeholder groups attracted a large and diverse list of participants and it was the job of delegates to communicate regularly with their constituency. Meetings were open to the general public and typically included a sizable and diverse audience. The RWSPG developed Operational Guidelines 15 and has generally met each month beginning in January 2007 and continuing through January 2010 while taking a summer break during the month of August. The RWSPG goes about its business using a modified-consensus decision making process. Group membership and attendance can be found in Appendix A. The RWSPG is advisory in nature, but provides an important forum for discussion and an experimental structure for regional-scale decision making. 13 See Texas Water Code Section Regional Water Plans. 14 The seat for Cook County Government remained open as a representative was never appointed. 15 Operational Guidelines: Regional Water Supply Planning Group of Northeastern Illinois. May 23, See 5

22 Chapter 1 Introduction Figure 1: Source of public water supply by municipality in 11-county planning region 6
23 Purpose EO acknowledges increasing demands on Illinois water resources along with impacts of drought as potential sources of conflict among water users and thus, justification for the order to pursue new state and regional water supply planning and management. Any future increase in demand for water within the state can largely be attributed to population growth, the majority of which is taking place in northeastern Illinois. Population growth in northeastern Illinois has historically been robust. Figure 2 illustrates both the history of population growth and projections to 2050 in the northeastern Illinois water planning region. The graphic indicates that for the 11-county region, population grew 58% during the last half of the 20th century to 8,418,387 persons in Furthermore, population growth had been projected by NIPC and others to grow 26% from 2000 to 2030 to 10,635,428 persons. 16 Extrapolation of that 30-year population projection to 2050 leads to a possible 36-64% growth in water demand 17 to serve as many as 12,113,169 thirsty people at mid-century. Given the known constraints on water sources in the region, population growth projections suggest that it would be inappropriate to assume that water will always remain relatively abundant as it has in the past. EO expresses an intention, therefore, to avoid adverse impacts to the health of the State s citizens, environment, and economy, and to assess water supplies through a sound planning process to ensure responsible, economically viable, and secure water supply development. The purpose of the regional planning effort is captured in the adopted mission statement of the RWSPG: To consider the future water supply needs of northeastern Illinois and develop plans and programs to guide future use that provide adequate and affordable water for all users, including support for economic development, agriculture, and the protection of our natural ecosystems. In support of the purpose of this plan, the RWSPG adopted the following goals : 1. Ensure water demand and supply result in equitable availability through drought and non-drought conditions alike. 2. Protect the quality of ground- and surface water supplies. 3. Provide sufficient water availability to sustain aquatic ecosystems and economic development. 4. Inform the people of northeastern Illinois about the importance of water-resource stewardship. 5. Manage withdrawals from water sources to protect longterm productive yields. 6. Foster intergovernmental communication for water conservation and planning. 7. Meet data collection needs so as to continue informed and effective water supply planning. 8. Improve integration of land use and water use planning and management. 16 NIPC projected population for their 6-county planning region following a robust and accepted methodology that includes endorsement from the counties and municipalities involved. To these data were added growth projections for the other 5 counties as developed by the State of Illinois. 17 B. Dziegielewski and F.J. Chowdhury Regional Water Demand Scenarios for Northeastern Illinois: Project Completion Report. Southern Illinois University Carbondale. See 19 S.C. Meyer, H.A. Wehrmann, H.V. Knapp, Y-F Lin, F.E. Glatfelter, D. Winstanley, J.R. Angel, J.F. Thomason, and D.A. Injerd Opportunities and Challenges of Meeting Water Demand in Northeastern Illinois. Prepared for the Northeastern Illinois Regional Water Supply Planning Group by the Illinois State Water Survey and Illinois State Geological Survey (Institute of Natural Resource Sustainability, University of Illinois, Urbana-Champaign) and the Illinois Department of Natural Resources, Office of Water Resources. See 7
24 Chapter 1 Introduction The plan that follows is for a region that has historically been considered water-rich and where issues of scarcity have been rare to nonexistent. Today, new allocations of Lake Michigan water have been established to meet the needs of three-quarters of the regional population to Elsewhere in the region, however, groundwater withdrawals are raising new concerns. For example, the deep-bedrock aquifer is being mined (i.e., withdrawal rates exceed natural recharge rates), shallow-well withdrawals are known to be reducing natural groundwater discharge to streamflows throughout sections of the Fox River Basin, and changes to deep-bedrock water quality (i.e., elevated concentrations of arsenic, barium, radium, and salinity) are possible before Thus, the region must carefully examine the impacts of water use, recognize the uneven demand/supply circumstances where they exist, and take steps to resolve or avoid potential water supply and water demand imbalances. Lastly, IDNR made clear to CMAP and the Mahomet Aquifer Consortium (the lead and fiscal agent for the other pilot planning process) that the two pilot processes should not focus on capital projects. This plan acknowledges potential imbalances and includes recommendations to help in resolving or avoiding them. The plan is the outcome of a three-year planning effort and is fundamentally about maintaining or enhancing economic development, environmental protection, and social equity. The plan brings new focus on the relationship between regional prosperity and dependence on water. Figure 2: Population growth and projections in the Distribution 11-county northeastern of Population Illinois Northeastern water planning Illinois region Total population, in thousands Cook County Collar counties* Other counties in planning area (5)** 12,113,169 12,000 11,000 10,000 9,000 8,000 7,000 6,000 5,000 4,000 3,000 2,000 6,336,829 5,019,841 1, , Year Sources: U.S. Census Bureau; Northeastern Illinois Planning Commission; al Chalabi Group, Ltd.,Chicago Metropolitan Agency for Planning * DuPage, Kane, Lake, McHenry, Will ** Boone, DeKalb, Grundy, Kankakee, Kendall A complete list of recommendations made in this plan can be found in Appendix B. 8
25 9

26 Large immature blue egret in pond located in the Schiller Woods Forest Preserve Image 10 courtesy of W. Eugene Slowik
27 Chapter 2 Framework for Regional Water Supply Planning and Management This chapter provides a detailed perspective on water planning and management matters in northeastern Illinois. It begins with discussion of two relatively new paradigms for water planning: adaptive management and sustainability. The chapter then explores the institutional structure and laws that govern water use in the region. In addition to discussing water rates, a factor known to affect water demand, this chapter draws on two studies that were undertaken to support the regional water supply planning process: a regional water demand study that looked out to the planning horizon of 2050, and a regional groundwater study that includes analysis of demand-scenario impacts on known groundwater resources. A discussion of water quality and aquatic ecosystems follows at the end of this chapter. 11
28 Chapter 2 Framework for Regional Water Supply Planning and Management Planning Paradigms Adaptive Management Adaptive Management, a natural resource management approach that formulates and implements policies as experiments, may offer some utility to the regional water supply planning and management effort. An adaptive policy is one that is initially designed to test clearly stated hypotheses about the behavior of an ecosystem undergoing change by human use. 1 If a policy is found to be successful, hypotheses are affirmed; if policies fail, adaptive management aims to learn something new from the process and make adjustments that are influenced by the new information. Adaptive management, though intuitively attractive, is by no means a panacea for guidance. The adaptive approach depends on a judgment that a scientific process for asking questions will produce reliable answers most rapidly and at lowest cost, but this may not always occur as envisioned. 2 The application of adaptive management to the Columbia River is a case in point. Adaptive management was applied to reconcile an ecological crisis decline of Columbia River salmon with hydroelectric power generation and a legislative response: creation of the Northwest Power Planning Council. Other contributing factors included the need to bring together numerous stakeholder groups to form a regional plan and scientific uncertainties that made program development very difficult. According to Dzurik use of adaptive management in the Columbia River basin has been met with mixed results. 3 On one hand, regulators became accustomed to treating management as a learning process and formation of a regional vision has been improved. Alternately, the scientific questions posed in 1984 remain largely unanswered. As long as questions remain unanswered, stakeholders are free to adopt political positions. Thus, adaptive management does not allow planners and managers to be immune from unscientific pressures. 4 Kai Lee, Program Officer of Science, Conservation and Science Program, Packard Foundation, who has studied the application of adaptive management to the Columbia River during and after his tenure as board member of the Northwest Power Planning Council, concludes the following: 1) Adaptive management has been more influential, so far, as an idea than as a practical means of gaining insight into the behavior of ecosystems utilized and inhabited by humans. 2) Adaptive management should be used only after disputing parties have agreed to an agenda of questions to be answered using the adaptive approach; this is not how the approach has been used. 3) Efficient, effective social learning, of the kind facilitated by adaptive management, is likely to be of strategic importance in governing ecosystems as humanity searches for a sustainable economy. 5 As for both the regional and statewide planning initiatives, the involvement of the State Surveys, planners, and local decisionmakers, provides for the right cast of participants to develop science-driven and policy-relevant questions. Answers could emerge from an adaptive management approach to water supply stewardship once an agenda of questions to be answered is agreed upon. 1 Kai N. Lee Compass and Gyroscope: Integrating Science and Politics for the Environment. Washington, D.C.: Island Press. Dr. Lee thinks of science and democracy as compass and gyroscope navigational aids in the quest for sustainability. Page 6. 2 Kai N. Lee Appraising adaptive management. Conservation Ecology 3(2): 3. See 3 Andrew A. Dzurik Water Resources Planning: Third Edition. Lanham, MD: Rowman and Littlefield Publishers, Inc. 4 Ibid. 5 Ibid
29 Sustainability It is instructive to review why sustainability is emerging as a new management paradigm. Put another way, what has changed and led to the now commonly found consideration and pursuit of sustainability? Current patterns of growth and development are leading to biophysical impossibilities. 6 Examples of such impossibilities can now be found among the four spheres of the earth system atmosphere, hydrosphere, lithosphere, and biosphere and confront a global population that is unprecedented in size and growing. Similarly, three factors are affecting the availability of freshwater resources: population growth, economic growth and associated increases in water demand, and climate change. 7 The World Commission on Environment and Development (WCED), also known as the Brundtland Commission, defined sustainable development as, meeting the needs of the present without compromising the ability of future generations to meet their own needs. 8 While perhaps intuitively attractive, this definition is also problematic. For example, who is here now to speak on behalf of those yet unborn, to negotiate their needs, and protect their interests in any meaningful way with today s consumers? Furthermore, it is rarely pointed out that the WCED supported their definition by emphasizing the need for change: change in attitudes, social values and aspirations, and further defined sustainability as a process of change in which resource exploitation, the direction of technology development and investment, and institutional change are made consistent with future and present needs. Another more practical definition follows: Sustainable development is development without growth in throughput of matter and energy beyond regenerative and absorptive capacities. 9 Thus, these definitions suggest that maintaining the status quo and committing to the process or path of sustainable development are mutually exclusive pursuits. Returning to water, about one-third (30%) of states as of 2005 have considered sustainability in state water plans or planning activities, and it is predicted that setting the goal of achieving sustainable water resource systems will only become more widely incorporated in water planning processes such as the one that has culminated in this plan for northeastern Illinois. 10 How does a state or a region operationalize sustainability with respect to water supply/demand management? Other definitions will be useful to consider as the region attempts to answer this question. In Water Resources Sustainability, water resources sustainability is defined as follows: Water resources sustainability is the ability to use water in sufficient quantities and quality from the local to the global scale to meet the needs of humans and ecosystems for the present and the future to sustain life, and to protect humans from the damages brought about by natural and human-caused disasters that affect sustaining life Robert Goodland, The concept of environmental sustainability. Annual Review of Ecology and Systematics 26: Dan McCarthy, Water sustainability: A looming global challenge. Journal American Water Works Association 100(9): World Commission on Environment and Development Our Common Future. Oxford, UK: Oxford University Press Robert Goodland and Herman Daly, Environmental sustainability: Universal and non-negotiable. Ecological Applications 6(4): W. Viessman, Jr. and T.D. Feather (editors), State Water Resources Planning in the United States. American Society of Civil Engineers Larry W. Mays Water Resources Sustainability. New York, NY: McGraw-Hill. 330 p. 13
30 Chapter 2 Framework for Regional Water Supply Planning and Management Closer to home, the Southeastern Wisconsin Regional Planning Commission (SEWRPC) defines sustainability with respect to water supply system planning as: the condition of beneficially using water resources in such a way that the uses support current and probable future needs while simultaneously insuring that the resources are not unacceptably damaged. SEWRPC defines unacceptable damage as a change in an important physical property of the ground or surface water system, such as water level, water quality, water temperature, recharge rate, or discharge rate, that approaches a significant percentage (>10%) of the normal range of variability in that property. Of interest is SEWRPC s application of this definition to the deep bedrock aquifer, a source of water that is shared with northeastern Illinois: The foregoing collection of definitions raises issues of intragenerational and intergenerational equity, the appropriate spatial scale for which sustainability is pursued, and concern for maintaining/measuring system integrity. Sustainability will also require triple-bottom-line solutions that meet social, economic, and environmental goals. Additionally, moving along the path of sustainability will very likely require change within the institutions that affect water resource planning and management. Water supply planning activity here in northeastern Illinois, therefore, will likely need time to evolve as stakeholders sort out the issues that are inherent to achieving water resources sustainability. In the meantime, the plan presented here provides for a credible attempt to minimize waste, improve efficiency, and raise awareness. We submit that such measures are part of an approach to achieving sustainable water resource systems. Sustainability means that the potentiometric surface in that aquifer is maintained at current levels or raised based upon use and recharge conditions in southeastern Wisconsin. 12 Mining or dewatering of the deep bedrock aquifer in northeastern Illinois does not appear to support SEWRPC s definition of sustainability for the same shared interstate resource. Another definition offered by water resource experts suggests that sustainable water resource systems are: Water resource systems designed and managed to fully contribute to the objectives of society, now and in the future, while maintaining their ecological, environmental, and hydrological integrity Letter from Philip C. Evenson, Executive Director, SEWRPC, to Derek Winstanley, Chief, Illinois State Water Survey dated March 13, Daniel P. Loucks, Eugene Z. Stakhiv, and Lynn R. Martin. Editorial in the Journal of Water Resources Planning and Management, March/April
31 Planning and Management in the Region Today Prior to EO , the northeastern Illinois region did not have an active interest-group led and state endorsed/funded planning process in place. Given the lack of regional-scale water planning then, it will be instructive to review the legal scheme for water-use management that applies in the region/state. What follows below is not meant to be an exhaustive treatment of the topic. Rather an attempt has been made to distill the essence from each law or program as it might relate to the regional water planning effort. The reader is encouraged to seek out more detailed studies of law elsewhere as it relates to issues of Illinois water quantity. 14 Lake Michigan Service Region The Illinois diversion of Lake Michigan water is governed by a U.S. Supreme Court Consent Decree. 15 The Illinois diversion is limited to 3,200 cubic feet/second (cfs) as measured over a fortyyear accounting period. This amount is roughly equivalent to 2.1 billion gallons of water per day. 16 Half or more of this amount is typically used for public drinking water supplies where Lake Michigan is the source of water for approximately 77% of the planning region s population. The balance of the diversion is allocated to stormwater runoff, lockage, leakage, navigationmakeup water, and discretionary diversion to maintain the Chicago Sanitary and Ship Canal in a reasonably satisfactory condition. This latter component is managed by the Metropolitan Water Reclamation District of Greater Chicago (MWRDGC) at a current allocation of 270 cfs until Water Year 2015 at which time it will be reduced to 101 cfs thereafter. 17 Figure 3 illustrates the relative breakdown of the Illinois diversion for water year Figure 4 illustrates the history of the cumulative diversion and estimates of recent years for the first 28 years (1981 to 2008) of the 40-year accounting period. Passed in response to the 1967 U.S. Supreme Court Consent Decree, the Level of Lake Michigan Act, 615 Illinois Compiled Statutes (ILCS) 50/1 et seq., is the Illinois law that governs Lake Michigan water use for those communities with an allocation for lake water (i.e., Lake Michigan service region). The rules for implementing the law define a use-permit system that is unique to the state. 18 The permit system and allocation of Lake Michigan water is administered by the Illinois Department of Natural Resources (IDNR), Office of Water Resources (OWR), Lake Michigan Management Section. Domestic use of lake water, defined as public water supply and water supplied to commercial and industrial establishments, has priority over other uses (i.e., diversions into the Chicago Sanitary and Ship Canal.) To the extent practicable, the Act has the goal 14 Illinois Water-Related Acts: Identified and Classified, Final Report. November Robert E. Beck, Prof. of Law, Southern Illinois University, School of Law; Assessment of Illinois Water Quantity Law: Final Report. July Robert E. Beck, Keith W. Harrington, William P. Hardy, and Timothy D. Feather of Planning and Management Consultants, Ltd. Carbondale, Illinois. 15 Wisconsin v. Illinois, 388 U.S. 426 (1967); 449 U.S. 48 (1980). 16 See 17 Lake Michigan Water Availability: White Paper for the Northeastern Illinois Regional Water Supply Planning Group. Dan Injerd, IDNR, Office of Water Resources, Lake Michigan Management Section. January ILAC Ch. I, Subch. h, Sec
32 Chapter 2 Framework for Regional Water Supply Planning and Management Figure 3: Illinois use of Lake Michigan diversion for water year 2005 Leakage 0.9 % Discretionary 9.2 % Runoff 27.7 % Domestic 59.8 % Nav. Make Up 0.8 % Lockage 1.6 % Source: D. Injerd, 2009, Lake Michigan Water Availability Figure 4: Status of Illinois Lake Michigan diversion, in cubic feet per second Yearly deviation from diversion limit Cumulative diversion *Note: Years 2006 through 2008 are estimates. Zero (0) mark on Y (vertical) axis equals 3,200 cubic feet per second (cfs). Source: Illinois Department of Natural Resources (Office of Water Resources), January
33 of reducing withdrawals from the Cambrian Ordovician aquifer (i.e., deep-bedrock aquifer) associated with making new allocations of lake water. Permittees receive an annual allocation of water with several conditions added to permit issuance. For example, while there is no requirement for permittees to submit conservation plans, IDNR does require several conservation practices as follows: 19 1) Permittees will submit to IDNR proposals designed to reduce or eliminate wasteful water use and to reduce unaccounted-for-flows to 8% or less, based on net annual pumpage, and procedures used to determine efficiency of water metering or accounting in permittee s system. Each year, permittees must complete an annual water use audit form (LMO-2) that allows IDNR to track water usage, unaccounted for flow, and other data. 2) IDNR requires evidence of adoption of the following conservation practices as applicable to the particular user; a. Leakage monitoring and correction for storage, transmission and distribution systems. b. Metering of all new construction. c. Metering of existing nonmetered services as part of any major remodeling. d. Adoption of ordinances that: i. Require installation of water efficient plumbing fixtures (since improved upon by the Energy Policy Act of 1992). ii. Require installation of closed system air conditioning in all new constructions and in all remodeling. iii. Require all newly constructed or remodeled car wash installations be equipped with a water recycling system. iv. Restrict nonessential outside water uses to prevent excessive, wasteful use. As a minimum, these restrictions shall provide that unrestricted lawn sprinkling will not be allowed from May 15 to September 15 each year. e. Development and implementation of public programs to encourage reduced water use. f. Installation of facilities and implementation of programs to reduce to a reasonable minimum, and to accurately account for, water used for navigational, lockage, and leakage purposes; and pollution treatment, control or abatement purposes. IDNR recommends that all permittees adopt water rate structures based on metered water use and that water rate structures be developed which will discourage excessive water use. Also, IDNR has the authority pursuant to state law and the lake water allocation rules to strengthen the conditions of permit pertaining to water conservation. IDNR undertakes a review of Lake Michigan water allocations periodically and initiated its third such review in October A final decision on this most recent review was issued in December Notable outcomes of the review process include, the potential to accommodate an increase 50 to 75 millions of gallons per day (mgd) in domestic water supply allocation to new communities, and the reduction in total water allocated of 209 mgd in 2009 and 212 mgd in The year 2020 is the end date used in the previous allocation scheme. Another outcome included nine permit revocations due to nonuse either because the permittee never implemented their allocation or because they are no longer in business. New allocations/permits were extended to Allocation permits are granted free-ofcharge. 19 Ibid. 20 Ibid
34 Chapter 2 Framework for Regional Water Supply Planning and Management Groundwater Dependent Users Groundwater withdrawals in Illinois are governed under the rule of reasonable use. The rule of reasonable use is defined in the Water Use Act of 1983 (WUA) as the use of water to meet natural wants and a fair share for artificial wants. 21 It does not include water used wastefully or maliciously. As observed by others, there are no statutory remedies for disputes that might arise over groundwater withdrawals. Thus, any such disputes will have to seek remedy via litigation. 22 Furthermore, Illinois does not require a permit for groundwater withdrawals beyond the operating permit following construction that is issued by Illinois Environmental Protection Agency (IEPA) and is nonexpiring. The WUA is designed primarily as a mechanism for restricting groundwater withdrawals in emergencies in limited areas of the state and to provide for public notice of new withdrawals that are both planned and deemed substantial (i.e., > 100,000 gallons/day). 23 The purpose of the WUA is to anticipate potential water conflicts and establish a rule for mitigating water shortage conflicts should they occur. The six counties of northeastern Illinois that are governed by the Level of Lake Michigan Act were exempt from the provisions of the WUA until the Act was amended in There is a provision in the WUA that requires landowners to notify the local Soil and Water Conservation District (SWCD) and other local governments of an intended new well that is capable of withdrawing at a rate of 100,000 gallons per day or greater. The SWCD is to be given such notice before construction of the well begins. The SWCD is to confer with the Illinois State Water Survey (ISWS) and Illinois State Geological Survey (ISGS) to consider possible effects from the new well on neighboring groundwater users. Should a SWCD believe it to be necessary to recommend a restriction, such a recommendation is made to the Illinois Department of Agriculture where authority rests for this determination. The emergency restriction section of the WUA applies to each SWCD within the two counties (Kankakee and Iroquois) through which the Iroquois River flows and each SWCD within the two counties (Tazewell and McLean) with a population greater than 100,000 through which the Mackinaw River flows. From 1992 to 2008, the ISWS received 939 SWCD notifications for high-capacity wells, 196 (21%) of which were for wells located in the six-county region of northeastern Illinois. 24 Lack of funding since 1992 and insufficient staff, however, have prevented the State Surveys scientific review of the likely or potential effects of new points of groundwater withdrawals on neighboring wells. Thus, oversight and consideration of broader impacts are left to the judicial branch should one party claim unreasonable use by another. Another law affecting groundwater users is the Illinois Groundwater Protection Act (IGPA). 25 Much as the name implies, the IGPA is designed to impart groundwater protection from contamination, waste and degradation, and be managed to allow for maximum benefit of the people. Furthermore, the IGPA makes very clear the policy of the State: to restore, protect, and enhance the groundwaters of the State, as a natural and public resource. The IGPA is rather sweeping if only for the sheer number of state agencies, departments, and offices nine that have a role in reviewing the State s policy on groundwater protection, laws, regulations, procedures, and efforts to improve or protect groundwater. The Interagency Coordinating Committee on Groundwater (ICGC), composed of representatives (i.e., the director or his/her designee) of the nine state entities referenced above, and Groundwater Advisory Council, both mentioned in the Introduction, play keys roles in implementing the IGPA ILCS 45/. 22 Section 4 of the County of McHenry, Illinois Groundwater Resources Management Plan Report 1: Groundwater Resources Management Framework, Final, November Prepared by Planning and Management Consultants, Inc. and Baxter and Woodman, Inc. 24 Personal communication with H. Allen Wehrmann, Head, Center for Groundwater Science, Illinois State Water Survey. January ILCS 55/. 23 Since this was written, Governor Quinn signed legislation (SB 2184) on August 10, 2009 to amend the Water Use Act of The details of the amended law are outlined in Chapter 5. 18
35 Inland Surface Water Dependent Users The Rivers, Lakes, and Streams Act 26 provides explicit authority to the IDNR to manage and safeguard the rivers and lakes of the state against encroachment, wrongful seizure or private use. Furthermore, IDNR is paired with IEPA and the Illinois Pollution Control Board (IPCB) for purposes of the proper preservation and utilization of the waters of Lake Michigan. While the Act addresses construction activities, dam maintenance, floodplain issues, navigation, data collection/dissemination, and fill/ deposit of rock, earth, and sand, matters that might pertain to water supply are not given explicit expression. Drought Planning and Management Drought and emergency water management, planning, and response are indispensable elements of water supply management where reliability is essential. 27 Drought Preparedness reduces the social, economic and environmental impacts of drought and the need for federal emergency relief expenditures in drought-stricken areas and may also lessen conflicts over competition for water during drought. The elements of drought preparedness include: Drought planning 2. Plan implementation 3. Proactive mitigation 4. Risk management 5. Resource stewardship 6. Consideration of environmental concerns 7. Public education Drought planning in Illinois focuses on drought response following drought occurrence and beginning with an official determination of drought onset. 29 The Illinois Emergency Management Agency Act 30, designed to authorize and coordinate emergency management programs for disaster mitigation, preparedness, response and recovery, includes drought among the many disasters that upon occurrence would trigger state action. While state activity surrounding drought is obviously reactive in nature, the phenomenon of drought itself has for the most part not impacted public water supplies negatively aside from the lack of rainfall that has occasionally been detrimental to agricultural crops. As for the impact on water use, the most recent drought of 2005, for example, caused water demand to be 8% higher across all water-use sectors (excluding withdrawals by once-through systems in thermoelectric power plants) than (modeled) normal weather would have caused. 31 The drought ILCS 5/. 27 Interstate Council on Water Policy Position Statement on Drought and Water Supply Emergency Preparedness, August National Drought Policy Commission, Preparing for Drought in the 21st Century, May Illinois State Water Survey, The Water Cycle and Water Budgets in Illinois: A Framework for Drought and Water-Supply Planning. I/EM Champaign, IL ILCS 3305/4. 31 B. Dziegielewski and F.J. Chowdhury Regional Water Demand Scenarios for Northeastern Illinois: Project Completion Report. Southern Illinois University Carbondale. See 19
36 Chapter 2 Framework for Regional Water Supply Planning and Management Great Lakes Compact of 2005 was particularly severe in some parts of the state and overall, ranked as one of the three most severe droughts in Illinois in 112 years of recordkeeping. 32 In addition to ranking as the 11th driest on record, 2005 was also the 12th warmest with inches of precipitation (20% or 7.75 inches below the 1971 to 2000 mean) and a mean temperature of 53.8 F (4% or 2.1 F above the 1971 to 2000 mean), respectively. 33 The ISWS has recently reported analyses of drought severity, drought return periods, and drought impacts on water supplies based on the historical record. 34 Here, it is worth noting that the majority of people in northeastern Illinois rely on a water source that is generally thought to be relatively drought resistant: 77% of the region s population that use Lake Michigan and approximately 9 to 10% that use the deep bedrock aquifer. 35 For the other 9 to 10% of the region s population that draws on shallow aquifers (sand-and-gravel and bedrock) along with the 4 to 5% that depend on either the Fox or Kankakee River as their primary water source, drought presents a more immediate threat. The State Water Plan Task Force has recently identified the need to update the 1983 State Drought Plan that the state has been using for drought contingency planning. Among the various elements that the task force will include in the update, the plan will address risk management, cost analysis, and the maintenance of water supply planning and management as well as conservation. This new format addresses the National Drought Policy guidelines listed above, and will have the flexibility to address the diverse nature of the state due to the inclusion of the current priority planning areas studies within the plan framework. Recommendations concerning drought preparedness will be addressed in Chapter 4 of this report. The Great Lakes St. Lawrence River Basin Water Resources Compact (referred to hereafter as the Compact) has several specific purposes, and was developed to enable the eight Great Lakes states, in a shared and cooperative manner, to protect, conserve, restore, improve and manage the renewable but finite water resources of the Great Lakes Basin for the use, benefit, and enjoyment of all basin citizens, including generations yet to come. 36 On October 3, 2008, President George W. Bush signed a joint resolution of Congress providing consent to the Compact. On December 8, 2008, the Compact became effective as state and federal law, marking the final step in a long process of developing historic protections for the Great Lakes. Since a primary objective of the Compact is a ban on diversion of water outside the Great Lakes Basin, many of the operative provisions of the Compact do not apply to Illinois. The Compact explicitly recognizes that Illinois diversion of water from Lake Michigan will continue to be governed by the terms of the U.S. Supreme Court Decree. However, the water conservation and efficiency programs provision of Section 4.2 do apply to the State of Illinois as it does to the other parties (i.e., the other seven Great Lakes states in addition to Illinois). Thus, by December 8, 2010, the parties must commit to promote Environmentally Sound and Economically Feasible Water Conservation Measures such as: a. Measures 37 that promote efficient use of water. 38 b. Identification and sharing of best management practices and state of the art conservation/efficiency technologies. c. Application of sound planning principles. d. Demand-side and supply-side measures or incentives. e. Development, transfer, and application of science and research. 32 The 2005 Illinois Drought by Kenneth E. Kunkel (editor) and others. Illinois State Water Survey See 33 Ibid. 34 Ibid Based on 2000 population and assuming that half of the groundwater withdrawn in the region is from the deep-bedrock aquifer. 36 Great Lakes St. Lawrence River Basin Water Resources Compact. See St_Lawrence_River_Basin_Water_Resources_Compact.pdf. 37 Measures are defined in the Compact as any legislation, law, regulation, directive, requirement, guideline, program, policy, administrative practice or other procedure. 38 Water is defined in the Compact as ground or surface water contained within the Basin. 20
37 Furthermore, Each Party shall implement a voluntary or mandatory Water conservation program for all, including existing, Basin Water users. Conservation programs need to adjust to new demands and the potential impacts of cumulative effects and climate. 39 The Great Lakes St. Lawrence River Basin Sustainable Water Resources Agreement, 40 a companion document to the Compact, created the Great Lakes St. Lawrence River Water Resources Regional Body (Regional Body). The Regional Body is comprised of the Governors 41 and Premiers of Ontario and Quebec to further coordinate implementation of the terms of the Agreement. Pursuant to the Agreement, the Regional Body adopted regional water conservation and efficiency objectives that were to be broad, overarching concepts which will provide context for further State and Provincial action that will be more specific in nature. 42 The water conservation and efficiency objectives are as follows: 1. Guide programs toward long-term sustainable water. Details associated with these objectives are enumerated elsewhere 43, but the conservation and efficiency objectives themselves are based on the following goals of the Agreement: a. Ensuring improvement of the Waters and Water Dependent Natural Resources. b. Protecting and restoring the hydrologic and ecosystem integrity of the Basin. c. Retaining the quantity of surface water and groundwater in the Basin. d. Ensuring sustainable use of Waters of the Basin. e. Promoting the efficiency of use and reducing losses and waste of Water. The conservation recommendations offered in this regional plan have the potential to assist Illinois and other Great Lakes jurisdictions in the development of their own conservation plan to fulfill Compact obligations as they relate to Section Adopt and implement supply and demand management to promote efficient use and conservation of water resources. 3. Improve monitoring and standardize data reporting among State and Provincial water conservation and efficiency programs. 4. Develop science, technology, and research. 5. Develop education programs and information sharing for all water users. 39 Great Lakes St. Lawrence River Basin Water Resources Compact, Article 1, Section 4.2, Number Ibid. 40 Great Lakes St. Lawrence River Basin Sustainable Water Resources Agreement. See Great_Lakes-St_Lawrence_River_Basin_Sustainable_Water_Resources_ Agreement.pdf. 41 The Governors as members of the Great Lakes St. Lawrence River Basin Water Resources Council. 42 Great Lakes St. Lawrence River Basin Water Conservation And Efficiency Objectives. See 21
38 Chapter 2 Framework for Regional Water Supply Planning and Management Other Laws: Water Authorities Act In the previous chapter and among the 12 consensus principles developed by the WRAC, the question was raised, Is there a role for water authorities established under the Water Authorities Act? The Water Authorities Act 44, enacted in 1951, will be scrutinized, therefore, as a tool for water supply planning and management at the subregional scale. Designed to affect some measure of groundwater management in predominantly rural areas where new wells and withdrawals will be looked upon carefully for possible effects on existing well users, water authorities can incorporate as any area of contiguous territory. There are seventeen such water authorities currently in existence. Two of the seventeen water authorities go beyond the area of an entire county while the balance of fifteen water authorities either capture a relatively small subarea of the county where they reside or in one case is coincident with the (Menard) county boundary. Of these entities, thirteen are located within the east-central Illinois regional water supply planning area initiated under EO Just one water authority, the Sugar Grove Water Authority, exists within the northeastern Illinois regional water planning area. 45 The Sugar Grove Water Authority is an independent taxing body (as all water authorities are similarly enabled) that governs all water wells in the Sugar Grove Township, Kane County. The Water Authorities Act includes measures that may limit its use as a mechanism or tool for providing water supply/demand management at the regional level. These include: 1. The powers of a water authority presume possession of a level of scientific understanding, regarding the hydrogeology and overall water budget of the proposed district area, that is generally incomplete or absent for most subregional units until the State Surveys develop such knowledge. Within the northeastern Illinois regional planning area, such an understanding is currently being developed by the State Surveys under the state and regional planning initiative, initiated by EO , from which plan and policy recommendations will be made by regionally sanctioned planning entities such as the NE IL RWSPG. 2. Water authority districts are governed by a board of three trustees that can either be appointed or elected. While the RWSPG may be larger than necessary a 35-member body few will argue that it is without diverse stakeholder representation nine different interest groups that is generally thought to be appropriate for larger scale water resource management. 3. Water users at the time a water authority district is established are grandfathered in terms of their existing capacity to withdraw water. 4. Water authorities exclude water used for agricultural purposes from required district planning and management. Yet agricultural water use affects the regional demand/supply equation and agricultural interests are represented on both regional planning councils born of Executive Order Water authority districts can impose mandatory reporting on a nonagricultural water user if so desired. Permits can also be required and potentially denied of such users for changes to the status quo (e.g., new well, improved withdrawal capacity, etc.). Such district authority power, if created at a subregional scale, could create an unlevel playing field within the region where reporting is voluntary and permits are currently limited to the Lake Michigan service region. For another view on the efficacy of the Water Authorities Act as it relates to the planning and management challenges faced by the region today, the reader is encouraged to review, Is the State of Illinois Prepared for Water Shortages? Recommendations for a New Approach to Water Governance Special Districts (70ILCS 3715/) Water Authorities Act 45 For a map and enumeration of water authorities in the state, see See 46 Prepared by Dr. Jack Wittman, Hydro Planning Associates, Inc. Commissioned by the Metropolitan Planning Council, Openlands, and the Paul Simon Public Policy Institute. See 47 Water rate structures are likely to be important since pricing has been found to be a cost-effective water demand management tool as compared to nonprice conservation strategies (Olmstead and Stavins, 2007). Mandatory command-and-control use restrictions, such as water restrictions and other nonprice strategies generally require costly monitoring and/or enforcement, and voluntary nonprice demand management strategies have often resulted in less than expected water savings due to behavioral responses (i.e., longer showers) off-setting the water savings of lower-flow fixtures. Nonprice demand management programs can also result in decreased utility revenue whereas price increases, given inelastic demand, will increase total revenue. For example, when Seattle Public Utilities instituted rate increases as part of their water conservation program, the result was excess profits, which were subsequently used to subsidize targeted user groups and create a drought fund. When rate increases are not included in the conservation plan, nonprice programs are used to reduce demand, causing utility revenues decline, resulting in price increases despite original resistance to such increases. Ratemaking is therefore important to ensure revenue stability for utilities in the presence of a comprehensive conservation strategy drawing upon nonprice strategies. 22
39 Water Rates in Northeastern Illinois Water-rate structures in the 21st Century are likely to be important in determining the degree of success that utilities and regions achieve with water-use efficiency gains. 47 The design of water-rate structures is important in ensuring sufficient revenue to sustain the utility (i.e., maintain long-term efficient operation), and in meeting social objectives of ensuring adequate and reliable supplies of clean water at reasonable charges for all users. There may be additional objectives employed in setting water rates, for example, water-rate structures can promote efficient water conservation when the full value of water is communicated to customers. 48 When water is underpriced, overuse and insufficient infrastructure investment may result, whereas consumers would have conserved had they been faced with the higher full-cost price. There are multiple objectives in implementing full-cost pricing including economic development, cost recovery, revenue and rate stability, affordability, conservation and demand management, rate simplicity, legality and defensibility. 49 Water prices in the U.S. are currently lower than those which both efficient pricing as well as full cost pricing would dictate, 50 even while the U.S. EPA has identified full cost pricing as one of the four pillars of sustainable infrastructure development. 51 It is important to reiterate that water systems and communities consider multiple ratemaking objectives, some of which may defer and/or complicate implementation of full cost pricing such as burden on low-income consumers and concern over regional economic development (such as attracting and retaining business and industry). It is up to individual municipalities to rank multiple ratemaking objectives (economic development, affordability, revenue recovery, conservation) and design their rates and strategies accordingly. Water pricing is increasingly becoming a tool for managing demand, with certain pricing options carrying more of an incentive for consumers to use water efficiently. In particular, conservation pricing has been widely recognized as one of the best management practices (BMP) for urban water management. 52 Conservation pricing has additionally been found to be a cost-effective water demand management strategy, 53 with the primary deterrents of implementing such pricing strategies being lack of political will, confusion over the definition of conservation pricing, and legal constraints. 54 In Illinois, the authority to set rates for community water systems generally lies with local governing boards, whereas for private utilities the rate setting is overseen by the Illinois Commerce Commission. In the case of the City of Chicago, water rates are determined in part by the Metropolitan Water Reclamation District Act that dates back to Additionally, the potential for price to be implemented as a demand management strategy depends on the responsiveness of quantity demanded to price, referred to as price elasticity. The price elasticity of demand for Northeastern Illinois is estimated to be -0.15, that is, for a 10% increase in price, quantity demanded falls by 1.5%. 56 There are several factors that may be working to make consumers less responsive to price. One factor is that many water customers simply do not understand their water-rate schedules, water bills, and/or how to read their water meters. For example, in northeastern Illinois, an estimated 36% of water customers don t know their water bill frequency and 47% don t know their water billing unit. 57 Another related issue is that billing is often performed as a combined water, wastewater, and sanitation bill, so that it can be difficult for consumers to discern the water-use portion of the bill. For these reasons, providing more information to customers on their water bill may make price increases more effective, with price elasticity of demand found to increase by 30% or more when information on pricing is included with the water bill. 58 Another factor is that 48 Full cost includes capital charges, funding depreciation, operation and maintenance costs, and opportunity costs, as well as both economic and environmental externalities. The opportunity cost of water consumption consists of the benefits foregone from that use. Note that the opportunity cost of water is equal to zero when there is no water shortage. Externalities generally refer to third-party effects occurring outside the water market. Economic externalities are associated with changed production or consumption costs resulting from the use of water, for example, the over-extraction of groundwater raising the pumping costs of others, or reduced water levels affecting shipping costs. Environmental externalities are associated with public health and ecosystem maintenance, such as impacts of changing water levels on coastal habitat. 49 See the U.S. EPA Case Studies of Sustainable Water and Wastewater Pricing. Office of Water December In Illinois cost recovery, equity, and funding future improvements rank among the most important (Dziegielewski et al, 2004 see footnote #59, this chapter). 50 Economists generally agree that efficient water price should equal long run marginal cost, which includes capital cost charge. Full cost pricing includes additional considerations, as discussed. The current and systematic underpricing of water is widely accepted by leading academics in the economic literature (for example, see Griffin, R.C. Water Resource Economics 2006). Full cost includes capital charges, funding depreciation, operation and maintenance costs, opportunity costs, as well as both economic and environmental externalities. Even a cursory review of rate-setting practices reveals that the majority of utilities do not practice full cost pricing (see for example the American Water Works Association Principles of Water Rates, Fees, and Charges), a situation that is further attested to by crumbling water infrastructure. As one local example, prices taking future water scarcity in the Chicago region into account have been estimated to range $0.98- $1.17 per 1000 gallons higher than the current prices charged by the City of Chicago (Ipe and Bhagwat, 2002). 51 U.S. EPA, Office of Water, See pricing. 23
40 Chapter 2 Framework for Regional Water Supply Planning and Management water use occurs prior to when customers receive their bill, so that customers may be unaware of their water use as it is occurring, unless they are able to track their own consumption by periodically and accurately reading meters in relation to their previous billed consumption levels. The amount of effort and time to read meters, decipher current bills, and understand rate structures are impediments to northeastern Illinois consumers understanding savings benefits when their combined water and wastewater water expenditures only comprise an average of 1% of their income. 59 However, improving the clarity of water bill information and billing monthly can lead to improvements in consumer awareness and conservation. Price increases are generally more effective in encouraging conservation of water in circumstances where the use of water is discretionary or seasonal, such as residential outdoor use. Much less research has been conducted on industry and business price responsiveness to water price than on residential response to price. One reason for this is the increased complexity and data requirements of modeling business and industry water demand. Water demand in this sector is an input to production, and, as such, is tied into the employment level, economic conditions, existing industry regulation (for example, water quality regulation), state of production technology (water requirements for specific processes, input substitution possibilities), differing levels of consumptive use of water (for example, cooling versus food packaging), among other factors. While the intention of conservation pricing structures is to allow businesses to decrease their water input costs by decreasing water use per employee, elasticity of demand varies markedly across specific industries and businesses, so that, in the absence of current and reliable business and industryspecific price elasticity estimates, the effect of price changes in this sector is debatable. In the case of business and industry, an increase in water price increases input costs, and, though water costs tend to be a small proportion of total costs, there may still be some passthrough of higher water rates to the consumer. Other input costs influencing production processes are more likely to influence both final product price and water demand, so that water requirements are, to a large extent, dictated by existing production processes and technology. When firms are already minimizing water use given current technology, increased water costs could negatively impact businesses activity. The issue is further complicated by many other considerations, including the amount of self-supplied water and the importance of business to local economies. Another important consideration is the amount of nonconsumptive water use in the industrial and power sectors, which implies that price increases may potentially reduce water intake, but end up leaving consumptive use relatively unchanged, therefore not contributing to the balancing of water budgets. The implication is that there may be cases where, even where price elasticity is relatively large, continued low pricing of water in the commercial and industrial can be justified. Water rate studies in Illinois as a whole have been conducted by Afifi and Bassie (1969) 60 and more recently, by Dziegielewski, Kiefer and Bik (2004). 61 Rate schedules across Illinois were found to be diverse and complex, a situation that is likewise reflected in the 11-county northeastern Illinois water utilities. 62 Twopart structures are commonly used in the region, and include both a base charge as well as a volumetric water charge. The base charge can be a minimum charge entitling customers to a specified water use level, a minimum charge combined with a service charge, or a service charge independent of any actual water use. It is important to note that in the two-part rate structure, when the fixed portion of the water bill provides 52 J. Chesnutt et al Designing, Evaluating, and Implementing Conservation Rate Structures. California Urban Water Conservation Council. 53 Shelia M. Olmstead and Robert N. Stavins. Managing Water Demand: Price versus Non-price conservation programs. A Pioneer Institute white paper no. 34 July Conservation pricing is often equated with increasing block rate pricing. Increasing block rate pricing is only one of many possible types of conservation pricing. All Conservation pricing types imply that water bills communicate the full cost of water provision. Where the basis for more complex types of conservation pricing are arbitrary and/or poorly designed, full-cost uniform rates may provide a greater conservation message. 55 Special Districts (70 ILCS 2605/) Metropolitan Water Reclamation District Act. Section 26: Water supply to municipalities How furnished Terms. This is where the legal requirement originates that directs the City of Chicago to charge customer utilities the same rate for water that the City of Chicago charges its residents. 56 Ibid Chicago Metropolitan Agency for Planning Household Water Use Survey: Northeastern Illinois. Unpublished data. 58 S. Gaudin, Effect of price information on residential water demand. Applied Economics 38: Ben Dziegielewski, Jack Kiefer and Tom Bik, Water Rates and Ratemaking Practices in Community Water Systems in Illinois Project Completion Report. Southern Illinois University Carbondale. See RatesRatemakingCompletionReport pdf. 60 Afifi, Hamdy, H.H. and V. Lewis Bassie Water Pricing Theory and Practice in Illinois. University of Illinois Bulletin. 66(142). 61 Ibid
41 for the first block of water, the effect is similar to a flat rate in that there is no connection between water use and water price within this block. 63 The purpose of the base charge is usually to cover fixed costs, provide revenue stability, and cover customer-related costs such as billing and meter reading. The volumetric portion of the rate schedule may assume a uniform, increasing block, or decreasing block structure. 64 In order to implement a volumetric charge, however, users must be metered, otherwise a flat rate must be used. 65 CMAP (2008) found 38% of northeastern Illinois utilities had less than 100% metering of their customers. 66 Thus, incomplete metering in the region acts as an impediment to developing efficient water-rate structures, not to mention any attempt to measure and manage usage. Utilities will often allocate revenue requirements to differing customer classes, including residential, commercial, industrial, governmental, and special contract customers, although any number of customer classifications is possible. Classifying water utility customers is a method of price differentiation, with a fixed charge set according to the customer class and possible additional classification by meter size. In addition to varying the fixed charge by customer class, the volumetric charge may also be varied. It is also possible to combine zonal pricing with customer class, for example, distinguishing customers within and outside of corporate limits. When different prices are applied to different customer classes due to differing supply costs across the cases, the result is more efficient use of water. If the classification is based on other factors, such as political considerations, the schedule may not be efficiently designed. Across Illinois, almost 60% of water supply systems applied the same rate schedule to all of their customers, 67 while 45% of northeastern Illinois systems use some sort of differentiation by customer class or meter size. 68 A type of increasing block rate structure where block differentiation is based on efficient water use occurring for individualized customer characteristics, such as landscaped land area, lot size, manufacturing process, number of employees, and evapotranspiration data is called a water budget rate structure. 69 Water budget rate structures simultaneously meet conservation, equity, 70 legal defensibility, and revenue stability objectives by allocating a basic amount of water in lower priced blocks, and charging for discretionary use and conservation program costs in higher blocks. At the time of this writing, no water utilities in the northeastern Illinois region are known to use water budget rate structure, although water budgets have become increasingly used in water-scarce regions of the U.S. 71 Issues in implementing water budget rate structures include data requirements, calculation of water needs, 72 billing technology, adherence to cost of service principles, customer communication, and political will. Water budget rate structures may have a higher cost to implement and require some adjustment on the part of customers. 73 Water savings from the implementation of water budgets likewise vary, although studies have generally found decreases in water use after water budget rate structures have been implemented. 74 The average Illinois household cost for water and wastewater is $35.50 monthly, compared to $39.67 monthly for the U.S., 75 with the water portion of the bill estimated to be $20.24 for Illinois. 76 In Illinois, 63% of households pay directly for water and wastewater services, in keeping with national estimates. For others, the water charge is either included in rental or maintenance fees, or water is self-supplied. 77 Dziegielewski, Kiefer and Bik (2004) found that the Illinois water systems median water bill rose only 3% in real terms from 1990 to 2003, translating into a recent historical trend of 0.9% per year. 78 In the demand scenarios developed for northeastern Illinois, the Less Resource Intensive (LRI) scenario assumes that prices will increase by For Example, Dziegielewski, Kiefer and Bik (2004) identified fourteen different rate design elements across Illinois community water systems, with an average complexity of score of 2.3 on a scale from 0 to Griffin (2006) explains the presence of a zero price for water provides a perverse incentive for consumers in light of the value of processed and possibly scare water, variable operational costs (e.g., energy, treatment chemicals) and the value of physical capital needed to obtain, store, treat, and deliver this water. See Griffin, Ronald C. Water Resource Economics: The Analysis of Scarcity, Policies, and Projects. The MIT press Another form of pricing is time-of-year, or seasonal rates, where higher unit prices apply to peak periods and lower prices to off-peak periods. This form of pricing is not common in the region. 65 Systems with partial metering with posted volumetric rates typically also have a flat rate charge for those customers who are unmetered. 66 Chicago Metropolitan Agency for Planning Survey of Water Utilities: Northeastern Illinois. Unpublished data. 67 Ibid Ibid Water budgets are typically easiest to develop for the residential class, where single family budgets can be set based on the average amount uses. It is more difficult to develop water budgets for the commercial, industrial and business sectors, and for this reason, only a few utilities in the U.S have included these customer classes in their water budgets. 70 Generalized increasing block rates raise an equity issue when applied to the residential customer class as, given equivalent per capita water use and equivalent unit water costs, larger households containing more individuals will fall into higher-priced blocks. Water budgets can correct for this inequity by allocating water depending on customer characteristics such as number of individuals in the household. Water budgets further 25
42 Chapter 2 Framework for Regional Water Supply Planning and Management percent in real terms (5 to 6 percent nominal) per year. 79 In the more-resource intensive (MRI) scenario, prices are assumed to remain constant in real terms, while the recent trend of.9% increase per year is used for the current trends (CT) scenario. 80 Flat rates in both Illinois and the U.S. as a whole occur just 4% in residential water rate structures, while in northeastern Illinois, 1% of water systems apply a flat rate to all their water customers. 81 Among the utilities in the state using a flat rate, the average was $21.88 per month ranging from $2.50 to $88. In northeastern Illinois, 72% of utilities had a base service charge while an estimated 80% of all Illinois utilities used base charges. 82 The average base charge across northeastern Illinois water systems is $31.35, ranging from $1.00 to $4,000 (large 12 inch industrial meter) per month, whereas the average base charge of all Illinois utilities was estimated to be $36.09 per month ranging from $0.50 to $2,060 (industrial). 83 For northeastern Illinois, the average uniform volume rate is $3.96, ranging from $1.15 to $ Information from water rate surveys can be used to estimate water demand models, allow utilities to make rate comparisons, and provide insights into ratemaking objectives. To address the optimality of current rate structures, however, detailed information on system costs is necessary. Water agencies can then draw upon cost data, and existing rate setting guidance to develop pricing schedules that best meet specified objectives. 89 Recommendations in this regard will be made in the next chapter. Similar to Illinois as a whole, a majority of water systems in northeastern Illinois use a volumetric rate structure. Most commonly used is a uniform rate structure, applied by 79% of water systems as compared to 56% of Illinois water systems as a whole. 84 Twenty percent of water supply systems have rate schedules containing some form of a block rate structure (either increasing or decreasing), as compared to 35% for Illinois as a whole. Increasing block rates occurred in 9% (4% of all of Illinois, 2003) of water system rate schedules, while 14% (31% of all of Illinois) of water utilities use decreasing block rates. For the U.S. as a whole, uniform rates are used in 37.2% of residential rate structures, increasing block in 29.1% and decreasing block in 30.4%, 85 with the number of systems using declining block rate structures decreasing nationwide, down from 36 percent in The average volumetric cost of water in the U.S. is $2.81 per 1000 gallons. 87 In Illinois, the average water rates across the state are estimated at $ meet equity requirements in that they may be adjusted based on a caseby-case basis for extenuating circumstances, such as medical needs. (See Hildebrand, Mark, Sanjay Guar, and Kelly Salt. (2009) Water Conservation Made Legal: Water Budgets and California Law. Journal American Water Works Association). 71 Mater et al. (2008) found that while only a few California water utilities used water budgets in the 1990s, by 2007, water budgets were implemented by 25 water utilities in the United States (see Mayer, Peter, William Deoreo, Thomas Chestnutt, and Lyle Summers. (2008) Water Budgets and Rate Structures: Innovative Management Tools American Water Works Association). 72 There are many subjective issues involved in calculating water budgets, for example, whether to use historical or projected evapotranspiration rates. When larger than needed water budgets are specified excessive use can be encouraged. One method, applied in Boulder, Colorado, is to apply a decreasing block allotment to water needs. Another approach is to adjust water budgets periodically. 73 There are several reasons for higher costs of designing and implementing water budget rate schedules. First, there are greater data requirements including information on lot size, home size, landscaped area, temperature zones. Higher costs may also be incurred as the billing system needs to have the capability to implement individualized increasing block rate structure, and link customer level data to bills. Utilities that have not already done so will need to conduct cost of service studies to establish revenue requirements, allocate costs to customer classes, and design rates to reflect the cost of service. Customer communication will also be increasingly important to promote familiarity with concept of water budgets, involvement in rate setting process, and communicate water use levels on bills. 26
43 74 Mayer, Peter, William Deoreo, Thomas Chestnutt, and Lyle Summers. (2008) Water Budgets and Rate Structures: Innovative Management Tools American Water Works Association. 75 In 2003 dollars. See: Rubin, Scott. The Cost of Water and Wastewater Service in the United States (Oct 2003) Prepared for the National Rural Water Association. 76 In 2003 dollars, see Dziegielewski, Kiefer and Bik (2004). 77 Ibid Ibid Real rate = nominal rate rate of inflation. Example: if the rate of inflation was 3% per year between 1990 and 2003, then the nominal rate of water bill increase was 3.9% per year during that period. Thus, real is after inflation and nominal includes inflation. 80 Ibid For Illinois data see Dziegielewski, Kiefer and Bik (2004); for the U.S. see Olmstead, Shelia M and Robert N. Stavins. Managing Water Demand: Price versus Non-price Conservation programs. A Pioneer Institute white paper no. 34 July Ibid Ibid Ibid G.A. Rafelis, Water and Wastewater Finance and Pricing: A Comprehensive Guide. Third Edition. 86 See 87 NUS Consulting Group 2007/2008 International Water Report and Cost Survey July Ibid For example, detailed information on conservation pricing is provided in Developing, Evaluating and Implementing Conservation Rate Structures (CUWCC, 1997). 27
44 Chapter 2 Framework for Regional Water Supply Planning and Management How Much Water is Currently Being Used? Illinois Water Inventory Program The ISWS, via its Illinois Water Inventory Program (IWIP), determines how much water is used in the state. 90 IWIP has been a voluntary reporting program. Legislation was approved and signed into law in 2009 making reporting for withdrawals over 100,000 gallons per day mandatory. The data-collection process entails a mail-questionnaire survey sent annually to known water users (i.e., withdrawal points). Public water supplies and self-supplied commercial and industrial facilities are two primary examples of users that report withdrawals. The latter group reports on the condition of confidentiality. IWIP administers this survey if there is sufficient funding in the budget to do so. On that last note, the 2008 calendar-year survey has been in jeopardy due to the fiscal year 2009 budget cuts. The process that culminates with this plan had to contend with one major water-use sector that in the main does not report water use: irrigated agriculture. 91 For irrigated agriculture, the amount of water used on crop production is estimated from a combination of known irrigated cropland acreage as reported to the U.S. Department of Agriculture (USDA) and estimates of water applied as a function of growing-season rainfall deficits. The use of the more reliable Certified Acreage reported to the USDA Farm Service Administration should result in better mass estimates. However, more formal reporting mechanisms such as this must be put in place statewide if comprehensive water use is ever to be measured and reliable regional water budget calculations are to be made. IWIP has done a fairly heroic job of capturing water use data despite the voluntary nature of the program and constant threat of insufficient funding.it should be acknowledged that it is no small task to manage such a reporting scheme and the thoroughness of data collection is positively correlated to the amount of staff resources necessary to manage the program. That said, water use data reporting should be done consistently through time, comprehensively in terms of all relevant water users, and not limited to groundwater withdrawals from high-capacity wells only. Since neither consistency nor comprehensiveness is a feature of the current system, and the new mandatory reporting law was not accompanied with dedicated funding, there appears to be tremendous room for improvement if Illinois is to strengthen its ability to plan for and manage water resources. 90 Illinois State Water Survey, Illinois Water Inventory Program. See 91 Actually, a third water-use sector, self-supplied domestic (i.e., private wells) does not report usage, but this is a highly dispersed use sector. 28
45 Regional Water Demand Scenarios for Northeastern Illinois: The region s most thorough study of water demand was completed in June Conducted by Dr. Benedykt Dziegielewski and his team at Southern Illinois University Carbondale, the Regional Water Demand Scenarios for NE IL: : Project Completion Report (referred to hereafter as the Demand Report) presents data for both reported and normal (i.e., weather, using 30-yr. averages so that 2050 scenarios are driven by weather data that are consistent with those used in 2005) water withdrawals in A summary of water withdrawals by water-use sector is presented in Table 1. Table 1: 2005 water withdrawals by sector in northeastern Illinois, in million gallons per day Water-use Sector 2005 Reported Withdrawals 2005 Normal Withdrawals Public supply 1, ,189.2 Self-supplied industrial and commercial Self-supplied domestic From Table 1, several matters are apparent including: 1. The thermoelectric power industry requires a significant amount of water relative to the other sectors. Most power generating plants employ once-through cooling systems that return as much as 99% of the water withdrawn to a river or lake very soon after withdrawal. 2. Power industry aside, the public supply sector uses approximately 80% of the region s water. This can also be viewed as the most expensive water given the cost of treatment and distribution involved. 3. Self-supplied domestic (i.e., private wells) and Irrigation and Agriculture are relatively minor sectors in the region using 2% and 3% respectively excluding once-through power generation. Relative water use among sectors studied is illustrated with and without water used by once-through power generation facilities in Figures 5 and 6. Irrigation and agriculture Power plants (makeup) Power plants (through-flow) 4, ,207.2 Total all sectors 5, ,587.5 Total w/o through-flow power 1, , Ibid
46 Chapter 2 Framework for Regional Water Supply Planning and Management Figure 5: Relative use of water by major sector Power Plants (Combined) 74 % Public Supply 21 % Irrigation and Agriculture 1 % Self-supplied Domestic 1 % Source: B. Dziegielewski and F.J. Chowdhury, 2008 Self-supplied I & C 3 % Figure 6: Relative use of water by major sector excluding once-through power Public Supply 80% Power Plants (Makeup) 4 % Irrigation and Agriculture 3 % Source: B. Dziegielewski and F.J. Chowdhury, 2008 Self-supplied Domestic 2 % Self-supplied I & C 11 % 30
47 Table 2 divides total water withdrawals, excluding oncethrough flow power plants, by total resident population in the study area to yield water use in gallons per capita per day (gpcd). Table 2: Data necessary to determine water use, gallons per capita per day Description 2005 Reported 2005 Normal Total Population 8,743,856 8,743,856 Water withdrawals (mgd) 1, ,480.3 Gross gpcd Table 3 shows current withdrawals of water, excluding the once-through power generation plants, by the three major sources of water in the region. Table 3: 2005 water withdrawals by source, in million gallons per day Year Groundwater River Water Lake Michigan Total Withdrawals 2005 Reported , , Normal , ,480.3 From Table 3, withdrawals (normal) from Lake Michigan accounted for 69% of total withdrawals in Groundwater and inland river sources make up the balance at 17% and 14% respectively. 93 Lastly, Table 4 shows total water withdrawals, excluding oncethrough flow power plants, for each of the eleven counties in the planning region. Normal withdrawals (2005) among the eleven counties are graphed in Figure 7 in rank order of quantity used. Table 4: 2005 water withdrawals by county, in million gallons per day County 2005 Reported 2005 Normal Boone Cook 1, DeKalb DuPage Grundy Kane Kankakee Kendall Lake McHenry Will Total 1, , By comparison, approximately 77% of the 11- county region s population relies on Lake Michigan water, about 19% of regional population use groundwater, and the balance of 4-5% of people in the region use the Fox and Kankakee Rivers as sources of drinking water. 31
48 Chapter 2 Framework for Regional Water Supply Planning and Management 1,000 Figure 7: Water withdrawals ranked by county excluding once-through power, in million gallons per day Cook DuPage Kane Kankakee Kendall Boone Will Lake McHenry DeKalb Grundy Source: B. Dziegielewski and F.J. Chowdhury, ,400 Scenario Figure 8: Demand Water Withdrawals: scenario water 2005 withdrawals , , in million gallons per day Current trend scenario Less resource intesive scenario More resource intensive scenario 2,200 2,000 1,800 1,600 1,400 1, Y E A R Source: Dziegielewski and Chowdhury,
49 How Much Water Will be Needed in the Future? The Demand Report features three water-demand scenarios by major user sectors and for geographical areas that encompass groundwater withdrawal points and surface water intakes in the 11-county water planning area of northeastern Illinois. The three scenarios represent water withdrawals under current demand conditions and reflecting recent trends in development (CT scenario), a less-resource intensive scenario (LRI), and a MRI scenario. Table 5, reproduced from the Demand Report, features the factors affecting future water demand along with the scenario assumptions made for modeling future water demand. Scenarios were extended to the planning horizon, Only the LRI scenario is predicated on the sort of potential intervention represented by this regional water plan. The CT and MRI scenarios will largely occur in response to a combination of a continuation of historical trends and future economic conditions. The LRI scenario is different from the CT scenario across eight of 11 factors that affect water demand, but in only two factors of eight that are potentially affected by this plan: water conservation and future water prices. 94 Figure 8 illustrates modeled demand from 2005 to 2050 across the three scenarios (excluding once-through flow power). A rather striking feature of Figure 8 is that only with active intervention (i.e., LRI scenario) might the region keep overall water demand relatively flat (7.24% growth over 45 years) while population increases as much as 38%. Maintaining the status quo in northeastern Illinois could result in an increase in water demand from 36% under the CT scenario to 64% under the MRI scenario; either could happen absent a commitment to ongoing formal planning and implementation of the current and future regional water plans. Scenarios do not account for the needs of aquatic ecosystems or other in-stream uses. The reader is referred to the Demand Report for details concerning methods used, model performance, uncertainties, and other information regarding the study. Here we will focus on the scenario outcomes. 94 The distribution of population growth factor did not prove to be useful in the model due to the aggregate nature of public water supply sector data (i.e., water utilities sell water to both residential customers as well as commercial and industrial customers.) Additional analysis will uncouple residential from commercial/industrial accounts within public water-utility sales to determine the effects on total water withdrawals that would result from geographically different patterns of population growth within the water planning region. 33
50 Chapter 2 Framework for Regional Water Supply Planning and Management Table 5: Assumptions for factors affecting future water demands in the 11-county area of northeastern Illinois Factor Scenario 1 Current Trends (CT) or Baseline Scenario 2 Less Resource Intensive (LRI) Scenario 3 More Resource Intensive (MRI) Total population CMAP projections CMAP projections CMAP projections Distribution of population of growth Mix of commercial/industrial activities Median household income Demand for electricity Power generation CMAP projections More population in Cook and DuPage counties More population in Kane, Kendall and McHenry counties Current trends Decrease in high water-using activities Increase in high water-using activities Existing projections of 0.7%/year growth 9.61 kwh/capita % annual growth No new plants within study area, 3 units retired Existing projections of 0.5 %/year growth 9.61 kwh/capita without growth No new power plants within study area, 3 units retired, 2 plants convert to closed-loop cooling Higher growth of 1.0 %/year 9.61 kwh/capita % annual growth Two new power plants in study area with closed-loop cooling Water conservation Continuation of historical trend 50% higher rate than historical trend No extension of historical trend Future water prices Recent increasing trend (0.9%/year) will continue Higher future price increases (2.5%/ year) Prices held at 2005 level in real terms Irrigated land Constant cropland, increasing golf courses (10/decade) Decreasing cropland + no increase in golf courses Constant cropland increasing golf courses (20/decade) Livestock Baseline USDA growth rates Baseline USDA growth rates Baseline USDA growth rates Weather (air temperature and precipitation) 30-year normal ( ) 30-year normal ( ) 30-year normal ( ) Source: Dziegielewski and Chowdhury,
51 Figures 9-11 illustrate demand by the three major sources of water: Lake Michigan, groundwater, and inland rivers. Beginning with Figure 9, demand for Lake Michigan water under the LRI scenario could shrink despite a larger projected population. This, of course, means that per capita use in 2050 will have decreased as compared to the base year of 2005 should an LRIlike scenario occur. Figure 9 also shows that under the CT scenario, Lake Michigan water demand could grow 20% by 2050 to 1,223 MGD. This amount is very close to the amount of water currently allocated by IDNR through 2030 (1,210 mgd). The MRI scenario for Lake Michigan indicates potential demand of 1,397 MGD at 2050, a 37% increase from The MRI scenario demand amount, however, is 27% greater than the average of 1,099 MGD diverted for domestic pumpage over the period of Table 6 provides a theoretical breakdown of the Illinois diversion for 2050 using the MRI scenario value for domestic pumpage and average or actual values for other diversion components taken from the IDNR OWR Lake Michigan Management Section. 95 Considering the MRI scenario, the highest water-demand scenario of three demand scenarios studied, relative to other diversion components is useful for exploring the potential of the diversion limit to accommodate a plausible future (2050) beyond the date for which lake-water allocations are currently set (2030). The MRI scenario for public water supply, as a component of the Illinois diversion, indicates maximal use of the allowable diversion of 2.1 billion gallons per day (3,200 cfs) at As noted by IDNR, following the year 2020, Illinois 40-year running average diversion must always remain below 3,200 cfs. The U.S. Supreme Court Decree makes no allowance for Illinois to have a water debt after that year. It is important, therefore, that steps be taken now to build a positive Lake Michigan water bank account as a hedge against climate change impacts, excessive leakage, and accommodation of new requests for Lake Michigan water. The greatest potential to accommodate an increase in domestic pumpage lies with a reduction of the stormwater-runoff component of the diversion. This is a reminder of the need to holistically manage the various aspects of the hydrologic cycle, land use, and water demand. Demand will grow under any of the three scenarios for groundwater dependent communities, as is illustrated in Figure 10. Conservation and efficiency measures, along with other demand-management practices, will have to be aggressively pursued if the desideratum is to either keep demand relatively flat or reduce overall demand while population is projected to grow dramatically in counties that rely heavily or exclusively on groundwater. Other supply/source alternatives to groundwater may exist if needed, but it is beyond the scope of this study to offer more than simple acknowledgment of such. Figure 11 shows current and modeled demand from the region s two inland surface water sources: Fox River and Kankakee River. Demand could grow regardless of what level of intervention occurs, but the ISWS has determined that for the Fox River, new river withdrawals could provide an additional 40 to 45 mgd, cost of new infrastructure to deliver this new water notwithstanding. This potential is based on increased groundwater withdrawals for public supply and subsequent discharge to the river as effluent. 96 The amount of new riverwater expected to become available could change should a greater percentage of wastewater be reused or land applied rather than discharged into the Fox River. 95 Ibid Vernon Knapp, Illinois State Water Survey, presentation titled Effects of Future Water Demands and Climate Change on Fox River Water Availability at October,
52 Chapter 2 Framework for Regional Water Supply Planning and Management 1,200 1, Figure 9: Public supply, Lake Michigan withdrawals, 2005 vs scenarios, in million gallons per day Table 6: Theoretical breakdown of Illinois diversion in 2050 Diversion Component Amount of Water (mgd) Domestic Pumpage (MRI) 1,397 Stormwater Runoff 546 Discretionary 66 Lockage 58 Leakage 24 Navigation Makeup 23 Total Diversion 2, Less resource intensive Source: Dziegielewski and Chowdhury, 2008 Current trends More resource intensive The value for stormwater runoff represents the average from ; the current discretionary allocation 177 MGD for MWRDGC, will be lowered to 66 MGD in 2015; the lockage value represents a 25-yr average ( ); average leakage and navigation-makeup values are unavailable, the amounts used are from water year 2005 which may or may not be a representative year. 2,114 MGD = 3,221 cfs Figure 10: Public supply, groundwater withdrawals, 2005 vs scenarios, in million gallons per day Figure 11: Public supply, Fox and Kankakee River withdrawals, 2005 vs scenarios, in million gallons per day Less resource intensive Current trends More resource intensive Less resource intensive Source: Dziegielewski and Chowdhury, 2008 Current trends More resource intensive Source: Dziegielewski and Chowdhury,
53 Future Water Availability Climate Variability and Change Climate change is subject to intense scientific study and is now receiving unprecedented media coverage. In a summary report designed for policymakers, the Intergovernmental Panel on Climate Change (IPCC) concludes: Warming of the climate system is unequivocal, as is now evident from observations of increases in global average air and ocean temperatures, widespread melting of snow and ice, and rising global average sea level. 97 The IPCC states that carbon dioxide is the most important anthropogenic greenhouse gas with the current atmospheric concentration (379 parts per million (ppm) in 2005) exceeding the natural range over the past 650,000 years as determined from ancient ice cores. The primary source of the increased concentration of carbon dioxide since the pre-industrial period level of approximately 280 ppm is from fossil fuel use, with land-use change a secondary contributor. Atmospheric concentrations of other important greenhouse gases, methane and nitrous oxide, have also increased significantly from preindustrial values and also exceed the natural range of the last 650,000 years. The IPCC concludes that it is very likely (i.e., > 90% probability) that the increased methane concentration is due to anthropogenic activities, primarily agriculture and fossil fuel use. More than one-third of nitrous oxide emissions stem from anthropogenic activities and are primarily attributed to agriculture. 98 It should be noted that as the atmosphere warms, more water evaporates from the oceans to become part of the air as water vapor. Water vapor is the most important greenhouse gas and is estimated to account for 60% of Earth s natural greenhouse effect (versus about 20% from carbon dioxide (CO 2 ) and the balance, ~20%, from ozone (O 3 ), methane (CH 4 ), nitrous oxide (N 2 O), and other species). 99 Thus, most of the predicted warming can be attributed to higher water-vapor concentrations in the atmosphere, rather than from the higher concentrations of CO 2 that initiate the warming. 100 What does climate change mean for water supply planning and management? The 12th U.S. Energy Secretary and Nobel Prize-winning physicist Dr. Steven Chu has made clear that climate-caused water shortages is a major concern. In his first interview since taking office, Dr. Chu made specific reference to the Upper Midwest and West as two regions that could face water shortages. 101 California is particularly vulnerable and by extension, so is the nation s food supply and is often mired in a statewide drought of variable intensity. Closer to home, climate change models for Illinois indicate that by 2050, average annual temperature may rise from 0 F up to 6 F above normal. 102 The temperature increase will also apply during the growing season. Climate models for Illinois are more ambiguous regarding the possible departure from normal annual precipitation by 2050 as output ranges from -5 to +5 inches per year as compared to the long-term average. During the growing season, departures from normal are expected to range from -3.5 inches to +2.5 inches. Adding to the uncertainty regarding climate change, no probabilities of occurrence can be assigned to the possible ranges and combinations of temperature and precipitation changes. 97 IPCC, 2007: Summary for Policymakers. In: Climate Change 2007: The Physical Science Basis. Contributing of Working Group I to the Fourth Assessment Report of the Intergovernmental Panel on Climate Change [Solomon, S., D. Qin, M. Manning, Z. Chen, M. Marquis, K.B. Averyt, M. Tignor and H.L. Miller (eds.)]. Cambridge University Press, Cambridge, United Kingdom and New York, NY, USA. 98 Ibid. 99 See A Brief Overview of the Earth s Climate System. Unpublished paper by John E. Frederick, The University of Chicago. Dr. Frederick s paper is based on, Frederick, J.E Principles of Atmospheric Science. Sudbury, MA: Jones and Bartlett Publishers. 101 Article in the February 4, 2009 Chicago Tribune titled, Energy chief s dire forecast by Jim Tankersley, Washington Bureau. 102 Of the three scenarios modeled at both the 5th and 95th percentiles of probability, all models runs indicate an increase in temperature by 2050 ranging from about 1-6 F. 37
54 Chapter 2 Framework for Regional Water Supply Planning and Management An analysis of temperature data for the entire 20th century reveals that temperature changes from normal in the central U.S. are different from changes in global average temperature trends. Furthermore, while there has been an increase in heavy precipitation events in the contiguous U.S. during the last 80 years, such events were also frequent in the 19th century. Similar variability is found with the frequency of extreme heat waves in the contiguous U.S. over the past 150 years. 103 Nevertheless, the IPCC concludes the following: At continental, regional, and ocean basin scales, numerous long-term changes in climate have been observed. These include changes in arctic temperatures and ice, widespread changes in precipitation amounts, ocean salinity, wind patterns and aspects of extreme weather including droughts, heavy precipitation, heat waves and the intensity of tropical cyclones. 104 In an effort to link climate change to regional water supply planning, the regional Demand Report used climate model output, modeled the effects on water withdrawals under five different climate change scenarios, and compared results to the CT scenario. The five climate change scenarios include: +6 F temperature only, +2.5 inches precipitation only, -3.5 inches precipitation only, +6 F temperature plus +2.5 inches precipitation, and +6 F temperature plus -3.5 inches precipitation. mgd or 2 to 10.5% compared to normal usage in Under the worst-case scenario, +6 F/-3.5 inches precipitation, the irrigation and agriculture sector would experience that largest relative increase in demand at 22.4%. Here, we summarize data from the Demand Report in Table 7 and offer the following observation: a warmer and drier climate could require an additional 229 mgd or ~12% increase in demand across all four water-use sectors above and beyond the 37% increase in demand at 2050 associated with the current trends scenario. To put that in perspective, this climate induced incremental demand is equivalent to half the stormwater-runnoff component of the Illinois diversion of Lake Michigan in The stormwater component of the diversion can be viewed as an amount of water that could be used for public supply if new management techniques someday reduce the amount of stormwater leaving the historic Lake Michigan watershed. Table ES-9 of the Demand Report provides the details of the five possible climate-change scenarios on water withdrawals by water-use sector. Across the four water-use sectors excluding power generation that are examined in the Demand Report, the largest (absolute) change from CT in 2050 is with the public supply sector. In four of five climate-change scenarios, public supply demand is expected to increase from 30 to This paragraph is based on a presentation titled, Policy Responses to Climate Change: Climate Change and Our Regional Water Supply by Dr. Derek Winstanley, Chief, Illinois State Water Survey. Delivered at the University of Illinois Chicago on December 11, See edu/iswsdocs/wsp/ppt/cmap_summit_12_10_07.pdf. 104 Ibid
55 Surface Water: Variability and Change Table 7: Summary of effects of possible climate change on water withdrawals across all water-use sectors excluding power generation Weather scenario 2005 use (mgd) Use in 2050 (mgd) change (mgd) Change from CT in 2050 (+/-%) CT scenario 1,428 1, F temp. 1,428 2, " precip. 1,428 1, " precip. 1,428 2, F and +2.5" precip. 1,428 2, F and -3.5" precip. 1,428 2, The issue of drought begs for an adaptive management approach to water supply planning and management. In the meantime, and much like drought preparedness, the possibility of climate change should provide ample motivation to improve water-use efficiency and practice greater levels of water-use conservation that take full advantage of state-of-theart thinking and technology. Thus, the recommendations made by this plan reflect current knowledge of climate variability and change and awareness of the potential for more challenging times ahead. What remains for the next planning cycle is for consensus to be achieved among regional stakeholders as to the future climate conditions that should be planned for. The level of Lake Michigan and in-stream flow in the Fox River are two matters very relevant to surface water variability and change. The U.S. Army Corps of Engineers collects and disseminates water level data in cooperation with the National Oceanic and Atmospheric Administration (NOAA) and the Canadian Hydrographic Service. The NOAA Great Lakes Environmental Research Laboratory has collected monthly hydrologic data since The long-term mean levels are averaged for data for the period Lake Michigan has varied in elevation 6.3 feet between the maximum level recorded ft. (October 1986) and the minimum level March The long-term annual mean average level is feet. The relevance of Lake Michigan levels to regional water supply planning may be greater should the lake ever drop below its historic low level as it came close to doing in In the meantime, a rise or fall of just one inch in the level of Lake Michigan is equivalent to 387 billion gallons of water or about half the annual diversion available to Illinois. Of course, since Lake Michigan and Lake Huron are hydrologically connected as one continuous water body, they rise and fall together. Thus, a difference of one inch in lake level translates into a 787 billion gallon difference in Lake Michigan-Huron volume; an amount of water roughly equivalent to Illinois annual diversion limit. The Fox River is one of the rivers in Illinois that is protected by IDNR to maintain a minimum-instream flow. According to the ISWS, Fox River low flow will continue to increase over time as a result of population growth and associated increased demand for water. (This is made possible by the export of groundwater (for drinking water) to the Fox as wastewater effluent.) The Fox River, therefore, has the potential to supply as much as 50% 105 All levels are referenced to the Great Lakes Datum of See historicdata/longtermaveragemin-maxwaterlevels/. 39
56 Chapter 2 Framework for Regional Water Supply Planning and Management Summary of Regional Groundwater Modeling Study of new water demands in Kane and Kendall Counties. This translates into the potential to support additional new withdrawals of MGD, as well as what will occur (including growth) from existing withdrawal points in Elgin and Aurora. 106 As discussed above, this assumes that new wastewater reuse activities have a minimal impact on the growth of effluent discharges. Additionally, watershed modeling of the potential effect of climate change on Fox River low flows, indicates that climate change is expected to be much less of a factor on flow than the effects of withdrawals and effluent discharges and, as a result, should not greatly alter the water supply potential of the river. 107 The Kankakee River has a higher low flow than the Fox, but modeling efforts similar to those performed on the Fox, have not yet been done. In the case of both rivers, there may be some opportunity to capture flood flows and practice some semblance of conjunctive use. The potential for this apparent opportunity to supply additional sources of water that would otherwise leave the region as floodflow, however, is only speculative at this point in time. Substantive discussion of many critical issues identification of storage locations, issues of land ownership, means to access and use/distribute stored water, costs associated with these issues and other aspects, etc. has yet to take place. Three primary aquifers have historically provided an abundant supply of water to the people of northeastern Illinois: sand and gravel, shallow bedrock, and deep bedrock. For the current purpose of groundwater analysis, planning, and management, sand and gravel aquifers will be combined with the shallow aquifer such that the groundwater discussion will largely focus on either the shallow aquifers or deep-bedrock aquifer. Analysis of the shallow aquifers is confined to the Fox River Basin due primarily to data limitations as well as time and budget constraints. The ISWS analysis of the deep-bedrock aquifer covers the entire 11-county planning region. Figure 12 illustrates the source of groundwater among groundwater-dependent municipalities in the region. The ISWS has made clear that ongoing scientific study of regional groundwater does not quantify availability, but rather indicates the impacts on shallow aquifers and the deep-bedrock aquifer from the three water demand scenarios approved by the Regional Water Supply Planning Group (RWSPG) in May It is highly unlikely, therefore, that planners and water managers will know with certainty the amount of groundwater that is available for withdrawal. 108 Thus, this section of the regional water plan will summarize the ISWS groundwater supply/demand analysis report and in doing so, provide the foundation for recommendations to come. The cone of depression created around a pumping well is an expected and unavoidable consequence of groundwater pumping. In the simplest case a single well pumping at a uniform pumping rate the cone of depression will deepen and widen until hydraulic gradients are sufficient to divert groundwater into the cone at a rate equivalent to the pumping rate. Once this condition is met, the cone of depression 106 Ibid Ibid S.C. Meyer, H.A. Wehrmann, H.V. Knapp, Y-F Lin, F.E. Glatfelter, D. Winstanley, J.R. Angel, J.F. Thomason, and D.A. Injerd Opportunities and Challenges of Meeting Water Demand in Northeastern Illinois. Prepared for the Northeastern Illinois Regional Water Supply Planning Group by the Illinois State Water Survey and Illinois State Geological Survey (Institute of Natural Resource Sustainability, University of Illinois, Urbana-Champaign) and the Illinois Department of Natural Resources, Office of Water Resources. See 40

57 Figure 12: Type of aquifer used by groundwater-dependent municipalities 41
58 Chapter 2 Framework for Regional Water Supply Planning and Management stabilizes under what is called a steady-state or equilibrium condition. When the pumping rate exceeds the aquifer s capability to balance outflow (demand), the cone of depression will not stabilize, but will continue to expand and drawdown will continue to increase. Eventually, drawdown can extend to the pump setting and cause the well to fail. The cone of depression created by multiple pumping wells in a single aquifer is essentially a summation of all the individual cones of depressions created by each pumping well. Interference drawdown, or well interference, is the drawdown caused at one well by all the other wells pumping from the aquifer. Well interference is commonplace throughout the deep-bedrock aquifer of northeastern Illinois and southeastern Wisconsin and is due to regional withdrawals that exceed the aquifer s ability to meet pumping demand (i.e., withdrawals exceed recharge). Well interference, the continued deepening of the cone of depression in the deep-bedrock aquifer, and the occurrence of deep-well failures played a significant role in the shift from groundwater to Lake Michigan water among numerous DuPage County communities in the early 1990s. Based on ISWS regional groundwater modeling study results, if deep-bedrock withdrawals continue to increase, the potential for history repeating itself appears great. Important differences today, however, are 1) comparatively less Lake Michigan water is available due to current allocations and legal constraints and, 2) the distance to inland communities with potential future needs is much greater, significantly increasing the cost to provide lake water. Related to drawdown interference is the phenomenon of streamflow capture. Streamflow capture is happening throughout the Fox River Basin. 109 The ISWS has determined that stream flow appears to be contributing significantly to wells drawing from sand and gravel aquifers. Pumping of the shallow-bedrock aquifer, therefore, is diverting groundwater away from streams that previously contributed to baseflow. 110 Likely impacts include: some perennial streams becoming more intermittent and intermittent streams becoming more ephemeral. In addition to the obvious reduction of stream water quantity, water quality could also degrade. 111 Degradation of water quality, stemming from a reduction in baseflow contribution, will be especially pronounced in streams that receive wastewater effluent. Along with mass exports of groundwater to the Fox River, the hydrology of northeastern Illinois is undergoing significant change the likes of which are only now becoming understood. Given that pumping from the shallow-aquifer system is expected to grow through time, it is logical to expect that impacts to streamflow will increase as well. Impacts to aquatic ecosystems will inevitably follow Ibid. 110 Groundwater seepage into a stream channel is called baseflow; the dominant source of water during dry periods or drought when overland flow (i.e., land surface runoff ) is negligible or nonexistent. 111 A notable exception can occur in predominantly agricultural watersheds where baseflow can be the primary pathway for nitrate nitrogen to enter a stream. For example, see Keith Schilling and You-Kuan Zhang, Baseflow contribution to nitrate-nitrogen export from a large agricultural watershed, USA. Journal of Hydrology 295(1-4): See udi=b6v6c-4chrkwr-2&_user=10&_rdoc=1&_fmt=&_orig=search&_ sort=d&view=c&_acct=c &_version=1&_urlversion=0&_userid =10&md5=7df6f68de9b3c6d2c a1bb James R. Karr and Daniel R. Dudley, Ecological perspectives on water quality goals. Environmental Management 5(1):
59 Drawdown is greater in the deep-bedrock aquifer than in the shallow aquifers in response to the different availability of replacement water. Drawdown in the Ancell and Ironton- Galesville Units in southeastern Kane County and northern Will County suggest high potential for adverse impacts by 2050: decreasing well yields, increasing pumping expenses, increases in salinity, and increased concentrations of radium, barium and arsenic. Aurora and Joliet appear to be most at risk given that for these two particular areas, the models predict these impacts across all demand scenarios including the LRI. Similar consequences appear likely for Montgomery (southern Kane/ Kendall County) only much sooner; perhaps within 10 years under a MRI scenario. The ISWS concludes, Model results suggest the deep bedrock aquifers cannot be counted on (indefinitely) to meet all future demand scenarios across the entire 11-county area. In the short term, there is time to pursue alternative sources (e.g., Fox River or Lake Michigan water) and demand management. Shallow aquifer drawdown is most significant in northeastern Kane County and southeastern McHenry County in response to pumping by Algonquin, Carpentersville, East Dundee, Lake in the Hills, and Crystal Lake. The next most vulnerable areas are a north-south corridor along the Fox River linking South Elgin, St. Charles, Geneva, and Batavia in Kane County, and Woodstock in McHenry County. The vicinity of Plano (Kendall County) and Marengo (McHenry County) also appear to be vulnerable by The most immediate and problematic consequences are likely to be greater drawdown interference, additional streamflow capture, and attendant degradation of local surface water and ecosystem quality. Longer term, it is conceivable that inadequate local water supplies will limit growth and development opportunities without utilizing new sources of water. Thus, it would be prudent for these communities to consider options that go beyond aggressive demand management. For more information, the reader is referred to the 2010 ISWS report titled, Opportunities and Challenges of Meeting Water Demand in Northeastern Illinois. 43
60 Chapter 2 Framework for Regional Water Supply Planning and Management Water Quality and Aquatic Ecosystems Water Quality Considerations Issues of water quality are inseparable from issues concerning water supply. 113 Perhaps this is most obvious, though not exclusive to, the public supply water use sector. Water utility compliance with the Safe Drinking Water Act aside, the quality of raw surface or groundwater is always a concern relative to the treatment technology necessary and its associated cost. Water quality is also an important consideration from the standpoint of aquatic ecosystems; the health of which depends in large part on protection from pollutants and other water-related threats to ecosystem integrity. Water quality is inextricably linked to land use with the latter exerting tremendous influence on the chemistry, timing, and quantity of surface runoff. Increasingly, land use is shown to influence groundwater quality as will be shown below. Nonpoint-source pollution is the phenomenon that imprints surface water quality with the signature of land use in the upstream watershed. Any program to protect water quality, therefore, will involve well thought out land-use management practices, frequently referred to as best management practices or BMPs, that seek to avoid degradation before the activity takes place. Additionally, mitigation activities will be ongoing indefinitely in an effort to fulfill the promise of the Federal Water Pollution Control Act (aka Clean Water Act, P.L ). Regional water quality is the shared responsibility of local governments throughout northeastern Illinois. CMAP, the designated Areawide Planning Agency for the 7-county northeastern Illinois region, is responsible for developing the regional water quality plan known as the Section 208 Plan. A CMAP predecessor agency, the Northeastern Illinois Planning Commission (NIPC), was given the original responsibility for developing a Section 208 plan the Areawide Water Quality Management Plan in 1975 by Governor Dan Walker. CMAP has inherited this responsibility and is charged with not only explaining what needs to be done to remedy regional water pollution problems, but should also explain how it can be done and by whom and at what cost. 114 An acceptable areawide plan should provide realistic strategies for solving most, if not all, of a region s water quality problems. 115 The plan is obligated to outline both technical and management strategies for eliminating pollution from both point and nonpoint sources, for protecting groundwater, and for disposing of residual wastes. Unlike other CMAP plans, the areawide plan is not simply advisory, but rather backed by the full power of the Clean Water Act and its stated objective to restore and maintain the chemical, physical, and biological integrity of the Nation s waters. 116 In other words, the areawide plan is enforceable through the incorporation of its policies into the regulations of the IPCB and the policies of IEPA. The areawide plan can also be enforced indirectly by U.S. Environmental Protection Agency (U.S. EPA) through the federal grant application process for wastewater management planning and wastewater treatment plant construction where conformance with the areawide plan is a requirement of grant application approval. 117 Other state programs, notably those administered by the IEPA Bureau of Water are the primary regulatory mechanisms by which water quality is protected throughout the state. For example, point-source discharges are governed under the National Permit Discharge Elimination System (NPDES) administered by IEPA. Nonpoint-source pollution is the most vexing problem that threatens surface-water quality and the primary tool for mitigating or preventing nonpoint-source pollution is watershed-based planning. IEPA funds watershedbased planning through Section 319 of the Clean Water Act. CMAP is very often involved in watershed plan development throughout the region This connection was highlighted during the summer of 2007 when British Petroleum announced plans to expand its refinery in Whiting, Indiana and increase its discharge of ammonia and sludge 54% and 35% respectively into Lake Michigan. While the state of Indiana agreed to issue a permit for the increased release of pollutants and the refinery was still going to meet federal water pollution guidelines, the issue met with a resounding public backlash as it represented the first time in years that a company had been granted approval to discharge greater amounts of contaminants into Lake Michigan, the region s most significant source of drinking water. 114 NIPC, 1979 (as amended). Areawide Water Quality Management Plan. Volumes 1 and Ibid. Vol. 1, pg Federal Water Pollution Control Act (P.L ; 33 U.S.C et seq.). The quotation comes from TITLE I Research and Related Programs, Declaration of Goals and Policy, Section 101. (a). 117 Ibid See 44
61 The Clean Water Act of 1972 mandates that every state develop an antidegradation policy and identify methods for implementing such policy. The goal of the policy is such that instream-water uses and the water quality necessary to protect existing uses are to be maintained and protected. Furthermore, where water quality exceeds that necessary to support aquatic life and recreation in and on the water, that quality shall be maintained and protected to allow such degradation of lower water quality unless to accommodate important economic or social development in the area in which the waters are located. Should this occur, water quality must still be sufficient to fully protect existing uses. States are also expected to use the highest statutory and regulatory requirements for all new and existing point sources and all cost-effective and reasonable best management practices for nonpoint-source control. 119 Other requirements address waters associated with outstanding national resources and potential water quality impairment associated with a thermal discharge. Illinois developed an antidegradation policy in The purpose of state policy closely follows that laid out in the federal regulation described above, but provides more detail including an opportunity to designate certain waters of the state as Outstanding Resource Waters. While there have been no Outstanding Resource Waters designated by the State, Illinois antidegradation policy holds much promise. The antidegradation policy in and of itself, however, does not guarantee the level of water-quality protection promised. Enforcement of the policy is a critical requirement in order for the promise to be fulfilled and water quality protection provided. IEPA has primary responsibility for policy enforcement with the IPCB providing additional oversight. In an early test of IEPA s ability to assure compliance with antidegradation policy while granting an NPDES permit to a municipal wastewater treatment plant, the Appellate Court of Illinois, Third District, concluded that IEPA neglected to properly consider the regulatory standards prohibiting the degradation of Illinois waters set forth in section of Title 35 of the Code, 35 Ill. Adm. Code Thus, the court decision supported previous action taken by the IPCB, in response to a third-party NPDES permit appeal, to remand the permit back to IEPA for further review of those standards. In this case it took a vigilant collaboration of third parties, and over 5 years of contesting the original decision, to ensure that a sound policy and its rules for implementation were properly followed. Regional water supply planning holds promise for complementing the existing regulatory structure for protecting water quality by offering new possibilities for stewardship. For example, new initiatives to map and plan for sensitive aquifer recharge areas (e.g., McHenry County) could provide a new level of protection for groundwater at a subregional scale. Other counties can follow suit and collectively provide a regionalscale effort to protect sensitive aquifer recharge areas. Another example of a water quality issue with water supply implications is chloride (salt) concentrations in groundwater. While chloride has been identified as the potential cause of impairment for 318 stream miles (surface water) in the State of Illinois, 122 contamination of groundwater by chlorides has also been found to be harmful to wetlands and the biodiversity they provide to society. 123 For example, research conducted on high quality fens in the planning region shows how sensitive fen vegetation is to contamination by private septic systems and road salt. 124 The primary focus of discussion below, however, will be on chloride in groundwater used as a source of drinking water. 119 Code of Federal Regulations, Title 40 Protection of Environment, Ch. 1 Environmental Protection Agency, Antidegradation Policy. 120 Illinois Administrative Code, Title 35: Environmental Protection, Subtitle C: Water Pollution, Chapter 1: Pollution Control Board, Part 302 Water Quality Standards, Antidegradation. 121 Illinois Environmental Protection Agency and The Village of New Lenox v. Illinois Pollution Control Board, Des Plaines river Watershed Alliance, Prairie Rivers Network, and Sierra Club. No Filed October 7, 2008 in the Appellate Court of Illinois, Third District. 122 Illinois EPA, Illinois Integrated Water Quality Report and Section 303(d) List IEPA, Bureau of Water. IEPA/BOW/ See pdf. 123 A summary of the deleterious effects of chloride-contaminated groundwater on wetlands can be found in: County of McHenry, Illinois: Groundwater Resources Management Plan. Report 5, Chlorides and Agricultural Chemicals: Problem Assessments and Corrective Actions. Final, November Prepared by Baxter & Woodman, Inc., Crystal Lake, Illinois. See Docs/Report05.pdf. 124 S.V. Panno, V.A. Nuzzo, and K. Cartwright, Impact of urban development on the chemical composition of ground water in a fen-wetland complex. Wetlands 19(1):
62 Chapter 2 Framework for Regional Water Supply Planning and Management At present concentrations, chloride in drinking water is not a health hazard, but it is a useful indicator of contamination. At the federal level the secondary drinking water standard for chloride is 250 milligrams per liter (mg/l). In Illinois, a numeric standard of 250 mg/l has been established for identifying cause of impairment of Public and Food Processing Water Supply use in streams, inland lakes, and Lake Michigan. The numeric standard established for identifying chloride impairment of Aquatic Life use in streams and inland lakes is much less conservative: 500 mg/l. In a statistical study of shallow groundwater in the six northeasternmost counties of the region, ISWS researchers have determined that chloride levels have increased significantly since the 1950s. 125 While chloride is a common contaminant from sewage waste (e.g., septic tank effluent) and landfills, of most importance in the metropolitan region is road-salt runoff during winter. 126 Study results show that with each successive 10-year time period, chloride concentrations were significantly greater than the previous period. The greatest concentrations were found in the western collar counties. In DuPage County, for example, the median value of chloride increased from 4 mg/l prior to 1950 to 101 mg/l in samples collected from 1990 to Table 8 provides data from wells at different depths in other counties studied that rely heavily on groundwater. The data illustrate considerable increases in chloride concentrations have occurred during the latter half of the 20th century and of late, particularly in shallower wells. Table 8: Median concentrations (mg/l) of chloride in shallow groundwater during two different sampling periods County Well depth: < 100 ft. Well depth: ft. < 1950 s < 1950 s Kane McHenry Will Source: Data from Kelly and Wilson, 2008 (see footnote 144). The median chloride concentration of all samples taken from the six counties studied, increased from 6 mg/l prior to 1950 to about 20 mg/l in samples collected from 1990 to Aggregating the data across all six counties, however, masks the spatial variability found in chloride concentrations due to anthropogenic factors such as the degree of major highway and street curbing and natural factors including the presence of more significant and shallower sand and gravel deposits found in McHenry, Kane, Will, and DuPage counties. For example, wells sampled in the more urbanized eastern third of Kane County are found to have higher chloride concentrations than samples taken from the central and western thirds. For the four counties listed above, 43% of sampled wells have rate increases greater than 1 mg/l/yr and 15% have increases greater than 4 mg/l/yr. Chloride concentrations in about 24% of samples collected from public supply wells in the Chicago area in the 1990s were greater than 100 mg/l (35% in the collar counties) as compared to median concentrations of less than 10 mg/l prior to Changes in Shallow Groundwater Quality in the Chicago Region in the Past 50 Years Illinois State Water Survey, Champaign, IL page 4. See Also see, Walton R. Kelly and Steven D. Wilson, An Evaluation of Temporal Changes in Shallow Groundwater Quality in Northeastern Illinois Using Historical Data. Illinois State Water Survey, Center for Groundwater Science. Champaign, IL. Scientific Report Ibid According to the Salt Institute, more than 40% of dry salt produced in the United States is used for highway deicing. See 46
63 Scientists conclude that even if all sources of pollution were eliminated immediately, peak concentrations of surfacederived dissolved contaminants will be much higher in the future than they are currently due to groundwater travel times and high-volume well withdrawals (where they exist). Secondly, where curbing is absent in the City of Chicago, chloride concentrations in shallow groundwater were found to reach extremely high levels: > 3,500 mg/l. If new stormwater management techniques involve maximizing infiltration and minimizing runoff, and the quality of recharge to groundwater is poor, then solving one problem (reducing stormwater runoff ) will likely create another (degrading groundwater quality). 128 Removal of chlorides from raw groundwater requires reverse osmosis technology that is expensive and can create a new water quality problem of its own via the creation of highly saline effluent. Thus, given the expected increase in demand for shallow groundwater in order to meet drinking water needs and other uses, and the expense of treatment, the trend towards deteriorating groundwater quality in shallow aquifers is a concern that warrants prompt attention. Nutrients, particularly nitrogen and phosphorus compounds, are common causes of water-quality degradation and designated-use impairment when present in excessive levels in Illinois streams and lakes. Elevated levels of nutrients stimulate the growth of green plants, notably algae. When green plants die, decomposition follows where organisms that break down the plants use up the oxygen dissolved in water. High levels of biological oxygen demand and resultant low levels of dissolved oxygen can kill fish and other aquatic organisms including benthos (i.e., bottom-dwelling organisms). In low oxygen level waters, only the most pollution tolerant species can survive. The situation described above is called eutrophication; a fairly widespread phenomenon that can be naturally occurring, a part of the normal aging process of many lakes and ponds, but is more commonly cultural in source: the result of anthropogenic activities. Lake Erie in the 1960s and 1970s was a well publicized example of cultural eutrophication. Leading causes of cultural eutrophication include runoff from agricultural land including tile drainage, urban stormwater that captures fertilizers in runoff from lawns, and wastewater-treatment plant (WWTP) discharges. The term eutrophic is generally reserved for lakes as it describes a terminal-trophic status. It is not appropriately assigned, therefore, to flowing waters streams where such a condition is described as nutrient enrichment. 129 In Illinois, total phosphorus is a leading cause of impairment in streams and is the most ubiquitous cause of impairment in inland lakes. 130 Total nitrogen was also listed as a leading cause of stream impairment until IEPA s recent decision to stop using total nitrogen as a cause of impairment for aquatic life use. IEPA s decision rests on several points: there is no standard for total nitrogen related to aquatic life, there is a lack of total nitrogen data for streams, and the methods, criteria, and manner in which nitrogen was previously reported as a cause of impairment of aquatic life is no longer thought to be scientifically valid. 131 In any event, a high priority of U.S. EPA is to support state development of numeric nutrient water quality standards to assist in achieving target reductions in excess nitrogen and phosphorus that impair waterbodies. 132 More recently, U.S. EPA has determined that States alone cannot be relied on to ensure that numeric nutrient standards are established Ibid H.B.N. Hynes, The enrichment of streams, pgs in Eutrophication: Causes, Consequences, Correctives. Proceedings of a Symposium. National Academy of Sciences: Washington, D.C. 130 Ibid. 122, as measured by number of impaired stream miles. 131 Ibid U.S. EPA, National Water Program Guidance. Office of Water, Fiscal Year See U.S. EPA, Office of Inspector General EPA Needs to Accelerate Adoption of Numeric Nutrient Water Quality Standards. Evaluation Report No. 09-P See 47
64 Chapter 2 Framework for Regional Water Supply Planning and Management Primary sources of impairment in Illinois include agricultural crop production, municipal point source discharges (i.e., WWTPs), and urban runoff/storm sewers. Dissolved Oxygen, or lack thereof, (i.e., insufficient levels to support aquatic life) is also a leading cause of stream and inland-lake impairment, affecting more Illinois stream miles than all other causes of impairment except for fecal coliform. To control eutrophication, U.S. EPA recommends a limit of 0.05 mg/l for total phosphates in streams that flow into lakes and 0.1 mg/l for total phosphorus in rivers and streams. 134 Illinois is presently without numeric water quality standards for both total phosphorus and total nitrogen. There is a numeric standard for nitrate nitrogen (10 mg/l) that only applies to waterbodies where the Public and Food Processing Water Supply designated use occurs. This use applies to portions of both the Fox and Kankakee Rivers, but the standard is rarely exceeded. Thus, while the primary issue concerns the deleterious impacts of elevated nutrient levels on aquatic life, nutrient loading remains a major concern for community water supplies that depend on river water. 135 Another potential threat to water quality with water supply implications concerns pharmaceuticals and personal care products (PPCP). 136 Pharmaceuticals and personal care products have very likely been around for decades, but only more recently have analytical instruments been able to detect such bioactive chemicals in the relatively trace quantities that they are currently found in our nation s waterbodies. PPCPs refer to products used by people for personal health or cosmetic reasons, or products used by agribusiness to either enhance growth or protect health of livestock. PPCPs include thousands of chemical substances including prescription and over-thecounter drugs (for people and animals alike), fragrances, and cosmetics. Research suggests that some of these substances may cause ecological harm. To date, there is no evidence of adverse human health effects from PPCPs in the environment. Readers are encouraged to learn more at U.S. EPA s website. U.S. EPA has a process for evaluating the universe of unregulated contaminants which are known or are anticipated to occur in public water systems. The drinking water Contaminant Candidate List 3 includes 116 unregulated contaminants,137 some of which may require a national drinking water standard following additional data collection and research. Included among them are ten pharmaceuticals. 138 Lastly and insofar as Lake Michigan is the single largest source of drinking water in the region, this plan could be remiss to neglect discussion of water quality issues as they relate to the region s primary supply of water. Lake Michigan is vulnerable to many contaminants including those that fall from the sky and originate from anywhere on the planet. Critical pollutants include Polychlorinated Biphenyls (PCBs), mercury, DDT and metabolites, chlordane, dioxin, and pathogens (E. coli, Cryptosporidium, Giardia, and Salmonella). There are numerous other pollutants of concern and several more on a watch list. 139 Given the initial focus of this regional water plan and the fact that recommendations to follow will not be centered on issues of Lake Michigan water quality, the reader is referred to the Lake Michigan Lakewide Management Plan (LaMP). 140 The LaMP represents the plan to restore and maintain the chemical, physical, and biological integrity of the waters of the Great Lakes Basin ecosystem as agreed to under the Great Lakes Water Quality Agreement between the U.S. and Canada David W. Litke, Review of Phosphorus Control Measures in the United States and Their Effects on Water Quality. U.S. Geological Survey, Water-Resources Investigations Report National Water-Quality Assessment Program. See IL EPA and USGS, Source Water Assessment Program Fact Sheet: Aurora, Kane County. IL EPA and USGS, Source Water Assessment Program Fact Sheet: Elgin, Kane County. 136 U.S. EPA, See chemicals or chemical groups and 12 microbiological contaminants 138 U.S. EPA, Office of Water, See U.S. EPA, Great Lakes National Program Office, Lake Michigan Lakewide Management Plan (LaMP) 2008 Status Report. See U.S. EPA, Great Lakes, Lake Michigan. See Ibid. 48
65 Wetlands/Riparian Area Protection Wetlands and riparian areas are two types of aquatic ecosystems that are intimately tied to the rivers and groundwater that also often serve as community water supplies. Historic land-use change, including conversion to agriculture, has unfortunately resulted in Illinois having lost 90% of our original wetland acreage. 142 Riparian areas have not fared much better. 143 Conversion of wetlands and riparian communities has reduced or eliminated the life support services known as nature s services or ecosystem services that these ecosystems provide. 144 The significance of these phenomena has been highlighted in the context of global gross national product. According to research on the value of global ecosystem services to humanity, the contribution of wetlands has been estimated to be $4.9 trillion while the services provided by lakes/river/riparian ecosystems have been estimated at $1.7 trillion. Together, wetland and riparian ecosystems represent about 20% of the total global flow value. 145 Both types of aquatic ecosystems will be discussed below in a context relevant to water supply planning. The ecosystem service value of wetlands to society is provided through wetland functioning (or function): flood mitigation, storm abatement, water-quality improvement, biogeochemical cycling, aquifer recharge, aesthetics, habitat maintenance for commercially important species, and general subsistence. 146 Acknowledging that wetlands also have intrinsic value, here we will focus on the hydrology of wetlands and its relevance to regional water supply planning. 147 Hydrologic conditions are critical for the maintenance of wetland structure and function. 148 Wetlands are transitional between terrestrial or relatively more upland parts of a landscape and open-water ecosystems that are typically found in the lowest areas. Given the ecotonal nature of wetlands, small changes in hydrology can result in large and significant biotic changes. An attendant outcome of such can be compromised ecosystem services provision and a loss of that which society values. The understanding of wetland hydrology has advanced considerably due to sustained scientific scrutiny over the past few decades. As for the relationship with groundwater, wetlands can feature either a recharge or discharge function and also exhibit flow-through (i.e., receive and discharge water from and into the ground) characteristics depending on such factors as variations in climate, position within the landscape, configuration of an associated water table, and the type of underlying geological substrate. Wetland hydroperiod (i.e., the seasonal pattern of the water level) is often an indication of flow direction or discharge-recharge interactions. 149 The geology of northeastern Illinois has resulted in it being home to a rare class of wetlands called fens. This peat-accumulating wetland-community type is dependent on the discharge of cool, alkaline, mineral-rich groundwater in the form of seeps and springs. The integrity of fens is dependent on watershedprotection measures that influence fen hydrology. Among other measures, this will include identification and conservation of groundwater-recharge areas that ultimately deliver water to fens Mary R. McCorvie and Christopher L. Lant, Drainage district formation and the loss of Midwestern wetlands, Agricultural History 67(4): Estimates of presettlement riparian vegetation loss vary from two-thirds to over 80%. See, Bryan L. Swift, Status of riparian ecosystems in the United States. Water Resources Bulletin 20(2): See also, Mark M. Brinson et al Riparian Ecosystems: Their Ecology and Status. Eastern Energy and Land Use Team, National Water Resources Analysis Group, US Fish and Wildlife Service. Kearneysville, WV. FWS/OBS-81/ Gretchen C. Daily (editor), Nature s Services: Societal Dependence on Natural Ecosystems. Washington, DC: Island Press. 145 Robert Costanza et al The value of the world s ecosystem services and natural capital. Nature 387 (15 May 1997): William J. Mitsch and James G. Gosselink, Wetlands, Second Edition. New York, NY: Van Nostrand Reinhold. Also, Mark M. Brinson, Changes in the functioning of wetlands along environmental gradients. Wetlands 13(2) Special Issue: For more on Intrinsic versus Extrinsic Value, the reader is referred to an entry on this subject in the Stanford Encyclopedia of Philosophy. See Ibid Ibid. 146 Also, USGS Northern Prairie Wildlife Research Center. See Ibid Also, see Illinois Natural History Survey. See 49
66 Chapter 2 Framework for Regional Water Supply Planning and Management Instream-Flow Protection Riparian wetlands, ecosystems that are influenced by an adjacent river or stream, are unique for many reasons: their linear form due to their association with rivers and streams, their exposure to lateral-water flow, they occupy a position in the landscape that acts as a zone of convergence for watershed energy and material in amounts greater than upland ecosystems, and they serve as a vital link to both upstream and downstream communities. 151 Riparian ecosystems provide similar services as enumerated above in addition to corridors for species movement, refugia for upland species, and habitat for endangered and threatened species. 152 Furthermore, the recreation-driven economic value of riparian land use has long since been noted. 153 The primary relevance of riparian wetlands or the riparian zone to water supply planning, however, stems from their effectiveness as pollutant sinks (i.e., nutrients and sediment) if properly managed. This is particularly true with respect to headwater streams where the source of water in flood events and the manner in which water is delivered to the riparian-wetland surface is dominated by riparian transport versus overbank transport. 154 These concepts and matters particular to riparian areas are very important within the Fox River Basin and Kankakee River Basin as both rivers provide drinking water to multiple communities and thousands of people in northeastern Illinois. Furthermore, reliance on inland-river water as a source of public-water supply is expected to only grow. Thus, more careful management of riparian areas is warranted from a water supply perspective. Historically, water left in a stream and unappropriated for human use was considered a waste of the resource. That freshwater ecosystems provide society with economic, environmental, and aesthetic benefits has only recently been acknowledged by scientists, water managers, the general public, and policy makers. 155 As regional demand for water grows, the need to leave sufficient water in the inland rivers used as water sources Fox River and Kankakee River must be considered. What follows below is an overview of the history of this issue. Illinois has pursued some form of instream-flow protection since the 1970s. Interest in protecting instream flows was sparked in part by the energy crisis of the 1970s and the drought of Over the past several decades, Illinois saw various legislative efforts that were designed to protect instream flows, but rather than any emergent laws, participating state agencies developed a comprehensive research and planning program instead. The University of Illinois-Department of Civil Engineering, the ISWS and the Illinois Natural History Survey all once received funding to participate in this program. As interest grew, the Illinois State Water Plan Task Force took the issue under consideration during their planning activity in the early 1980s in preparation for the State Water Plan of A 1982 workshop conducted by the Task Force proposed three action items: 1) Develop and seek approval of an instream flow policy statement for the State of Illinois. 2) Develop a short and long term planning and research agenda for instream flows. 3) Prepare a draft report recommending an interim instreamflow protection planning standard for the State of Illinois Ibid. 143 (Brinson et al. 1981) 152 George P. Malanson, Riparian Landscapes. Cambridge, MA: Cambridge University Press. 153 George S. Wehrwein, The economic phases of riparian land use, in A Symposium on Hydrobiology. Madison, WI: The University of Wisconsin Press. 155 See Going with the Flow: Preserving and Restoring Instream Water Allocations by David Katz in Peter H. Gleick et al. The World s Water : The Biennial Report on Freshwater Resources. Washington, DC: Island Press. 156 Report of the Illinois Instream Flow Protection Committee, April 30, Prepared by the Illinois Instream Flow Protection Committee, page Ibid. 146 (Brinson, 1993:67) The ratio of riparian transport to overbank transport decreases rapidly from upstream (i.e., low-order headwater streams) to downstream. Riparian transport is the movement of water from the upland to the floodplain by nonchannelized flow and by groundwater contributions to quickflow following storm events. Overbank transport is flooding that occurs when river/stream discharge exceeds bankfull capacity. 50
67 Guided by these action items, the Task Force adopted an instream-flow-protection policy stating that: The State of Illinois finds that the public health and safety, the water quality, the riverine flora and fauna, the aesthetic qualities and the recreational potential of the rivers of Illinois are dependent in substantial measure upon the protection of reasonable flows in the rivers of the State. and, therefore, that the protection and maintenance of such flows is in the public interest. and, further, that the mutual and coordinated action of the agencies of the State of Illinois is essential to the protection of reasonable rates of flow. In accordance with these findings, it is the policy of the State of Illinois that the protection of reasonable Instream flows be pursued through appropriate regulatory, planning and advisory authorities of the State and further that specific values of reasonable Instream flows for the rivers of Illinois be established and periodically reviewed. 157 Additionally, a report released by the Illinois State Water Plan Task Force in 1983 titled, Special Report No. 6, Instream Flow Protection: A Planning Standard for Illinois Streams outlined criteria for an interim planning standard. Based on recommendations, input from the 1982 workshop, and analyses of alternative standards, an interim standard was shaped as follows: The flow available in a stream for offstream use (either storage or withdrawal) is the maximum value of either the streamflow minus the 75% duration flow or the difference of the streamflow minus the seven-day/ten-year low flow divided by two. 158 Furthermore, the 1984 State Water Plan recommendations included consideration of Instream-flow protection and acknowledged the relationship between increased water resource development and the need to protect the ecology of streams through protected or minimum stream flows. The 1984 State Water Plan, therefore, raised awareness among state agencies of instream-flow protection needs. Another important development occurred in 1984: the Illinois Department of Conservation (now the IDNR) accepted the 7-day, 10-year low flow (Q7,10) as the protected flow level for Public Waters of the State. 159 The Q7, 10, an idea proposed in the 1982 workshop, is the lowest flow expected for a 7-day period once in every ten years and serves as an interim surrogate value where there is insufficient information to define instream flow needs. 160 The Fox and Kankakee Rivers are considered public waters and thus, have state protected minimum-instream flows. The region s protected public waters are illustrated in Figure 13. In 1989, Governor James R. Thompson signed Public Act into law. 161 This act empowered the Illinois Department of Transportation to establish a committee to study instream use conflicts within Illinois and identify a program for the protection and management of the instream flow resources of the state. The Instream Flow Protection Committee was formed and included representatives from the Department of Conservation, Department of Agriculture, IEPA, State Geological Survey, ISWS, State Natural History Survey, the field of civil engineering, industrial water users, agricultural water users, and municipal water users. In accordance with the legislation, the committee s plan was presented to the Governor and General Assembly on April 30, This document, the Report of the Illinois Instream Flow Protection Committee, provides a state history of instream flow, 16 white papers on related topics, legislative con- 157 Ibid. 158 Ibid Public Waters of the State are defined in 17 Illinois Administrative Code, Chapter 1, Section H. Vernon Knapp, Senior Hydrologist, Center for Watershed Science, Illinois State Water Survey. Presentation titled Northeastern Illinois Streams: Factors that Affect the Distribution and Availability of Streamflow for Water Supply and Instream Needs presented on May 22, See Introduced as House Bill 1196 by Helen Satterthwaite, an Act to amend the Civil Administrative Code of Illinois, approved March 7, 1917, as amended, by adding Section 49.06f. 51

68 Chapter 2 Framework for Regional Water Supply Planning and Management Figure 13: Public water bodies in northeastern Illinois 52
69 siderations and key issues and questions. Although no formal instream-flow protection program was produced, the majority of committee members agreed on several key issues. 1) Instream flows are a valuable resource in Illinois and that the maintenance of the fishery and aquatic resources, recreation, navigation and water quality depends to a large degree on the quantity of water flowing in the rivers and streams of the state. 2) Instream-flow protection should be extended to more than just public waters. Currently public waters only include about 8% or 2,504 miles of the total stream miles (33,000 miles) in the state. 3) The need for a comprehensive system for the registration and reporting of water withdrawals to identify and monitor instream-flow management problems. Other efforts followed to designate a protection level based on best use, setting the requirement on the highest flow use. For example, in 1995, the State Protected Streams Work Group of the State Water Plan Task Force introduced stream protection through the identification of unique flora, fauna and biological diversity specific to certain stream segments. However these criteria are not currently integrated into any existing regulations. Today, potential remains to strengthen protection and management of the state s waterways especially in consideration of nonconsumptive uses including recreation and aquatic life support. 162 Building on the foundation developed over the last several decades, the state and regional planning initiative can consider instream-flow protection in a new context regarding four major needs of instream flows: water supply, aquatic habitat and biological health, navigation, and recreation. These needs will now be discussed in that order. Flow management will be especially crucial for the Fox and Kankakee Rivers as future growth is expected to increase demand for river water anywhere from 63 mgd under the LRI scenario to as much as 232 mgd under a MRI scenario. 163 Currently these two rivers provide 14% of the region s water supply. 164 Additionally and as already noted, there is potential to rely more heavily on Fox River water as a means to lessen the impacts of current and/or new groundwater withdrawals. Flow levels in regional rivers and streams cannot be managed independent of shallow groundwater withdrawals and knowledge of the hydraulic connection between groundwater and surface water. In Illinois groundwater contributes at least 25% to the total stream flow. 165 The relationship between groundwater and surface water varies depending on the weather conditions. In drier periods, groundwater tends to provide a very high percentage of streamflow compared to wet periods when rivers and streams are dominated by surface runoff. During dry periods or drought, a time when human water-use demands are often greatest, groundwater may be the only available source of water to streams. 166 Urbanization and other land-use factors also affect the hydrologic relationship between groundwater and surface water. In light of recent evidence that shows reductions in natural groundwater discharge to streams caused by groundwater pumping, 167 the relationship between these two components of the hydrologic cycle will likely receive greater scrutiny going forward. Managing for instream-flow protection, therefore, will remain an important component of regional water supply management. 162 Report to the Interagency Coordinating Committee on Groundwater, December 20, 2002 from the Subcommittee on Integrated Water Planning and Management with Recommendations Pursuant to Executive Order Number 5, 2002, page Ibid. 31. The demand scenario numbers do not include new withdrawals such as has been suggested possible by the ISWS. 164 Ibid. 31. (2005 Normal withdrawals excluding once-through power generation.) 165 Herzog, Beverly L. and Paul R. Seaber. Ground-Water and Surface-Water Relationships in Illinois. Illinois State Geological Survey, October 24, White Paper Executive Summary compiled in Report of the Illinois Instream Flow Protection Committee, April 30, 1991 prepared by the Illinois Instream Flow Protection Committee, page Ibid. 167 Meyer, S.C., H.A. Wehrmann, H.V. Knapp, Y-F Lin, F.E. Glatfelter, D. Winstanley, J. R. Angel, and J.F. Thomason Opportunities and Challenges of Meeting Water Demand in Northeastern Illinois. Prepared for the Northeastern Illinois Regional Water Supply Planning Group by the Illinois State Water Survey and Illinois State Geological Survey (Institute of Natural Resource Sustainability, University of Illinois, Urbana-Champaign) under contract to the Office of Water Resources, Illinois Department of Natural Resources (In preparation). See 53
70 Chapter 2 Framework for Regional Water Supply Planning and Management Instream-flow levels also influence water quality, affecting temperature and dissolved oxygen among other parameters. Issues of water quality and quantity are both important in providing for aquatic habitat and the overall biological health of rivers and streams. Wetlands and streams, while products of the hydrologic cycle and a natural flow regime respectively, are vulnerable to anthropogenic causes of hydrologic change. Unnatural changes in water levels, either too much or too little, threaten native species survival and encourage establishment of exotic species. Normally functioning aquatic ecosystems yield a variety of ecosystem services that are valued by society and thus, convey important benefits to society. 168 The social value of ecosystem services is rarely accounted for in traditional cost/benefit analysis. The flow-regime needs of fish and wildlife are often different from each other and typically vary by season and lifecycle stage. For this reason, flow requirements for fish and wildlife typically mimic the natural flow requirements to maintain habitat. 169 In addition, instream-flow protection can be achieved through the necessity to protect a specific species or its habitat. For example, the IPCB through revisions to the Anti-degradation Rules, Section , may designate a water body or water body segment as an Outstanding Resource Water and list it in Illinois Administrative Code if it finds that the water body or water body segment is of uniquely high biological or recreational quality and if the benefits of protection from degradation outweigh the benefits of lost economic or social opportunities. 170 Documentation of lost economic and social opportunities is required and therefore this revision may have limited use in the state. Regardless, ecosystem needs are an important component in determining instream flows and further study is needed to improve understanding of environmental flow requirements. 171 Navigational needs are protected for public bodies of water as defined by the 17 Illinois Administrative Code Part 3704 which protects obstruction to, or interference with, the navigability of any public body of water. The Chicago River, for example, is a protected-public waterbody and provides for the navigational needs of barges, recreational boats, canoes and kayaks as well as tourism-orientated activities. The multi-purpose nature of the Chicago River and other rivers of the region rely on a water level that is sufficient for providing a functional/navigable waterway. The Illinois Waterway 172 must maintain a minimum nine-foot depth for navigation. 173 Recreation is a well established public interest, an economic industry, and must be a consideration of instream-flow protection. 174 River-based recreation is predicated on a minimum depth of water (Table 9). Table 9: Water depth requirements per recreational activity Safe Depth (ft) Optimum Depth (ft) Minimum Width (ft) Power boating/fishing Sail boating Row boating/fishing Canoeing Source: U.S. Fish and Wildlife Service. Methods of Assessing Instream Flows for Recreation, Instream Flow Information Paper #6, Ecological Society of America (2009, February 5). Ecologists Report Quantifiable Measures Of Nature s Services To Humans. Science- Daily. Retrieved March 31, Also: Robert Costanza et al The value of the world s ecosystem services and natural capital. Nature 387 (15 May 1997): Bill Bertrand, Edwin E. Herricks, Steven L. Kohler, Lewis L. Osborne. Environmental Considerations in Instream Flow Analysis: Issues of Habitat, Habitat Assessment, Ecology, and Fisheries Protection. White Paper Executive Summary compiled in Report of the Illinois Instream Flow Protection Committee, April 30, 1991 prepared by the Illinois Instream Flow Protection Committee, page Report to the Interagency Coordinating Committee on Groundwater, December 20, 2002, from the Subcommittee on Integrated Water Planning and Management with Recommendations Pursuant to Executive Order Number 5, 2002, pages The ISWS has conducted analysis to define streamflow frequency for protected flow levels, as presented in two reports, Pertinent Considerations in the Development of Protected-streamflow Criteria for Illinois Streams (Contract Report 431) and Information on Availability of Water for Withdrawals from Illinois Streams at Various Protected-flow Levels (Contract Report 414). 172 Includes the Illinois River, lower Des Plaines River south of Lockport Lock and Dam, Chicago Sanitary Ship Canal, Calumet-Sag Channel, South Branch Chicago River, and Little Calumet and Calumet Rivers to turning basin 5 near the entrance to Lake Calumet. 173 See, Science and Planning on the Upper Mississippi River and Illinois Waterway: Highlights of the National Academies Reports on Managing the Nation s Largest Lock and Dam System. National Research Council of the National Academies, See 54
71 Water-based recreational activities are typically found concentrated on select water bodies. For example, the Chain-o-Lakes in McHenry and Lake County accommodate nearly 60,000 people on summer weekends. 175 The 2,793 acre state park and adjoining 3,230 acre conservation area connects 10 lakes and the Fox River. 176 Without appropriate instream flows, recreational activities would not be possible. Reservoirs, diversions, and navigation works manipulate the water supply in rivers and streams as seen in the relationship between the Fox River and the Stratton Dam. Releases from the Stratton Dam have caused increased low flows in the Fox River. Finally, climate variability and change will very likely influence precipitation patterns, the frequency and severity of droughts, and affect streamflow. For example, since 1970 northeastern Illinois has experienced a 10% increase in precipitation leading to a 35-40% increase in average streamflow. 177 Adding to the variability, flow levels will fluctuate depending on the amount of withdrawals and discharge of wastewater effluent. There are multiple withdrawal and effluent discharge sites along with Fox River; Elgin alone withdraws 12.5 million gallons a day from the Fox River. 178 Additionally, the assimilation of wastewater and potential for new wastewater treatment improvements will help shape the potential of the Fox River as a more prominent water source. 174 Jan Arbise. Recreation. Illinois Department of Conservation. White Paper compiled in Report of the Illinois Instream Flow Protection Committee, April 30, 1991 prepared by the Illinois Instream Flow Protection Committee, pages ChainOLakes.com. See IDNR, See HTM. 177 Ibid Ibid

72 Chapter 3 Land and Water Prairie Crossing, Grayslake, Illinois 56 Image courtesy of CMAP staff
73 Chapter 3 Land and Water Relationship between Land Use Decisions and Water Resources Metropolitan areas grow over time and develop across increasing amounts of regional space, largely the result of numerous locally or independently made land-use change and development decisions. In the case of northeastern Illinois, historic growth and development has led greater Chicago to be the third largest metropolitan area in the country and one of the most prosperous regions in the world. Regional prosperity is no accident of geography, but rather due in large part to proximity to abundant fresh water supplies that have also been managed to date with world-renowned engineering prowess. Looking forward, regional water supply planning offers new potential to help maintain and even enhance the Chicago region s premier position as a very desirable place to live, work, and locate a new business. Along with the success story and legacy that greater Chicago offers the 21st century, new opportunities beckon that call for greater integration between land use and water use planning and management. New scientific studies described in this report make clear that water supply planning and management must evolve to keep pace with the needs of both current residents and those of millions more new people expected to call this region home in the years ahead. This chapter aims to highlight potential levers and tools to improve integration of water-use and land-use planning and enhance the Chicago region s relationship with water and thus, position in the global economy. Information that follows takes into account the heterogeneity of source water and opportunity to fine tune recommendations that are tailored for subareas within the larger region. Concepts and recommendations made here, much like the entire plan itself, rely on numerous bottomup and voluntary actions. To provide some perspective, this chapter also describes the consequences on local water resources and the regional hydrologic cycle that stem from past activities. Some consequences have manifested more directly and/or immediately (e.g., degraded water quality and designated use impairments) while others are apparently more indirect and delayed over time (e.g., mining of the deep-bedrock aquifer). While there are many challenges that face metropolitan areas, lack of attention to the intersection of land use and water use could pose a threat if there is neither political will nor a plan to better coordinate independent actions in support of regional goals. While wholesale change in the way water is managed is neither necessary nor called for, a steadfast commitment to the status quo is equally undesirable. This is particularly true in the groundwater-dependent subarea of the planning region where, historically, water availability, quality, and delivery has seldom been a constraint on local growth aspirations that couldn t be solved with an eventual switch to Lake Michigan water if necessary. Figure 14 shows the growth in availability of Lake Michigan water over the last 30 plus years. The subarea served by Lake Michigan, a model thus far for compliance with the law that governs its use, must also reimagine its stewardship tactics to not only keep pace with the new conservation-program provisions of the Great Lakes Compact, but continue to solve the future water needs of communities not presently served by lake water. This will require of the Illinois Department of Natural Resources (IDNR) a commitment to an ongoing regional planning process that looks beyond the current Lake Michigan service area to include consideration of the entire 11-county planning region. 57

74 Chapter 3 Land and Water Figure 14: Lake Michigan water use by municipality in northeastern Illinois through time 58
75 The Impact of Land-Use Decisions on Water Resources There are various ways in which land use and water resources intersect to either allow development to continue while sustaining water supplies, or to place an increased burden on a utility and ultimately the customers to secure additional resources. Water resource conscious-growth will insure more sustainable water quality and quantity, healthier ecosystems, lower costs and better air quality, to name a few benefits (Figure 15). By contrast, developments that proceed without consideration for water resources result in water quality and quantity impairments, ecosystem degradation, higher costs and lower air quality (Figure 16). These two figures are conceptual models that explain a relative relationship between two extreme growth scenarios. In most instances, development has proceeded somewhere in between these scenarios which resulted in a variety of impacts on water resources. This is further detailed in the section below that discusses the three main impacts of land use planning on water resources: recharge capacity, per capita demand, and infrastructure availability/cost. 1. Recharge Capacity: Regional growth and urbanization have historically included greater amounts of impervious surfaces (i.e., parking lots, sidewalks, rooftops, driveways, and roads) that are common in developed areas. These hard surfaces block the infiltration capacity of the earth below, causing virtually all the precipitation that falls on these surfaces to become stormwater runoff. Infiltration of precipitation into the ground is a natural process and pathway by which a portion of a precipitation event travels to recharge aquifers, provide baseflow to local streams and rivers, and support other water-dependent ecosystems (e.g., wetlands). As water infiltrates and percolates through the ground, contaminants can be filtered, mediated, or removed and water quality is consequently improved. This insures the capability of communities dependent on shallow groundwater-to sustain their existing populations and accommodate future growth as long as the aforementioned natural processes are allowed to continue unimpeded. The reduction or elimination of infiltration capacity, however, leads to increased run-off which can cause flooding, lower the water table, contaminate surface waters, and negatively impact aquatic ecosystems. If water supplies become either more dependent on treatment due to contamination from run-off or less accessible because of declines in water tables, more resources must be spent to meet demand and secure water supplies at potable standards. This will entail increased energy consumption for more water treatment/pumping and conveyance as well as treatment of the additional wastewater generated. 59
76 Chapter 3 Land and Water Figure 15: Water resource-driven land use decisions Water Resource Conscious Growth Resourcesupported Growth Conservation Design/ Low Impact Water Conservation/Demand Healthy Aquatic Ecosystems Sustained Stream Baseflow Less Energy Consumption/ Lower Greenhouse Gas Emissions Minimal Water Treatment/Pumping Expense Supports Infiltration Adequate Aquifer Recharge Sustainable Wells Figure 16: Non-water resource-driven land use decisions Non Water Resource-driven Regional Growth Aquatic Ecosystem Degradation Increased Funds (for new development) Increased Imperviousness Reduced Stream Baseflow Less accessibility to Groundwater More Flooding More Run-off Less Infiltration Lower Water Table Dry or Contaminated Wells More Pollution of Surface Waters Reduced water quality/ quantity Further Ecosystem Degradation More Energy Consumption More Treatment More Pumping Continue Growth??? Increased Funds (to sustain existing development) Limit Growth??? 60
77 2. Per Capita Demand: Although water supply and land use planning have not historically been well connected, 1 various communities around the nation have more recently studied the relationship between land use decisions and water consumption and established a strong correlation. Development patterns such as housing density, lot size, distance from distribution lines, etc. have increasingly been tied to water use. For example, studies in Utah revealed that water demand increases to 220 gallons per capita per day (gpcd) at a density of 2 units per acre as compared to 110 gpcd at a density of 5 units/acre. 2 A similar analysis demonstrated that the annual water consumption in a 2-person household is 73,000 gallons at a 10 unit/ acre development versus 116,800 gallons for the same size household at a three units/acre district. 3 Household water use at a neighborhood in Sacramento, California, of 46 single-family homes on compact lots was 20 to 30 percent lower when compared to a similar number of households in a suburban setting where lots were larger. In Seattle, homes on 6,500 square foot lots use 60% less water than those on 16,000 foot lots. 4 The Canada Mortgage and Housing Corporation developed a methodology for full cost accounting by measuring several indicators for three urban settlement patterns high, medium and low density. The study showed that if all other factors are held constant, the high density settlement pattern will result in 13% less water consumption than low density one. 5 Thus, from a water-use perspective, housing density matters. 6 In northeastern Illinois, residential water use was studied in order to determine the water-demand effects that would result from geographically different patterns of population growth associated with different types of housing. 7 Several interesting results emerged from this study. First, high variability in per capita water use was found across the sample of 300 municipalities and water systems studied. The mean value of over 4,000 observations spanning 18 years of historical data is 87 gpcd. A statistically significant declining trend of per capita use of 0.62 gallons per capita per year was discovered. This trend is consistent with the estimated conservation trend identified in the Current Trends (CT) scenario (i.e., from the Regional Water Demand Scenarios for NE IL: : Project Completion Report, referred to hereafter as the Demand Report.) While this trend is promising and is the result of passive conservation (i.e., outcomes of the Energy Policy Act of 1992), savings at this rate will be more than offset by new total demand from a growing population. Hence the CT scenario that indicates water demand could grow 36% as population grows 38% by the year Analysis of per capita water-use data by county confirms the expectation that average residential rates of water use tend to be lower in the highly urbanized counties and higher in the collar and outlying counties of the 11-county planning region. An investigation of water systems that show either the highest or lowest rates of residential per capita use finds that higher per capita residential water-use rates tend to be found in affluent communities with low housing densities and homes with residential landscapes. This same analysis finds that lower per capita rates tend to found in communities with average or low income, higher water prices, and higher housing densities. 8 These study results are largely supportive of per capita water use/density relationship studies conducted elsewhere. Furthermore, the analysis of water-demand scenarios confirmed the effects of alternative growth patterns on residential water use, but the relatively small numbers of people assumed to shift would have minimal impact on total water use. 1 Tarlock, Dan A. and Lucero, Lora A Connecting Land, Water and Growth. The Urban Lawyer. Vol.34, No U.S. EPA, January Growing Toward More Efficient Water Use: Linking Development, Infrastructure and Drinking Water Policies. 3 Gallo, D Water Resource Impacts of Low and High Density Residential Developments: A Comparative Analysis. Center for Economic Development, California State University, Chico. 4 Ibid Canada Mortgage Housing Corporation, Assessing the Full Cost of Water, Liquid Waste, Energy and Solid Waste Infrastructure in the Frasier Valley Regional District. Research Highlights, Ottawa, Ontario. 6 The above figures refer to water use by population in the specified acreage. Water use attributed to common open space, e.g., parks, ball-fields, other recreational amenities; is not included in these calculations and is assumed to be the same for the different density scenarios. 7 Benedykt Dziegielewski, Residential Water Use in Northeastern Illinois: Estimating Water-use Effects of In-fill Growth versus Exurban Expansion. Prepared for the Chicago Metropolitan Agency for Planning. Southern Illinois University Carbondale. See watersupply/minutes.aspx. 8 Ibid. 61
78 Chapter 3 Land and Water 3. Infrastructure Availability/Cost: The land/water relationship with respect to urban form can be summarized in the following aspects of development design: Development density, which can be described as population or number of units per unit area Development dispersion, which refers to separation between development tracts Lot size, represented by the separation between houses/ properties Distance, referring to separation of development from existing service centers or lines. 9 Higher demand on water sources that comes with increasing population and development corresponds to more pressure on suppliers to expand their infrastructure in order to meet new demand. Development patterns factoring the above four design aspects can influence water consumption and thus costs. Larger lot sizes in widely dispersed development tracts that are in lower density areas far from service centers require more infrastructure facilities which leads to higher costs (Figure 17). Infrastructure costs may elevate due to increased leakage resulting from additional system lengths and pressures required. 10 Financially, this can only be met through increased water rates or taxes or both. 11 When these options are not available to communities, i.e., water supplies cannot meet demand, communities react to water shortages or water quality degradation by placing moratoria on new development or by imposing regulations that require the availability of adequate water supplies before construction permits are issued. 12 In summary, the integration of water-supply planning with land-use planning is thought to be a more efficient paradigm to guide growth where infrastructure is available and where resources are cost effectively situated to meet new demand. The $600 $500 $400 $300 $200 $100 $0 Figure 17: Relationship between lot size and infrastructure costs for different development types 13 Clustered development/near Lot size (acres) Source: Speir, Cameron and Stephenson, 2002 Dispersed development/far question that communities now face is whether they are willing to incur all the water-related costs and pay for negative externalities that accompany uncoordinated growth or are they willing to make more integrated land and water use decisions that offer promise to insure future water supplies. Greater emphasis on the recharge capacity of development sites, promotion of compact development for lower water consumption and increased consideration for community-oriented and appropriate growth and development in underutilized sites already served by infrastructure are all steps that could improve integration of land use and water resources. It is important to emphasize that coordination of land use planning and water supplies in support of regional goals does not contradict development aspirations in specific parts of the region. Rather, it merely acknowledges that certain development patterns and designs are associated with recharge capabilities, water-use efficiencies and reduced infrastructure costs related to water treatment and conveyance as well as wastewater management Speir, Cameron and Stephenson, Kurt Does Sprawl Cost Us All: Isolating the Effects of Housing Patterns on Public Water and Sewer Costs. Journal of the American Planning Association, 68:1, Modified from Speir, Cameron and Stephenson Van Lare, P. and Arigoni, D Growing Toward More Efficient Water Use: Linking Development, Infrastructure and Water Use Policies. Washington, D.C. U.S. EPA. 11 Ibid SB 610 and 221 in California, (B)(2002) in Arizona and (2002) in New Mexico. A reference to a situation in the NE IL region where communities were forced to seek alternative water sources can be found in Ch. 2, p.61 of this document. 62
79 Towards Integration As the northeastern Illinois region could grow to a population of approximately 12 million by 2050, the corresponding increase in water demand must be managed adaptively and sustainably to insure adequate water supplies at reasonable costs for all users. In addition to maximum utilization of water use conservation, which will be fully discussed in Chapter 4, the manner in which the region accommodates future growth through land use decisions and future investments can insure the continued prosperity and health of the region. This is best achieved if new growth opportunities for reinvestment, i.e., growth within and contiguous to existing communities, are maximized, rather than solely or dominantly on the urban/ rural fringe; community-appropriate densities are optimized to insure infrastructure effectiveness; diverse transportation options are made available to encourage compact development; conservation design 14 practices in existing and new developments are promoted as the best applicable tools for stormwater management; open lands are preserved for land application of wastewater effluent, and many other land use actions. The following section explores the various tools available that can influence water and land use decision making and guide the region along a more sustainable path. The heterogeneity of the region necessitates the review of these tools at various levels and reflects the diverse community characteristics organized by chief water source: Lake Michigan, inland rivers, and wells/groundwater. Programs/Tools for Integration Regional Approach Local Planning Technical Assistance Act Passed in 2002, this act encourages local governments to engage in comprehensive and intergovernmental planning and supports the development of land use regulations that are consistent with comprehensive plans. 15 The Illinois Department of Commerce and Economic Opportunity (DCEO) administers grants associated with the act to provide funding for developing, updating and implementing comprehensive plans and land development regulations, among others. Although this program has never been funded, it is a promising tool for the integration of water supply planning and management and land use planning if eventual funding were tied to demonstration of land- and water-use integration practices. Some counties in the region are and have been investigating water supplies in partnership with municipalities and other stakeholders. 16 Applied region-wide, this approach may insure that water supply planning is given higher priority when communities develop their comprehensive plans as compared to current practices. In addition, incorporating future water demand/ supply information (as can be modified from ongoing Illinois State Water Survey (ISWS) analyses) into local land-use plans is another mechanism that DCEO may use to insure that future developments in the northeastern Illinois region are consistent with regional plans. Communities that are encouraged to review and demonstrate their 40-year water supply will likely be more cognizant of the relationship between growth/development patterns and water use. 14 More information and plan recommendations below. 15 See 16 Since 2002, the Kane County Water Study Stakeholders Committee which has a diverse membership that includes representatives from the County Board, local governments, water supply, wastewater treatment, forest preserve, environmental groups and consultants; has been using scientific data from the Illinois State Water Survey to develop a sustainable water supply plan for Kane County. 63
80 Chapter 3 Land and Water Local Planning Technical Assistance Act Recommendations: State: During grant application and review or when providing technical assistance, DCEO should: 1) Encourage communities to include (within their comprehensive planning efforts) water conservation plans that indicate available future water supplies for projected population growth. 2) Encourage engagement in intergovernmental agreements between municipalities and counties in comprehensive planning that includes planning for water resources. 3) Provide emphasis/higher priority ranking for land-use plans that promote reinvestment development practices. 4) Emphasize conservation design or low impact development principles as guidance for local ordinance review concerning development regulations. Water Revolving Funds The Clean and Drinking Water State Revolving Funds are provisions in the Clean Water Act, the purpose of which is the establishment of loan programs made available to states for a variety of activities that promote better water quality. 17 Loans have interest rates of 2 to 3% as compared to market rates of 4 to 5% with 20% match provided by states. States fulfill the loan payment in 20 years or under, and the money is then entered into a revolving fund from which new loans are made available. The Illinois Environmental Protection Agency (IEPA) operates the Water Pollution Control Loan Program (WPCLP) and the Public Water Supply Loan Program (PWSLP) to meet the above provisions through the sale of revenue bonds. 18 Projects eligible for WPCLP funds include the construction, expansion and upgrade of wastewater treatment facilities as well as the separation or upgrade of combined sewer systems. PWSLP funds the construction of new water treatment and/or distribution facilities, the expansion, replacement or upgrade of existing treatment and/or distribution facilities. Under federal requirements, PWSLP funds cannot be used for projects needed to meet future growth. 19 Both programs can be influential in guiding growth towards more sustainable water use. Nationally, the Clean Water State Revolving Fund is used by various communities for brownfield remediation, conservation easements, and land acquisition for preservation of natural and water supply resources as well as technical assistance for comprehensive planning. 20 Water Revolving Funds Recommendations: State: 1) IEPA to encourage the utilization of existing water and wastewater system capacity 21 through promoting the upgrade and rehabilitation of existing systems 22 with funds from WPCLP and PWSLP. 2) Communities that have conservation policies and programs and that show compliance with existing comprehensive plans in their loan applications may receive lower or zero interest rates. 3) Encourage use of funds for brownfield remediation, conservation easements, and land acquisition for sourcewater protection. 17 See 18 See factsheet.html. 19 Ibid Office of Wastewater Management, U.S. EPA, Potential Roles for Clean Water State Revolving Fund Programs in Smart Growth Initiatives. 21 Data from U.S. EPA Permit Compliance System shows that in the 7-county NE IL region, current wastewater flows are 1,750 mgd while total capacity is 2,515 mgd. 22 The U.S. EPA 2007 Drinking Water Infrastructure Needs Survey and Assessment identified a need for an investment of approximately $15 billion in water supply infrastructure capital improvements for Illinois through See needssurvey_2007.pdf. 64
81 Developments of Regional Importance Enabling legislation for CMAP provides a CMAP Board review and comment opportunity for engaging regional partners to comprehensively assess the regional implications of large-scale development proposals, reconcile regional priorities associated with such proposals, and coordinate independently-taken actions in support of regional goals. 23 CMAP staff along with the working committees collaborated on identifying thresholds that must be exceeded for CMAP to proceed with a DRI review. While there is no specific water-supply related threshold, the Develoments of Regional Importance (DRI) process began as a two-year pilot on August 1, Addressing DRIs presents a potential opportunity to integrate water supply planning into major regional development activities as the DRI process evolves. Developments of Regional Importance Recommendations CMAP: Following the two-year pilot period, discuss with all stakeholders the potential inclusion of new groundwater and inland river-based withdrawal thresholds for their practical relevance in a DRI review. 24 go to 2040 As the region s first plan that integrates land use and transportation planning, the go to 2040 comprehensive regional plan addresses the full range of quality-of-life issues, including the natural environment, economic development, housing, and human services such as education, health care and other social services. 25 The plan s vision is for the region to grow sustainably to achieve the highest possible quality of life. A process of scenario building and public input will guide the plan to completion at As the final recommendations of the plan aim to influence future development and investment decisions, the go to 2040 is an appropriate device to address the integration of land use and water resources. The recommendations for the go to 2040 are based on several findings concerning the effect of land use planning on water supply, some of which coincide with earlier discussions in this chapter, e.g., correlation between density and per capita water use, lower infrastructure costs as a result of reinvestment, and the use of best management practices (BMP) to increase infiltration (will be further discussed on this chapter). go to 2040 Recommendations CMAP: The following are recommendations that go to 2040 should include to address the integration of land use and water resources: 1) Promote reinvestment and community-appropriate densities. 2) Maximize transportation options to support development patterns that promote water use efficiency and infrastructure cost effectiveness. 3) Promote the use of environmentally sensitive development practices for both reinvestment and greenfield development. 23 Proposed CMAP Process for Addressing Developments of Regional Importance. For a DRI review to proceed, at least one of the following thresholds must be exceeded: 1) The project is estimated to generate or divert greater than 50,000 auto vehicle trips (or truck equivalent) per day on the region s highway system, 2) The project is estimated to add a net discharge of greater than 5 million gallons of effluent per day, 3) The project adds greater than 500 acres of impervious paved surfaces and rooftops. See 25 See 24 The Lake Michigan Management Section Illinois Department of Natural Resources conducts an ongoing review and monitors withdrawals from the lake for compliance with the Level of Lake Michigan Act. 65
82 Chapter 3 Land and Water 4) Support the protection of ecologically sensitive environmental lands, particularly in areas where significant groundwater recharge occurs. 5) To achieve the recommendations described above, CMAP should work with local governments (through technical assistance, funding or other methods) to incorporate plan recommendations into comprehensive plans and ordinances. Section 208 Planning As introduced in Chapter 2, CMAP is obligated to outline management strategies for eliminating point- and nonpoint-source pollution, protecting groundwater, and disposing of wastewater throughout the region. In a region where wastewater is typically discharged into rivers and streams, some of which are used for public drinking water supplies, and where groundwater is a significant source of drinking water, opportunities exist to link regional water supply planning with Section 208 planning where such linkages might strengthen each planning process. As part of the Section 208 planning process, Facility Planning Area (FPA) amendment applications are reviewed by CMAP staff and the Wastewater Committee. Recommendations are then made to IEPA. FPA-review criteria include a requirement that an amendment should be consistent with other county and regional plans or state policies Thus, potential synergies exist between water-use conservation strategies, wastewater reuse, and nutrient-related recommendations from this water supply plan, and an FPA amendment review. Section 208 Planning Recommendations CMAP: 1) Encourage Section 319 funded watershed plans that further the goals of regional water supply planning while simultaneously achieving water-quality objectives. 2) Refine the FPA review process to be clear, transparent, and supportive of integrated water resource planning consistent with the agency mission. 3) Pursue where feasible policy integration with fulfillment of Section 208 planning responsibilities. 66
83 Aquifer-Recharge Areas Certain areas throughout the regional landscape where water from precipitation is transmitted downward to an aquifer via infiltration are critical for its natural recharge. 26 Sensitive aquifer recharge areas (SARA) allow the most transmission of water underground due largely to local soil properties. (Vegetation, land use, and rainfall characteristics also influence infiltrationcapacity curves.) The Washington Administrative Code 27 uses the following definition: areas with a critical recharging effect on aquifers used for potable water are areas where an aquifer that is a source of drinking water is vulnerable to contamination that would affect the potability of the water. Thus, establishing SARA protection zones and identifying potential pollution risks are important mechanisms for source-water protection in groundwater-dependent communities. The identification of SARAs is an essential step in the integration of water supply and land-use planning for these communities whereby groundwater protection can be ensured in the various phases of development. 28 Groundwater recharge areas may be protected or enhanced through carefully planned development decisions that include, but are not limited to open space, conservation design development and large lot development. 29 When compared to conventional subdivision developments, large lot residential developments can more closely mimic the benefits of recharge areas if the overwhelming majority of the lot is covered in native plantings 30 or natural areas resulting in a large area of undisturbed open space. 31 In addition, large lot developments that utilize private wells tend to have an increased area of undisturbed open space when compared to traditional water and wastewater infrastructure systems thus increasing the potential for groundwater recharge. Aquifer-Recharge Areas Recommendations State: Where possible, provide data and assistance to communities for identifying their SARAs. CMAP: 1) Provide technical assistance for counties in the mapping of SARA. (As a first step, CMAP completed a sample SARA map and methodology, included in Appendix C. Counties and municipalities may choose to refine this methodology and adapt it to their specific circumstances for planning purposes.) 2) Facilitate intergovernmental cooperation for SARA protection. 3) Develop model ordinances that address SARA protection zones. County Government: 1) Develop groundwater-protection ordinance for unincorporated area. 2) Communicate and work with municipalities within county boundaries to develop/implement model ordinances and policies for the protection of groundwater and recharge areas. 32 Public Water Supplier: 1) Amend ordinances to include overlay-zoning districts, or other land-use ordinances, where SARA have been identified for source-water protection. 2) Encourage the establishment of monitoring groups who are well versed in ordinance requirements to work with officials in insuring the continued health of recharge areas. 3) Communicate with county government to develop/ implement groundwater-protection ordinances. 26 Washington State Department of Ecology, Ground Water Resource Protection Handbook, Published December Washington Administrative Code, Chapter See 28 The McHenry County Water Resources Department is in the process of developing a Groundwater Recharge Policy based on the identification of the Sensitive Aquifer Recharge Areas in the county. This project can be a model for the other counties in the study area to conduct similar studies and develop policies for groundwater protection. See il.us/common/countydpt/waterres/taskforce.asp. 29 In this context, large lot development sites are those that are greater than 5 acres- such as found in the Barrington area and Frankfort within our region, Association of New Jersey Environmental Commissions, Municipal Options for Stormwater Management, page 5, See 30 Research has proven that native plant infiltration rates can be as much as 25 times more than turf grass. U.S. EPA Green Landscaping: Green Acres, See Additionally, native plantings are a recommendation under the Large Landscape Conservation section in Chapter Extensive mass grading resulting in the degradation of soil structures and/ or removal of existing natural areas as well as overpopulation of livestock and equine on large lot sites should be minimized or avoided in order to protect the recharge potential and soil conditions. Delaware River Basin Commission, Framework for Management of the Pocono Creek Watershed, Appendix G, May See Sierra Nevada Ecosystems Project, Sierra Nevada Ecosystems in the Presence of Livestock, Chapter 2, Links between Livestock and Water Resource, See other/sierra/livestock/chapter2/02snep1.html. 67
84 Chapter 3 Land and Water Stormwater Retention The approaches to managing stormwater have different implications for each water source in the study areas. These will be discussed in the appropriate sections below. Stormwater management goals and techniques, however, are the same regardless of the reasons for promoting these practices. Thus, the recommendations below are applicable region-wide. Stormwater Retention Recommendations CMAP: Promote public education of the benefits of stormwater BMPs. County Government: 1) Encourage the use of BMPs that promote infiltration where appropriate. Examples of BMPs currently being implemented in the region are permeable pavements, concretes and pavers, 33 rain gardens, 34 bioswales, and green roofs. 35 Public Water Supplier/Municipality: 1) Create specific stormwater requirements and BMP recommendations based on local conditions for inclusion in zoning ordinances. 2) Explore the use of creative funding mechanisms to maintain existing stormwater infrastructure such as a stormwater utility/management fee 38 which assigns a fee to property owners based on the amount of impervious area on a site, 39 or the utilization of Special Service Areas (SSAs) as a mechanism to fund stormwater management that protects water quality and/or enhances water supply. 40 3) Create a rain barrel program or partnership to provide rain barrels to homeowners. 41 2) Evaluate the feasibility and cost effectiveness of adopting Volume Control/Management Regulations that require a specified volume of stormwater runoff be retained and infiltrated on site. 36 3) Promote the use of rain barrels and cisterns to collect rainwater from downspouts and reuse it for landscape watering or other purposes Ibid The Morton Arboretum s visitor parking lot is constructed of permeable pavers. See main_parking_lot.pdf. 34 The Center for Neighborhood Technology aided Thomas Chalmers Specialty School in constructing an 1800 square foot rain garden. See 35 Millennium Park in Chicago is one of the world s largest green roofs. See 36 For example, the Kane County Stormwater Ordinance requires that stormwater runoff created from new impervious areas from up to a 0.75 inch rainfall event be retained on site. The water will then be released from the site either through infiltration or evapotranspiration. For more details please refer to the adopted ordinance See and the Technical Guidance Manual BMPs See pdf. 37 For example, MWRD hosts a rain barrel distribution program for Cook County. See 38 In the case of a Number of Rockford Churches vs the City of Rockford, it was decided that a Stormwater Utility Fee is a fee not a tax. For more information please see the decision. See AppellateCourt/2005/3rdDistrict/May/Html/ htm. 39 The City of Rolling Meadows currently has in place a Stormwater Utility Fee of $1.65 per 3,604 square feet of impervious area per month. For more information please see the adopted ordinance. See Ordinance.pdf. 68
85 Conservation Design Conservation design is an integrated design approach that facilitates development while taking into account, and conserving, the natural landscape and ecology of the development site. It serves as a development option for municipalities, counties, developers and residents to consider when choosing to develop a location or purchase a home. The Conservation Design Resource Manual 42 incorporates four main conservation design principles, all of which address the way water is used on a development site. They include: Table 10: Conservation design principles and water-related benefits Overall, most of the water-related benefits from implementing conservation design will be gained in the areas of infiltration, recharge, and stormwater retention also discussed in the previous two sections. The advantage of implementing conservation design is that it is an integrated design system and process that weaves together mutually beneficial components in one package. Counties and municipalities can accomplish several goals by implementing a single concept. To be sure, the waterrelated benefits are just a part of the broader suite of benefits conservation design has to offer. Potential economic benefits have also been evaluated in this region. 43 Achieving optimal connectivity between conservation design developments and existing open space in the region will maximize the benefits of conservation design practices. Principles Potential Water-related Benefits Example Strategies/Measures 1) Develop flexible lot design standards 2) Protect and create natural landscapes and drainage systems 3) Reduce impervious surface areas 4) Implement sustainable stormwater management techniques Reduced water infrastructure costs (initial and maintenance) Minimized stormwater runoff Reduced water for irrigation Reduced need for fertilizer and pesticides Reduced flooding Increased infiltration/recharge Improves water quality Decreased need for stormwater runoff management Reduced stormwater infrastructure Increased infiltration/recharge Clustered lot design Reduced lot size Increased open space Native/natural landscaping Ecosystems restoration Green roofs Permeable pavers and pavement Vegetated swales Minimized roadway design Bioswales Raingardens/rainbarrels Cisterns 40 For example, The Village of Streamwood used SSAs to maintain existing wetlands and upgrade existing stormwater infrastructure. For more information, please see the following presentation given by the Director of Public Works John White. See Summit-presentations07/StreamwoodSSA-Summit-White.pdf. 43 Conservation Research Institute Changing Cost Perceptions: An Analysis of Conservation Development. See 41 For example, the Village of Plainfield has a rain barrel distribution program. See pdf. 42 Conservation Design Resource Manual, March See org/environment/sustainable/conservationdesign/conservation%20design%20resource%20manual/conservation%20design%20resource%20 Manual.pdf. 69

86 Chapter 3 Land and Water Conservation design principles can be applied in urban, suburban and rural environments and in residential, commercial and industrial sectors due to the variety of conservation design practices that exist. Within our region we have a diverse set of conservation design initiatives and examples. 44 Figure 18 shows a moderate density residential template designed by Conservation Design Forum for the Blackberry Creek Watershed Alternative Futures Analysis to illustrate the site planning and stormwater design differences between conventional design and conservation design. Blackberry Creek is located in Kane County. Figure 18: Conventional vs. conservation site planning and stormwater design, Blackberry Creek Watershed Alternative Futures Analysis, September 2003 Additionally, the U.S. Green Building Council s (USGBC) Leadership in Energy and Environmental Design (LEED) 45 Rating Systems can be a helpful resource to achieve water and wastewater use reductions for a variety of development types. These rating systems incorporate strategies utilized in conservation design as well as a number of measures cited throughout this plan. There are nine LEED Rating Systems, with the Neighborhood Development (ND) system being the most closely aligned with conservation design principals. 46 The 11-county region currently has 5 registered LEED-ND projects. Credit: Copyright Conservation Design Forum, Elmhurst, IL. See 44 CMAP s Conservation Design Strategy Paper, See goto2040.org/ideazone/forum.aspx?id=748. Examples included in this paper are not a complete listing of all conservation design initiatives in the region. 45 United States Green Building Council (USGBC) s LEED website. See 46 LEED Neighborhood Development Rating System, See 70
87 Conservation Design Recommendations CMAP: 1) Encourage appropriate use of conservation design and conservation design principles in the region. 2) Inform stakeholders (municipal representatives, developers, public, etc.) on the benefits and tradeoffs of conservation design. County Government: 1) Encourage amendment of existing conservation design related ordinance(s) (e.g., subdivision ordinance, etc.) to permit conservation design developments and/or developments with conservation design principles (described above) as a viable development option by minimizing barriers for approval (e.g., need for variances, etc.). 2) Consider incentives (e.g., density bonuses, reduced stormwater fees, maintenance fees, expedited permit process, etc.) for developers and homeowners who choose to pursue or purchase in a conservation design development. 3) Identify environmentally sensitive and/or other appropriate areas (e.g., areas outlined in a comprehensive plan, etc.) within land areas zoned for development and encourage (e.g., incentives, etc.) conservation design principles to be applied if developed. 47 4) Inform stakeholders (local government representatives, developers, public, etc) on the benefits and tradeoffs of conservation design. 5) Explore the option of managing the maintenance (by redirecting HOA dues) of all residential conservation design site within the county. Municipality: Same as County Government Recommendations 1-4. Lake Michigan Service Region Approach Stormwater Retention As Table 6 (p. 36) illustrates, about 26% of the diversion from Lake Michigan has been used to account for stormwater runoff, approximately 546 million gallons of water per day. Instead of being returned to the lake, this quantity of water flows to the Mississippi River by way of the Chicago River and is thus counted as a debit against the allowable Illinois diversion of Lake Michigan. This is only relevant to the 673 square mile diverted-watershed area. Newer green stormwater management techniques, or the utilization of BMPs in which infiltration practices are adopted by a subset of Lake Michigan service area communities, may help towards decreasing the Illinoisdiversion debit attributed to stormwater runoff. Any long-term reduction in the stormwater runoff diversion component could make additional lake water available for domestic pumpage. At some point in the future, such a scenario will likely be necessary in order to enable IDNR to issue new allocations to communities that experience groundwater quality or supply constraints; a situation that could be potentially remedied if additional lake water was available for domestic pumpage. It is important to note that stormwater infiltration and the Lake Michigan stormwater-runoff debit do not form a one-for-one relationship. Some of the stormwater infiltrated in the diverted-watershed could return to rivers and streams as baseflow and still be included in the diversion accounting. 47 McHenry County, Conservation Design Standards and Procedure, Amendment to the 1991 McHenry County Subdivision Ordinance, February, See In addition model conservation design ordinances may be referenced for assistance, see Conservation Design Resource Manual link in above text. 71
88 Chapter 3 Land and Water Add New Lake Michigan Permittees within the Service Region One management goal of the Level of Lake Michigan Act is to reduce withdrawals from the deep-bedrock aquifer, and since the 2008 review of allocations revealed the potential to accommodate new allocations within the service region, there is an apparent opportunity to reduce the current mining of the deep-bedrock aquifer. Several groundwater-dependent communities will likely experience water quantity and quality problems as they grow into These communities could benefit from transitioning to Lake Michigan water in order to better accommodate their growth expectations while at the same time, participate in achieving regional water supply goals. Add New Lake Michigan Permittees within the Service Region Recommendations State: Encourage/target communities to explore the feasibility of transitioning from the deep bedrock aquifer to Lake Michigan water by facilitating dialogue with the various suppliers and offering assistance where possible. Proactive IDNR/OWR/LMMS Conservation Efforts Through an annual water use audit form (LMO-2), 49 IDNR tracks Lake Michigan permittees water usage, unaccounted for flow, and other data to assist in planning for the future sustainability of the Lake Michigan Service Region (LMSR). By expanding the LMO-2 audit form to collect information on other existing permit requirements such as the development and implementation of public programs to encourage reduced water use, IDNR can more closely track permit compliance while developing additional regional water supply data. Moreover, IDNR should have updated records of municipal ordinances or policies that enforce Lake Michigan permittee requirements such as closed system air conditioning in all new/remodeled construction, water recycling systems in new/remodeled car washers, metering requirements, and restricted nonessential outdoor use (i.e., no unrestricted lawn watering between May 15 and September 15, etc.). In addition further expansion of the audit form to capture new information, such as conservation program water savings, system capacity details and other related data presents IDNR with the additional opportunity to continually track and enhance water demand conservation in the LMSR. Furthermore, IDNR should make all LMO-2 data as well as any other publicly available data available on-line for use by others including the academic community, State Surveys, water utilities, and area planners to allow equitable access to this valuable information and to benefit regional and local water supply planning S.C. Meyer, H.A. Wehrmann, H.V. Knapp, Y-F Lin, F.E. Glatfelter, D. Winstanley, J.R. Angel, J.F. Thomason, and D.A. Injerd Opportunities and Challenges of Meeting Water Demand in Northeastern Illinois. Prepared for the Northeastern Illinois Regional Water Supply Planning Group by the Illinois State Water Survey and Illinois State Geological Survey (Institute of Natural Resource Sustainability, University of Illinois, Urbana-Champaign) and the Illinois Department of Natural Resources, Office of Water Resources. See 49 The LMO-2 must be completed each year by all Lake Michigan Permittees as a condition/requirement of permit. 50 This request could be collaborated with the State Water Survey s plan to develop a website and make available relevant data and information via the internet. Draft Strategic Plan for Statewide Water Supply Planning and Management Program, September Prepared by Illinois Department of Natural Resources, Office of Water Management and the Illinois State Water Survey, page
89 Groundwater-Dependent Subregion Proactive IDNR/OWR/LMMS Conservation Efforts Recommendations State: 1) Engage communities in the LMSR in exploring and implementing the most effective manner for compliance with the various conditions of permit, specifically the development and implementation of public programs to encourage reduced water use. 51 2) Encourage communities to develop water conservation plans that set goals for future water demand reductions and regular evaluation schemes. 3) Encourage communities to include their annual conservation activities and milestones in their annual water use reporting, e.g., by implementing a water conservation plan/activities award program. 4) Expand LMO-2 to include more information about current permit requirements as well as more conservationrelated data, as specified above in text. 5) Display all publicly available data, including LMO-2 submissions, on-line in a timely manner. CMAP: 1) Work with IDNR in outreach to LMSR communities and in provision of technical assistance with the development of community-wide water conservation plans. 2) Develop a reporting framework/template for communities to demonstrate water management activities to the Lake Michigan Management Section and to their residents as part of a public education campaign. Water Use Act of 1983 As the purpose of the Water Use Act of 1983 (WUA) is to mitigate potential conflicts arising from water shortages, 52 it presents an opportunity to sustainably manage groundwater withdrawals to support future populations. As a first step, the ISWS, called upon to consider the impacts of proposed wells on neighboring groundwater users, will require consistent reporting throughout the water planning region to apply the best possible science to predict impacts. Groundwater dependent communities can use the results of these studies for their long term land use planning to estimate whether future water supplies can meet projected demand. Water Use Act of 1983 Recommendations State: 1) Fund the ISWS to conduct impact analysis of new withdrawals on groundwater supplies as required by the WAU, specifically the August 10, 2009 amendment 53 in which, the ISWS may encounter an increased influx of data from the additional reporting required from all the Illinois counties (including the 6 northeastern counties that were previously exempted from reporting) and the users/operators of high capacity wells and intakes. 2) Provide updated well-withdrawal data and impacts to counties and to CMAP annually to facilitate comprehensive water supply planning efforts. CMAP: 1) Disseminate information to groundwater-dependent communities on the potential impacts of continued groundwater withdrawals on water supplies and the effects on future growth ILAC Ch. I, Subch. h, Sec For a more detailed analysis of the Water Use Act, see the Groundwater Dependent Users section of Chapter 2, p Public Act (Senate Bill 2184 Enrolled). See 73
90 Chapter 3 Land and Water 2) Provide assistance to communities, where requested, to explore alternative water sources and/or demand management options that may enhance water use sustainability. County Government: 1) Collaborate with the ISWS and affected communities to study impacts of withdrawals on groundwater supplies. 2) Encourage county Regional Planning Commissions 54 to provide oversight for comprehensive planning of water resources to insure continued regional economic prosperity. Stormwater Retention The significance in managing stormwater in groundwaterdependent communities lies in the recharge capacity that sustains aquifers. As more water is allowed to infiltrate, rather than convert to run-off, shallow aquifers are recharged which in the long run contributes to recharging deep-bedrock aquifers. Recommendations for stormwater retention are listed under the Regional Approach, page 68. 3) Encourage intergovernmental agreements among counties and municipalities that establish water withdrawal standards in accordance with projected growth, e.g., communities commit to specific withdrawal limits based on their future populations and with knowledge from ISWS on groundwater supplies for the purpose of water resources management; as provided for in 50 ILCS 805/4, Local Land Resource Management Plans. 55 Public Water Supplier: 1) Pursue integration of water-supply planning with long term comprehensive/land-use planning by forecasting water use (based on population projections) and considering use impacts on sources of supply. 2) Collaborate with county government and other water suppliers impacted by same water resource in identifying impacts of withdrawals on supplies and by setting limits to enable future planning and modeling. 54 State Statute 55 ILCS 5/ : the county board is hereby empowered by resolution of record to define the boundaries of such region and to create a regional planning commission for the making of a regional plan (made for the general purpose of guiding and accomplishing a coordinated, adjusted and harmonious development of said region) State Statute 50 ILCS 805/4: A municipality or county, either independently, or jointly or compatibly by intergovernmental agreement pursuant to Section 6, may adopt Local Land Resource Management Plans. Such plans may include goals and procedures for resolving conflicts in relation to the following objectives: (16) Water to ensure good quality and quantity of water resources. The 2030 Land Resource Management Plan adopted in 2004 by the Kane County Regional Planning Commission contains a chapter on Water Resources that articulates the following objective: To preserve and protect the quantity and quality of potable groundwater and potable surface water supplies and to ensure sustainable yields for current and future generations. 74
91 Inland Rivers Watershed Planning While planning on a watershed basis is recommended for the entire region, it is especially important for communities whose primary water source is an inland rivers such as the Fox and Kankakee Rivers. Many communities have participated in developing Clean Water Act, Section 319-funded, Watershed-based Management Plans. The primary purpose of watershed planning is to address surface water quality as affected by nonpoint-source pollution. Plans feature recommendations that include diverse measures for improving water quality through various activities ranging from structural measures (e.g., streambank stabilization) to more systemic measures such as changes in management practices and ordinance review/amendments. There is federal guidance for what Section 319-funded plans should include and plans can go further by promoting public awareness of the sensitivity of watershed resources as well as the conservation of open space and ecologically sensitive sites that enhance water quality; to name a couple of many possible examples. Furthermore, and as noted in Footnote 38 in this chapter, new regional criteria are beginning to be addressed too. From a land-use perspective, conservation of natural resources is a significant means for protecting water quality and water supply too. For example, the northeastern Illinois, northwestern Indiana and southern Wisconsin regions have completed a massive effort spearheaded by the Chicago Wilderness organization to identify ecologically sensitive areas that are important for stormwater infiltration (in addition to support for biodiversity and habitat connectivity) through the Green Infrastructure Vision (GIV). 56 The sites identified within northeastern Illinois can be placed on a priority list for acquisition or protection and state or foundation funds can be used towards achieving that goal. Elsewhere, IDNR manages programs that assist communities in the acquisition of lands for parks and natural areas. These programs were a successful mechanism for communities to provide open space amenities for their residents. In addition, most counties, municipalities, and other governmental bodies (e.g., forest preserve or conservation districts) include openspace acquisition in their comprehensive plans. Watershed Planning Recommendations State: IDNR should revise guidance to incent design applications that include water-resource features for Open Space Land Acquisition and Development (OSLAD) program funds; and the Land and Water Conservation Funds (LWCF) program should add ranking criteria for areas identified in watershed plans or in the GIV as being critical for water quality protection. CMAP: 1) Ensure that the go to 2040 addresses the retention of open space within the CMAP region for water quality improvement as well as the other quality of life aspects. 2) Encourage communities through the Technical Assistance Department to include the conservation of open space for the promotion of water recharge and quality protection within their planning efforts, specifically if such sites were outlined in the GIV or have been identified in an IEPA approved watershed-based plan conducted independently from the municipal governing body See 57 Some watershed-based plans were completed by non-profit groups that were not directly tied to a municipality. 75
92 Chapter 3 Land and Water County Government: 1) Participate in watershed planning efforts as an active stakeholder and actively support plan implementation efforts where appropriate. 2) Modify zoning and subdivision codes to include the conservation of open space and natural areas identified in watershed plans either through direct acquisition, conservation easements or by providing zoning bonuses/ incentives to developers for the retention of open space. 3) Establish overlay zones where BMPs are required for lands identified as critical to source water quality protection and recharge when land conservation through acquisition or easements is not an available option. 58 Public Water Supplier: Same as County Government. Stormwater Retention The quality of drinking water supplies for inland river communities is affected by urban run-off. Increased run-off generally carries more contaminants which tend to adversely impact aquatic ecosystems, affect their functions, and result in stream impairments. The IEPA has several classes of attainments/support of designated uses in water bodies that is based on biological, physico-chemical, physical habitat and toxicity data. 59 An impaired stream may not support aquatic life, human consumption of fish from that stream, primary contact, public and food processing water supply and aesthetic quality. Thus, sustainable stormwater management practices may insure water quality that supports various uses in inland river communities. Recommendations for stormwater retention are listed under the Regional Approach earlier in this chapter. Innovations Zero Water Footprint Water footprint refers to the total volume of water (direct and indirect) consumed by an individual, community or business. 60 Unlike an absolute meter measurement showing direct fresh water use for the production of a product/service or personal/ landscape use, water footprint measures cumulative water use for the various steps of the production or supply chain- akin to life cycle accounting. 61 In addition to total consumed volumes, water footprint takes into consideration the type of water used, whether it is green-rainwater, blue-groundwater and/or grey water-recycled water; as well as the type of water discharge (i.e., whether it is polluted or treated). Recently, increased research resources have been used to investigate the effects of the water footprints of various activities and the methods for reducing these impacts, in a manner similar to the way that carbon footprint has evolved. 62 Water neutrality, full water recycling, and zero water footprint are terms used for addressing total water use reduction or for offsetting the negative externalities (economic, social and environmental) on water resources. Water footprint offsetting is used when the amount of water consumed is offset by on-site measures, such as demand management, as well as off-site measures, such as investment in water development, conservation or sustainable water management projects (Figure 19). In some cases, off-site projects may include the use of advanced technology for improved watershed management and/or enhanced wastewater treatment. 63 Determining water footprints is useful for gaining an understanding of water use and for exploring alternatives to reduce, reuse or recycle water. 58 The McHenry County Stormwater Management Ordinance has requirements for water quality protection that includes the evaluation and incorporation of wetlands, infiltration basins, vegetated swales, etc. 59 Illinois Environmental Protection Agency, Bureau of Water, April Illinois Integrated Water Quality Report and Section 303(d) List Water Resource Assessment Information and Listing of Impaired Waters. 60 Water Footprint Network. See 61 Hoekestra, A.Y., Water Neutral: Reducing and Offsetting the Impacts of Water Footprints. UNESCO-IHE, Institute for Water Education. 62 The Clean Water America Alliance recently (November 2009) issued a draft titled A Call to Action: The Need for an Integrated National Water Policy as part of a national dialogue on water policies. Water Footprint was one of 3 points of consensus that participants identified whereby actions could be taken to set the stage for development of a national water policy. 63 Ibid. 76
93 Zero water footprints may be more useful and effective when applied to large scale projects where the estimated water demand might have a significant impact on the long term plans of a water supply utility. This can lead to the formation of a strong partnership between the utility and the project sponsor to more fully investigate ways to reduce water consumption on site and then offset the balance by funding other conservation or water supply projects offsite. In the residential sector, and after calculating the estimated demand, the utility can work with the developer to identify various water saving mechanisms, such as more efficient fixtures, appliances, low water use landscapes, water reuse, etc. which have proven to result in significant water savings. 64 To mitigate the balance of the demand, after calculating on-site savings, an equal amount of water will need to be saved off-site and within the utility Figure 19: Achieving zero water footprint On-site Demand Reduction Measures Total Project Demand Partnership with Utilities Off-site Water Conservation Measures service area. This mitigation may take various forms, one of which is to pay a reasonable fee to the utility for new conservation programs. 65 From the industrial sector perspective, there are several large corporations that have attempted to attain zero water footprints using different measures. Coca Cola, Nestle and Suez (a water and wastewater management company) have been measuring their respective water footprints and working on reducing their water use impacts. 66 In the past decade, Nestle has reduced their water withdrawal by 28% in spite of a 76% business growth and has a coffee plant in Thailand that has zero water discharge. 67 Using a Business Water Footprint Accounting method, Nestle calculated the total volume of water used within their processes and tried to assess the impacts on the various water supply sources from which water was withdrawn for production. Among the ways to offset water footprints, Nestle formed partnerships to deliver clean water where needed and provided technical expertise in water management practices to communities that hosted their facilities. The concept of zero water footprints or water neutrality is still fairly new in the U.S. While there is an apparent interest in it from other parts in the nation, there is an opportunity for northeastern Illinois to be a regional leader in promoting this scheme. Zero water footprint presents an opportunity to move beyond management practices that facilitate water conservation to a more holistic approach for water use reduction that captures a wider geography. Zero Net Demand 64 These mechanisms are fully discussed in Chapter The Alamo Creek residential community by Shapell Industries in Northern California used a similar approach to attain zero water footprint by negotiating with the East Bay Municipal Utility District. Maddaus, W.O.; Maddaus, M.L.; Torre, M.; Harris, R Innovative Water Conservation Eliminates Water Supply Impacts Enabling Sustainable Housing Development. Proceedings of the AWWA, Orlando, FL. June Hoekestra, A.Y., Measuring your Water Footprint: What s next in Water Strategy? 67 Lopez, H. (EVP Operations- Nestle) The Corporate Water Footprint: What can we do to decrease it? Presented at the World Water Week, Stockholm, Sweden. 77
94 Chapter 3 Land and Water Addressing Water Quality and Aquatic Ecosystem Needs Water Quality Protection Zero Water Footprint Recommendations State: Allow the use of recycled/grey water in industrial operations and large scale residential developments through a permitting process. CMAP: 1) Conduct research and compile information on techniques for achieving water neutrality and case studies documenting the reduction of water footprints for individuals, residential developments and the commercial/industrial sector. 2) Disseminate the above information through workshops and publications. Public Water Supplier: 1) For municipally-operated facilities, encourage new developments/industries, through zoning and land use planning incentives, to reduce their water withdrawals and minimize their water footprints through increased water recycling and treatment of effluent. Numerous surface-water bodies are impaired for one or more of their designated uses in northeastern Illinois. 68 These include the Fox and Kankakee Rivers and many of their tributaries. While the Fox River is not impaired for it public water supply designated use, 69 over 25 miles of the Kankakee River is impaired for its public water supply designated use with manganese as the potential cause of impairment. The potential sources of impairment along the Kankakee River are listed as atmospheric deposition and other unknown sources. In either event, water treatment technology ensures that the primary drinking water standard for manganese is met. As noted, groundwater contamination by chlorides is a growing concern. Recommendations will largely center on road-salt management, but also implicate private wells and home water softeners. In the case of road-salt applications, recommendations will serve to improve both surface and groundwater quality simultaneously as both types of water quality are contaminated by the same activity. Similarly, the biological integrity of wetlands and other aquatic resources will also benefit. 2) Facilitate water footprint offsetting by providing information on investment potential in sustainable water development/management projects for new developments, businesses and industries seeking to reduce their water footprints. 3) Use municipal property as demonstration and education sites for the identification and reduction of water footprints. 68 IEPA, Illinois Integrated Water Quality Report and Section 303(d) List Illinois EPA, Bureau of Water. IEPA/BOW/ Available here: See 69 The aquatic life support, fish consumption, and primary contact recreation designated uses are impaired. 78
95 Chlorides As discussed in an analysis conducted for McHenry County, chloride contamination of groundwater and sensitive natural areas can be dealt with either post hoc in a reactive fashion or a priori via a more proactive approach. The former purports to deal primarily with the negative consequences of continued reliance on traditional use and application rates of road salt. The report concludes that the reactive approach will not be easily dealt with. This is an unsurprising conclusion given that environmental mitigation, when it is an option at all, is very often more expensive that proactive prevention. A more proactive approach to slowing or reversing the trend in groundwater contamination from chlorides relies on reducing road salt use and adoption of sensible salting practices as outlined by the Salt Institute and, The Snowfighter s Handbook: A Practical Guide for Snow and Ice Removal. 70 A local example of another useful guidance document that should be required reading for all highway maintenance staff within the region is the McHenry County Snow and Ice Control: Field Handbook for Snowplow Operators. 71 The idea of sensible salting includes the following recommendations developed for the DuPage River Salt Creek Workgroup 72 and presented here for any entity responsible for winter highway maintenance in the region: 1) Provide proper training of road salt applicator staff and public education to build community awareness. 2) Conduct regular equipment maintenance and calibration. 3) Ensure proper salt storage, handling, and transport. 4) Explore greater reliance on anti-icing and deicing (e.g., prewetted road salt) practices. 5) Pursue judicious use of alternative deicing chemicals, including organic deicers such as those based on corn or beet derivatives. 6) Monitor salt use to determine program effectiveness. A highway department can reduce both salt use and costs for winter roadway maintenance by following these measures. 73 Those with private wells can participate in groundwater protection from chloride contamination accordingly: 1) Adopt alternative water softening technologies such as electrodialysis or membrane filtration, and 2) Reconfigure plumbing to bypass the water softener for certain indoor water uses. 74 County health departments can take the lead in making recommendations or creating new guidelines. 70 See 71 See Docs/SnowIceControlHandbook_000.pdf. 72 CDM, DuPage River Salt Creek Workgroup: Chloride Usage Education and Reduction Program Study. Final Report. See pdf. 73 Baxter and Woodman, County of McHenry, Illinois. Groundwater Resources Management Plan, Report 5. Chlorides and Agricultural Chemicals: Problem Assessments and Corrective Actions, Final. 74 Ibid. 79
96 Chapter 3 Land and Water Nutrients In the more urbanized portion of the planning region, better control of nonpoint-source pollution and nutrient removal from Waste Water Treatment Plant (WWTP) effluent offer the two most promising pathways for reducing nutrient enrichment of regional waterways. Watershed planning has become the primary vehicle for addressing nonpoint-source pollution. Among the best management practices and other recommendations typically made to reduce nutrient pollution or related causes of water quality degradation are the recommendations made here and grouped under three headings below: Nutrients Reduction Recommendations: Agriculture 1) Conduct nutrient management, including regular soil testing, to determine optimum rates and locations for fertilizer application. 2) Exclude livestock from direct stream access and filter strip areas. 3) Install filter strips along streamside property that is not currently covered by year-round vegetation. 4) Install grassed waterways where runoff concentrates at topographic low points in farm fields. 5) Practice conservation tillage. 6) Restore farmed wetlands that will serve as pollutant sinks. Implementation of all the above mentioned practices will find some financial support through federal conservation programs administered by the U.S. Department of Agriculture (USDA). Landowners are encouraged to consult with their county USDA, Natural Resources Conservation Service and Farm Service Agency. Nutrients Reduction Recommendations: Sanitary District and Municipal Wastewater Treatment Plant Sanitary districts and municipal treatment plants which may need to address nutrient loading constraints when seeking to renew their National Permit Discharge Elimination System (NPDES) permits or expand their capacity can pursue one or a combination of the following courses of action: 1) Provide for the reuse of effluent as a resource to produce revenue that can be used to aid in financing other improvement programs. 2) Expand or modify the existing waste treatment technology to reduce the nutrient loads discharged into receiving waters. 3) Participate in a nutrient trading program, designed to assure compliance with standards, and purchase nutrient credits to attain compliance with nutrient loadings on a watershed basis. The above mentioned options reflect the range of choices available to WWTPs to reduce nutrient loads to area waterways. Collectively, these recommendations represent the options for plants to explore and implement in order to comply with antidegradation requirements and new nutrient standards. Nutrients Reduction Recommendations: Municipality 1) Participate in local watershed planning efforts to reduce nonpoint-source pollution. 2) Adopt restrictions on the residential and commercial use of phosphorus containing lawn fertilizers; work through the Council of Government(s) to achieve a statewide adoption of similar restrictions There is new evidence that indicates phosphorus-load reductions can be achieved by multifaceted efforts to reduce nonpoint-source loading, one component of which is a restriction on lawn application of phosphorus fertilizer. See, J.T. Lehman, D.W. Bell, and K.E. McDonald, Reduced river phosphorus following implementation of a lawn fertilizer ordinance. Lake and Reservoir Management 25(3): See 80
97 Wetlands/Riparian Area Protection Given the relationship between wetlands and groundwater as discussed in Chapter 2, the primary recommendation made here is for the State of Illinois, IDNR, and/or the Institute of Natural Resource Sustainability at the University of Illinois at Urbana-Champaign: Develop and implement a study to monitor and improve understanding of the relationship between the hydrology of wetlands and groundwater levels as affected by local/regional pumping. Kane County may be the most appropriate place to implement such a study given the very detailed understanding of groundwater resources as they supply water to Kane County municipalities and citizens and how withdrawals produce streamflow capture. As part of this study, wetlands within the planning region should be mapped and assessed for their risk of dewatering from groundwater withdrawals. Additionally, groundwater recharge areas that contribute water to groundwater-dependent wetlands (e.g., fens) should be mapped. Data collected and information created from such a study should be incorporated into regional water supply planning where possible for purposes of developing management strategies and appropriate policies to protect wetlands from further loss and degradation. Such information could also serve to inform the two State Surveys as they fulfill their review obligation of the proposed point of (new well) withdrawal s effect upon other users of the water as outlined in the WAU. Instream-flow Protection As noted in Chapter 2, development of instream-flow protection guidelines beyond the Q7/10 for select rivers in the state has been a very difficult proposition. New information, however, regarding biologically significant streams and shallow groundwater pumping impacts on groundwater discharge to streams could help with making new progress towards developing an improved understanding of the issue along with devising a tractable administrative solution. In 2008, IDNR completed an update to previous stream rating efforts that resulted in a new single rating system 76 that also has utility for implementing the aquatic goals of the Illinois Wildlife Action Plan. 77 Combining both diversity and integrity ratings, the new system results in a list/map of Biologically Significant Streams (BSS) that are third order or larger in size. Figure 20 illustrates those streams in the 11-county water planning region that have been assigned BSS status. Regarding groundwater withdrawals, new data provide evidence of the relationship between shallow groundwater pumping and natural groundwater discharge to streams. 78 While a more general model is being developed for the entire Fox River Basin, the earlier Kane County modeling effort provides a more detailed analysis and reveals changes in natural groundwater discharge to streams since predevelopment ranging from as little as 1% to as much as 68%. Combining this new information of the effects of groundwater pumping on tributary streams along with the new biological rating system leads to several questions. For example, which streams are most sensitive to groundwater pumping and why? Also, at what point does groundwater pumping interference with natural discharge to streams, become problematic to aquatic life? 76 IDNR, Office of Resource Conservation, Integrating Multiple Taxa in a Biological Stream Rating System. See 77 IDNR, The Illinois Comprehensive Wildlife Conservation Plan and Strategy Version 1. See 78 Ibid
98 Chapter 3 Land and Water Instream-flow Prevention Recommendations State: 1) The Biologically Significant Streams (BSS) in Figure 20 and enumerated in Table 11 should receive the priority monitoring and study necessary to improve our understanding of the relationship between natural streamflow, biological integrity, and shallow groundwater withdrawals. IDNR should either assume responsibility for this study or assign the task to another entity and ensure appropriate funding to design and complete the study. Study results can then be tested for applicability throughout the region where shallow groundwater pumping occurs to identify at-risk streams and develop strategies to avoid or minimize impacts. 2) Since BSS are generally limited to third order and higher streams, any study of the relationship between shallow groundwater pumping and baseflow contributions to streams should also consider first- and second-order streams for a comprehensive assessment of pumping impacts on headwater streams. Kane County is a logical place to continue studying such impacts given the relevant data collected there to date. The Institute of Natural Resource Sustainability at the University of Illinois at Urbana-Champaign is a potential choice for collaborating with IDNR or conducting the study. 3) As an outcome of the type of study just recommended, instream-flow protection should be extended to more than just public waters of the state, taking into consideration the new context of four concurrent needs: water supply, aquatic ecosystems and biological integrity, commercial navigation where conducted, and recreation. Table 11: Biologically Significant Streams (BSS) in the 11-county water planning region 79 BSS Name 80 River Basin County 81 North Branch Nippersink Creek Fox McHenry North Branch Kishwaukee River Kishwaukee McHenry Beaver Creek Kishwaukee Boone South Branch Kishwaukee River Kishwaukee DeKalb Battle Creek Fox DeKalb Tyler Creek Fox Kane Ferson Creek Fox Kane Welch Creek Fox Kane Rock Creek Fox Kane Rob Roy Creek Fox Kendall Little Rock Creek Fox Kendall Blackberry Creek Fox Kendall East Aux Sable Creek Illinois Kendall Nettle Creek Illinois Grundy Unnamed Tributary of Waupecan Creek Illinois Grundy West Fork Mazon River Illinois Grundy East Fork Mazon River Illinois Grundy Unnamed Tributary of Kankakee River Kankakee Kankakee Trim Creek Kankakee Kankakee Kankakee River Kankakee Will 79 Source: Illinois Department of Natural Resources, Office of Resource Conservation. Map: Biological Stream Ratings for Significance (October 2008). 80 Biologically Significant Streams may only be a segment of a same-named stream. According to IDNR, Stream segments identified as biologically significant are unique resources in the state and the biological communities present must be protected at the stream reach as well as upstream of the reach. 81 Many streams overlap county boundaries. The county designation chosen reflects the primary presence of a BSS. 82
 in the 11-county water planning region")
99 Figure 20: Biologically Significant Streams (BSS) in the 11-county water planning region 83

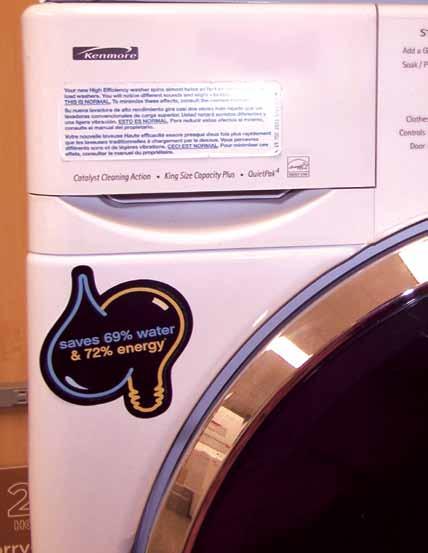

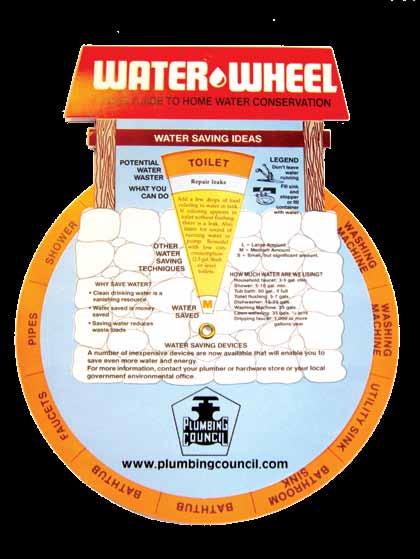

100 Chapter 4 Demand Management and Other Strategies 84 Images courtesy of CMAP staff
101 Chapter 4 Demand Management and Other Strategies Planning Framework Early in the planning process, CMAP staff delivered a document to the Northeastern Illinois Regional Water Supply Planning Group (RWSPG) to assist with the development of goals and principles that were to be part of a structure designed to ensure that specific actions would proceed in a logical order. The goal structure and definitions are reproduced below: Mission Compelling statement of the overall task that the RWSPG, CMAP, and the State Surveys are undertaking. Goal A concrete statement describing what stakeholders feel the future should be like, meant to be evaluated to determine whether the goal was achieved or not. Strategy A statement of the means (i.e., implementation steps) and/or deliverable to be used to achieve the goals. Evaluation Measure Metric used to determine whether goal was achieved. 85
102 Chapter 4 Demand Management and Other Strategies As noted in Chapter 1, a mission statement was developed early in the planning process. Similarly, interim goals were adopted and revisited and refined during the final year of planning. Adopted planning goals are listed below followed by evaluation measures: 1. Ensure water demand and supply result in equitable availability through drought and non-drought conditions alike. Evaluation Measures: a. Inland Rivers Manage Fox and Kankakee Rivers to ensure that flow remains above the interim Q7/10 protected flow level for public waters of the state. b. Groundwater Stabilize the cones of depression that are deepening in the deep-bedrock aquifer beneath areas centered on Aurora and Joliet. c. Lake Michigan Avoid exceedance of the 3,200 cfs diversion limit for each subsequent accounting period except as allowed by the amended consent decree. 2. Protect the quality of ground and surface water supplies. Evaluation Measures: a. Inland Rivers Affect a reduction in the number of impaired waterbodies within the Fox and Kankakee Rivers as listed in subsequent State of Illinois Integrated Water Quality Reports. b. Groundwater Stop/reverse the trend in increasing chloride contamination of shallow groundwater. c. Lake Michigan Status of the lake as measured against the long-term goals and targets for 2020 as documented in the Lake Michigan Lakewide Management Plan (LaMP). 3. Provide sufficient water availability to sustain aquatic ecosystems and economic development. Evaluation Measures: a. Avoid exceeding thresholds (to be established) of maximum allowable streamcapture (percent) caused by shallow groundwater pumping and determined to be protective of biological integrity. 1 b. Business surveys consistently rank the Chicago area as attractive to business because water is adequate, affordable, and without undue regulatory burdens affecting its use and availability. 4. Inform the people of northeastern Illinois about the importance of water-resource stewardship. Evaluation Measures: a. Track implementation of Public Information Campaign Recommendations. b. Conduct follow-up survey of general public to measure change in public perception, attitudes, and behavior. 5. Manage withdrawals from water sources to protect longterm productive yields. Evaluation Measures: Same measures as listed under Goal 1 above. 6. Foster intergovernmental communication for water conservation and planning. Evaluation Measures: Track creation of new cooperative management entities (e.g. committee, task force) formed that are designed to foster intergovernmental discussion focused on shared water resource planning and management. 1 The reader is referred to P.L. Angermeier and J.R. Karr, Biological integrity versus biological diversity as policy directives. BioScience 44(10): The concept of biological integrity is inclusive of biodiversity, but is more comprehensive in that it refers to a system s wholeness, including presence of all appropriate elements and occurrences of all processes at appropriate rates. Whereas diversity is a collective property of system elements, integrity is a synthetic property of the system. (pg. 692) 86
103 7. Meet data collection needs so as to continue informed and effective water supply planning. Evaluation Measures: Monitor data collection activities of Illinois State Water Survey (ISWS), CMAP, and others as an outcome of related plan recommendations; monitor Illinois Department of Natural Resources (IDNR) and CMAP funding that is designed to support regional water planning. 8. Improve integration of land use and water use planning and management. Evaluation Measures: Track explicit inclusion of water supply planning considerations in comprehensive plans within the region. The overarching strategy put forth in this first planning cycle is one centered on water conservation; primarily, but not exclusively, water-demand management. Accordingly, a menu of 13 water-use conservation measures are outlined below and followed with an integrated set of detailed recommendations aimed at the various levels of decision-making and implementation responsibility: state, regional planning agency, county government, and public water supplier/municipality. Added to that are recommendations concerning water-rate structures for full cost pricing, graywater use, and wastewater reuse. Collectively, these strategies address Goals 1 and 4 and are outlined in the next section, Managing the Use of Water. This strategy addresses Goal 8, partially addresses Goal 2 and is found primarily in Chapter 3. A strategy to address the needs of aquatic ecosystems is also offered and supports Goal 3. Likewise, a strategy to address water quality considerations is provided and this provides additional support to Goal 2. Both can be found in the Addressing Water Quality and Aquatic Ecosystem Needs section later in this chapter. This plan is without a strategy to support Goal 5 beyond what is implicit in the planning process that culminates with this plan and is expected to be ongoing. This plan includes the Lake Michigan service region and offer ideas and support for management of Lake Michigan water. As noted in detail above, IDNR is responsible for the management of the Illinois (lake) diversion. Such management is not designed with the longterm productive yield of our Great Lake in mind so much as it is designed to comply with the U.S. Supreme Court Consent Decree that governs Illinois use of this valuable source of water. The plan additionally acknowledges the existence of multiple governmental agencies concerned with managing water. Due to the shared nature of this resource, many of the recommended strategies in both Chapter 3 and Chapter 4 are aimed at increasing communication across these agencies for the purpose of water supply planning, addressing Goal 6. Specific needs for data collection and monitoring to inform the planning process (Goal 7) is addressed in Chapter 5. Another strategy aims to articulate the relationship between land-use change and water use. This plan attempts to weave together the related issues of groundwater recharge, stormwater management, wastewater planning, and the inevitable growth and development that the region continues to expect. 87
104 Chapter 4 Demand Management and Other Strategies Managing the Use of Water Water-use Conservation Two national initiatives actively support state, regional, and local water conservation efforts: the Energy Policy Act of 1992 (P.L ) 2 and the U.S. Environmental Protection Agency (U.S. EPA) WaterSense Program. 3 Additionally, the emerging concepts of green building, green jobs and the water-energy connection are complementary to these initiatives and other related efforts to maximize energy and water conservation and efficiency. The Energy Policy Act of 1992 (EPAct) established the first uniform plumbing standard for fixtures and fixture fittings sold, installed, or imported to the U.S. and created a maximum water-use baseline for new construction, replacement markets, and water conservation programs. These standards, outlined below, became mandatory in the marketplace nationwide in 1994 although many states adopted some of these standards earlier. 4 EPAct Maximum Standards Toilets 1.6 gallons per flush Urinals 1.0 gallon per flush Showerheads 2.5 gallons per minute at 80 pounds per square inch (psi) or 2.2 gallons per minute at 60 psi Faucets 2.5 gallons per minute at 80 psi or 2.2 gallons per minute at 60 psi As a result of the EPAct, national water production is forecasted to be reduced 5% by 2010, climbing to an 8% (an estimated 3.5 billion gallons/day) reduction by In addition, water utilities on average save $26 dollars per person served or $7.5 billion nationally on reduced water infrastructure cost as a result of the EPAct. Financial benefits were also realized by local communities saving on average, $127 per person or $35 billion nationally when combined with embedded energy cost savings. 5 Waste water infrastructure cost savings were not calculated, but can reasonably be assumed to be similarly significant. Since neither conservation practices nor efficiency technologies are static, it is important that fixture, fixture fitting and appliance standards in the EPAct be continually revised as efficiency technology improves Such has been the case. For example, the EPAct usurped the efficiency standards set in the 1990 rules that govern the allocation of water from Lake Michigan. While the resultant water savings have not been quantified, it is a certainty that the revised standards have contributed to Illinois ability to make Lake Michigan water available to an ever greater number of people in our region. More recently, commercial clothes washer and pre-rinse spray valve standards have been added in the Energy Policy Act of Also, the California Toilet Efficiency Law (AB 715) of 2007 establishes a transition to high efficiency toilets (1.28 g/flush) and urinals (0.5 g/flush) with phase-in beginning in 2010 and completing by The Plumbing Manufacturers Institute developed the market transition plan for AB 715 and is encouraging the same plan to be implemented in other states and at the federal level. 8 The U.S. EPA launched the voluntary WaterSense partnership and labeling program in June of WaterSense partner organizations and companies promote the importance of water efficiency in the U.S. and help build WaterSense as a nationally recognized water efficiency brand. By definition, WaterSense labeled products are 20% more efficient than their counterparts and are performance tested prior to certification. 9 High Efficiency Toilets (HET), faucets, and urinals are the current Water Sense products offered with showerhead specifications in process. Many state, regional and local agencies with water conservation programs are WaterSense partners and integrate WaterSense products in their replacement and retrofit conservation measures. 2 Energy Policy Act of See 3 U.S. EPA WaterSense Program. See 4 Amy Vickers, Handbook of Water Use and Conservation. Amherst, MA: WaterPlow Press. 5 Lisa Maddaus, Mary Ann Dickinson, and William Maddaus, Impact of National Plumbing Efficiency Standards on Water Infrastructure Investments, California Urban Water Conservation Council (CUWCC), Sacramento, California, USA. See 6 The federal Energy Policy Act of 2005 (P.L ) set a pre-rinse spray valve efficiency standard of 1.6 gallons/minute maximum, effective January 2006, and set a water factor of </= 9.5 for commercial clothes washers effective 1/1/2007. See 7 AB 715 approved by Governor Schwartzenegger on October 11, 2007 in the legislative session. See 8 Phc News, See 9 U.S. EPA, Office of Water, See 88
105 Another voluntary program that incorporates water efficiency is the U. S. Green Building Council s (USGBC) Leadership in Energy and Environmental Design (LEED) Rating Systems. 10 USGBC is a non-profit organization that promotes green building practices in which a variety of developments (e.g., homes, businesses, government buildings, etc.) may become certified through the accumulation of credits. Water efficiency is one of the topical areas covered throughout each of the nine rating systems, often requiring a prerequisite of a 20% reduction in baseline water use before credits may be earned. Efficient plumbing fixtures and fixture fittings, rainwater harvesting, graywater use, irrigation efficiency, and low water use plants are documented options for earning credits in the LEED rating systems. In total, our region has 108 LEED certified projects, with the majority of projects located in the city of Chicago. 11 Water conservation and efficiency programs can increase workforce capacity in our region through the development of green jobs. The Alliance for Water Efficiency estimates that a direct investment on the order of $10 billion dollars in water/energy efficiency programs can boost the U.S. gross domestic product (GDP) by $13 to $15 billion and employment by 150,000 to 220,000 while such investment could save between 6.5 and 10 trillion gallons of water, with resulting energy reductions as well. 12 On a smaller scale, these figures amount to $2.5 to $2.8 million of economic output benefits and 15 to 22 jobs created per million dollars of direct investment. Furthermore, direct investment in water conservation and efficiency programs can ease the anticipated $224 billion capital funding gap for water infrastructure (years 2000 to 2019) through proactive repairs and improvements at the utility level as well as reducing per capita demand to diminish the need for extensive infrastructure expansions. 13 Investments in water conservation and efficiency are not only integral to water supply planning but also beneficial on a larger economic scale through job creation, associated energy savings, and the avoided cost of new infrastructure. Figure 21 illustrates an example of how an effective water conservation program can affect the timing of capital facility construction and thus, save money for the water utility. 14 Figure 21: Example of delaying or downsizing a capital facility, 15 peak demand/capacity in million gallons per day Baseline Existing capacity Required capacity before conservation Delay Demand after conservation Downsizing Year Source: American Water Works Association, Water Conservation Programs A Planning Manual. AWWA Manual M52, First Edition, page 75. Water use is intricately tied to energy use. A reduction of water use leads to a reduction in energy use and associated greenhouse gas emissions. The modern-day water cycle includes embedded energy in every step: supply pumping, treatment to federal drinking water standards, distribution pumping, wastewater treatment and recycling. To highlight this point, consider that California s water cycle uses 19% of the state s electric energy load and 32% of the natural gas energy load. 16 Some utilities in California are already making the connection between water and energy use and having documented the respective savings. The Santa Clara Valley Water District (CA) 10 USGBC LEED Rating Systems, See 11 USGBC LEED Projects and Case Studies Directory, website search November See aspx?cmspageid= Alliance for Water Efficiency. Transforming Water: Water Efficiency as Stimulus and Long Term Investment. Position Paper, December 4, U.S. EPA, Office of Water, See 14 American Water Works Association, Water Conservation Programs A Planning Manual, page 75. The savings available to a utility result from the difference in the present value of the costs associated with building a new facility in 2027 versus American Water Works Association, Water Conservation Programs A Planning Manual. AWWA Manual M52, First Edition. 16 Mary Ann Dickinson. Water Conservation: How to Make It Happen! Presentation given on February 27, 2009, Bloomington, Illinois to the East Central Regional Water Supply Planning Committee. 89
106 Chapter 4 Demand Management and Other Strategies demonstrated an example of the mutually beneficial relationship between water and energy savings. From 1992 until 2008, the district has saved 159 billion gallons of water from conservation and recycling resulting in a savings of 1.82 billion kilowatts of energy yielding a reduction of 429 million kg of CO 2. These figures represent the equivalent of providing electricity to 265,000 households and removing 78,000 passenger cars for one year. 17 The connection is clear; proper water conservation practices create a chain reaction of benefits for other resources as well. Without question, numerous cities, regions, and states throughout the country have embraced conservation and efficiency measures as a primary tool for managing demand as population grows and development proceeds. For example, the population of the Seattle Regional Water System service area has increased by 15% since During the time from 1990 to 2004, total water supplied by the Seattle system decreased by 17%. As a result, per capita consumption fell from 145 to 105 gallons per day between 1990 and While the severe drought of 1992 and mandatory water-use restrictions led to the eventual leveling off of water demand, efficiency gains can be attributed to a combination of higher water rates, proactive conservation measures, the effects of the EPAct of 1992, and improved system operations. 19 Another well-documented success story comes from the Massachusetts Water Resources Authority (MWRA). The MWRA serves 2.5 million people and more than 5,500 large industrial customers in 61 metropolitan Boston communities. In 1986, MWRA launched an aggressive water conservation program that included, but went well beyond water pipeline and rehabilitation projects. From a peak of approximately 330 million gallons per day (mgd) in 1988, system water demand has dropped to less than 225 mgd as of 2007 while population increased 13.6% from 1987 to In the State of Texas, conservation is expected to account for 23% of water needs in 2060; up from 14% in the previous 5-year plan. Municipal strategies are expected to account for 30% of savings with agriculture accounting for the 70% balance. Undoubtedly, conservation is gaining importance in water supply planning as a means to stretch supply. Water conservation has become such a desirable option for states, regions, and cities because of its comparable affordability. Considering a cost between $0.46 and $1.40 per 1,000 gallons for conservation, most utilities are paying more than $1.40 per 1,000 gallons to develop new supplies. 21 Conservation should have an advantage where a utility s avoided cost of supplying new water is higher than the unit cost of conserved water. In addition, capital funds can be utilized for conservation purposes to avoid the cost of expanding infrastructure. In general, it is more expensive to expand infrastructure than to implement water saving measures that maintain or decrease demand within existing system capacity. Clearly, proactive water conservation is proving to be a cost effective 22 strategy for balancing water demand and available supply at regional scales studied post hoc. It should be made clear here, however, that this regional-scale plan makes no attempt to determine the cost of implementing plan recommendations a priori as this can only be done effectively at the scale of the implementing entity. Closer to home, the City of Chicago is currently implementing some of the water conservation measures described in this section and has achieved substantial water savings as a result. The City of Chicago s Department of Water Management supplies water to more than 5.4 million people in 125 different municipalities in addition to the city s residents amounting to 44% of the total population of Illinois. Overall Chicago and its suburban customers have reduced consumption by 18% since 1990, with a concurrent population growth ( ) 17 Personal communication with Santa Clara Valley Water District staff, May 13, Figures represent Fiscal Year to Fiscal Year City of Seattle, Demographics and Wate Use Stastics, See overview/demographi_ asp. 19 Ibid. 20 Massechusetts Water Resources Authority, Water Supply and Demand, October 6, See 21 Ibid Margaret Schneemann, Presentation to the RWSPG titled, Economic Value of Regional Water Supply Planning. See 23 Commissioner John F. Spatz Jr. City of Chicago Department of Water Management, February 24, 2009 presentation to the Northeastern Illinois Regional Water Supply Planning Group. See 90
107 of 24%. The City of Chicago itself has reduced water usage by 32% since The resulting system wide 157 mgd consumption decrease is an outcome of strategic planning, investment and implementation. 23 Over the last five years, Chicago has invested $591 million in a capital improvement program including the replacement of aging water infrastructure. Chicago s water main replacement program is one of the measures that contributed to this significant water use reduction. Currently the city replaces 1% or 42 miles of pipe per year, which will increase to 75 miles per year in If the annual goal of 42 miles of pipe is replaced in 2008, Chicago will save an estimated 21 mgd. Leak detection and repair is also a critical measure to reducing water waste. Chicago surveys an average of 1,740 miles of water main each year for leaks and as a result in 2007 alone the city conserved an estimated 5.2 mgd. Other programs such as the Save the Source outreach program, hydrant custodian installation, and the volunteer meter installation program have also contributed to Chicago s water use savings. Chicago s continued water conservation efforts will help stretch the water supply to meet the additional 1.3 million people that are projected to join the current service area by In northeastern Illinois, the 11-county population is expected to grow approximately 3 million 25 people by This growing population will increase demand for homes, offices, shopping centers and other built structures. By 2030 alone, the Brookings Institute projects that the U.S. will have nearly doubled its built environment. 26 To accommodate this expected growth, the region could develop strategies for management of future water demands. The Regional Water Demand Scenarios for NE IL: : Project Completion Report suggests starting with the two key assumptions of the less-resource intensive scenario (LRI): water conservation and water pricing (addressed later in the Chapter 4). The water savings assumed by the LRI scenario could be achieved by identifying and implementing new conservation measures such as those outlined below. It is important to note that the water conservation trend incorporated in the Demand Report only uses historical conservation data and does not completely capture the potential for future long-term efficiency gains in the region. Detailed future studies of water usage, both regional and national, could provide valuable information, assist in tracking improvements in water efficiency and determining potential efficiency gains while to supporting a new commitment to water conservation as a necessary tool to ensure the continued viability of the region s water supply. 27 For northeastern Illinois, the RWSPG has adopted 13 wateruse conservation measures and associated recommendations described below. 28 The measures have been extensively tested (i.e., implementation tracking) by the California Urban Water Conservation Council (CUWCC) and implemented by others throughout the country as well. Considerable information regarding these measures can be found elsewhere. 29 Each measure is described below and paired with a list of recommendations aimed at four levels: state, regional planning agency, county government, and public water supplier/municipality. A summary table of water savings associated with all measures follows the 13 descriptions and recommendations. These measures are best viewed as a comprehensive yet flexible menu of options that are available to those with implementation ability who may chose to take advantage of some or most of the measures. The exact mix of water use conservation measures chosen for implementation by public water suppliers 30 and other stakeholders with implementing authority will depend on their particular circumstances. Ideally, this mix of chosen measures will be collected to form a custom water conservation program for a specific public water supplier 24 Draft Water Conservation Strategic Plan, July 23, Developed by staff in the City of Chicago s Department of Water Management and CTR. 25 B. Dziegielewski and F.J. Chowdhury Regional Water Demand Scenarios for Northeastern Illinois: Project Completion Report. Southern Illinois University Carbondale. See 26 Arthur C. Nelson, Toward a New Metropolis: The Opportunity to Rebuild America. A Discussion Paper Prepared for the Brookings Institution Metropolitan Policy Program. See reports/2004/12metropolitanpolicy_nelson/ _rebuildamerica. pdf. 27 B. Dziegielewski and F.J. Chowdhury Regional Water Demand Scenarios for Northeastern Illinois: Project Completion Report. Southern Illinois University Carbondale. See 28 The 13 water conservation measures and the remainder of the Chapter 4 are generally consistent with the Great Lakes Commission for Great Lake States and Provinces Selected Guidelines for Water Conservation Applicable to the Great Lakes-St. Lawrence Region document, 2002, page 4. See 29 For example, see Amy Vickers (2001) Handbook of Water Use and Conservation. Amherst, MA: WaterPlow Press.; Various American Water Works Association s Planning Manuals See Alliance for Water Efficiency Resource Library. See 30 Public water suppliers include private water utilities and municipalities that are responsible for treating and delivering drinking water to their citizens and customer utilities. The latter are more common in northeastern Illinois, but it is helpful to use ownership neutral language when referring to those entities that provide (i.e., sell) potable water. 91
108 Chapter 4 Demand Management and Other Strategies or other entity with implementation authority. A detailed water conservation program will guide and direct the implementation of conservation measures, track water savings and continuously evolve to meet the needs and goals of the service region. An analysis of several programs in the U.S. has revealed seven common characteristics of a comprehensive and successful water supply and conservation program: 1) Political leadership. 2) Stakeholder involvement in the planning and implementation stages. 3) A detailed policy outlining goals and conservation measures. 4) Detailed water-use data, demand forecasting, and monitoring. 5) Stable funding sources for water conservation initiatives. 6) Sufficient staff and technical assistance to implement the program. 7) Broad-based education and outreach. 31 A water conservation program is usually part of a larger water conservation plan. For a more comprehensive guide on how to structure and implement a water conservation plan, readers are encouraged to review the American Water Works Association s (AWWA) Water Conservation Programs A Planning Manual 32 or U.S. EPA s Water Conservation Plan Guidelines. 33 1) Conservation Coordinator A conservation coordinator (CC) is responsible for managing, implementing, and maintaining a comprehensive water conservation program including a suite of water-saving measures with the necessary outreach and education to ensure program success. A CC can be a full- or part-time position for either an existing staff member or a new employee depending on available resources. Across the country, conservation coordinators can be found at all levels of government township, village, city, county, region, and state though they are most commonly found at the public water supplier level. 34 It is completely acceptable to start with appointing an existing staff person who has the advantage of institutional knowledge of the public water supplier and the public they serve. The CC can serve as the primary contact for the general public regarding conservation related issues as well as within the public water supplier for promoting conservation to the internal staff. Staff numbers can grow along with demand for program implementation and support. The conservation support staff, led by a CC, can range from one person to nearly 30 people in places like California, where matching demand with supply is very challenging. Often the most successful water conservation programs are implemented at the local level where an understanding of local needs and community character has typically been best developed. Finally, it is acknowledged that there will be costs associated with implementing a water-conservation program and a water conservation plan. It is logical to expect the most cost-effective strategies to be implemented first. Conservation financing options and water pricing will be addressed later in the chapter. 31 Alice Miller Keyes, Mandy Schmitt, and Joy L. Hinkle, Critical components of conservation programs that get results: A national analysis. American Water Works Association Water Sources Conference Proceedings. 34 Ideally there would be a network of conservation coordinators at all levels in our region. It is noted that the role of conservation coordinator would differ at various levels. We focus on the municipal level because it is expected to be the most common. 32 American Water Works Association, Water Conservation Programs A Planning Manual (M52), See 33 U.S. EPA Water Conservation Plan Guidelines, August See 92
109 The CC is the gatekeeper that oversees the water utility s direct water saving measures. It is generally agreed that a CC is necessary for having a successful water conservation program. Active CCs with adequate support from the public water supplier can expect to achieve greater direct water savings than CCs and programs lacking either enthusiasm and/or internal support. Funding sources for the CC position are varied and can be achieved through state/federal government funds, water-user fees, conservation surcharges and/or membership fees. The benefits of assigning a CC include achievement of water savings through the promotion and management of one-tomany water-saving measures, avoided costs associated with new infrastructure otherwise required to meet peak daily demand, peak seasonal demand or average demand, and improved public relations. Energy savings is another benefit of having a conservation coordinator. The reduction in water volume on both the wastewater and drinking-water operations can decrease the cost of energy used for pumping and treatment. To be sure, conservation coordinators are no longer limited to the Southwest or other dry parts of the country. They can be found all over the U.S., including places thought to be relatively water rich such as Wisconsin, Maine, and North Carolina. Conservation programs usually have four elements in common: state/federal involvement, local support of utilities/ municipalities, a point of contact for water conservation, and are specialized to local conditions. CCs are an integral part of developing and implementing conservation programs. Conservation Coordinator Recommendations State: Create a state-wide CC program within an agency such as IDNR as a means for extending the water conservation and efficiency programs provisions of the Great Lakes St. Lawrence River Basin Water Resources Compact beyond the Lake Michigan service region and coordinate with regional planning groups and their water-use conservation recommendations. CMAP: 1) Create regional program to provide technical assistance for local CCs. 2) Highlight local water conservation case studies or demonstration projects in the region. 3) Create model water-use conservation ordinance. 35 County Government: Designate an existing water resources staff member as the CC to work with municipal or private water utilities (i.e., public water suppliers) and other stakeholders with an interest in water conservation. The CC could also seek funding from other sources to promote implementation of a county conservation program. Public Water Supplier/Municipality: 1) Designate an existing staff member as the CC to lead implementation of utility conservation program. 2) Volunteer program as regional case study or demonstration project to serve as an educational example for the public and other public water suppliers. 3) Consider adopting a water-use conservation ordinance. 35 CMAP will release a model water-use conservation ordinance in early The ordinance will include indoor and outdoor sections for both residential and commercial/industrial/institutional as well as water waste, rainwater harvesting, pricing, enforcement and information/outreach sections. See 93
110 Chapter 4 Demand Management and Other Strategies 2) Water Surveys for Single-Family and Multifamily Residential Customers Another water saving measure is the residential water-use audit program for single and multi-family dwellings. Although these on-site surveys are quite labor intensive, they often produce significant water savings. The basic components of a residential water survey program include both indoor and outdoor water use. Inside the home, an auditor should check for plumbing leaks associated with toilets, faucets, and shower heads, and confirm that the meter is functioning properly. In addition, flow rates should be measured and repairs and/or fixture and fixture fitting retrofits should be recommended as necessary. If the program has the resources, the auditor may do the retrofits on-site. Outdoor landscaping audits should include checking the irrigation system and timers, as well as reviewing the customer s irrigation schedule. Key to the success of a residential water survey program is a commitment to implementing an ongoing program with careful tracking and follow-up. Research has shown that water savings benefits decay over time, as devices reach their lifespan. In addition, households may revert back to previous devices if they are not satisfied with the performance of the water-efficient device. A utility could commit to auditing a small percentage of their residential customer base each year by incenting customers to participate. Lastly, a utility with a comprehensive water conservation program will benefit most from residential water survey programs. Water survey programs can work best when implemented in concert with several other measures, including residential retrofits, high-efficiency clothes washers, high-efficiency toilets, and public-information campaigns. Home water-use audits vary widely according to local climatic conditions and utility resources. Costs, therefore, are difficult to estimate without program specific data. Lower cost programs may employ a nontargeted marketing approach, for example, and also may include limited versions of the outdoor landscaping audit. In general, costs associated with residential survey programs can be broken into four main categories: Administration Marketing, Advertising, and Outreach Direct Implementation Evaluation, Measurement, and Verification 94
111 Water Survey Program Recommendations State: Encourage a combined energy/water residential audit program, specifying minimum audit requirements, as part of the comprehensive program/administrative framework for state and regional water supply planning and management. CMAP: In concert with the state program, specify regional audit criteria if appropriate. County Government: 1) Support survey and retrofit programs with available means. 2) Encourage local community college to develop a program to train people in water conservation and efficiency. Public Water Supplier: 1) Lead implementation effort in partnership with wastewater, water, energy utilities with similar interest where feasible; target high-water users and low-income housing. 2) Provide a water audit up-front (e.g., at time of service establishment or on a periodic basis) and obtain payment via water bills over a subsequent period of time until cost of water audit is repaid. 95
112 Chapter 4 Demand Management and Other Strategies 3) Residential Plumbing Retrofit The purpose of the residential plumbing retrofit measure is to accelerate the replacement of inefficient plumbing fixture fittings (faucets and showerheads) in older (pre-1994) residences. Over the past several decades, fixtures have drastically improved in both efficiency and style. Newer models require less water to perform the same functions and have more desirable options to fit the needs of a residential user while still saving water. Plumbing fixtures and fixture fittings in Illinois homes built before 1994 often use double or triple the amount of water as compared to the EPAct efficiency standards. As one can imagine, this can add up to make a big difference in decreasing indoor household water use when applied on a regional scale. Retrofit programs can close the gap between older fixture fittings and newer standards in a cost effective way. The most common fixture fittings used to achieve water savings results are often distributed in a retrofit kit. A typical retrofit kit includes 3 faucet aerators (2-bath, 1- kitchen), 1 showerhead, and 2 color dye tablets used for checking toilet leaks. Replacement fixture fittings are usually distributed together for maximum water savings potential. Kits can be distributed by a public water supplier or community group and can be available for pick at a set location, or mailed by request. The most successful programs offer direct home installation of retrofit kits with a qualified representative to ensure a proper fit. Toilets retrofits in the past were addressed under this measure; however, due to the limited success of toilet dams and bags, the plan focuses water savings associated with toilets in the HET program section below. The water savings assumptions from retrofit programs are heavily dependent on the degree of implementation (number of homes) and proper and permanent installation of the fixture fittings. In addition, there are often different goals and implementation strategies for single-family homes versus multifamily homes. Various examples of each can be found throughout the U.S. Austin, Texas offers free and rebated plumbing fixture replacements and fixture fitting retrofits to multifamily property owners. As of 2006, the city has replaced 30,000 toilets and showerheads and 60,000 faucet aerators. As a part of the program, a comparative study of nearly 3,000 retrofitted apartments was conducted based on water use reductions as documented in water bills. The study showed that on average participants reduced their water demand by 25% with some apartments saving as much as 50%. This program collectively saves Austin 3.5 million gallons of water per month and saves apartment owners $245,000 annually (Figure 22). The payback period for property owners for this program was in months. 96
113 Figure 22: Retrofit of 45 apartment complexes in Austin, Texas Sep. 97 Dec. 97 Mar. 98 Winter Average Jun. Sep. Dec. Mar. Jun. Sep. Dec. Mar Jun. Sep. Dec Residential Plumbing Retrofit Recommendations State: Encourage retrofit-on-resale or similar variations to include WaterSense labeled fixtures and fixture fittings as part of the comprehensive program/administrative framework for state and regional water supply planning and management. CMAP: Encourage older communities with pre-1994 housing stock to implement a retrofit program. County Government: 1) Assist municipalities with outreach where possible. 2) Encourage retrofit-on-resale to include WaterSense labeled appliances. Public Water Supplier: 1) Quantify opportunity and implement in combination with residential survey. 2) Reach at least 50% of appropriate potential retrofit households. 3) Track results. 4) Encourage retrofit-on-resale or similar variation to include WaterSense fixtures and fixture fittings. 36 American Water Works Association, Water Conservation Programs A Planning Manual. AWWA Manual M52, First Edition, page
114 Chapter 4 Demand Management and Other Strategies 4) Residential High Efficiency Toilet Program Toilets are the largest indoor residential water user, accounting for nearly 30% of total indoor use. 37 The best option to achieve water savings with toilets is to replace the entire fixture. HETs or toilets using 1.28 gallons or less per flush, are the recommended replacement fixture for toilet programs. HET exceed the EPAct toilet fixture standard by 20% and are offered in a variety of models for both flushometer-valve and gravity-tank toilets. Another HET option, the dual-flush toilet, is also gaining market share. A dual flush toilet has separate, user-selectable buttons for liquid (1.0 gallons) and solid waste (1.6 gallons). Dual flush toilets feature an average water-use of 1.2 gallons per flush, slightly lower than the maximum standard for HETs. HETs are becoming standard components in water conservation programs around the U.S. As previously mentioned, HETs will become the new California-wide standard requiring all toilets sold and installed to use 1.28 gallons per flush by Complete toilet replacement, usually in the form of a toilet replacement program, is recommended in lieu of toilet retrofits because a new and more efficient toilet is a permanent solution with a more guaranteed water savings. 39 Retrofit devices can be removed or installed improperly and fall short, therefore, of anticipated water savings. Often toilet replacement programs include rebates for the purchase and/or installation of HETs to decrease the cost to homeowners. Most rebates will cover a portion of the purchase price usually ranging from $50 up to $240. Some programs, however, offer both free HET fixtures and installation, often for low-income households. Typically a customer must choose an HET that has been preapproved by the public water supplier or municipality (usually corresponds with WaterSense Program) in order to receive the full rebate. High efficiency toilet programs may be offered to residential, commercial, industrial and institutional customers. Different rebates amounts are usually given to different sectors (single-family, multifamily, commercial, homebuilders, etc) of the community. Water savings are contingent on the water use (gallons per flush) of the model being replaced, but can range from 2.2 to 7.2 gallons per flush, per toilet. 40 Residential High Efficiency Toilet Program Recommendations State: Endorse WaterSense products for all HET programs. CMAP: 1) Track implementation. 2) Explore funding options to organize a regional HET program. County Government: 1) Assist with promoting public water supplier HET programs. 2) Create recycling program and collect replaced toilets. Public Water Supplier: 1) Implement a HET program independently or in concert with other municipalities or regional partners. 2) Track implementation. 3) Provide free HET program for qualified low-income housing. 37 Vickers, Amy, Handbook of Water Use and Conservation. Amherst, MA: WaterPlow Press. 40 Vickers, Amy, Handbook of Water Use and Conservation. Amherst, MA: WaterPlow Press, (modified calculation). 38 Phc News, See 39 Water savings will be dependent of user behavior as well. 98
115 5) High Efficiency Clothes Washer Program Clothes washers are the second largest indoor residential water user, accounting for approximately 20% of total indoor use. 41 Conventional clothes washers are top loading, high volume, vertical axis washers with a 14 pound (i.e., clothes) capacity. High efficiency washers (HEW) are typically front loading, horizontal axis washers with similar capacity and are the recommended replacement fixtures for clothes washer programs. Horizontal axis washers operate more like a dryer and tumble clothes through a reduced amount of water with no central agitator. A high efficiency clothes washer program can accelerate the purchase of HEWs. By providing cash incentives such as rebates, more households will purchase for the first time or replace their existing clothes washer with more efficient models that are designed to save both energy and water. A single household that replaces a conventional clothes washer (39 gallons per load) with a HEW (27 gallons per load) can save 12 gallons per load. Per household, there is an annual water savings of 4,433 gallons of water plus energy savings associated with heating less water and reduced wastewater loads. Rebates to encourage the purchase of HEWs can be sponsored by water, gas and/or electric utilities or other public suppliers. Often two or more utilities (water and gas, water and electric) will co-sponsor a program splitting costs 50/50 or team with a municipality or county. Rebates range from $50 to $500. The city of Austin provides an example of this type of program in the conservation financing section below. To consolidate the administrative duties of a rebate program, utilities or other public suppliers often credit the rebate directly to a customer utility bill instead of issuing a separate rebate check. It is important to note that not all Energy Star washers are water efficient. A washer s water efficiency depends on its Water Factor (WF). This number represents the number of gallons per cycle per cubic foot used by a washer. A lower WF represents a more efficient washer. 42 By 2011 all residential washers being sold in the U.S. must have a WF of 9.5 or less. 43 High efficiency clothes washer programs may be offered to residential, commercial and institutional customers. High Efficiency Clothes Washer Program Recommendations State: 1) Endorse WaterSense products for all HEW programs. 2) Coordinate energy and water utility partnerships and the private sector to provide incentive packages. CMAP: 1) Track implementation. 2) Explore funding options to organize a regional HEW program. County Government: Assist with promoting public water supplier HEW programs. Public Water Supplier: 1) Implement a HEW program independently or in concert with other municipalities or regional partners. 2) Track implementation. 41 Vickers, Amy, Handbook of Water Use and Conservation. Amherst, MA: WaterPlow Press. 42 U.S. EPA and USDOE, See std_adp.php?p_faqid=2545&p_created= Appliance Standards Awareness Project, December See 99
116 Chapter 4 Demand Management and Other Strategies 6) System Water Audits, Leak Detection, and Repair The system water audits, leak detection and repair measure is designated for public water suppliers. Ideally water audits would be done on an annual basis to assess the system s capacity and check for possible leaks (revenue loss). Traditionally, one goal of a water audit is to calculate a system s unaccounted for flow (UFF). This is generally expressed as a percentage of the volume of water pumped subtracted by the volume of water billed divided by the total volume pumped. In the past, a UFF of 10% or below was generally acceptable; however, there are many different calculation practices which make audits harder to analyze on a larger scale. Ideally all water suppliers in the state would use the same audit form as to allow for a directly parallel comparison and analysis. In an effort to standardize these calculations, the AWWA Water Audits and Loss Control Programs, Third Edition, Manual 44 introduces some improvements to water audit practices. This manual takes a more comprehensive look at a public water supplier s system by targeting specific practices that can lead to water loss. In addition, the term unaccounted for flow is replaced with non-revenue water expressed in volume instead of a percentage. Audits are presented to the utility as a tool to calculate lost revenue. Based on the outcome of the audit, a utility can perform a cost analysis and decide if leak detection and repair would be beneficial for their system. Leak detection and repair is generally a cost-effective way to recover supply side water loss and increase water supply. The City of Chicago actively pursues system leak detection and repair by inspecting each water main every 4 years and the critical main every year. As a result of this practice in 2007 alone, 1,220 miles of pipe were inspected resulting in 217 main and tap leaks detected and repaired, conserving an estimated 5.2 mgd. 45 Additionally, those entities with an allocation for Lake Michigan water must limit unaccounted-for-flow to 8% or less as a condition of permit and typically report on leak detection and repair efforts for storage, transmission, and distribution systems. System Water Audits, Leak Detection, and Repair Recommendations State: 1) Encourage annual system water audit reports; audits should follow the International Water Association (IWA)/AWWA standard water balance protocol, where all water from source to customer is documented and verified, and establish an upper limit of acceptable loss as part of the comprehensive program/administrative framework for state and regional water supply planning and management. 2) IDNR OWR should eliminate the Maximum Unavoidable Loss allowance granted to permittees without raising the acceptable loss threshold (currently at 8%). County Government: Where the county has a water distribution system, perform annual system water audits as recommended and repair leaks to comply with acceptable loss limit. Public Water Supplier: Perform annual system water audits as recommended and repair leaks to strive for continual improvement and ongoing reduction of nonrevenue water. 44 American Water Works Association. Water Audits and Loss Control Programs Manual, Third Edition (M36). Published 2009-Softbound, 279 pages. ISBN Catalog No Draft Water Conservation Strategic Plan, July 23, Developed by staff in the City of Chicago s Department of Water Management and CTR. (Ibid. 22) 100
117 7) Metering with Commodity Rates for New Connections and Retrofit of Existing Connections Meters gather data to inform the public water supplier and individual user of their water use, detect water waste and leaks, and can pinpoint opportunities to save water. It is important that both the public water supplier and the customer have an accurate account of water use especially when implementing a water conservation plan. Having solid baseline data to track change allows a public water supplier and a customer to know with certainty how much water is being saved. Additionally meters can assist in setting volumetric price incentives and properly calibrated meters improved the quality of water audits. Public water suppliers may use meters to implement a variety of conservation programs such as water audits, universal metering, installation of separate meters in industrial processes to delineate consumptive and nonconsumptive uses, and/or installation of separate meters for water lines attached to irrigation systems for a potentially different rate charge. In Denver, Colorado a universal metering program was implemented in 1995 resulting in a 28% water savings. Our neighbors to the north in Greater Vancouver, Canada used meters in combination with a conservation pricing structure to achieve a 20% reduction in water consumption by single family residences. In the Lake Michigan service region, metering of all new construction and metering of existing nonmetered services as part of any major remodeling are two conditions of permit for those granted an allocation of lake water. As previously mentioned, Chicago has also embarked on a Universal Metering Program which aims to have all customers metered by 2023, with benchmarks set at 2010 for 40% of the city s customers metered and 2020 with 80% of customers metered. As of 2007, 320, 579 customers were unmetered. The City estimates a 30 mgd water savings with the completion of the Universal Metering Program. Additionally Chicago has already begun implementation of an Automatic Meter Reading program set be complete in Metering Recommendations State: As part of the comprehensive program/administrative framework for state and regional water supply planning and management: 1) Provide public water suppliers with financial means (e.g., state revolving fund loan programs, etc) to install and retrofit meters in existing buildings. 2) Encourage meters for all new construction and metering of existing nonmetered services. 3) Encourage dedicated irrigation meters for all landscapes > 2 acres. CMAP: Provide awareness and educational material on the benefits of metering to achieve conservation in water use. County Government: 1) Implement program to install meters in all existing county buildings within a specific time span. 2) Conduct regular audits in public buildings using meters. Public Water Supplier: 1) Implement AMR (automatic meter reading) with customer account detailing where cost effective to do so. 2) Implement different rate structures for indoor and outdoor water uses to encourage water conservation during peak demand. 46 Draft Water Conservation Strategic Plan, July 23, Developed by staff in the City of Chicago s Department of Water Management and CTR., page (Ibid. 22) 101
118 Chapter 4 Demand Management and Other Strategies 3) Experiment with the use of dedicated landscape meters with separate rates for landscapes larger than 2 acres OR adopt seasonal water pricing. 4) Consider implementing monthly billing structures utilizing user-friendly bill format to increase customer responsiveness in water use. 8) Water Waste Prohibition Water waste prohibition (WWP) consists of enforceable measures that are designed to prevent specific wasteful water-use activities. Wasteful activities can include water waste during irrigation, failure to fix outside faucet leaks, service line leaks (customer side of the meter), sprinkler system leaks, once-through use of water in commercial equipment, nonrecirculation systems in all new conveyer and in-bay automatic car washes and commercial laundry systems, nonrecycling decorative water fountains and installation of water softeners that do not meet certain regeneration efficiency and waste discharge standards. These are the most common water waste prohibition measures; however, a community should decide what measures are most appropriate for their residents. This measure is fairly common throughout the U.S. and can be implemented at the county, municipal, or public water supplier level. It is most often enacted and enforced at the local level through the use of ordinances. For those public water suppliers that cannot enforce ordinances, the corresponding municipality or county may be involved. In addition, a voluntary program can also be put in place to educate the service area residents on specific provisions. In the Lake Michigan service region, for example, there are conditions of permit that are equivalent to water waste prohibition measures including the mandatory adoption of ordinances that require: 1) Installation of closed system air conditioning units in all new construction and remodeling. 2) All newly constructed or remodeled car wash installations be equipped with a water recycling system. 102
119 3) Restriction of nonessential outside water uses to prevent excessive, wasteful use including restrictions of lawn sprinkling from May 15 to September 15. Most water waste prohibition ordinances are enforced through a system of citations and fines. First time offenders typically receive a written or oral citation followed by educational material to help remedy their infraction. This can be achieved through pamphlets or an educational workshop offered by a public water supplier and/or city. Many public water suppliers/cities have water waste hotlines and/or websites where residents can call or visit to report violators anonymously such as found at the Albuquerque Bernalillo County Water Utility Authority. 47 The primary costs associated with implementing this measure are the ongoing administration and staff costs necessary to maintain and enforce the ordinances. There is also an upfront cost of developing and adopting an ordinance and enforcement structure. However the fines (if chosen as means of enforcement) collected from the program can help offset some of the reoccurring costs. Water Waste Prohibition Recommendations State: As part of the comprehensive program/administrative framework for state and regional water supply planning and management, extend regionwide the requirements for the Lake Michigan service area as outlined in 17 ILAC 3730, but strengthen the restrictions on summertime lawn watering. CMAP: Create a model WWP ordinance that supports new state requirements (if necessary) and at a minimum addresses residential yard irrigation, single-pass cooling systems in new connections, nonrecirculating systems in all new car wash and commercial laundry systems, and nonrecycling decorative water fountains. County Government: Adopt model WWP ordinance or promote adoption by municipalities to enable implementation. Public Water Supplier: 1) Absent a county ordinance, support/enact WWP ordinance. 2) Review and update existing ordinances that contradict water waste prohibition ordinance. Note: A WWP ordinance can fall under other ordinances such as a Water Conservation ordinance or Landscaping/Irrigation ordinance. 47 Albuquerque Bernalillo County Water Utility Authority, See 103
120 Chapter 4 Demand Management and Other Strategies 9) Large Landscape Conservation Programs and Incentives Irrigated landscapes provide many benefits, but excessive irrigation has several drawbacks such as increased water and energy costs, depleted water supply sources, pollution from lawn and other landscape chemicals, and extra time, labor and energy required for more frequent maintenance. Large landscapes denote areas of turf grass in excess of 2 acres. Many water supply systems experience peak demands 1.5 to 3 times higher during the summer than average demand on a winter day. This has been largely attributed to outdoor water use, mainly irrigation. Irrigated turf in U.S. recreational areas, including more than 16,000 golf courses, demand 2.7 billion gallons per day, twice the amount consumed by New York City. 48 Several communities have managed to discourage excessive outdoor water use by various means including ordinances and water rate pricing. The main sources of landscape water waste are: poor irrigation scheduling, inefficient irrigation systems and practices, and fixed notions about what constitutes an attractive and functional landscape. Various conservation measures have been proposed and implemented in various places across the country to counter these wasteful sources such as xeriscaping (landscaping in which soil analysis, proper plant selection and efficient irrigation may result in 50% water use reduction compared to conventional landscaping), landscaping with native vegetation, improvements in irrigation technology, reuse of municipal wastewater or use of graywater for irrigation purposes, among others. Using irrigation systems based on evapotranspiration (ET) data may achieve significant financial savings as it improves water efficiency by assessing water needs for plants. ET is the amount of water lost from plant foliage and soil over a period of time and is expressed as a depth of water (in inches or feet) lost per day. With data obtained from remote weather stations that is affected by temperature, sun, humidity, wind speed and direction and other influences, irrigation schedules can be set to insure minimum water loss Vickers, Amy, Handbook of Water Use and Conservation. Amherst, MA: WaterPlow Press. 49 Ibid. 104
121 Large Landscape Conservation Program Recommendations State: Recommend water-efficiency irrigation technology (e.g., rain-sensors) for new landscaping as part of the comprehensive program/administrative framework for state and regional water supply planning and management. CMAP: Promote use of native vegetation in landscaping. County Government: 1) Set example by planting native vegetation on county properties. 2) Conduct ordinance review to promote low water-use plants over water intensive ones and to remove conflicts that prevent use of native plants (e.g., noxious weed ordinances). Public Water Supplier: 1) - 3) same as County Government recommendations. 4) Experiment with the use of dedicated landscape meters w/ separate water rates for landscapes larger than 2 acres OR adopt seasonal water pricing. 5) Absent /county action, support a requirement for waterefficiency irrigation technology (e.g., rain sensors) for new landscaping. 6) Incent retrofits of existing landscape irrigation systems to employ water-efficiency irrigation technology (e.g., rain sensors). 3) Conduct ordinance review to permit the use of reclaimed wastewater, graywater, or cisterns (e.g., rainwater harvesting) for irrigation. 4) Implement water-efficiency irrigation technology (e.g., rain sensors) for new county building landscaping. 105
122 Chapter 4 Demand Management and Other Strategies 10) Conservation Programs for Commercial, Industrial, and Institutional Accounts The self-supplied commercial and industrial water-use sector accounted for 11% of total regional water demand in Since many commercial and industrial businesses purchase their water from a municipal (or private) utility, the percentage of regional water demand is certain to be much higher; and higher yet when factoring in institutional types of buildings when compared to other sectors. A commercial business uses water to provide a product or service. Examples of commercial businesses include hotels and restaurants as well as office buildings and other places of commerce. The water use is related to the population served: employees and customers. An industrial business uses water as a component of manufacturing or processing. Examples of industrial accounts include food production, apparel, lumber & wood products, furniture and fixtures, and paper and allied products to name a few. The water use is related to primary industrial functions such as heat transfer, heating and cooling, materials transfer, industrial processing, washing or as a component in the product. An institutional establishment includes those that are dedicated to public service: schools, churches, hospitals and government facilities such as offices and courtrooms. Institutional building water use is similar to the certain high water using domestic applications such as toilet flushing and landscape irrigation. Conservation programs for commercial, industrial, and institutional (CII) accounts are usually site specific due to the widely varying water uses. Typically CII programs begin with a comprehensive water audit. For example, the Southeastern Wisconsin Regional Planning Commission (SEWRPC) has outlined seven steps of a water audit: 1. Garner support of CII accounts. 2. Conduct an onsite water use inventory. 3. Estimate current water related costs. 4. Identify all potential water-efficiency measures. 5. Calculate the payback period for the proposed measures. 6. Prepare a water conservation plan. 7. Track progress of the plan. Water reuse may also be incorporated in the water conservation plan for CII accounts to reduce the amount of potable water that is consumed. Reclaimed water can be used to flush sewers, clean streets, wash vehicles, mix pesticides and achieve dust control to name a few examples. Financial and regulatory incentives provide additional ways to encourage participation in a CII conservation program. Tax credits could be given for installing conservation equipment or a waiver of permit fees may be awarded. Variances or waivers for facilities using nonpotable water may also be issued. These programs will very likely require the cooperation of local government and the local/municipal water utility. There are a number of ways that state and local governments can encourage participation in a water conservation program. One example is a water conservation certificate program. A Water Conservation Certificate program would give recognition to CIIs that employ environmentally friendly practices. The CIIs can then market their participation in a certificate program to their advantage and highlight the conservation practices in advertisements. Such a program can have the effect of encouraging customers to use CIIs that are awarded this particular certificate. The certificate could be awarded through local water utilities or 50 B. Dziegielewski and F.J. Chowdhury Regional Water Demand Scenarios for Northeastern Illinois: Project Completion Report. Southern Illinois University Carbondale. 106
123 the state. Standards for each CII category would need to be created. There are a number of examples of programs that encourage CIIs to participate in water conservation programs. The U.S. EPA WaterSense program has recommendations for commercial businesses to conserve water. 51 The program promotes the purchase of WaterSense products, which conserve 20% more water than the average appliance 52 and also encourages businesses to hire irrigation professionals that are Water Sense partners. 53 Portfolio Manager is a program that the U.S. EPA has created to efficiently track the energy and water use of individual buildings as well as entire campuses. 54 An example of a local government sponsored program is BEST (Businesses for an Environmentally Sustainable Tomorrow) in Portland, Oregon. 55 This program offers technical assistance during the application process for tax credits and financial incentives. The goal of this program is to promote environmentally sustainable practices to help local business operate more efficiently. The program has an accompanying award, the BEST Business Award to recognize those participants who display a commitment to sustainable business practices. There are existing programs in Illinois that already promote sustainability in the CII sector. The Illinois Green Government Coordinating Council s goal is to promote water conservation in Illinois government operations. 56 The group offers assistance to local and county governments as well as universities for greener practices. The Illinois Sustainable Universities Compact is a signed agreement between universities and community colleges to employ greener practices. 57 The compact has a goal to reduce water use on campus by 15% by In the City of Chicago, Mayor Richard M. Daley presents the GreenWorks Awards to businesses, non-profits, schools and government agencies who employ environmentally friendly practices. Commercial, Industrial, Institutional Conservation Program Recommendations State: 1) Encourage annual water audits and water-usage reporting. 2) Implement a Water Conservation Certificate Program for environmentally friendly CIIs. 3) Offer tax incentives or tax credits. 4) Perform institutional water audits on state owned buildings and implement a water conservation program. CMAP: 1) Track participation and implementation. 2) Create a model CII Water Conservation Certificate Program. 3) Provide technical assistance to aide in the water audit process. County Government: 1) Perform institutional water audits on county owned buildings and implement a water conservation program. 2) In concert with state and regional partners, develop programs that recognize CIIs that participate in water conservation programs. 3) Provide incentives for laundromats to use HEWs. Public Water Supplier: Provide technical assistance to aide in audit processes. 51 U.S. EPA WaterSense, See cipaper.html and See html. 52 Current WaterSense products that are recommended for (light) commercial and/or institutional settings include weather based irrigation controller, urinals, high efficiency toilets, and pre-rinse spray valves. See WaterSense is currently developing a commercial and institutional partnership program. See 55 Developed by City of Portland Bureau of Planning and Sustainability. See 56 Created by then Lt. Governor Quinn. See 57 Created by then Lt. Governor Quinn. See 53 U.S. EPA Landscape Irrigation Professionals, See 54 U.S. EPA. Energy Star, Portfolio Manager Overview, See bus_portfoliomanager#manage. 107
124 Chapter 4 Demand Management and Other Strategies 11) Wholesale Agency Assistance Programs A Wholesale Agency Assistance Program is a best management practice for water conservation. A wholesale agency assistance program provides a service to retail water utilities that are required or want to implement water conservation strategies. Typical services include technical support, financial incentives, program management, and water shortage allocations. Wholesale water suppliers benefit from encouraging the implementation of water conservation programs to retail water utilities to better manage water supplies and costs and shave off peak monthly or seasonal demand that can very often strain wholesaler system capacity. Wholesale Agency Assistance Programs Recommendations CMAP: Provide technical assistance with assessment tool(s) for determining which conservation measures are most cost effective for implementation. Wholesale Water Utility: Apply tools necessary to assist customer utilities in determining which conservation measures are most cost effective for implementation. Technical support includes facilitation of workshops that address calculating program water savings, costs and cost effectiveness; and reporting requirements to meet wholesales supplier needs. Financial support includes providing financial incentives to a retail water utility to implement programs, such as the installation of HETs, residential retrofits, commercial, industrial and institutional surveys, residential and turf irrigation, conservation-related rates and pricing. Program management and water-shortage allocations include cooperative agreements to implement conservation programs and other longterm strategies that are designed to meet multiple objectives. Several wholesale water supplies throughout the U.S. provide this service and have had success in reducing water consumption demands to meet their regional goals. Staff evaluated various programs that incorporate water conservation strategies, such as conservation pricing, education and outreach, and rebate or retrofit programs. Successful wholesale agency assistance programs rely on having the staff resources necessary to respond to retail water utility needs and questions, mutually agreeable and beneficial programs for each water utility, and having a water conservation target or goal. 108
125 12) Public Information Water conservation strategies typically include both social (i.e., behavioral) and technological approaches. Conservation pricing, plumbing retrofit programs, or appliance rebate programs are examples of these two types of approaches and are designed to meet specific water conservation goals. As mentioned above, one of the seven elements to successful water conservation programs includes broad-based education and outreach. 58 Public information programs can support technological approaches to water conservation that improve water efficiencies, but can also serve as an independent approach to help in creating broad-base awareness of the importance of conservation through promotional and educational programs. In addition, public water suppliers can evaluate their billing structure and frequency to provide more detailed water use information to the customer. Comparative usage data (e.g., historical water use, average customer water use, etc), unit conversion equations, and conservation tips can be informational additions to a bill s structure. 59 Increased billing frequency can allow customers to more precisely track water use, observe seasonal variations, detect leaks, and adjust water use according to direct and frequent water use feedback. 60 The purpose of a public information program (PIP) is to increase the public s awareness regarding the value of water and to promote how it can be used more efficiently. It can be multifaceted and feature a variety of communication media, workshops, advertising, public relations, and promotional tactics to help raise awareness. The cost of a PIP depends on the selection of tools used to carry the message and if it is short-term, to address an immediate need such as a drought, or a long-term program that aims to inform and influence behavior. Investment, whether short or long-term can range from $100,000 to over $1 million annually. The majority of the Chicago region relies on Lake Michigan water. Every day nearly one billion gallons of lake water is used for public supply: drinking, laundry, other household uses, and industry. Approximately two billion gallons of water diverted from the lake every day, never returns to its source since the reversal of the Chicago River. Some areas dependant on inland or groundwater sources are experiencing water supply and/or water quality constraints and are looking to Lake Michigan as an alternative or new source of water supply. By 2040, northeastern Illinois will grow by an estimated 2.8 million more people. Both newcomers and current residents will compete for the same resources in the region, including water. Increasing the public s awareness regarding the value of water and promoting ways of how it can be used more efficiently through a public information program can serve as one strategy to meeting future water demands in this region, while still meeting the needs of existing residents. 58 Ibid Better Bill: Promoting Conservation through Bill Design, See 60 The Commonwealth of Massachusetts, Executive Office of Environmental Affairs and Water Resources Commission. Water Conservation Standards. July See 109
126 Chapter 4 Demand Management and Other Strategies Public Information Campaign Recommendations State: 1) The IDNR should pilot a statewide public information campaign, suitable for revision for use in northeastern Illinois to increase awareness of the value of water. 2) The State, in coordination with regional and local stakeholders, should identify a stable and dedicated funding source for a water conservation public information campaign. 3) IDNR OWR should survey permittees within the Lake Michigan service region for compliance with development and implementation of public programs to encourage reduced water use and work with permittees to develop and implement a consistent message that reflects both regional water supply planning recommendations and the conservation program provisions of the Great Lakes Compact. CMAP: Coordinate with federal, regional and local stakeholders to develop a public information campaign that promotes the water conservation strategies recommended in the Regional Water Supply Plan to create a unified message for regional water conservation awareness; use a variety of communication and marketing tools; and provide options for public and private water suppliers to actively promote water conservation awareness to their communities. 2) Coordinate with municipal/private water utilities, county health departments, and county soil and water conservation districts. 3) Disseminate the water conservation materials to residents and water users developed for the regional public information campaign. Public Water Supplier: 1) As part of the broader conservation program, communicate regularly with water users about regional water demand/supply, the benefits of water conservation, and the actions being taken by the water utility to enhance conservation and stewardship. 2) Evaluate billing structure and frequency to provide more detailed water use information to customers. Comparative usage data, unit conversation equations, and conservation tips should be considered as informational additions to bill structure. County Government: 1) Commit in resolution or Memorandum of Understanding to supporting a range of the public information program options developed by CMAP. 110
127 13) School Education The purpose of a school-education program is to reach the youngest water users in order to increase awareness of the value of water so that lifelong water conservation behavior is created. School-education programs typically include working with both public and private schools and the school districts. School-education programs can begin in any grade, but typically are targeted to grades K-8 and aligned with school curriculum and standards. School education programs have been developed that provide general information about local watersheds, water quality, water supply, and feature such activities as classroom presentations and water facility tours. Other entities involved in water conservation and efficiency initiatives can also provide educational and instructional assistance. School Education Program Recommendations State: 1) In coordination with regional and local stakeholders, the state should identify a stable and dedicated funding source for a water conservation education program. 2) The Illinois State Board of Education should coordinate with CMAP and the IDNR and IEPA to develop an integrated school education program. CMAP: 1) Make all public information program materials available to schools for the purpose of increasing awareness about the value of water. 2) Work with a team of local school leaders, regional and local water providers to develop a school education program that provides some classroom materials, teacher training, and creates a speakers bureau on water conservation using federal, state, regional, and local experts. County Government: Support state, regional, and local efforts to include water awareness into school curricula. Public Water Supplier: 1) Support state, regional, and local efforts to include water awareness into school curricula. 2) Commit to participating in local school curricula through activities such as classroom presentations by staff and facility tours. 111
128 Chapter 4 Demand Management and Other Strategies Potential Water Savings for Conservation Measures In order to estimate the regional impact of implementing a suite of conservation measures, potential water savings were calculated for each quantifiable measure described above and based on two-tiers of implementation (Table 12). 61 Table 12: Potential water savings associated with conservation measures at two tiers of implementation Conservation Measures Low Conservation (mgd) High Conservation (mgd) High Efficiency Toilets Water Waste Prohibition Metering Leaks and Audit Repair Residential Plumbing Retrofits Commercial/Industrial High-Efficiency Clothes Washers Large Landscape Residential Water Survey All Measures - Total Low conservation applies to 10% of demand; high conservation applies to 50% of demand. 2. Low conservation applies to 10% of eligible households; high conservation applies to 50% of eligible households. The low conservation program accounts for the minimum regional participation expected during the planning period and is generally characterized by a 10% standard. The low conservation calculations roughly correspond to 10% participation of the region, specifically 10% of eligible households, 10% of the employees, or 10% of the applicable water demand. Each measure requires one of these three qualifiers to produce the low conservation water savings figures. On the other end of the spectrum, the high conservation program accounts for the maximum regional participation expected during the planning period and is generally characterized by a 50% standard. The high conservation calculations roughly correspond to 50% participation of the region, specifically 50% of eligible households, 50% of the employees, or 50% of the applicable water demand. Each measure requires one of these three qualifiers to produce the high conservation water savings figures. For example, HET programs incorporate eligible households whereas the Commercial and Industrial measure incorporates regional employee data. The metering measure incorporates public supply demand data. All three qualifiers were derived from either the U.S. Census or Demand Report data. In addition each measure s calculation is based on several assumptions that are thoroughly documented in Appendix D. The base equations for the measures were mostly provided by the U.S. EPA, Amy Vickers s Handbook of Water Use and Conservation (2001), or the Texas Water Development Board. 3. Low conservation applies to 10% of employees; high conservation applies to 50% of employees. Employee estimates only include public supplied commercial and industrial establishments. Calculations for each measure are detailed in Appendix D. 61 Water Conservation Coordinator, Public Information, School Education, Institutional, and Wholesale Assistance are not quantified. Conservation measures are displayed in descending order from highest water savings to lowest water savings according to the High Conservation Program. 112
129 It should be noted that the water savings potential of both the low and high conservation programs is in addition to the inherent effect captured by the water conservation factor modeled in the Demand Report. 62 The water conservation factor is assumed to be present in the CT scenario (i.e., a continuation of the historical trend) or absent in the MRI scenario (i.e., no extension of the historical trend). The historical conservation trend reflects the effects of the EPAct, in addition to other water-user actions; effects that wane over time. The primarily passive nature of the historical conservation trend will be complemented by the active nature of the low or high conservation programs. The LRI scenario assumes at a minimum that the region implements a low conservation program. Furthermore, the suite of water conservation measures enumerated in Table 12 has the potential to make a considerable contribution to meeting incremental demand between 2005 and Table 13 and Figures 23 and 24 indicate the relative contribution of conservation to the incremental demand within the public supply sector for both the CT and MRI scenarios. As noted, achieving either the high or low conservationplan potential depends on the degree of participation of the region s residents, employees and other water users. Since a regional-scale water-conservation goal has not been established, no specific date has been set for full implementation of either high or low conservation participation rates. In reality, regional water conservation efforts will most likely fall in between these two participation levels and may be accomplished well before On this last note, an argument can be made for striving to achieve the highest participation rate possible by 2030 rather than For example, it would be better to achieve the benefits of water savings sooner than later and thus, enjoy the benefits stream for a longer period of time. Also, history shows that technological advances are likely such that the situation and opportunities in 2030 are very likely to be much different from what they are today as well as what they are likely to be in Furthermore, the water savings potential of conservation measures relative to demand in 2030 is greater across either demand scenario and both participation rates (Table 14). The shorter time horizon is also plausible given the accomplishments of other major metropolitan areas that have pursued similar strategies. 62 B. Dziegielewski and F.J. Chowdhury Regional Water Demand Scenarios for Northeastern Illinois: Project Completion Report. Southern Illinois University Carbondale. See 113
 2050 Demand (mgd) Change in Demand (mgd) Low Conservation Contribution to Meeting Change in Demand High Conservation Contribution to Meeting Change in Demand Current Trends Scenario 1189.")
130 Chapter 4 Demand Management and Other Strategies Table 13: Contributions of two levels of conservation to meeting scenario increases in public supply demand: Normalized Demand (mgd) 2050 Demand (mgd) Change in Demand (mgd) Low Conservation Contribution to Meeting Change in Demand High Conservation Contribution to Meeting Change in Demand Current Trends Scenario % 71% More Resource Intensive Scenario % 42% Table 14: Contributions of two levels of conservation to meeting scenario increases in public supply demand: Normalized Demand (mgd) 2030 Demand (mgd) Change in Demand (mgd) Low Conservation Contribution to Meeting Change in Demand High Conservation Contribution to Meeting Change in Demand Current Trends Scenario % 133% More Resource Intensive Scenario % 78% Figure 23: Potential of conservation to meet incremental demand in in public supply sector: CT CT scenario* Remaining Demand 80 % 29 % High Conservation 71 % Low Conservation 20 % Figure 24: Potential of conservation to meet incremental demand MRI scenario* in public supply sector: MRI scenario* Remaining Demand 88 % 58 % High Conservation 42 % Low Conservation 12 % * Current Trends scenario, incremental demand = 381 mgd Source: Chicago Metropolitan Agency for Planning * More Resource Intensive scenario, incremental demand = 648 mgd Source: Chicago Metropolitan Agency for Planning 114
131 As another way to look at the data, Table 15 displays per capita data. Each year below assumes that either the low or high conservation plan has been achieved. Data from 2005 is included as a reference point. Table 15: Water savings for the low and high water conservation programs, gallons per capita per day Year Population Served Low Conservation (gpcd) High Conservation (gpcd) ,743, ,178, ,636, Note: Only includes population served by public supply. 63 Whether the region achieves the potential of low conservation or high will depend on a variety of factors including the degree of accomplishing the seven attributes of a successful comprehensive water supply and conservation program as listed and evaluated below: 64 Political Leadership Stakeholder Involvement in the Process Policy outlining conservation goals and measures H 2 O use data, demand forecasting, monitoring Stable funding for conservation Staff and technical expertise Education and outreach The regional water planning process as directed by CMAP and the deliberations of the RWSPG have together provided evidence of the first four attributes at work. Stable funding for conservation is a critical issue and can be obtained if water utilities budget for such out of the capital projects portion of their budget or by other means described below under the Conservation Financing section. Staff and technical expertise will need to be developed at all levels of participation. Finally, a public information campaign and a school education program are integral to the success of this planning effort. 63 B. Dziegielewski and F.J. Chowdhury Regional Water Demand Scenarios for Northeastern Illinois: Project Completion Report. Southern Illinois University Carbondale. See page Ibid
132 Chapter 4 Demand Management and Other Strategies Energy and Water As previously mentioned, another benefit of conserving water is the capture of imbedded energy savings. Energy is used throughout the urban water cycle; it is required for the pumping, delivery, and treatment of water and wastewater. Heating water for residences and businesses requires energy as well. For example, running a hot water faucet for five minutes and lighting a 60-watt bulb for 14 hours use the same amount of electricity. 65 Reducing water demand can reduce energy needs and costs for both the suppliers and end users of water alike. 66 Water conservation and efficiency measures are one way to reduce water demand. In an effort to further assess the total regional benefits of the low and high water conservation programs, imbedded energy savings were calculated for clothes washers and showerheads shown below in Table 16. Table 16 represents only a portion of the energy savings that could potentially be achieved with the low or high water conservation plans as avoided energy use due to decreased pumping, delivery, and treatment were not calculated. In addition, potential commercial and industrial energy savings were not calculated. Table 16 provides a very conservative estimate of the overall savings potential associated with demand management strategies. Table 16: Sample of potential energy savings associated with high and low conservation programs Low Conservation (kwh/day) High Conservation (kwh/day) Clothes Washers 364,917 1,824,586 Showerheads 132, ,692 Combined Totals 497,056 2,485,279 In 2007 the average Illinois household used 790 kwh per month or about 26 kwh per day. 67 Based on this statistic the combined energy savings for achieving the low conservation plan could provide for the daily electricity needs of 19,117 average households. The combined energy savings associated with achieving the high conservation plan could provide for the daily electricity needs of 95,588 households, the equivalent of providing electricity to all new households expected between 2005 and 2050 for Kendall and DeKalb Counties. 68 The symbiotic relationship between energy and water has already been recognized on a national scale through legislation and the WaterSense Program. Starting in January 2011, clothes washer manufacturers will not only have to meet energy standards (Modified Energy Factor-MEF) but will also have to meet a WF of 9.5 or less. 69 For every year, the 9.5 Water Factor standard is in place, the U.S. is expected to save 40 mgd. 70 This is 40 mgd that does not have to be pumped, treated, delivered or heated. The inclusion of a WF provides water savings as well as additional energy savings associated with decreased water use. Residents can explore how much water and energy their household can save through water efficient appliances on the U.S. EPA s WaterSense program website that provides educational information and statistics on the energy benefits associated with reduced water use. 71 The water-energy connection warrants further study. Avoided energy use due to decreased pumping and treatment, air quality considerations, and a more in-depth look into energy savings calculations should be addressed in the next planning cycle. As water supply planning evolves in Illinois, energy usage associated with water use should be considered in planning decisions. 65 U.S. EPA, WaterSense, See 66 Cohen, Ronnie, Barry Nelson and Gary Wolff. Energy Down the Drain: The Hidden Costs of California s Water Supply. Natural Resources Defense Council. Pacific Institute, Oakland, California, August U.S. Energy Information Administration, FAQ Electricity, See home. 68 B. Dziegielewski and F.J. Chowdhury Regional Water Demand Scenarios for Northeastern Illinois: Project Completion Report. Southern Illinois University Carbondale. See page Es-4. Note:Number of households derived from population projections divided by 11-county regional average capita per household, U.S. EPA and U.S. DOE, Energy Star, See index.cfm?c=clotheswash.pr_crit_clothes_washers. 70 Osann, Ed. Water Efficiency Addressed in New Federal Energy Bill: Dishwashers and Clothes Washers to be More Efficient. January 3, See 71 U.S. EPA, WaterSense, See waterenergy.html;
133 Conservation Financing Even with the numerous benefits of water and associated energy conservation, the question remains: how to pay for it? Funding sources for water conservation programs varies greatly between states, regions, and cities. Proper planning will ensure that a conservation program will be revenue neutral and effective in managing demand to meet program goals. This can be accomplished in one of several ways: adopt fullcost pricing; charge a user fee; or obtain some other stable funding source either independently or in concert with others. A consistent funding source allows public water suppliers to anticipate funding amounts and develop a conservation program and timeline accordingly to meet program goals. The programs and ideas listed below represent potential funding options that can be used alone or pursued in combination to achieve conservation program goals. Federal Level Water conservation funding with federal money is made possible through the Clean Water and Drinking Water State Revolving Funds. Since states administer these funds, project selection depends largely on state priorities. Both funds require a state match. Revolving Funds: Clean Water State Revolving Fund (CWSRF): 72 A U.S. EPA administered program that provides $5 billion dollars annually in low-interest loans for water quality protection projects for wastewater treatment, non point source pollution control and watershed and estuary management. In addition, this fund can be used for water conservation as outlined below. In FY 2008, Illinois was allotted $31 million in the CWSRF. 73 Municipalities, farmers, homeowners, small businesses, and nonprofit organizations are eligible. Table 17: Eligible structural measures 74 and nonstructural measures Plumbing fixture retrofits or Installation of Meters replacements Efficient landscape irrigation Recycling graywater equipment Reuse of wastewater Use of incentive-based wastewater service charges Public Education Programs Use of ordinance or regulations to conserve water use Drinking Water State Revolving Fund (DWSRF): 75 Established by the Safe Drinking Water Act (as amended in 1996), the DWSRF focuses on financing infrastructure improvements for drinking water systems and promoting public health and water quality through low-interest loans. Small and disadvantaged communities as well as pollution prevention programs are encouraged as recipients of the fund. In FY 2009, Illinois was allotted a capitalization grant of $33 million. 76 Public and private community water systems and nonprofit non-community water systems are eligible. 72 U.S. EPA, Funding Water Conservation and Reuse with the Clean Water State Revolving Fund, June See 73 U.S. EPA, FY2008 Clean Water State Revolving Fund Title VI Allotments, January 28, See 74 Eligible when the equipment or facility is publicly-owned. See 75 U.S. EPA, Drinking Water State Revolving Fund, See 76 U.S. EPA, Drinking Water State Revolving Fund Allotments, See 117
134 Chapter 4 Demand Management and Other Strategies State Level The Public Water Supply Loan Program and the Water Pollution Control Loan Program, previously mentioned in Chapter 3, are the revolving loan programs in Illinois that correspond to the Clean and Drinking Water State Revolving Funds. Although currently the state gives priority to point source, infrastructure and facility upgrade projects; this could change in the future. For example, The American Reinvestment and Recovery Act (ARRA) distributed additional funding to both state revolving funds and featured a new Green Project Reserve allocation. 77 This allocation reserves 20% of the ARRA funds for green infrastructure, water or energy efficiency improvements, or other environmentally innovative activities. The Green Project Reserve allocation has become a permanent allocation for both the Clean Water and Drinking Water State Revolving Funds and provides a substantial increase in potential funding for water conservation. 78 Additional permanent funding structures and avenues at the state level can be established to fund water conservation programs. A prominent example of state-sponsored water conservation programs and projects is found in California, which offers an assortment of state-funded assistance programs available to water suppliers through the California Department of Water Resources, Water Use and Efficiency Branch (WUE). 79 The FY budget for WUE is $41 million and includes grants and loans to fund water efficiency and urban water conservation programs. A significant portion of this budget, $17 million, will be used on projects like rebate programs, public education and outreach, leak detection and system retrofits for greater water efficiency through the Proposition Urban Drought Assistance Grant Program. Furthermore, through the enactment of Assembly Bill 1420 (AB 1420) grant and loan programs awarded to urban water suppliers are conditioned on implementation of Demand Management Measures (DMM). 80 The DMM are consistent with the California Urban Water Conservation Council Memorandum of Understanding, of which the 13 conservation measures found in this chapter were modeled after. 81 As another example, Texas has a Water Infrastructure Fund (WIF) that was created by Senate Bill 1 82 to fund projects outlined in the most current State Water Plan as well as approved regional plans. Although the exact amount of funding can vary between years, this is a permanent fund to implement a variety of traditionally infrastructure-based water supply projects but can include direct and indirect metering, a conservation measure described in this chapter. As of 2007, state funding has been appropriated to insure $440 million in bonds for applications through A similar situation could occur in Illinois through legislative action aimed at passing a bill akin to 77 IEPA, See economic-stimulus/index.html. 78 U.S. EPA, FY 2010 EPA Budget in Brief. Under the section titled, Invests in Water Infrastructure : will encourage efficient water delivery and green infrastructure projects to further promote clean water. Other references include mention of supporting green jobs in the 21st century. See 79 California Department of Water Resource, Financial Assistance Program, See 80 Found in Water Code Section (f ). 81 California Department of Water Resources, Financial Assistance, Compliance with AB 1420 Requirements, See 82 Senate Bill 1 (SB 1) was signed into law in June of 1997 by the 75th Legislature as comprehensive water legislation. Senate Bill 1 affects various Water, Tax, Local Government, and Agriculture codes. A detailed listing of these specific code sections can be found in the full text document of Senate Bill 1. See SB00001F.htm. Full history of Senate Bill 1. See tx.us/billlookup/history.aspx?legsess=75r&bill=sb1. 83 Texas Water Development Board, Water Infrastructure Fund, See WIF.asp. 118
135 Texas Senate Bill 1 or California Proposition 50 that establishes a funded state water supply program and/or water conservation grant or loan program. Permanent funding has been achieved elsewhere through a state-wide conservation tax or conservation fee. The State of Minnesota passed the Clean Water, Land and Legacy Amendment in November of The Amendment increases the general sales and use tax by three-eighths of a percentage point (.375%) to generate an estimated $243 million dollars in Fiscal Year The newly created Clean Water Fund will receive 33% of this amount, an estimated $80 million in Fiscal Year 2010, to protect, enhance, and restore water quality in lakes, rivers, streams and groundwater, with at least 5% of the fund spent to protect drinking water sources. The amount is expected to increase to $91 million in Fiscal Year County Level County government could coordinate a county-wide conservation program if public water suppliers are interested in partnering. While issues of funding will vary from county to county, some economies of scale could be achieved in a collaborative program with local public water suppliers for certain measures such as a public-information campaign. Collaboration could lead to delivery of a consistent media message to water users throughout the county. More specifically New Mexico established the Water Conservation Fund, an outcome of the Environmental Improvement Act ( NMSA), to provide water quality testing assistance to ensure all public water systems meet the Safe Drinking Water Act requirements. The Water Conservation Fund consists of a $0.03 per 1,000 gallons of water produced fee to every public water system. 85 Although these last two examples do not directly provide for conservation measures, Illinois could use a comparable format to finance conservation measures within the state. To be successful, Illinois would need to create a customized permanent funding solution for water conservation that adequately addresses the needs of the state. The above examples serve as possible considerations toward developing and funding a water conservation program in Illinois. 84 Minnesota Department of Natural Resources, Clean Water, Land and Legacy Amendment, See 85 New Mexico Environment Department, Drinking Water Bureau, Water Conservation Fee, See 119
136 Chapter 4 Demand Management and Other Strategies Local Level Funding for water conservation is most often generated at the local level. Local funding allows for the most flexibility and creativity in implementing a conservation program. Additionally building partnerships with local businesses and residents is an unparalleled technique to engage the community in water conservation. Full cost pricing, user fees, partnerships, referendums, and discretionary and capital funds are possible local funding options. Full Cost Pricing 86 Full Cost Pricing offers a method for encouraging more efficient water use. Designing rates to recover the full cost of delivering water service will benefit both utilities and customers by providing sufficient utility revenue while simultaneously promoting conservation. Utilities can adapt the full cost pricing concept to meet their conservation goals and specific pricing objectives. In Boston, Massachusetts, implementation of full cost pricing resulted in adequate funding for improved water management programs, including metering, leak detection, and replacement/relining of water mains. These improvements ultimately resulted in decreased unaccounted for water, allowing for both increased utility revenue, and the return of associated cost savings to customers. 87 User Fees Communities can choose to establish a fee to fund a local water conservation program. The fee is usually directly added to the existing water bill and can range from a few cents upwards to several dollars or more depending on the needs of the community. The revenue collected from the fee funds conservation measures (rebates, education, etc.) and staff. Conservation surcharge, water fee, conservation fee are a few examples of variations of the user fee. In Albuquerque, New Mexico a water bill surcharge created a $2.4 million dollar budget for water conservation. The city returned over 50% of the revenue to its customers in the form of residential and commercial rebates and implemented several public education workshops and demonstration gardens. 88 Furthermore, user fees can be targeted to specific water group users to fund related programs such was the case in Pleasanton, California where a $0.05/ccf surcharge was applied to irrigation accounts to create irrigation equipment upgrade sponsorships to improve efficiency. 89 In some cases a water conservation fee ordinance can be passed to define fees and direct revenue as was implemented in Santa Fe, New Mexico. 90 In addition water conservation fees associated with connecting new developments and major renovations to water service or expanded water service can fund water conservation. The fee can be calculated by number of connections or by total square footage. In Lincoln, Massachusetts, a water conservation fee is calculated based on the total new or renovated built square footage ranging between $0.50 and $2.00 per square foot Full cost includes capital charges, funding depreciation, operation and maintenance costs, and opportunity costs, as well as both economic and environmental externalities. The opportunity cost of water consumption consists of the benefits foregone from that use. Note that the opportunity cost of water is equal to zero when there is no water shortage. Externalities generally refer to third-party effects occurring outside the water market. Economic externalities are associated with changed production or consumption costs resulting from the use of water, for example, the over-extraction of groundwater raising the pumping costs of others, or reduced water levels affecting shipping costs. Environmental externalities are associated with public health and ecosystem maintenance, such as impacts of changing water levels on coastal habitat. 88 Water Conservation Programs A Planning Manual, American Water Works Association M52, 1st Edition, 2006, page Pleasanton, CA. Commercial Irrigation System Rebate Program. See 90 Santa Fe, New Mexico. Water Conservation Program Charge, January 9, See in=1. 91 Annual Water Quality Report 2006, Town of Lincoln, Massachusetts. See 87 Goldstein, J. Full-Cost Water Pricing, Journal of the American Water Works Association,
137 Partnerships with electricity utilities In order to share the benefits and costs of water conservation, electricity utilities will often partner up with water utilities to offer rebates, education or appliances. High efficiency clothes washers and low-flow showerheads provide both water and energy savings. Austin, Texas offers residents a $150 rebate for purchasing a high-efficiency clothes washer. Austin Water provides $100 and local energy companies, Austin Energy (electric water heaters) or Texas Gas Service (gas water heaters) provide the remaining $50 to complete the full rebate amount. 92 Partnerships with/by way of nonprofits Water conservation can be an initiative for existing nonprofit groups and associations or new entities can be formed to meet the water conservation needs of a region or community. Although nonprofits may not have local authority to require a user fee, they can have voluntary dues paid by municipalities to provide regional water conservation services such as public information and education as well as coordinating efforts between municipalities. The Arizona Municipal Water Users Association (AMWUA), a nonprofit corporation located in Maricopa County, receives dues from 10 municipalities and in turn provides a wide range of services including landscaping brochures, legislative updates, an online library, and educational seminars. 93 Referendums (state, county, and local) To fund more specific projects or address current conditions, referendums are often introduced to initiate water conservation. The success of a referendum is dependent on voter support and can range in funding amounts. The town of Gibsons, British Columbia passed a referendum for $951,000 to be used in conjunction with a grant to install cross connection control valves and water meters. 94 Referendums can also be used at the state and county level. 95 Discretionary Funds When permanent funding for water conservation is not available and the needs of a community are apparent, officials can choose to utilize discretionary funds, when available, for water conservation programs. This source of funding could be a short term solution but ideally a municipality/ utility would establish a permanent funding source for water conservation. Capital Funds Capitalizing conservation programs entails the use of longterm debt, shifting the burden from current to future rate payers, to develop additional increments of supply while postponing future water infrastructure investments such as the expansion of water and wastewater treatment plants as well as new source development. Capital funds are more commonly used for rebates, incentives and equipmentbased conservation programs than outreach, education and behavior-based conservation programs. Using capital funds for water conservation has been successfully implemented elsewhere, most notably in Seattle, Washington, San Diego County, California, and New Haven, Connecticut. In 2008, Seattle capitalized slightly over $2 million dollars for conservation programs within the Seattle Public Utilities District, which includes 17 water utilities and the city of Seattle City of Austin website, See 93 Arizona Municipal Water Users Association, See 94 Town of Gibsons, Vote date: November 15, See 95 Currently the DuPage Water Commission collects a 0.25% sales tax from the sale of general merchandise within the boundaries serviced by the DuPage Water Commission (Effective July 1, 1986). See 96 City of Seattle, Seattle Water Supply System Regional 1% Water Conservation Program, May 2009, page 7, total hardware incentives costs. See 121
138 Chapter 4 Demand Management and Other Strategies Targeted Conservation With limited financial resources and the need to be efficient, public water suppliers should consider local factors as a way to prioritize possible conservation measures. Below are a few general factors that can help local decision-makers focus efforts where demand reduction may have the most notable impact. Median Home Value ($500,000 or greater) 98 Households with a higher median value tend to have higher per capita water use. This trend has been observed in households with a median home value of $500,000 or more. The increase in water use can probably be attributed to larger lots that have more landscaped areas. This presents an opportunity for potential water savings if such households are equipped with the proper tools and knowledge to reduce outdoor water use through the various mechanisms that apply to large landscape conservation measures. It is important that communities consider their unique situation when embarking on the above targeted conservation measure. Some households with a lower home value show higher per capita water use that may be attributed to faulty plumbing. Housing Units Built Before A community/service area with a large number of housing units built before 1994 could provide a substantial customer base for fixture and fixture fitting replacements and retrofits. Toilet replacement with HETs is ranked #1 in water savings in Table 12 and addresses the highest indoor source of water use in non-conserving homes. 100 A Residential Plumbing Retrofit program and/or HEW program could also be considered although the water savings are typically not as substantial. In our region, there are currently 8 municipalities with over 30,000 households built in 1994 and prior: Evanston, Elgin, Arlington Heights, Schaumburg, Joliet, Naperville, Chicago and Aurora. 101 Table 18: Local factors and associated conservation measures Local factor Conservation measure 97 Median home value ($500,000 or greater) Large landscape Housing units built before 1994 High efficiency toilets Residential plumbing retrofits High efficiency clothes washers Utilities with substantial water loss System water audits Leak detection and repair Peak demand as a percent of peak capacity (80% or greater) Water waste (landscape) System water audits, leak detection and repair Public information Large landscape 97 For details, reference corresponding conservation measure section in Chapter Dziegielewski, Benedykt. August 25, Residential Water Use In Northeastern Illinois: Estimating Water-use Effects of Infill growth versus Exurban Expansion. Southern Illinois University Carbondale. Pages See 99 The Energy Policy Act of 1992 was enforced in Illinois January 1, Therefore all housing units built after this date already have efficient water fixtures. It is recognized that a certain portion of housing units built prior to 1994 will also have efficient fixtures due to renovation and natural replacement. However it is assumed that the majority of fixtures have not been renovated or replaced. 100 Amy Vickers, Handbook of Water Use and Conservation. Amherst, MA: WaterPlow Press. 101 U.S. Census Household Data, See 122
139 Utilities with Substantial Water Loss Identifying substantial water loss is ultimately done at the local level. Public water suppliers have traditionally used UFF and Non-revenue water (NRW) calculations to assess water loss. For Lake Michigan water systems, UFF is limited to 8%. 102 All public water suppliers should conduct an annual water audit such as found in the AWWA s Water Audit and Loss Control Program Manual described earlier in Chapter 4 to determine their level of water loss. As a result of the audit, leak detection and repair may be the next logical step to controlling water loss. Leaks can be a major source of revenue loss for a supplier and provide water savings for the region. 103 Cost-effective leaks should be fixed. Meter inaccuracies, hydrant use, unavoidable leakage and unauthorized use should also be considered possible sources of water loss. Peak Demand as a Percent of Peak Capacity Public water suppliers often use peak demand data to assess their system s capacity and to plan for future infrastructure expansions. Peak demand is the maximum demand for a water supply system within a given timeframe. System capacity is the quantifiable amount of water that can be produced from a specific system. As the maximum demand (peak demand) approaches the water supply system s capacity, public water suppliers often plan to expand water supply infrastructure such as developing new sources of water or increasing current pumpage rates. Both of these options increase supply to offset and reduce the peak demand percent of total capacity. Another option is to reduce peak demand thus avoiding potentially unnecessary and relatively expensive infrastructure expansion costs. Peak demand can be reduced by implementing locally appropriate water conservation measures which almost always cost less than expanding water supply infrastructure. Currently in our region, there are at least 28 municipalities in which their peak demand is 80% or more of their system s capacity. 104 These communities could consider using water conservation measures to reduce their peak demand. It should be noted that peak demand as a percent of total capacity can be affected by many factors which can alter the severity of the need to act. Those factors include water supply source, water treatment option, local economic conditions, water system size, water demand characteristics, and the speed of population growth. This means that there is no optimal cut off percentage that would apply for all public water suppliers in the region. However, public water suppliers should monitor peak demand and decide for themselves at what percentage, based on their local factors, triggers the need to plan preferably for conservation programs to reduce peak demand. 102 Unaccounted for Flow percent is the total Unaccounted for Flow (in mgd) divided by the Net Annual Pumpage (mgd) multiplied by 100. The UFF figure is a combination of unavoidable leakage and Unaccounted for Flow. IDNR is responsible for collecting annual water use audit forms from Lake Michigan Permittees from which this number is obtained. 104 CMAP Water Utility Survey Data, Chapter 4, Table
140 Chapter 4 Demand Management and Other Strategies Evaluating Measures for Proper Planning of a Conservation Program The suggested conservation measures in this chapter need to be implemented as part of a well-designed and executed conservation plan. In addition there may be extraneous local conditions that diminish or void notable demand reduction. It is important to consider a full spectrum of local factors that would affect the implementation of any conservation measure. For instance, the relationship between decreased demand due to conservation measures and the resulting financial impacts will be unique for every public water supplier. However the general relationship is described in the following two paragraphs. When demand for water decreases, there are two likely effects: a decrease in production costs and a decrease in revenue. The resulting short term financial impact is generally negative for most water utilities, as, given the capital intensity of the water industry, revenue losses are generally greater than operating cost savings. But short term losses depend on whether the reduction is expected. If demand reductions are accurately planned for, as they can be with conservation program implementation, revenue impacts can be mitigated by rate structure design, thereby ensuring revenue neutrality for the utility. Consumers in turn, are able to hold water bills constant by counter-balancing rate adjustments with water conservation. When undertaking a conservation program, the realistic expectation from both consumers and utilities is therefore that rates will increase to cover both programmatic expenses and to recover lost revenue. 105 Depending on the price elasticity of demand, rate increases will have further impacts on the quantity of water demanded and revenue. 106 Each utility therefore needs to examine the issue of demand reduction and revenue generation in light of their own price elasticity of demand, rate structure, 107 cost and operating characteristics, debt structure, and infrastructure situation. Utilities should also not focus exclusively on the short-run impacts of conservation. Because the water industry is capital intensive, the capital cost savings in the long run are significantly larger than in the short run. Long-term demand reduction can indefinitely defer the need for capacity expansion, so that expansion spending can be deferred in turn. The result is significant savings over time using long run avoided cost analysis for utilities close to exceeding capacity. 108 Faced with increasing water supply scarcity and infrastructure costs, water utilities must balance short-term revenue losses, programmatic costs, and planning costs against the long term benefits of water conservation. A complete analysis would also include consumer, societal, and environmental costs and benefits, associated impacts on wastewater flows, and compare demand reduction strategies with traditional supply alternates to find the least-cost solution. To assist utilities with this analysis, the Alliance for Water Efficiency has recently developed a sophisticated Conservation Tracking Tool 109 that provides a more comprehensive analysis of locally appropriate conservation measures. With the use of utility data, the tool allows public water suppliers to evaluate the benefits, costs and water savings of various conservation measures, tracks implementation of selected measures and evaluates changing revenue requirements based on selected conservation measures. In addition the tool can aid with longrange planning by providing a comparison of returns on investment in demand management versus the more traditional investment of supply augmentation. 105 Bishop, Daniel., Jack A. Weber. Impacts of Demand Reduction on Water Utilities AWWA Research Foundation Notable exceptions include: leak detection and repair programs which reduce cost without reducing demand so there is no revenue loss; demand curtailments by water users that are not volumetrically billed (fixed rate). 106 Price elasticity of demand for water is widely accepted to be inelastic, so that rate increases have the effect of increasing revenues, holding all else constant. In practice, water conservation programs are typically implemented concurrently with rate adjustments, so that the net effect on revenues will require consideration of joint impacts. 107 When water revenues are not based on the amount of water consumed revenues will not be affected. Likewise, revenues from fixed monthly charges remain stable so that the portion of revenues covered with fixed versus volumetric charges becomes important. 108 Margaret Schneemann, Presentation to the RWSPG entitled Economic Value of Regional Water Supply Planning found the benefits of program implementation, even when negative in initial years, exceed the costs by a factor of 2 to 1 over typical water planning horizons. 109 Alliance for Water Efficiency Conservation Tracking Tool, See 124
141 Water-rate Structures for Full-Cost Pricing The goal of conservation pricing is to charge water consumers for the full cost of water service, thereby encouraging efficient use of water resources. Rate structures created without consideration of system costs cannot therefore be considered conservation-oriented. 110 A review of regional water rates and rate structures can, however, provide some insight into the current conservation signals provided by water schedules, as well as provide a starting point for recommendations to improve those signals. 111 The conservation metrics considered include: rate structure, varying rates by block of usage, differentiation of rates and charges by customer class, design of the fixed component of the water bill, billing frequency, and peak pricing. Tables 19 and 20 show the rate structures in northeastern Illinois by water source, for the two customer classes: general residential accounts and large industrial/commercial accounts. The two basic kinds of water charges are volumetric charges, which vary with the amount of water used, and fixed charges, which do not vary with the amount of water use. 112 By definition, conservation rate structures exclude water bills that do not vary with the amount of water consumed (flat charge) whereas rate structures attaching a price to each unit have some conservation message (two-part and volumetric). The majority of water utilities use two-part rate structures for residential, commercial, and industrial accounts. Where flat rates are in place, it is due to customers being unmetered. 113 The metering recommendations as previously discussed are therefore imperative to implementing conservation pricing, as only metered customers can be charged a volumetric price. The strength of the conservation message contained in the volumetric charge additionally varies depending on whether the charge is a uniform charge (same rate charged for every unit consumed) or a block charge (different rates charged based on level of water use). For block rate charges, the charge per water unit may increase or decrease with each block. Decreasing block rates are not considered to be conservation oriented, in that they apply a lower unit rate as water use increases. About 5% of northeastern Illinois systems use decreasing block rates for residential accounts, while 29% of commercial and industrial accounts use decreasing block rate structures Conservation pricing often translates into increasing the volumetric portion of residential water charges. 114 This can be accomplished either by implementing an increasing block rate structure or by charging a separate uniform rate for differing customer classes and time of use. Volumetric charges for residential and general water accounts are presented in Table Apparent from Table 21 is the range in complexity of water rate schedules, ranging from a simple uniform rate to a decreasing block rate with seven different blocks. For pricing to be effective in influencing demand, rates should be clear, simple, and understood by customers. 110 Chesnutt,T., et al. (1997). Designing, Evaluating, and Implementing Conservation Rate Structures: A Handbook Sponsored by The California Urban Water Conservation Council. At the time of this writing, data on costs for the water systems in the northeastern Illinois region are not available. Further, the delivered water price should include the value of natural water (opportunity cost), currently treated as zero for both surface water and groundwater systems. 111 Rate structures for a sample of 284 utilities water utilities serving populations of 1000 or more in northeastern Illinois were collected, representing 50% of the utilities in the region that collectively serve 99% of the region s population served by water supply systems. 112 Rate schedules may also be designed to include both a fixed charge and volumetric charges (two-part). 113 While only 1% of utilities sampled applied a flat rate across all customers, it is important to note that many utilities have flat rates for that portion of their population remaining unmetered. As previously mentioned, CMAP (2008) found 38% of northeastern Illinois utilities had less than 100% metering of their customers. See CMAP 2008 Survey of Water Utilities: Northeastern Illinois. 114 Conservation rate structures are most often focused on residential use due to greater opportunities to reduce discretionary use. 115 The wide range in charges reflects many factors, including system size, age, location, water source, allocation of fixed versus variable costs, and rate-setting objectives. 125
142 Chapter 4 Demand Management and Other Strategies Table 19: Water-rate structures by primary water source, water systems servicing more than 1,000 residential accounts, residential accounts incorporated areas, 5/8 inch meter Table 20: Wate-rate structures by primary water source, water systems servicing more than 1,000 commercial and industrial accounts, commercial/industrial accounts incorporated areas, 4 inch meter and over All Lake Michigan Ground Water Other Surface All Lake Michigan Ground Water Other Surface Basic Structure Basic Structure Two Part 89.44% (254) 85.71% (150) 95.19% (99) 100% (5) Two Part 95.47% (247) 94.51% (155) 96.92% (63) 100% (29) Volumetric 9.51% (27) 12.57% (22) 4.81% (5) Volumetric 2.33% (6) 1.55% (4) 3.08% (2) Flat 1.06% (3) 1.71% (3) Flat 1.94% (5) 1.94% (5) Total 100% (284) 100% (175) 100% (104) 100% (5) Total 100% (258) 100% (247) 100% (65) 100% (29) Volumetric Component Volumetric Component Uniform 86.27% (245) 85.71% (150) 87.50% (91) 80% (4) Uniform 62.79% (162) 65.24% (107) 76.92% (50) 17.24% (5) Increasing 7.39% (21) 8.00% (14) 6.73% (7) Increasing 6.79% (17) 7.32% (12) 7.69% (5) Decreasing 5.28% (15) 4.57% (8) 5.77% (6) 20% (1) Decreasing 28.68% (74) 24.39% (40) 15.38% (10) 82.76% (24) Missing 1.06% (3) 1.71% (3) Missing 1.94% (5) 3.05% (5) Total 100% (284) 100% (175) 100% (104) 100% (5) Total 100% (258) 100% (164) 100% (65) 100% (29) Table 21: Volumetric charges for water in northeastern Illinois, residential and general accounts, charges ($/1000 gallons) Count Mean Median Minimum Maximum Uniform Rate 245 $3.89 $3.70 $0.79 $8.00 Increasing Block 1 20 $3.45 $3.63 $0.96 $5.98 Increasing Block 2 20 $4.75 $4.47 $2.27 $8.58 Increasing Block 3 8 $5.64 $5.40 $2.23 $9.84 Increasing Block 4 4 $4.61 $4.84 $2.16 $6.60 Decreasing Block 1 15 $3.72 $3.73 $0.44 $7.08 Decreasing Block 2 14 $3.12 $2.88 $0.43 $6.18 Decreasing Block 3 11 $2.80 $2.70 $0.38 $4.83 Decreasing Block 4 6 $2.67 $2.75 $0.36 $4.25 Decreasing Block 5 3 $1.39 $1.89 $0.35 $1.92 Decreasing Block 6 2 $1.60 $1.60 $1.56 $1.64 Table 22: Number of rate classes per system Number of Rate Classes Percent Number % 128 More than % 156 Total % to % to % to % to % 8 21 to % 6 above % % 284 Decreasing Block 7 2 $1.26 $1.27 $1.14 $1.39 Note: Increasing Block structure equal to 20 due to one system having only combined water and sewer rates. 126
143 Conservation rate structures include rates that are designed to allocate system costs based on cost of service provision, so that price should indicate variability of cost of supply to differing customer classes. The number of rate classes in place provides an indication of the extent to which such allocation is taking place, assuming such classifications are not arbitrary. Types of price differentiation occurring across northeastern Illinois include: customer class, 116 meter size and meter type, 117 geographic location, 118 water source, 119 structural attributes, 120 and senior citizen status of customers. 121 The number of rate classes per water supply system is shown in Table 22 below. A large number of systems only had one customer class (45%); however, conversations with many of these utilities either revealed special negotiated rates for large customers on a case-by-case-basis, or exclusively residential water customers in the service area. Larger numbers of rate classes tend to occur disproportionately in private water supply systems. As previously discussed, the majority of water systems in northeastern Illinois employ two-part rate schedules, which include a charge that does not vary with water use (fixed charge) and a charge that does vary with water use (commodity charge). 122 The commodity portion of the water rate provides a conservation message, whereas the fixed charges do not; for conservation purposes, the charge for water should therefore be separated from the charge to cover non-water expenses. 123 From a conservation perspective, the purpose of the fixed charge should be to recover costs not directly related to the production and delivery of water, such as customer-service related costs, meter reading, billing, and collection. Compared with traditional rate setting primarily concerned with revenue stability, 124 conservation rates emphasize the commodity portion of the water bill and tend to shift costs to the variable charges from fixed charges. There are additionally two types of fixed charges, those that do not include any water provision, and those that do (often termed a minimum charge ). Including water provision in the fixed component of the water bill does not send a conservation message as the charge does not vary with use, in essence acting as a flat rate charge. When designed properly, conservation rates reward efficient water users and surcharge nonessential consumption. 125 If included, the minimum water provision should therefore not be higher than the average use by residential customers for essential purposes The most popular customer classes are residential, industrial, and commercial although a total of 22 different customer classes occurred across the sample. 117 Fixed charges for meter sizes ranging 5/8 inch through 12 inch, while meter types include positive displacement, compound, and turbine. Meter size is an indication of the demand for water, with larger meters representing higher demand and therefore cost. 118 Primarily occurring between customers located in the incorporated area versus customers in the unincorporated area, with additional price discrimination present for users in specific subdivision areas, as well as users in particular fire districts paying differing fire protection charges. 119 For example groundwater versus Lake Michigan water, or village system water versus purchased water. 121 Communities prioritizing equity and fairness as objectives for water rates and creation of customer classes (such as low income, elderly) should be aware of potential conflict with efficiency and conservation criteria. 122 Additional fees are typically charged for new connections (connection charge, hookup fee) which are important in signaling water value to developer and potential residents, however, these fees are not addressed here. 123 Relatively high fixed charges may, however, be attractive to both utilities and bond rating agencies for the revenue stability which they afford. On the other hand, large fixed charges work in opposition to both affordability and conservation objectives. Revenue recovery supports implementation of average-cost pricing, and results in the associated inefficiencies. 124 As provided for by the predictability of revenue from fixed charges. 120 Such as number of flats in a building or number of businesses. 127
144 Chapter 4 Demand Management and Other Strategies As discussed previously, utilities may have equity objectives in addition to conservation objectives, so that the affordability of the minimum charge will be determined by local utility needs and economic conditions. Table 23 shows the relation of the amount of water actually provided under a minimum charge to three hypothetical levels of water use: the average amount of indoor water use for a home practicing water conservation, the average indoor water use for a nonconserving home, and the average household water use across the northeastern Illinois region. 127 Of the 151 systems providing water under a minimum charge, the percent with a minimum provided water amount above the estimated average household use in the northeastern Illinois region is 5.30%. The percent of systems with a required minimum water use above the average indoor use of a conserving household is almost 20%. Water rates can be designed to affect total demand or peak demand, so that systems with peak water demand concerns (load management) can consider alternative rate structures capturing the cost of peak usage, whereas systems facing an overall water shortage (capacity planning) focus on year-round water conservation. 128 For example, where there are large seasonal differences the cost of water provision rates can be used to shift demand from peak periods (i.e., summer) and/ or require that users responsible for the peak demand pay for the associated additional capacity. 129 IDNR currently requires permittees to adopt ordinances restricting lawn watering as a means of preventing wasteful and excessive water use. Mandatory restrictions on water use (such as limits on outdoor water use) have been found to result in inefficient land-use patterns, 130 deter development and distribution of water conservation technologies, and result in welfare losses to society. Welfare losses occur due to the imposition of uniform restrictions across households with varying preferences and willingness to pay for water, as well as costs associated with enforcing such restrictions. The advantages of market-based approaches, for example allowing prices to rise to reflect scarcity rents during periods of excess demand (e.g., seasonal-water pricing), over such regulatory approaches as mandated curtailment of water use, are well established in the economic literature. 131 Replacing use curtailment as a demand management strategy with price-based strategy will therefore result in gains to both households as well as savings in enforcement and monitoring costs. 132 The issue of billing frequency, as well as frequency of meter reading, becomes even more important when such rates are implemented, as customers will need accurate price signals to be responsive to the new price; utilities will have to consider the costs of more frequent metering, billing, and public relations, customer service. 133 Conservation pricing is more effective when billing is more frequent, so increasing billing frequency will increase effectiveness of conservation pricing. Table 24 shows the frequency of customer billing for residential accounts. 125 Therefore requiring identification of essential and nonessential use consumption amounts for different customer classes. See Raftelis, G.A. (2005). Water and Wastewater Finance and Pricing: A Comprehensive Guide. Third Edition. Taylor and Francis. 126 If the minimum provision is above average use, it will encourage inefficient use of water, and, when customers use water efficiently, they pay for more water then used. 127 Average indoor use is 69.3 GPCD in a nonconserving home, and 45.2 GPCD in a conserving home Amy Vickers (2001) Handbook of Water Use and Conservation. Amherst, MA: WaterPlow Press. Northeastern Illinois average use from Dziegielewski, Ben. Estimating Water-Use Effects of In-Fill Growth versus Suburban Expansion Within the 11-County Area in Northeastern Illinois March 17, Marginal capacity costs (pumping, transmission, etc) are allocated to peak consumption and marginal operating costs are allocated to all consumption. See Warford, J.J. Marginal Opportunity Cost Pricing for Municipal Water Supply. See pdf. 129 See Griffin, Ronald C. Water Resource Economics: The Analysis of Scarcity, Policies, and Projects. The MIT press Typically the residential customer class is targeted for peak pricing as it is widely assumed that large water users such as businesses and industries are more steady on their water use in that their peak-hour and peak-day water use is not dramatically greater than their average water use. In contrast, it is typically presumed that small water users such as households contribute more to peak water usage. Because system capacity is both expensive and constructed to meet peak demands, it is arguable that residential users are causing higher average and marginal costs for the utility (Griffin, p. 247). The implementation of seasonal pricing is further complicated for communities with high seasonal agricultural use and communities economically dependent on summer tourism.
145 Table 23: Residential minimum charge water provision as a percent of use by water source All Systems Lake Michigan Groundwater Percent Count Percent Count Percent Count No minimum charge 46.83% % % 48 Minimum charge 53.17% % % 56 Total % % % 104 Conserving Household (Average Indoor Use 45.2 GPCD) Minimum charge below use 80.13% % % 47 Minimum above use 19.87% % % 9 Non-Conserving Household (Average Indoor Use 69.3 GPCD) Minimum charge below use 93.38% % % 50 Minimum charge above use 6.62% % % 6 Average Household (Total Use 90 GPCD) Minimum charge below use 94.70% % % 51 Minimum charge above use 5.30% % % 5 Note: Difference between sum of Lake Michigan and groundwater systems is the systems using other surface water as their primary source (n = 5). Table 24: Frequency of customer billing by water source, residential Monthly Bimonthly Quarterly Semiannually Lake Michigan 41.71% (73) 30.86% (54) 26.86% (47) 0.57% (1) Groundwater 38.46% (40) 35.58% (37) 25.96% (27) 0.00% (0) Total Systems 41.20% (117) 32.39% (92) 26.06% (74) 0.35% (1) Note: Difference between sum of Lake Michigan and groundwater systems is the systems using other surface water as their primary source (n = 5). Four of these systems bill monthly and one bills bimonthly. 129
146 Chapter 4 Demand Management and Other Strategies Water Rate/Conservation Pricing Recommendations State: 1) Continue to support statewide public education programs including information on the value of water and conservation-oriented rate structures ) Review regulations/institutional barriers potentially prohibiting the implementation of conservation pricing, including supporting municipalities in creating and maintaining revenue stabilization funds. 3) Support efforts for excess revenue resulting from conservation pricing to be used for funding water conservation programs. 4) For the Lake Michigan service region, IDNR OWR should encourage permittees to assess the feasibility of adopting seasonal water pricing. CMAP: 1) Provide information/guidance to public water suppliers, city councils, and the general public on full-cost pricing. 2) Provide assistance to public water suppliers implementing, phasing-in, and fine tuning conservation-rate structures including facilitating stakeholder/public involvement. County Government: 1) Foster public acceptance and political viability of conservation pricing. 2) Recommend conservation-orientated rates for systems with above average regional water use. 3) Facilitate shared rate technicians to estimate economicbased water prices to assist small municipalities and garner support for conservation pricing. Public Water Supplier: 1) Ensure customer understanding of water-rate schedules, water bills, and meter reading. 2) Review and rank rate-setting objectives with stakeholder/ community input. 3) Implement rate structures based on full cost water price within a broader conservation program. 4) Work with local and state government to establish revenue stabilization funds, to enable simultaneous meeting of revenue requirements, conservation, and efficiency objectives. 3) Provide estimates of the scarcity value of natural water and scarcity of water infrastructure capital to assist water managers with decision-making and educational efforts. 4) Develop and share information on economic pricing of new water connections and infrastructure investment to help inform other planning processes relating to water scarcity and land use. 130 Encouraging development in water-scarce regions, along with large lawns, and nonnative-plant species. 131 See, Erin T. Mansur and Sheila M. Olmstead. The Value of Scarce Water: Measuring the Inefficiency of Municipal Regulations. NBER Working Paper No October Where the distributional consequences of pricing are of concern, rebate programs can be designed to ensure equity objectives. 134 Implementation of conservation pricing requires both utility and public support, so that public education programs increase the effectiveness of conservation pricing and the recommendations in this regard are important to implement along with any pricing reforms. Utilities considering conservation rates should understand how such pricing fits within a larger comprehensive conservation program and impact demand and revenue, and may want to phase in conservation rates as public awareness increases. 133 Meters in the northeastern Illinois region are read monthly, at most, so that knowledge of peak use within a day, week or month is generally unknown, limiting the application of time-of-use rates. Monthly metering does, however, allow for time of year pricing, or seasonal pricing. 130
147 Graywater One approach to water conservation that is becoming more popular and beginning to take hold across the U.S. is graywater. Graywater (sometimes spelled graywater, grey water or gray water) is defined as used water from laundry machines, bathtubs, showers, and bath sinks. Residential graywater recycling systems divert these used flows before they mix with other wastewater sources such as toilet wastewater (known as blackwater). Graywater is increasingly being used indoors for toilet flushing in many places throughout the country and world. There are also outdoor uses for graywater that include watering of plants, trees and shrubs, as well as lawn irrigation. Research shows that showers/tubs, bathroom sinks, and washing machines can comprise anywhere between fifty to eighty percent of residential water use. It is also estimated that toilet flushing alone can account for almost 30% of indoor household water use. Thus the reuse of graywater for toilet flushing and outdoor irrigation purposes has the potential to conserve a large amount of potable water and energy. Savings in both these areas can translate to significant savings in financial costs for water utilities and households alike. 135 There are many benefits in using graywater, including: 1. Reduces the amount of potable, fresh water used by households. 2. Reduces the flow of wastewater entering sewer or septic systems. 3. Minimizes the amount of harmful chemicals used by homeowners. 4. Supports plant growth without using expensive potable water. 5. Helps recharge groundwater when applied outdoors. 6. Raises public awareness of natural water cycles. 7. Saves money on water bills. As the water-saving benefits of graywater become more widely known, more states are beginning to implement graywater guidelines. For example, Washington, Massachusetts, New York, South Dakota, Montana, Texas, Nevada, Arizona, California, Utah, New Mexico, Georgia, and Florida all have, or are working to incorporate graywater laws, regulations, codes and/ or guidelines. Additionally, the National Association of Home Builders recently updated its Green Building Standards Guide, which now includes graywater reuse, as permitted by local code, within its building options. 136 As the demand for graywater increases, so does the type of technology available for homeowners/uses. Today there are quite a few companies that specialize in graywater systems and they range from basic outdoor irrigation reuse to advanced indoor water sanitation for toilet flushing purposes. 135 More information can be found in Amy Vickers s Handbook of Water Use and Conservation, National Association of Home Builders, Green Building Standards Guide, See 131
148 Chapter 4 Demand Management and Other Strategies As mentioned, several states and communities have incorporated graywater reuse practices successfully into their regulations. What follows below are case studies from various states and municipalities. These examples demonstrate the do s and don ts when implementing graywater regulations. Arizona Arizona has developed comprehensive graywater regulation that can be applied as appropriate to each local government s need. The state uses a 3-tiered approach based on gallons used per day. Graywater is only allowed for outdoor irrigation, no indoor uses have been approved by the state to-date. Arizona has also created a Graywater Conservation Tax Credit as an incentive for homeowners to install a graywater system in their home. Many states have followed Arizona s lead in creating a performance-based, tiered approach to graywater regulations including New Mexico and Texas. 137 Massachusetts Massachusetts allows the permitting of graywater systems for new residential and commercial construction. The state also allows the use of graywater for toilet flushing purposes, provided each locality meets certain state provisions. California California state law permits county and city health departments to allow graywater systems to be attached to house plumbing in order to facilitate the reuse of graywater. A graywater guide is now part of the state plumbing code, making this type of water reuse legal everywhere in California. This guidebook was created to help homeowners, developers and builders better understand how to properly install graywater systems. 138 It is important to note that California s graywater regulations are based on a design-standards model versus a performancebased regulation as Arizona has. Due to the limiting and restrictive nature of design standards, demand for graywater systems did not follow expectations. Malibu, California The City of Malibu has created its own educational handbook to guide residents in the proper installation and use of graywater systems based off of California s graywater regulations. These types of educational materials significantly assist in promoting the use of graywater. 139 Texas The State of Texas has adopted graywater regulations that guide use of graywater for agricultural, domestic, commercial and industrial situations provided each system follows applicable health and safety codes. The state does not require a permit for graywater use for homes/residences that use less than 400 gallons per day. Similar to Arizona, the state only allows graywater for outdoor irrigation provided it is not applied using a spray-type mechanism. 140 Savannah, Georgia The City of Savannah has adopted a regulation that allows graywater to be used for toilet flushing provided the graywater has been filtered, disinfected and dyed. 137 State of Arizona, See State of California, See City of Malibu, CA. See Texas Graywater Law, See 132
149 Given the lessons learned from other states and municipalities, what follows below is some discussion of issues that require consideration when implementing graywater regulations. The nature of a graywater regulation is important when attempting to implement legislation successfully. In particular, choosing whether to regulate based off design standards versus performance standards is an important consideration. As noted above, the state of California based its regulations on specific design standards that all systems must comply with. Because of this, the state has not seen many requests for graywater permits. Conversely, the state of Arizona based its regulations on performance standards. Performance standards are not as limiting and provide room for innovation within the field. Thus, the state of Arizona has seen a steady increase in demand for graywater permits. Another consideration involves issues that may arise with existing codes or ordinances. Counties and municipalities may have regulations that conflict with the ability to implement a graywater regulation. When implementing this type of regulation, it is important to refer to existing public health codes, septic treatment codes and wastewater management requirements and amend or update any laws and regulations that may inadvertently prohibit the use of graywater systems. In order to effectively promote the use of graywater, it is important to establish a streamlined permitting process. If a significant amount of time and effort is required to obtain a permit, it will inadvertently dissuade homeowners from implementing this water-conservation strategy. Having a straightforward process for obtaining a permit will streamline the use of graywater and make a substantial contribution to demand reduction/ potable water savings. It is also important to clearly outline technical details required in order to obtain a permit. For example, in outdoor graywater reuse, it is important to clearly list whether or not it is required that a sub-surface drip be used versus spray irrigation. A final consideration is education and outreach. These two components are necessary for the success of a graywater regulation. There is a potential for community resistance to adoption of graywater ordinances if a lack of understanding exists. Education and outreach programs will help mitigate this potential obstacle. Additionally, public health officials may have health-related concerns regarding the use of graywater. Without proper training and education, these departments could require a longer, more complicated permitting process. Education and outreach should be geared toward the general public, developers, and public health officials as well. Costs for installing graywater systems vary greatly depending upon two considerations: 1. Whether or not a graywater system is being installed during new construction or is being retrofitted into an existing building; retrofitting may be more costly and potentially cost prohibitive). 2. Cost also depends on the type of system installed and the purpose for which reuse is planned (e.g., indoor toilet flushing versus outdoor irrigation). As noted previously, graywater systems vary from simple, low-cost systems to highly complex and expensive systems. More sophisticated systems can treat graywater prior to reuse using settling tanks and sand filters in order to remove pollutants and pathogens if so desired. 133
150 Chapter 4 Demand Management and Other Strategies Wastewater Reuse There are a few graywater systems currently in use within the City of Chicago. Approval for these graywater permits was obtained via city officials and the Department of Public Health. There are currently no known regulations or laws that specifically address graywater reuse within the State of Illinois. Given the growing regional need for gains in conservation and efficiency, the following recommendations are made. Graywater Use Recommendations State: 1) Establish regulation, based on performance standards, that permits graywater-reuse systems. The regulation should guide counties and municipalities to further regulate the use of graywater by local ordinance. 2) Provide general education materials to the public about graywater use. 3) Create a graywater tax credit for homeowners who install a graywater use system. CMAP: Create model ordinance for adoption by county / local government to guide local implementation of graywater use systems. County Government: 1) Adopt ordinance that specifies performance-based standards for implementation of graywater use systems. 2) Provide general education materials to the public about graywater use. While there may be other benefits to the use of reclaimed wastewater, the rationale for pursuing reuse in a water supply context is to replace the use of potable water with reclaimed wastewater. This avoids the use of higher-value potable water for lower-value needs and frees up potable water for other higher-value uses. The water supply planning region has extensive wastewater treatment systems already, and thus one objective in this planning cycle is to identify opportunities to retrofit existing treatment systems to distribute reclaimed wastewater and to retrofit certain potable water applications to use reclaimed wastewater. There are three potential suppliers of treated effluent: centralized wastewater treatment plants, decentralized wastewater treatment plants and satellite treatment systems. Centralized plants collect wastewater from homes and businesses from a fairly large area. The water is treated and typically released into river or stream. Most households and businesses in the region are served by these centralized systems. Decentralized wastewater treatment plants are sized to treat wastewater from a smaller area, typically a single development or subdivision. The treated effluent is either released to a surface water source or is land applied. Although there are no examples of it in the region, a satellite treatment system could be located upstream from a central treatment plant to treat raw wastewater for local use. The raw wastewater could be intercepted before entering the sewer system, or it could be withdrawn by tapping into a trunk sewer ( sewer mining ). Public Water Supplier: Support local installation of graywater use systems. 134
151 Potential Users This plan considers three primary applications for treated effluent: turf irrigation, industrial, and agricultural irrigation. These applications are described below. Turf Irrigation - Turf irrigation is the simplest of the potential uses, as water quality needs, while important, are not as stringent as they would be with agricultural use or as varied as they might be with industrial use. Irrigating turf in park districts, golf courses, homeowners association property, and cemeteries may be a candidate for a reclaimed wastewater program. There are also a number of examples in the region of golf courses and park districts irrigating with treated wastewater, providing a base of practical knowledge which could be drawn up to expand reuse in the region. In this first planning cycle, the turf irrigation on golf courses and park lands is the main opportunity to expand wastewater reuse. Industrial - Many industries are water-intensive, both in their use of cooling water and in process water. A major benefit of industrial reuse is that demand for reclaimed wastewater would not be seasonal, as is irrigation, although it may still fluctuate with plant output or other factors. However, water quality requirements may be high and also varied. The use of reclaimed water may be perceived as high risk (as well as low reward because of the price of water). Agricultural Irrigation - There are a few instances of using reclaimed wastewater on cropland in the region, generally on small plots. Although agricultural reuse is permitted under Illinois regulations, some buyers have apparently instituted a policy to refuse crops which have been irrigated with reclaimed wastewater, but it is not known how widespread this policy is among purchasers. 141 Demand Estimation This plan primarily examines the opportunity to distribute reclaimed water from existing centralized plants in the region to irrigate turf nearby. We conducted a market assessment to evaluate the project concept of installing a modest pipe network to distribute effluent from treatment plants for use in turf irrigation. 142 Currently existing centralized treatment plants and turf irrigation are the most appropriate opportunities for water reuse in Northeastern Illinois due to the abundance of these plants and the amount of irrigated turf. Turf irrigation opportunities within a one mile radius from a centralized plant were specifically identified. The 2001 CMAP Land Use Inventory and the 2001 National Land Cover Database (NLCD) were used to locate areas within the water supply planning region that have a potential demand for water reuse. The 2001 NLCD is a dataset of 30-meter grid cells that provides a single value for land cover, tree canopy, and imperviousness for each cell. The potential irrigation demand was estimated using the mass balance method described in the regional water demand report, 143 where the depth of irrigation needed is considered equal to the summer rainfall deficit. Potential irrigation demand values for each cell within a given land use polygon were summed to represent total demand within that polygon. 144 The polygon can effectively be treated as an individual customer (Figure 25). Note that the method provides an estimate of potential irrigation demand by each customer, not whether irrigation is actually used on a particular site. After estimating potential irrigation demand, an attempt was made to determine which sites would most likely meet state regulatory requirements. Illinois has few regulations to govern the use of reclaimed wastewater for beneficial purposes. The main body of administrative law relating to reclaimed wastewater, found at 35 IAC 372, is meant to provide design standards for land application of effluent. 141 Noted by Agriculture caucus delegate to Regional Water Supply Planning Group, June 24, 2008 meeting. It was thought that the rationale for refusing crops irrigated with wastewater was the potential for contamination with heavy metals. Delegates from the Wastewater and Non-Municipal Water Suppliers caucus noted, however, that heavy metals are typically from industrial operations, which are regulated under the National Pretreatment Program, substantially reducing the heavy metal load reaching wastewater treatment plants Furthermore, metals associate with the solid fraction of wastewater during treatment and tend to be removed with the sludge. 143 B. Dziegielewski and F.J. Chowdhury Regional Water Demand Scenarios for Northeastern Illinois: Project Completion Report. Southern Illinois University Carbondale. See page The equation used to estimate potential demand in each cell is potentially irrigated area (acres) rainfall deficit (inches) = potential irrigation use (gallons per day). 142 The demand report produced as part of the regional water supply planning effort estimates golf course demand, but it does not do so on a site-specific basis, and nor does it estimate demand by other potential landscape irrigation users. 135

152 Chapter 4 Demand Management and Other Strategies Figure 25: Intensity of potential irrigation demand 136
153 Table 25: Potential irrigation demand by land use category, million gallons per day Land Use without land application standards with land application standards Golf courses Recreational open space Educational facilities Cemeteries Industrial parks Cultural/entertainment Other institutional Government services Office campuses Medical facilities Religious facilities Business parks Correctional facilities Total The effect of considering these standards, in comparison to the unrestricted results, is shown in Table 25. The top four land uses for potential irrigation demand are, in either case, golf courses, parks ( recreational open space ), schools, and cemeteries, although it is expected that irrigation is fairly rare at cemeteries. These four land uses account for 80% of demand with or without considering the land application standards. Supply Using the potential irrigation demand calculations at right, the potential demand within a one mile radius of existing centralized wastewater treatment facilities was determined. The results of this analysis can be seen on the following page in Table 26. Potential demand and the annual average daily flow are also compared to quantify what percentage of the daily flow would be used for water reuse. In a few cases, there currently is not a sufficient amount of treated effluent to support potential demand. The source for the public water supply is also identified. Distribution Figure 26 shows a conceptual distribution network from the Addison North Sewage Treatment Plant running through street right-of-way to connect all the potential irrigation users within the one-mile buffer of the plant. The amount of pipe required to connect all of the potential users to the treatment plant would be approximately 30,500 feet. The length required to connect the treatment facility to the golf courses immediately north of the plant would be considerably less at approximately 1,800 feet, but would serve only 0.25 mgd. The golf courses were singled out due to the large amount of irrigation typically required and their proximity to the facility. The annualized unit cost of the reclaimed wastewater distribution systems at two different scales can then be estimated as shown in Table 27. In other words, this is roughly what the utility would need to charge in order to recover its costs. 145 The Village of Addison has water rates of $4.05/1000 gallons thus this analysis suggests that for plants with high demand density nearby, a reclaimed water system could be financially viable in that a user would have a financial incentive to switch to reclaimed water. 146 If the potential reuse sites are currently purchasing potable water for irrigation they may benefit from such a system. 145 The method is developed in detail in Anderson and Meng, 2008, and this section relies heavily on their work. Costs include the amortized cost for pipeline and pump installation as well as annual O&M for pumping. It is assumed that pipeline installation cost is $135 per foot, the interest rate is 6%, the amortization period and facility life span are 40 years, and that irrigation is used for half the year. It is also assumed that no costs are incurred for additional treatment. 146 Addison, IL, See 137
154 Chapter 4 Demand Management and Other Strategies Table 26: Potential irrigation demand within one mile of wastewater treatment plant, top 40 ranked Facility Name Potential Demand (Mgd) Potential Demand/ AADF Public Water Supply Addison North Stp % Lake Michigan Wood Dale South Stp % Lake Michigan Wood Dale North Stp % Lake Michigan Itasca Stp % Lake Michigan Nssd Clavey Road Stp % Lake Michigan Lockport Stp % Groundwater Libertyville Stp % Lake Michigan Mundelein Stp % Lake Michigan Dupage County- Nordic Park Stp % Lake Michigan Carol Stream Wrc % Lake Michigan Dekalb S.D. Stp % Groundwater Bensenville South Stp % Lake Michigan Romeoville Stp #1 And # % Groundwater Mchenry Central Stp % Groundwater Wheaton Sd Wwtf % Lake Michigan Mwrdgc Kirie Wrp % Lake Michigan Geneva Stp % Groundwater Flagg Creek Wrd Mcelwain Stp % Lake Michigan Huntley West Stp % Groundwater Fox River Wrd West Stp % River/Groundwater Facility Name Potential Demand (Mgd) Potential Demand/ AADF Public Water Supply Crest Hill East Stp % Groundwater Deerfield Wrf % Lake Michigan St. Charles-West Side Wtf % Groundwater Crystal Lake Stp # % Groundwater Bloomingdale-Reeves Wrf % Lake Michigan Addison South- A.J. Larocca Stp % Lake Michigan St. Charles Wwtf % Groundwater Cary Wwtp % Groundwater Beecher Stp % Groundwater Carpentersville Stp % Groundwater Huntley East Wwtf % Groundwater Mwrdgc Egan Wrp % Lake Michigan Lcdpw- New Century Town Stp % Groundwater Fox River Wrd South Stp % River/Groundwater Roselle-J. Botterman Wwtf % Lake Michigan Mchenry South Wwtp % Groundwater Barrington Wwtf % Groundwater Naperville Springbrook Wrc Aadf = Annual Average Daily Flow % Lake Michigan Table 27: Relationship between pipeline length, flow rate, and unit cost for Addison North sewage treatment plant Pipeline length (mi) Flow (mgd) Annualized unit cost (2007 $/1,000 gal) Total Area Demand $1.75 Golf courses only $

155 Figure 26: Example of conceptual distribution network from treatment plant 139
156 Chapter 4 Demand Management and Other Strategies Pipeline construction costs are the largest cost involved in developing a reclaimed wastewater system. There are number of other costs associated with retrofitting existing irrigation systems and treatment facilities for water reuse, which include retrofitting the irrigation system with clog resistant nozzles, building irrigation ponds, pump installation and operation and reclaimed wastewater signage. Water reuse can also potentially reduce the amount of fertilizer used on site due to the elevated levels of nitrogen. Regulation and Permitting The only regulation directly shaping water reuse opportunities in Illinois is the slow-rate land application design standards at 35 IAC 372. Currently IEPA issues permits under the National Permitting Discharge Elimination System (NPDES) program for surface discharges of wastewater. In contrast, it permits non-discharging systems, under the less burdensome design standards at 35 IAC 372. The question then arises as to how IEPA permits partial reuse of effluent from a plant that would otherwise discharge to a surface body under the NPDES program, such as is being proposed in this plan. It appears to be dealt with on a case-bycase basis. For example, in the Village of Richmond the design standards (depth to groundwater, proximity to wetlands, etc.) were interpreted as guidelines. In the Village of Lakewood, direct reuse by piping effluent to a golf course was an initial option, but the outfall was placed so that all effluent would first enter waters of the U.S. before ultimately being used for spray irrigation on the golf course. These particular examples and other available information suggest that IEPA has tended to use its regulatory discretion to promote water reuse where possible, but it still appears the typical permit applicant will face uncertainty about whether and how partial reuse will be permitted. From a water quantity standpoint, the question may also arise whether upstream users need to provide return flows, a requirement that has hampered reuse projects in the American West. Implementation Scenarios There are several situations or contexts in which reuse would likely be most feasible. 1) The most straightforward situation promoting reclaimed water use is that in which the irrigator presently uses potable water from a utility with growing demand. In this case the irrigator faces a unit price for potable water, giving it an incentive to switch to a less expensive source, and the utility will have an incentive to offer recycled water in order to free up capacity in the potable system to meet growth and delay system expansion. The main limitation with this case is that large irrigators like golf courses and park districts are typically self-supplied, pumping water from nearby streams but more often from shallow groundwater. Nevertheless, an irrigator would face costs for electricity to run wells and pumps as well as for installation and maintenance. 2) In groundwater dependent communities, especially any that use wells finished in the surficial or shallow bedrock aquifer systems, the use of shallow wells by irrigators may reduce availability for both community water suppliers and irrigators. Drought may also trigger irrigation restrictions. For users who do not require potable water to instead use recycled water would help prevent these conflicts. 3) Instances in which wastewater would be discharged to a high quality stream or to one that requires more stringent load limits. For instance, prevention of degradation could be accomplished by partial reuse, limiting the amount of new wastewater that enters the stream, or lower load limits applied to an existing discharge would provide a rationale to divert some flow to a reuse application. Nutrient trading could be a rationale for water reuse, as well. 140
157 4) In areas that use Lake Michigan water and are within the historic Lake Michigan basin, there is a possible double benefit to reuse. Because the diversion of Lake Michigan water is tracked at Romeoville (with corrections for inflows upstream) after it has entered the Chicago Sanitary Ship Canal, reusing a quantity of wastewater for irrigation and preventing its discharge will keep it from being counted against the diversion limit ) Satellite reuse is a possibility mentioned above that may forestall the need to expand a wastewater collection/treatment system as well as the potable water system. Wastewater Reuse Recommendations State: 1) IEPA should develop comprehensive rules for reuse that identify numeric water quality standards and acknowledge the benefits of the reuse of all or a portion of wastewater effluent discharged by a treatment facility. County: 1) Provide incentives for reclaimed water system installation. 2) Consider reclaimed water for large landscape irrigation at public institutions. Public Wastewater Treatment Facility: 1) Pursue water reuse opportunities, beyond land application, during new wastewater treatment facility construction or expansion. 2) Consider water reuse as an alternative to upgrading treatment facilities to meet state antidegradation requirements and/or more stringent effluent water quality standards. 2) As the state develops nutrient regulations, irrigation with reclaimed wastewater should be encouraged as an avenue for treatment facilities to meet discharge requirements. CMAP: 1) Provide technical assistance to identify water-reuse opportunities. 2) Encourage water-reuse opportunities through the Section 208 Planning process. 3) Explore setting water-reuse goals for the planning region within the next planning cycle. 147 Here it is assumed that all irrigation water is either evapotranspirated or becomes soil moisture or groundwater, and that the groundwater would stay in the Lake Michigan basin. Some will reenter the sewer system through infiltration, however. 141

158 Chapter 5 Water Management in the 21st Century Serpentine Bridge over the Great Basin at Chicago Botanic Garden, Glencoe, IL 142 Image courtesy of William Biderbost, 2010
159 Chapter 5 Water Management in the 21 st Century Cooperative Management The institutional structure for managing water supply in Illinois took a step forward on August 10, 2009 when Governor Pat Quinn signed into law Senate Bill The Water Use Act of 1983 (WUA), described in Chapter 2, was amended in several key ways. First, high-capacity well and high-capacity intake, the latter a new addition, are defined to be withdrawals from of wells / surface water in volumetric rates of 100,000 gallons or more during any 24-hour period. Secondly, existing high-capacity wells must now register with the local Soil and Water Conservation District in addition to newly proposed high-capacity wells. Thirdly, and of most importance, is a new water-use reporting requirement. Those responsible for highcapacity wells/intakes are now obligated to report water use to the Illinois State Water Survey s (ISWS) Illinois Water Inventory Program (IWIP). Water users of agricultural irrigation are exempt for the first five years, but must determine water use via an estimation method deemed acceptable by the ISWS. Individuals responsible for withdrawals that take place within the boundary of a water authority or other local government entity that estimates irrigation use through a method acceptable to ISWS are exempt from participating as an individual in IWIP. Lastly, the exemption that previously applied to the six northeasternmost counties of Illinois has been removed. This act takes effect January 1, Important as it is to improve water-use reporting, the ISWS will require adequate and consistent funding support to do the job. Thus, a recommendation: The State of Illinois should make an annual appropriation to the ISWS to carry out their IWIP-management obligation and achieve the intention of this act. Activity at the federal level hints at potential for change too. While only in early stages of development, federal legislative activity, should it come to fruition, could impact the way Illinois and regions plan for a variety of water resources including water supply. For example, the Sustainable Watershed Planning Act (staff discussion draft) would bring new federal involvement to assess, coordinate, and implement policies and actions to ensure the sustainable use of the water resources of the U.S. 2 The language of the discussion draft suggests a new level of cooperation with rather than any inference in state jurisdiction and responsibility, water rights, and compacts and treaties having to do with surface and groundwater resources management, including state water law. 1 Public Act See asp?name= The purview of the Act would include investment in water infrastructure, increased water efficiency, improved water quality, improved ecological health and resiliency through adaptive management, full accounting of water availability and uses, and improved understanding of the relationships between human needs, hydrologic conditions, and ecological health. 143
160 Chapter 5 Water Management in the 21st Century States could be eligible for substantial grant funds, but not without some conditions. Among the provisions in the draft language is the establishment of Pilot Regional Watershed Planning Boards organized at the scale of a 4-digit hydrologic unit code (HUC-4) as defined by the U.S. Geological Survey. 3 The Upper Illinois River Basin (HUC 0712), identified under this Act as the planning region for northeastern Illinois, includes all but the Kishwaukee River Basin portion of the 11-county planning region. The Upper Illinois River Basin captures more than the 11 counties, however, to include all of the Lower Fox River and Iroquois River; capturing much of LaSalle County and virtually all of Iroquois County respectively in addition to parts of Indiana and Wisconsin. Another example of potential for change involves a new federal initiative, H.R. 3202: Water Protection and Reinvestment Act of 2009, introduced in July Among other provisions, funding would be generated through the imposition of six new taxes and fees to provide new support for Clean Water and Drinking Water State Revolving Loan Funds. The type of projects that would be eligible for revolving-loan funds would be expanded to include support for water demand management activities among other measures. 4 Other examples of activities, discussions, or papers that aim at change in the way water resources are planned for and managed can be found in organizations such as the Clean Water America Alliance and their recent National Dialogue on an Integrated Water Policy: Urban Water Sustainability 5 ; and America 2050 and their provocative paper, A Systems Approach to Water Resources. 6 The point for calling attention to these state, federal-level, and nongovernmental-organization activities is to reinforce what is becoming increasingly obvious: the status quo for how federal/ state/regional water resources are being discussed, reviewed, funded, 7 and managed is changing. Of course, it remains to be seen if the federal-level activity mentioned here will one day affect regional planning and management. But another reason for highlighting these examples is to illustrate an attribute of them: an inherent level of collaboration expected among various entities involved in some aspect of water supply planning/ management. Thus, cooperative management of a shared resource that knows no jurisdictional boundaries is a key ingredient to improved stewardship going forward and avoidance of unprecedented problems for which the potential of occurrence has now been revealed. In the meantime, it behooves the state and region to maintain an ongoing planning effort to include at a minimum, a forum of discussion for the evolving water planning and management landscape. In this regard, this plan recommends that a continuous process of regional water supply/demand planning should be implemented and regional water supply plans should be refined and updated on a five-year cycle. 8 3 USGS, Hydrologic Unit Map. See 4 H. R Water Protection and Reinvestment Act of 2009, 111th U.S. Congress, See 7 Here, the American Recovery and Reinvestment Act (P.L ) is also acknowledged. 8 The East-Central Illinois Regional Water Supply Planning Committee makes a similar recommendation in their recently published plan. See 5 Clean Water America Alliance, See 6 America 2050, See 144
161 The decentralized nature of water supply planning and management outside the Lake Michigan service region, in conjunction with new science-based conclusions drawn regarding regional groundwater resources, presents an opportunity to discuss new ideas for cooperative management among riverand groundwater-dependent communities. While the current groundwater-provision scheme has worked well during times of relative water plenty, the decentralized structure raises questions about its ability to provide timely solutions during times of regional groundwater shortage and potential conflict among neighboring communities should such a scenario be part of the future. The situation could be especially challenging if the day comes when Lake Michigan water is no longer available to solve water-supply problems caused by either inadequate or poor quality groundwater such as parts of the region have potential to experience. In parts of the planning region furthest from Lake Michigan, lake water is not likely to ever be an option regardless of its availability. It is beyond the scope of this initial planning cycle to make any recommendations aimed at changing the existing governance structure for water supply planning and management such as it is. Rather, in response to new information this plan makes recommendations that are designed to be implemented by a variety of stakeholders within the existing institutional structure of water supply planning and management. This plan depends entirely on voluntary action and cooperation among those entities identified by recommendations. In that vein, this regional water plan honors the spirit and intent of Executive Order Given the experience and knowledge gained over the last three years, it is reasonable to expect that the topic will be given further consideration in the next planning cycle. The following ideas, therefore, are posed as questions that can be explored: 1. What are the advantages and disadvantages of maintaining the existing scheme of decentralized water supply management outside of the Lake Michigan service region should water-use conflicts arise or a subregional groundwater shortage occur? The Rule of Reasonable Use, discussed in Chapter 2, indicates that the judicial system will be the final arbiter of conflicts that result in litigation, but how can the current scheme act to avoid shortage and conflicts alike? 2. A significant portion of the region features a water-useby-permit scheme managed by a state regulatory authority IDNR, Office of Water Resources (OWR). Is there an expanded role for IDNR, OWR to play throughout the 11-county planning region that would bring similar waterresource oversight and thus, assurance of water that nearly 200 municipalities Lake Michigan permittees now benefit from? 3. Can the Water Authorities Act be amended in such a way as to become an acceptable and effective tool for subregional water supply/demand management beyond the Lake Michigan service region (i.e., groundwater and inland river water)? 4. While zoning and land-use decisions are made within political jurisdictions municipalities and counties interactions of shallow groundwater with surface water, issues of water quality, stormwater management, and issues of surface water movement in general are all 145
162 Chapter 5 Water Management in the 21st Century defined by watershed boundaries. As such, does the Fox River Basin provide a sensible framework of geography for organizing municipalities and counties within the Basin to collaborate on river-and groundwater use-management (e.g., conjunctive use) via an intergovernmental agreement or less formal alliance? If so, a similar organizational framework could be developed within the Kishwaukee River Basin and Kankakee River Basin. Put another way, can a river-basin perspective contribute to a new collaborative approach to solving water-resource challenges that were created in part by an approach that either ignored natural laws of hydrology or led to actions taken independent of upstream/downstream consequences? The discussion of regional water supply planning and management, as it pertains to issues of cooperative management or governance, will be ongoing among the many stakeholders in the region. 11 What remains to be seen is which parties choose to participate productively in that discussion and thus, shape the future that will undoubtedly feature new water-use circumstances and challenges to be resolved. In the interim, this plan presents an opportunity for those that wish to lead the region into a new era of economic, environmental, and social prosperity as afforded by adequate and affordable water for all users. 5. Aside from the idea that a river-basin approach to self-organization and cooperative management may have utility, active municipal-county partnerships are encouraged given that many county governments throughout the planning region are studying their groundwater resources for the benefit of all county residents including municipal decisionmakers. Since county governments have brought scientific and other resources to bear on the water-supply issues at hand, what form(s) of partnership might be forged and complementary roles imagined by a new spirit of cooperative management? Are County Regional Planning Commissions, as provided for in the County Code of the state statute 9 the appropriate bodies for these partnerships and should they be given stronger roles in water resources planning? Can the Local Land Resource Management Plans 10 be the tool that will forge planning collaboration between all the jurisdictions county-wide? As a collective voice for municipalities and townships, is there an expanded role for Council(s) of Government to play in matters of water supply planning and management? 9 State Statute 55 ILCS 5/ : the county board is hereby empowered by resolution of record to define the boundaries of such region and to create a regional planning commission for the making of a regional plan (made for the general purpose of guiding and accomplishing a coordinated, adjusted and harmonious development of said region) Metropolitan Planning Council and Openlands, Before the Wells Run Dry: Ensuring Sustainable Water Supplies for Illinois. Recommendation Report Draft Executive Summary. See 10 State Statute 50 ILCS 805/4: A municipality or county, either independently, or jointly or compatibly by intergovernmental agreement pursuant to Section 6, may adopt Local Land Resource Management Plans. Such plans may include goals and procedures for resolving conflicts in relation to the following objectives: (16) Water to ensure good quality and quantity of water resources. The 2030 Land Resource Management Plan adopted in 2004 by the Kane County Regional Planning Commission contains a chapter on Water Resources that articulates the following objective: To preserve and protect the quantity and quality of potable groundwater and potable surface water supplies and to ensure sustainable yields for current and future generations. 146
163 Drought Preparedness Preparation for drought involves insuring that supplies of clean water are adequate, reliable and at a reasonable cost. This is the core of water supply planning and management. Although drought is difficult to define due to the many variables associated with it, it is generally thought of as a persistent and abnormal moisture deficiency having adverse impacts on vegetation, animals or people. 12 According to the Interstate Council on Water Policy, drought will occur at some time every year in the US and each time drought occurs many of the same issues are raised: how much damage was inflicted, to whom, where, who is going to pay for it and how can we prevent or reduce damages and recovery cost in the future? 13 Drought preparedness should anticipate potential conflicts among water rights and between state and federal laws and points of vulnerability such as the reliability of communication systems and other agencies. There is a need for identifying, evaluating and agreeing upon potential provisions for alternative means of supply and distribution that may be necessary during severe or long-term water supply emergencies. This will help communities avoid unnecessary confusion, delay and conflict during emergency response efforts. Recommendations for Drought Preparedness State: 1) Provide data collection on drought monitoring and prediction. 2) Insure efficient information delivery to all levels of government and media. 3) Create long and short term plans for mitigation including assessment of drought impacts. CMAP: 1) Assist in developing drought plans. 2) Assist in developing implementation procedures including mitigation strategies. Public Water Supplier: 1) Improve conveyance infrastructure efficiencies. 2) Develop local implementation procedures. Protecting critical infrastructure systems is essential to developing disaster-resilient communities. Communities need to identify and understand the interdependency among systems such as levees, floodways, reservoirs and detention basins, treatment plants and distribution lines. This understanding is essential in reducing the vulnerability of our critical infrastructure and restoring it to serviceable condition in the event of a disaster. 12 National Drought Policy Commission - Preparing for Drought in the 21st Century, May Interstate Council on Water Policy- ICWP- Position Statement on Drought and Water Supply Emergency Preparedness, August
164 Chapter 5 Water Management in the 21st Century Funding Regional Water Supply Planning and Plan Implementation Beyond the three year pilot planning processes, ending June 30, 2009, the State of Illinois has chosen not to fund the state and regional planning initiative in fiscal year This is problematic for several reasons. First, the taxpayers of Illinois made a sound investment in water supply planning over the previous three years as a result of EO Elimination of funding, promises little more than a serious handicap for unmet planning needs and new plan implementation efforts. Lack of funding can only diminish the return to taxpayers on the investment in planning made thus far. Secondly, the two regional pilot planning processes revealed a number of potentially critical issues that require ongoing attention and action. Here again, the need to maintain adequate water supplies is minimized, if not ignored, without an ongoing State commitment to funding of state/regional water supply planning. Lack of commitment threatens maintenance of regional prosperity and Chicagoland s position in the global economy. Lastly, state funding of regional water supply planning provides some semblance for review and coordinated action at the regional scale that is otherwise missing in the highly decentralized decision making environment that is a feature of the regional water management landscape. To complicate the funding scenario further, the State of Illinois has also chosen not to fund the Comprehensive Regional Planning Fund (CRPF) in fiscal year 2010; a key source of funding for regional planning agencies in Illinois including the CMAP. This funding shortfall impedes CMAP s ability to continue a lead role in regional water supply planning and execute a work plan that is called for both in the collection of plan recommendations made in this document as well as CMAP s enabling legislation where evaluation of water supply is explicitly mentioned. Perhaps at greatest risk from state abrogation of funding for state/regional water supply planning are those communities and counties outside of the Lake Michigan service region where there is no single entity that can ensure safe and adequate water supplies to 2030 or beyond for everyone, despite the attractiveness of suburban and rural areas that will be the preferred destination for many new people expected in the future. Knowing that Lake Michigan water cannot be made available to all groundwater dependent communities that could experience future problems through no fault of their own, a near-ready solution won t be found in the same manner as has been found historically with a switch off of groundwater and on to Lake Michigan water. But here we approach the intersection of funding concerns and issues of governance with the latter, a topic to be explored in the next chapter. 148
165 The state must find a way to achieve fiscal solvency while at the same time meet many challenges that beg for attention; among them active state and regional planning and management of water resources. The three-year pilot planning process came with the promise of $1.1 million dollars for CMAP to lead the regional effort and facilitate the work of the Regional Water Supply Planning Group (RWSPG). While this was a fair sum to orchestrate a regional planning process, it is likely to be insufficient to both maintain a robust planning process and fulfill the regional role in plan implementation. Until such time as recommendations made in this plan for the regional planning agency can be assigned cost estimates, however, a specific amount of state funding cannot ascertained. Relying on state funding alone, however, has proven to be risky in our region. The absence of a regulatory entity (e.g., public utilities commission 14 or water authority 15 ) where public water suppliers are members, likely prevents a source of funding for a regional-scale planning effort. In this case, the importance of funding for the regional planning agency (i.e., CRPF), as called for in CMAP s enabling legislation, cannot be overemphasized as a source of funding support for regional water supply planning. Locally derived funds (i.e., full-cost pricing of water, fees, taxes, membership dues, etc), important as they are, will most appropriately be used to support development and implementation of a local water conservation plan. 16 Thus, the following recommendations are made: Funding Recommendations State: Either through new legislation or amended legislation, the Governor and General Assembly should make an annual appropriation to a state/regional water supply planning program directed by Illinois Department of Natural Resources (IDNR.) CMAP: 1) Study and develop cost estimates for the regional planning agency, in coordination with a regional deliberative body, to ensure an ongoing regional planning effort (i.e., work plan) and implement the regional agency s portion of water plan recommendations. 2) Study and develop in concert with others, the cost of implementing other plan recommendations (i.e., county, public water supplier). 14 The Illinois Commerce Commission currently regulates 33 water, 5 sewer, and 14 combination water and sewer investor-owned utilities. While the number of regulated utilities is a small percentage of the 1,900 public water suppliers and 750 public sanitary sewage systems with treatment facilities in the state, the investor-owned utilities provide water service to almost 1.15 million people. See 15 Similar example is the DuPage Water Commission. 16 A recommendation as such is made for public water suppliers under the Water-Rate Structures for Full-Cost Pricing subsection found in this chapter. 149
166 Chapter 5 Water Management in the 21st Century Monitoring/Data Collection The northeastern Illinois groundwater modeling report developed by the ISWS outlines future recommendations for monitoring and data collection in some detail. The recent Kane County study 17 makes similar recommendations. Here, key issues will be briefly mentioned. The shallow-aquifer study needs to be expanded beyond the Fox River Basin. Potential overpumping and streamflow capture discovered within the Fox River Basin could be occurring elsewhere in the region and needs to be better understood. Monitoring of aquifer heads should be conducted in areas of potential significant future drawdown. Establishing a shallow aquifer well network throughout the 11-county region, similar to the McHenry County network, will be instructive for managing this important source of water. Monitoring of the deep-bedrock aquifer should be ongoing and enhanced. Measurements need to be maintained on the historic five-year interval with more frequent and additional monitoring conducted on selected wells. As suggested elsewhere in this plan, enhanced stream and wetland monitoring is recommended for purposes of improving understanding of baseflow conditions, interactions with shallow-aquifer withdrawals, and aquatic ecosystem function. Monitoring of water quality in both deep and shallow aquifers will be important for determining influences of salinity on the former and following the trend in chloride contamination in the latter. A means to collect better data for irrigation withdrawals and self-supplied domestic use is highly desirable. This is an important component to add to the Illinois Water Inventory Program for collecting water withdrawal data statewide. New data collected from the efforts summarized above will assist with improvements to regional flow model simulations. New model simulations could include optimization of shallow aquifer withdrawal scenarios in combination with new Fox River withdrawals; optimization of deep-aquifer withdrawals; Kankakee River withdrawal simulations; validation of current and future model output. In the interest of regional planning, it is recommended that CMAP add value to data reported to IWIP by providing additional data analysis where possible. The regional water demand report recommends that state resource agencies consider actions that would improve the quality of water withdrawal data and scope of data collection to enhance regional understanding of water use and support future water demand studies. 18 With a new emphasis on conservation, efficiency, and studying full-cost pricing for the benefit of public water suppliers, related data that should be publicly available can also be collected. A sample of these types of data includes: Price/rate (time series) Annual operating/capital budget Withdrawal amount (MGD) Return flow data Pumping amount (MGD) Infrastructure age Cost of infrastructure expansion Percentage of metered connections Population served Water sold(mgd) System capacity Water purchases (MGD) Cost of treatment per 1,000 gallons Rate structure Water source information Billing cycle Conservation budget Water use data by sector These data can be efficiently collected by way of a water-utility survey similar to CMAP s 2008 Survey of Water Utilities: Northeastern Illinois. 19 Furthermore, CMAP s 2008 Household Water Use Survey: Northeastern Illinois should also be repeated every five years to track changing attitudes, understanding, and behavior patterns among the general public Strategy for Developing a Sustainable Water Supply Plan for Kane County See Developing_a_Sustainable_Water_Supply_Plan_for_Kane_County.pdf. 18 B. Dziegielewski and F.J. Chowdhury Regional Water Demand Scenarios for Northeastern Illinois: Project Completion Report. Southern Illinois University Carbondale, page Es-16. See 19 CMAP 2008 Survey of Water Utilities: Northeastern Illinois. See 20 CMAP 2008 Household Water Use Survey: Northeastern Illinois. See 150
167 Next Planning Cycle Sustainability The RWSPG explored the concept of sustainability as it might pertain to regional water supply planning. While those discussions were useful, they did not lead to consensus regarding how to frame the task at hand within or around the sustainability concept. As discussed in the previous chapter, the regional planning process will need to give further consideration to the relationship between sustainability and water supply planning before its place in regional water planning becomes more obvious to stakeholders. Such consideration must include more thoughtful discussion of and agreement on the definition of sustainability as it applies to water planning in northeastern Illinois. To that end, sustainability and definitions of such were explored in Chapter 2 and could serve as a starting point for the next iteration of planning. In the meanwhile, regional water planning will likely need time to mature in order to discover the utility, if not the imperative, of sustainability. Integrated Water Resource Planning While the concept of sustainability has not been formally chosen as a guiding principle or planning framework, other planning models and concepts exist to inform, if not structure, the regional water planning process as it evolves. Here we present one such model. The Water Encyclopedia defines Integrated Water Resources Management (IWRM) as follows: The practice of making decisions and taking actions while considering multiple viewpoints of how water should be managed. These decisions and actions relate to situations such as river basin planning, organization of task forces, planning of new capital facilities, controlling reservoir releases, regulating floodplains, and developing new laws and regulations. The need for multiple viewpoints is caused by competition for water and by complex institutional constraints. The decision-making process is often lengthy and involves many participants. 21 Water supply planning is not specifically invoked above, but the definition certainly captures key characteristics of the three-year regional planning process just completed. Furthermore, IWRM is a flexible framework such that in the water supply field, integrated water resource planning has emerged to address the interrelatedness of environmental systems and societal needs. Integrated water resource planning (IWRP) is an important planning paradigm because of its potential to structure and guide water supply planning. IWRP encompasses least-cost planning and perhaps most important, emphasizes demand management and conservation as alternatives to constructing new capacity which has become increasingly more expensive. 22 It is important to recognize, however, that IWRP is a 21 WaterEncyclopedia.com, See Hy-La/Integrated-Water-Resources-Management.html. 22 Janice A. Beecher, Integrated resource planning fundamentals. Journal American Water Works Association 87(6):
168 Chapter 5 Water Management in the 21st Century planning paradigm for water utilities, particularly those utilities that wish to adopt a more forward-looking perspective. While Palmer and Lundberg 23 suggest that IWRP has been applied at county and state levels in addition to the municipal level, it is difficult to see how IWRP can be rigorously applied beyond the municipal utility level in our region absent the sort of new institutional roles and tools that IWRP also implies. Regional water supply planning, such as it has been conducted over the last three years, is an example of the open and participatory decision-making process required of IWRP. Furthermore, some semblance of the RWSPG has the potential to drive the coordination necessary among the various water-governing institutions such as they are in northeastern Illinois. Given the interest in achieving greater integration of regional water resource management efforts, the concept of total water management may also have utility. 24 A primary tenet of the total water management concept is that the water supply is renewable, yet limited, and should be managed on a sustainable-use basis. Thus, total water management provides a means for considering stewardship, ecosystem management, conservation, stakeholder buy-in, and more. 25 Total water management features the following characteristics while allowing for regional and local variation: Encourages planning and management on a natural water systems basis through a dynamic process that adapts to changing conditions. Balances competing uses of water through efficient allocation that addresses social values, cost effectiveness, and environmental benefits and costs. Requires the participation of all units of government and stakeholders in decision-making through a process of coordination and conflict resolution. Promotes water conservation, reuse, source protection, and supply development to enhance water quality and quantity. Fosters public health, safety, and community goodwill. 26 Regional planning in northeastern Illinois has not been formally structured by IWRP or total water management, but nonetheless the planning process has featured many aspects of these paradigms including diverse stakeholder (i.e., public) involvement. Furthermore, while the RWSPG has neither adopted a goal nor taken a formal position on the matter, they have made clear their interest in a more comprehensive or holistic approach to managing various aspects of the hydrologic cycle including stormwater management, groundwater infiltration, wastewater (reuse), and concern for water quality and ecosystem needs. Finally, while there is great interest in implementing this regional plan, there is also the recognition of the iterative nature of water resource planning. Thus, the next five-year planning cycle, commencing in February 2010, will aim to address deficiencies that are enumerated towards the end of this chapter and the ongoing need for refinement in the many areas under current consideration. It is generally acknowledged that the people, process, and products produced will come to reflect the maturity that comes with time and an ongoing effort. 23 Richard N. Palmer and Kathryn V. Lundberg, (undated). Integrated Water Resource Planning. 26 Ibid Ibid Ibid
169 Other Issues and Users to be Addressed Of necessity, this initial phase of planning does not address all possible issues that are germane to regional water demand/ supply planning and management. Such issues can be explored in subsequent planning cycles. Here, a sample of issues is highlighted below. Matters of infrastructure repair/costs, for example, are not fully addressed in this plan, but are of major concern nonetheless at local, state, and national scales. The American Society of Civil Engineers (ASCE) concludes that, Illinois drinking water infrastructure needs an investment of $13.5 billion over the next 20 years. Furthermore, ASCE concludes Illinois wastewater infrastructure needs require an investment of $13.41 billion. 27 Similarly, U.S. EPA reports a total drinking water infrastructure need of $334.8 billion nationwide for the 20-year period from January 2007 through December In apparent confirmation of these assessments, a 2008 CMAP survey of water utilities within the region revealed that aging infrastructure is exceeded only by funding as the most challenging of 13 issues posed to utilities that responded. 29 Additionally, over a quarter of utilities reporting peak demand as a percent of maximum capacity, are close to or at capacity now. 30 Other CMAP analysis finds the total cost of rehabilitating systems designed to serve houses built before 1965 within the 7-county region, to be approximately $15.3 billion; on par with the ASCE estimate. Thus, the nature of these needs, particularly formidable given the current economic state of affairs, requires a thoughtful plan and prompt response. Components of a plan to respond to these needs can be found in the demandmanagement strategies described in this plan. The City of Chicago is a local case in point. Chicago serves 125 suburban communities in addition to its own citizens for a total population served of 5.42 million people that reside within 578 square miles of the region. The infrastructure that serves this subregion is old. Nearly 1,000 installed miles of water main pipelines are now at least 100 years old. During the last decade, the City is replacing an average of 42 miles per year. 31 While the City s water main replacement program expects to save 40 million gallons per day by 2016, the maintenance rate is outpaced by the infrastructure-aging rate. Another issue that warrants in-depth study concerns supply augmentation. The reader is first reminded that this plan highlights in an unprecedented fashion, the supply-augmentation opportunities available to the region via demand management strategies. Other opportunities such as increased use of reclaimed wastewater and graywater reuse are also highlighted despite barriers to immediate widespread use. Keeping stormwater from leaving the diverted Lake Michigan watershed represents an additional supply of water that could otherwise be used for public supply. These hidden sources of new water are generally thought to be the most attainable and a relatively cost effective means for enhancing supply. In terms of more traditional supply augmentation options building new reservoirs, importing water from distant places much discussion and study will be required to determine the economic feasibility, political acceptability, and overall efficacy of such ideas. Another apparent option could involve tapping large stormwater-detention basins that fill during extreme storm events. In a similar fashion, abandoned quarries might have potential to augment supply while providing simultaneous flood control should they exist with proxim- 27 American Society of Civil Engineers, Report Card for America s Infrastructure: Illinois. See 31 Michael Sturtevant, Chicago Department of Water Management, Bureau of Engineering Services. Personal communication, January 5, U.S. EPA, Office of Water, Drinking Water Infrastructure Needs Survey and Assessment: Fourth Report to Congress. EPA-816-R See U.S. EPA notes, the scope of the survey is limited to those needs eligible to receive Drinking Water State Revolving Fund assistance; thus excluding capital projects related solely to dams, raw water reservoirs, future growth, and fire protection. 29 Unpublished data from the CMAP 2008 Survey of Water Utilities: Northeastern Illinois. 30 Unpublished data from the CMAP 2008 Survey of Water Utilities: Northeastern Illinois. 153
170 Chapter 5 Water Management in the 21st Century ity to both floodways and treatment plants alike. In a region that enjoys relatively abundant rainfall and not infrequent flood events, capturing excess precipitation for later use has appeal. In groundwater-dependent areas, additional wells are traditionally drilled when demand calls for greater supply capacity. Given the impacts of withdrawals (as a function of demand scenarios) pointed out in the ISWS study, new wells within or very near existing well fields could exacerbate cones of depression where they exist and add to the potential for drawdown interference. Supply augmentation via new wells could explore the concept of an ideal well distribution network to maximize groundwater yield without compromising aquifers further or local aquatic ecosystems that are shown to be impacted by shallow groundwater withdrawals. Where this process of exploration begins can be decided in the next planning cycle. Another supply augmentation option is rainwater harvesting, one means of which is more decentralized capture of precipitation via cisterns. An old idea, cisterns are attracting much new attention both locally and elsewhere in water-challenged regions of the country. 32 The Lake County Forest Preserves, Ryerson Woods Welcome Center, employs a number of green-building strategies including two types of cisterns. 33 The Center for Neighborhood Technology s Super Barrels program is another local example. 34 While neither of these examples currently uses captured rainwater for indoor use (e.g., flushing toilets), they could in the future. Widespread use of cisterns for indoor and outdoor residential and commercial applications could augment groundwater supplies where conservation alone may not prevent a demand/supply imbalance. Installed within the Lake Michigan service area, cisterns offer additional potential to reduce the stormwater-runoff component of the Illinois diversion as noted previously. Related to this potential source of new water are state/local plumbing codes as well as subdivision codes and homeowner-association covenants that must be reviewed in order to remove obstacles to indoor-use applications. Another matter for consideration concerns a new mode of cooperative management of the region s shared groundwater resources. Groundwater-dependent communities share a natural-resource system aquifers used by multiple individuals and described by scholars and others as a common-pool resource whose property-rights regime can be described as open access. As a broad class of property regimes, open access is characterized by an absence of well-defined property rights, a resource that is often unregulated, and free to everyone. 35 In order to stave off overuse resulting in shortage or collapse of the system, users may want to explore some form of self-organization to impart rules that specify rights and duties of participants in order to create a public good for those involved. 36 Examples of such a management scheme can be found as alternatives to more government control or new forms of state regulation. 32 Lancaste, Brad, Rainwater Harvesting for Drylands and Beyond, See 33 Ryerson Woods Welcome Center, Lake County Forest Preserve, See cfm?fuseaction=home.green_building_strategies. 34 Center for Neighborhood Technology (CNT), See org/news/2009/05/18/super-barrels-roll-out-around-oak-park-and-chicago/. 35 Open access is best considered relative to other broad classes of propertyrights regimes including communal property, state property, and private property. See Joanna Burger, Christopher Field, Richard B. Norgaard, Elinor Ostrom and David Policansky, Common-Pool Resources and Commons Institutions: An Overview of the Applicability of the Concept and Approach to Current Environmental Problems, pgs 1-15 in Protecting the Commons: A Framework for Resource Management in the Americas, Edited by J. Burger, E. Ostrom, R.B. Norgaard, D. Policansky, and B.D. Goldstein. Washington, DC: Island Press. 36 Elinor Ostrom, Reformulating the Commons, pgs in Protecting the Commons: A Framework for Resource Management in the Americas, Edited by J. Burger, E. Ostrom, R.B. Norgaard, D. Policansky, and B.D. Goldstein. Washington, DC: Island Press. 154
171 155

172 Appendices Chicago Botanic Garden, Glencoe, IL 156 Image courtesy of Anthony Pfammatter
173 Appendices 157
174 Appendices Appendix A: Regional Water Supply Planning Group Membership Northeastern Illinois Regional Water Supply Planning Group, membership as of January 2010 Name Caucus Group Name Caucus Group Scott Goldstein Academia, Public Interest in Regional Planning Heidi Miller Grundy County Government Martin Jaffe Academia, Public Interest in Regional Planning Paul Schuch Kane County Government Mike Kenyon Agriculture Mike Bossert Kankakee County Government William Olthoff Agriculture Jerry Dudgeon Kendall County Government Alan Jirik Business, Industry, and Power Bonnie Thomson Carter Lake County Government Jeffrey Schuh Business, Industry, and Power Ken Koehler McHenry County Government Jeffrey Edstrom Conservation and Resource Management Howard Hamilton Will County Government Jeffrey Greenspan Conservation and Resource Management Frederic Brereton City of Belvidere Joyce O Keefe Environmental Advocacy John Spatz, Jr. City of Chicago Lynn Rotunno Environmental Advocacy Robert Martin DuPage Mayors and Managers Conference Charles Eldredge Real Estate and Development Mark Knigge Lake County Municipal League Patrick Smith Real Estate and Development Robert Abboud McHenry County Council of Governments Sergio Serafino Wastewater, Non-municipal Water Supplier Thomas Weisner Metro West Council of Governments Jack Sheaffer Wastewater, Non-municipal Water Supplier Peter Wallers Metro West Council of Governments Bob Walberg Boone County Government Cook County Government* Ruth Anne Tobias DeKalb County Government S. Louis Rathje DuPage County Government Karen Darch Daniel McLaughlin Jim Holland *Position vacant Northwest Municipal Conference/ West Central Municipal Conference Southwest Conference of Mayors/ South Suburban Mayors and Managers Will County Governmental League 158
175 Appendix B: Complete List of Plan Recommendations State Recommendations Local Planning Technical Assistance Act During grant application and review or when providing technical assistance, the Illinois Department of Commerce and Economic Opportunity (DCEO) should: 1) Encourage communities to include (within their comprehensive planning efforts) water conservation plans that indicate available future water supplies for projected population growth. 2) Encourage engagement in intergovernmental agreements between municipalities and counties in comprehensive planning that includes planning for water resources. 3) Provide emphasis/higher priority ranking for land-use plans that promote reinvestment development practices. 4) Emphasize conservation design or low impact development principles as guidance for local ordinance review concerning development regulations. Water Revolving Funds 1) Illinois Environmental Protection Agency (IEPA) to encourage the utilization existing water and wastewater system capacity through promoting the upgrade and rehabilitation of existing systems with funds from the Water Pollution Control Loan Program (WPCLP) and the Public Water Supply Loan Program (PWSLP) to encourage compact growth and community-appropriate densities. 2) Communities that have conservation policies and programs and that show compliance with existing comprehensive plans in their loan applications may receive lower or zero interest rates. 3) Encourage use of funds for brownfield remediation, conservation easements, and land acquisition for sourcewater protection. Recharge Areas Where possible, provide data and assistance to communities for identifying their Sensitive Aquifer Recharge Areas (SARA). Add New Lake Michigan Permittees within the Service Region Encourage/target communities to explore the feasibility of transitioning from the deep bedrock aquifer to Lake Michigan water by facilitating dialogue with the various suppliers and offering assistance where possible. Proactive IDNR/OWR/LMMS Conservation 1) Engage communities in the Lake Michigan Service Region (LMSR) in exploring and implementing the most effective manner for compliance with the various conditions of permit, specifically the development and implementation of public programs to encourage reduced water use. 2) Encourage communities to develop water conservation plans that set goals for future water demand reductions and regular evaluation schemes. 3) Encourage communities to include their annual conservation activities and milestones in their annual water use reporting, e.g., by implementing a water conservation plan/activities award program. 4) Expand annual LMO-2 Audit Form to include more information about current permit requirements as well as more conservation-related data, as specified above in text. 5) Display all publicly available data, including LMO-2 audit form submissions, on-line in a timely manner. Water Use Act of ) Fund the Illinois State Water Survey (ISWS) to conduct impact analysis of new withdrawals on groundwater supplies as required by the Water Use Act of specifically the August 10, 2009 amendment in which, the ISWS may encounter an increased influx of data from the additional reporting required from all the Illinois counties (including the 6 northeastern counties that were previously exempted from reporting) and the users/operators of high capacity wells and intakes. 2) Provide updated well-withdrawal data and impacts to counties and to CMAP annually to facilitate comprehensive water supply planning efforts. Watershed Planning IDNR should revise guidance to incent design applications that include water-resource features for Open Space Land Acquisition and Development (OSLAD) Program funds; and the Land and Water Conservation Funds (LWCF) program should add ranking criteria for areas identified in watershed plans or in the GIV as being critical for water quality protection. Zero Water Footprint Allow the use of recycled/grey water in industrial operations and large scale residential developments through a permitting process. 159
176 Appendices Wetlands/Riparian Area Protection 1) Illinois Department of Natural Resources (IDNR) and/or the Institute of Natural Resource Sustainability at the University of Illinois at Urbana-Champaign should develop and implement a study to monitor and improve understanding of the relationship between the hydrology of wetlands and groundwater levels as affected by local/regional pumping. 2) Wetlands within the planning region should be mapped and assessed for their risk of dewatering from groundwater withdrawals. 3) Data collected and information created from such a study should be incorporated into regional water supply planning where possible for purposes of developing management strategies and appropriate policies to protect wetlands from further loss. Instream-flow Protection 1) IDNR or an appropriate entity should monitor and study Biologically Significant Streams (BSS) to improve understanding of the relationship between natural streamflow, biological integrity, and shallow groundwater withdrawals. 2) Study results should then be tested for applicability throughout the region where shallow groundwater pumping occurs to identify at-risk streams and develop strategies to avoid or minimize impacts. 3) The relationship between shallow groundwater pumping and baseflow contributions to streams should also be studied and first and second-order streams should be considered. 4) As an outcome of the type of study just recommended, instream-flow protection should be extended to more than just public waters of the state, taking into consideration the new context of four concurrent needs: water supply, aquatic ecosystems and biological integrity, commercial navigation where conducted, and recreation. Conservation Coordinator Create a state-wide Conservation Coordinator (CC) program within an agency such as IDNR as a means for extending the water conservation and efficiency programs provisions of the Great Lakes St. Lawrence River Basin Water Resources Compact beyond the Lake Michigan service region and coordinate with regional planning groups and their water-use conservation recommendations. Water Survey Program Encourage a combined energy/water residential audit program, specifying minimum audit requirements, as part of the comprehensive program/administrative framework for state and regional water supply planning and management. Residential Plumbing Retrofit Encourage retrofit-on-resale or similar variations to include WaterSense labeled fixtures and fixture fittings as part of the comprehensive program/administrative framework for state and regional water supply planning and management. System Water Audits, Leak Detection, and Repair 1) Encourage annual system water audit reports; audits should follow the International Water Association (IWA)/ American Water Works Association (AWWA) standard water balance protocol, where all water from source to customer is documented and verified, and establish an upper limit of acceptable loss as part of the comprehensive program / administrative framework for state and regional water supply planning and management. 2) The IDNR Office of Water Resources (OWR) should eliminate the Maximum Unavoidable Loss allowance granted to permittees without raising the acceptable loss threshold (currently at 8%). Metering As part of the comprehensive program/administrative framework for state and regional water supply planning and management: 1) Provide public water suppliers with financial means (e.g., state revolving fund loan programs, etc) to install and retrofit meters in existing buildings. 2) Encourage meters for all new construction and metering of existing nonmetered services. 3) Encourage dedicated irrigation meters for all landscapes > 2 acres. Residential High Efficiency Toilet (HET) Program Endorse WaterSense products for all replacement/rebate programs. High Efficiency Clothes Washer (HEW) Program 1) Endorse WaterSense products for all HEW programs. 2) Coordinate energy and water utility partnerships and the private sector to provide incentive packages. 160
177 Water Waste Prohibition As part of the comprehensive program/administrative framework for state and regional water supply planning and management, extend regionwide the requirements for the Lake Michigan service area as outlined in 17 ILAC 3730, but strengthen the restrictions on summertime lawn watering. Large Landscape Conservation Program Recommend water-efficiency irrigation technology (e.g., rainsensors) for new landscaping as part of the comprehensive program/administrative framework for state and regional water supply planning and management. Commercial, Industrial, Institutional Conservation Program 1) Encourage annual water audits and water-usage reporting. 2) Implement a Water Conservation Certificate Program for environmentally friendly Commercial, Industrial, Institutional (CII) entities. 3) Offer tax incentives or tax credits. 4) Perform institutional water audits on state owned buildings and implement a water conservation program. Public Information Campaign 1) IDNR should pilot a statewide public information campaign, suitable for revision for use in northeastern Illinois to increase awareness of the value of water. 2) The State, in coordination with regional and local stakeholders, should identify a, stable and dedicated funding source for a water conservation public information campaign. 3) IDNR OWR should survey permittees within the Lake Michigan service region for compliance with development and implementation of public programs to encourage reduced water use and work with permittees to develop and implement a consistent message that reflects both regional water supply planning recommendations and the conservation program provisions of the Great Lakes Compact. School Education Program 1) The State, in coordination with regional and local stakeholders, should identify a stable and dedicated funding source for a water conservation education program. 2) The Illinois State Board of Education should coordinate with CMAP and the IDNR and IEPA to develop an integrated school education program. Water Rate/Conservation Pricing 1) Continue to support statewide public education programs including information on the value of water and conservation-oriented rate structures. 2) Review regulations/institutional barriers potentially prohibiting the implementation of conservation pricing, including supporting municipalities in creating and maintaining revenue stabilization funds. 3) Support efforts for excess revenue resulting from conservation pricing to be used for funding water conservation programs. 4) For the Lake Michigan service region, IDNR OWR should encourage permittees to assess the feasibility of adopting seasonal water pricing. Graywater Use 1) Establish regulation, based on performance standards, that permits graywater-reuse systems. The regulation should guide counties and municipalities to further regulate the use of graywater by local ordinance. 2) Provide general education materials to the public about graywater use. 3) Create a graywater tax credit for homeowners who install a graywater use system. Wastewater Reuse 1) IEPA should develop comprehensive rules for reuse that identify numeric water quality standards and acknowledge the benefits of the reuse of all or a portion of wastewater effluent discharged by a treatment facility. 2) As the state develops nutrient regulations, irrigation with reclaimed wastewater should be encouraged as an avenue for treatment facilities to meet discharge requirements. Recommendations for Drought 1) Provide data collection on drought monitoring and prediction. 2) Insure efficient information delivery to all levels of government and media. 3) Create long and short term plans for mitigation including assessment of drought impacts. Funding Either through new legislation or amended legislation, the Governor and General Assembly should make an annual appropriation to a state/regional water supply planning program directed by IDNR. 161
178 Appendices CMAP Recommendations Developments of Regional Importance (DRI) Following the two-year pilot period, discuss with all stakeholders the potential inclusion of new groundwater and inland river-based withdrawal thresholds for their practical relevance in a DRI review. go to 2040 The following are recommendations that go to 2040 should include to address the integration of land use and water resources: 1) Promote reinvestment and community-appropriate densities. 2) Maximize transportation options to support development patterns that promote water use efficiency and infrastructure cost effectiveness. 3) Promote the use of environmentally sensitive development practices for both reinvestment and greenfield development. 4) Support the protection of ecologically sensitive environmental lands, particularly in areas where significant groundwater recharge occurs. 5) To achieve the recommendations described above, CMAP should work with local governments (through technical assistance, funding or other methods) to incorporate plan recommendations into comprehensive plans and ordinances. Section 208 Planning: 1) Encourage Section 319 funded watershed plans that further the goals of regional water supply planning while simultaneously achieving water-quality objectives. 2) Refine the Facilities Planning Area (FPA) review process to be clear, transparent, and supportive of integrated water resource planning consistent with the agency mission. 3) Pursue where feasible policy integration with fulfillment of Section 208 planning responsibilities. Recharge Areas 1) Provide technical assistance for counties in the mapping of SARA. (As a first step, CMAP completed a sample SARA map and methodology, included in Appendix B. Counties and municipalities may choose to refine this methodology and adapt it to their specific circumstances for planning purposes.) 2) Facilitate intergovernmental cooperation for SARA protection. 3) Develop model ordinances that address SARA protection zones. Stormwater Retention Promote public education of the benefits of stormwater BMPs. Conservation Design 1) Encourage appropriate use of conservation design and conservation design principles in the region. 2) Inform stakeholders (municipal representatives, developers, public, etc.) on the benefits and tradeoffs of conservation design. Proactive IDNR/OWR/LMMS Conservation 1) Work with IDNR in outreach to LMSR communities and in provision of technical assistance with the development of community-wide water conservation plans. 2) Develop a reporting framework/template for communities to demonstrate water management activities to the Lake Michigan Management Section and to their residents as part of a public education campaign. Water Use Act of ) Disseminate information to groundwater-dependent communities on the potential impacts of continued groundwater withdrawals on water supplies and the effects on future growth. 2) Provide assistance to communities, where requested, to explore alternative water sources and/or demand management options that may enhance water use sustainability. Watershed Planning 1) Insure that the go to 2040 addresses the retention of open space within the CMAP region for water quality improvement as well as the other quality of life aspects. 2) Encourage communities through the Technical Assistance Department to include the conservation of open space for the promotion of water recharge and quality protection within their planning efforts, specifically if such sites were outlined in the Green Infrastructure Vision (GIV) or have been identified in an IEPA approved watershed-based plan conducted independently from the municipal governing body. Zero Water Footprint 1) Conduct research and compile information on techniques for achieving water neutrality and case studies documenting the reduction of water footprints for individuals, residential developments and the commercial/industrial sector. 2) Disseminate the above information through workshops and publications. 162
179 Conservation Coordinator 1) Create regional program to provide technical assistance for local CCs. 2) Highlight local water conservation case studies or demonstration projects in the region. 3) Create a model water use conservation ordinance. Water Survey Program In concert with the state program, specify regional audit criteria if appropriate. Residential Plumbing Retrofit Encourage older communities with pre-1994 housing stock to implement a retrofit program. Metering Provide awareness and educational material on the benefits of metering to achieve conservation in water use. Residential HET Program 1) Track implementation 2) Explore funding options to organize a regional HET program. HEW Program 1) Track implementation 2) Explore funding options to organize a regional HEW rebate program. Water Waste Prohibition (WWP) Create a model WWP ordinance that supports new state requirements (if necessary) and at a minimum addresses residential yard irrigation, single-pass cooling systems in new connections, nonrecirculating systems in all new car wash and commercial laundry systems, and nonrecycling decorative water fountains. Large Landscape Conservation Program Encourage/promote use of native vegetation in landscaping. Commercial, Industrial, Institutional Conservation Program 1) Track participation and implementation. 2) Create a model CII Water Conservation Certificate Program. 3) Provide technical assistance to aide in the water audit process. Wholesale Agency Assistance Programs Provide technical assistance with assessment tool(s) for determining which conservation measures are most cost effective for implementation. Public Information Campaign Coordinate with federal, regional and local stakeholders to develop a public information campaign that promotes the water conservation strategies recommended in the Regional Water Supply Plan to create a unified message for regional water conservation awareness; use a variety of communication and marketing tools; and provide options for public and private water suppliers to actively promote water conservation awareness to their communities. School Education Program 1) Make all public information program materials available to schools for the purpose of increasing awareness about the value of water. 2) Work with a team of local school leaders, regional and local water providers to develop a school education program that provides some classroom materials, teacher training, and creates a speakers bureau on water conservation using federal, state, regional, and local experts. Water Rate/Conservation Pricing 1) Provide information/guidance to public water suppliers, city councils, and the general public on full-cost pricing. 2) Provide assistance to public water suppliers implementing, phasing-in, and fine tuning conservation-rate structures including facilitating stakeholder/public involvement. 3) Provide estimates of the scarcity value of natural water and scarcity of water infrastructure capital to assist water managers with decision-making and educational efforts. 4) Develop and share information on economic pricing of new water connections and infrastructure investment to help inform other planning processes relating to water scarcity and land use. Graywater Use Create model ordinance for adoption by county/local government to guide local implementation of graywater use systems. 163
180 Appendices Wastewater Reuse 1) Provide technical assistance to identify water-reuse opportunities. 2) Encourage water-reuse opportunities through the Section 208 Planning process. 3) Explore setting water-reuse goals for the planning region within the next planning cycle. Drought Preparedness 1) Assist in developing drought plans. 2) Assist in developing implementation procedures including mitigation strategies. Funding 1) Study and develop cost estimates for the regional planning agency, in coordination with a regional deliberative body, to ensure an ongoing regional planning effort (i.e., work plan) and implement the regional agency s portion of water plan recommendations. 2) Study and develop in concert with others, the cost of implementing other plan recommendations (i.e., county, public water supplier). 164
181 County Recommendations Recharge Areas 1) Develop groundwater-protection ordinance for unincorporated area. 2) Communicate and work with municipalities within county boundaries to develop model ordinances and policies for the protection of groundwater and recharge areas. Stormwater Retention 1) Encourage the use of best management practices (BMP) that promote infiltration where appropriate. Examples of BMPs currently being implemented in the region are permeable pavements, concretes and pavers, rain gardens, bioswales, and green roofs. 2 ) Evaluate the feasibility and cost effectiveness of adopting Volume Control/Management Regulations that require a specified volume of stormwater runoff be retained and infiltrated on site. 3) Promote the use of rain barrels and cisterns to collect rainwater from downspouts and reuse it for landscape watering or other purposes. Conservation Design 1) Encourage amendment of existing conservation design related ordinance(s) (e.g., subdivision ordinance, etc.) to permit conservation design developments and/or developments with conservation design principles (described above) as a viable development option by minimizing barriers for approval (e.g., need for variances, etc.). 2) Consider incentives (e.g., density bonuses, reduced stormwater fees, maintenance fees, expedited permit process, etc.) for developers and homeowners who choose to pursue or purchase in a conservation design development. 3) Identify environmentally sensitive and/or other appropriate areas (e.g., areas outlined in a comprehensive plan, etc.) within land areas zoned for development and encourage (e.g., incentives, etc.) conservation design principles to be applied if developed. 4) Inform stakeholders (local government representatives, developers, public, etc) on the benefits and tradeoffs of conservation design. 5) Explore the option of managing the maintenance (by redirecting Homeowners Association (HOA) dues) of all residential conservation design site within the county. Water Use Act of ) Collaborate with the ISWS and affected communities to study impacts of withdrawals on groundwater supplies. 2) Encourage county Regional Planning Commissions to provide oversight for comprehensive planning of water resources to insure continued regional economic prosperity. 3) Encourage intergovernmental agreements among counties and municipalities that establish water withdrawal standards in accordance with projected growth, e.g., communities commit to specific withdrawal limits based on their future populations and with knowledge from ISWS on groundwater supplies for the purpose of water resources management; as provided for in 50 ILCS 805/4, Local Land Resource Management Plans. Watershed Planning 1) Participate in watershed planning efforts as an active stakeholder and actively support plan implementation efforts where appropriate. 2) Modify zoning and subdivision codes to include the conservation of open space and natural areas identified in watershed plans either through direct acquisition, conservation easements or by providing zoning bonuses/incentives to developers for the retention of open space. 3) Establish overlay zones where BMPs are required for lands identified as critical to source water quality protection and recharge when land conservation through acquisition or easements is not an available option. Water Quality Protection, Chlorides 1) Provide proper training of road salt applicator staff and public education to build community awareness. 2) Conduct regular equipment maintenance and calibration. 3) Ensure proper salt storage, handling, and transport. 4) Explore greater reliance on anti-icing and deicing (e.g., prewetted road salt) practices. 5) Pursue judicious use of alternative deicing chemicals, including organic deicers such as those based on corn or beet derivatives. 6) Monitor salt use to determine program effectiveness. Conservation Coordinator Designate an existing water resources staff member as the CC to work with municipal or private water utilities (i.e., public water suppliers) and other stakeholders with an interest in water conservation. The CC could also seek funding from other sources to promote implementation of a county conservation program. 165
182 Appendices Water Survey Program 1) Support survey and retrofit programs with available means. 2) Encourage local community college to develop a program to train people in water conservation and efficiency. Residential Plumbing Retrofit 1) Assist municipalities with outreach where possible. 2) Encourage retrofit-on-resale to include WaterSense labeled appliances. System Water Audits, Leak Detection, and Repair Where the county has a water distribution system, perform annual system water audits as recommended and repair leaks to comply with acceptable loss limit. Metering 1) Implement program to install meters in all existing county buildings within a specific time span. 2) Conduct regular audits in public buildings using meters. Residential HET Program 1) Assist with promoting public water supplier HET programs. 2) Create recycling program and collect replaced toilets. HEW Program Assist with promoting public water supplier HEW programs. Water Waste Prohibition Adopt model WWP ordinance or promote adoption by municipalities to enable implementation. Large Landscape Conservation Program 1) Set example by planting native vegetation on county properties. 2) Conduct ordinance review to promote low water-use plants over water intensive ones and to remove conflicts that prevent use of native plants (e.g., noxious weed ordinances). 3) Conduct ordinance review to permit the use of reclaimed wastewater, graywater, or cisterns (e.g., rainwater harvesting) for irrigation. 4) I mplement water-efficiency irrigation technology (e.g., rain sensors) for new county building landscaping. Commercial, Industrial, Institutional Conservation Program 1) Perform institutional water audits on county owned buildings and implement a water conservation program. 2) In concert with state and regional partners, develop programs that recognize CIIs that participate in water conservation programs. 3) Provide incentives for laundromats to use HEWs. Public Information Campaign 1) Commit in resolution or Memorandum of Understanding to supporting a range of the public information program options developed by CMAP. 2) Coordinate with municipal/private water utilities, county health departments, and county soil and water conservation districts. 3) Disseminate the water conservation materials to residents and water users developed for the regional public information campaign. School Education Program Support state, regional, and local efforts to include water awareness into school curricula. Water Rate/Conservation Pricing 1) Foster public acceptance and political viability of conservation pricing. 2) Recommend conservation-orientated rates for systems with above average regional water use. 3) Facilitate shared rate technicians to estimate economicbased water prices to assist small municipalities and garner support for conservation pricing. Graywater Use 1) Adopt ordinance that specifies performance-based standards for implementation of graywater use systems. 2) Provide general education materials to the public about graywater use. Wastewater Reuse 1) Provide incentives for reclaimed water system installation. 2) Consider reclaimed water for large landscape irrigation at public institutions. 166
183 Public Water Supplier/ Municipality Recommendations Recharge Areas 1) Amend ordinances to include overlay zoning districts, or other land-use ordinances, where SARA have been identified for source water protection. 2) Encourage the establishment of monitoring groups who are well versed in ordinance requirements to work with officials in insuring the continued health of recharge areas. 3) Communicate with county government to develop groundwater-protection ordinances. Stormwater Retention 1) Create specific stormwater requirements and BMP recommendations based on local conditions for inclusion in zoning ordinances. 2) Explore the use of creative funding mechanisms to maintain existing stormwater infrastructure such as a stormwater utility/management fee which assigns a fee to property owners based on the amount of impervious area on a site, or the utilization of Special Service Areas (SSA) as a mechanism to fund stormwater management that protects water quality and/or enhances water supply. 3) Create a rain barrel program or partnership to provide rain barrels to homeowners. Conservation Design 1) Encourage amendment of existing conservation design related ordinance(s) (e.g., subdivision ordinance, etc.) to permit conservation design developments and/or developments with conservation design principles (described above) as a viable development option by minimizing barriers for approval (e.g., need for variances, etc.). 2) Consider incentives (e.g., density bonuses, reduced stormwater fees, maintenance fees, expedited permit process, etc.) for developers and homeowners who choose to pursue or purchase in a conservation design development. 3) Identify environmentally sensitive and/or other appropriate areas (e.g., areas outlined in a comprehensive plan, etc.) within land areas zoned for development and encourage (e.g., incentives, etc.) conservation design principles to be applied if developed. 4) Inform stakeholders (local government representatives, developers, public, etc) on the benefits and tradeoffs of conservation design. 5) Explore the option of managing the maintenance (by redirecting HOA dues) of all residential conservation design site within the county. Water Use Act of ) Pursue integration of water supply planning with long term comprehensive/land use planning by forecasting water use (based on population projections) and considering use impacts on sources of supply. 2) Collaborate with county governments and other water suppliers impacted by same water resource in identifying impacts of withdrawals on supplies and by setting limits to enable future planning and modeling. Watershed Planning 1) Participate in watershed planning efforts as an active stakeholder and actively support plan implementation efforts where appropriate. 2) Modify zoning and subdivision codes to include the conservation of open space and natural areas identified in watershed plans either through direct acquisition, conservation easements or by providing zoning bonuses/ incentives to developers for the retention of open space. 3) Establish overlay zones where BMPs are required for lands identified as critical to source water quality protection and recharge when land conservation through acquisition or easements is not an available option. Zero Water Footprint 1) For municipally-operated facilities, encourage new developments/industries, through zoning and land use planning incentives, to reduce their water withdrawals and minimize their water footprints through increased water recycling and treatment of effluent. 2) Facilitate water footprint offsetting by providing information on investment potential in sustainable water development/management projects for new developments, businesses and industries seeking to reduce their water footprints. 3) Use municipal property as demonstration and education sites for the identification and reduction of water footprints. 167
184 Appendices Chloride Reduction 1) Provide proper training of road salt applicator staff and public education to build community awareness. 2) Conduct regular equipment maintenance and calibration. 3) Ensure proper salt storage, handling, and transport. 4) Explore greater reliance on anti-icing and deicing (e.g., prewetted road salt) practices. 5) Pursue judicious use of alternative deicing chemicals, including organic deicers such as those based on corn or beet derivatives. 6) Monitor salt use to determine program effectiveness. Nutrient Reduction 1) Participate in local watershed planning efforts to reduce nonpoint-source pollution. 2) Adopt restrictions on the residential and commercial use of phosphorus containing lawn fertilizers; work through the Council of Government(s) to achieve a statewide adoption of similar restrictions. Conservation Coordinator 1) Designate an existing staff member as the Conservation Coordinator to lead implementation of utility conservation program. 2) Volunteer program as regional case study or demonstration project to serve as an educational example for the public and other public water suppliers. 3) Consider adopting a water use conservation ordinance. Water Survey Program 1) Lead implementation effort in partnership with wastewater, water, energy utilities with similar interest where feasible; target high-water users and low-income housing. 2) Provide a water audit upfront (e.g., at time of service establishment or on a periodic basis) and obtain payment either via water bills over a subsequent period of time until cost of water audit is repaid. System Water Audits, Leak Detection, and Repair Perform annual system water audits as recommended and repair leaks to strive for continual improvement and ongoing reduction of nonrevenue water. Metering 1) Implement AMR (automatic meter reading) with customer account detailing where cost effective to do so. 2) Implement different rate structures for indoor and outdoor water uses to encourage water conservation during peak demand. 3) Experiment with the use of dedicated landscape meters with separate rates for landscapes larger than 2 acres OR adopt seasonal water pricing. 4) Consider implementing monthly billing structures utilizing user-friendly bill format to increase customer responsiveness in water use. Residential HET Program 1) Implement a HET program independently or in concert with other municipalities or regional partners. 2) Track implementation. 3) Provide free HET program for qualified low-income housing. HEW Program 1) Implement a HEW program independently or in concert with other municipalities or regional partners. 2) Track implementation. Water Waste Prohibition 1) Absent a county ordinance, support/enact WWP ordinance. 2) Review and update existing ordinances that contradict water waste prohibition ordinance. Residential Plumbing Retrofit 1) Quantify opportunity and implement in combination with residential survey ) Reach at least 50% of appropriate potential retrofit households. 3) Track results. 4) Encourage retrofit-on-resale or similar variation to include WaterSense fixtures and fixture fittings.
185 Large Landscape Conservation Program 1) Set example by planting native vegetation on county properties. 2) Conduct ordinance review to promote low water-use plants over water intensive ones and to remove conflicts that prevent use of native plants (e.g., noxious weed ordinances). 3) Conduct ordinance review to permit the use of reclaimed wastewater, graywater, or cisterns (e.g., rainwater harvesting) for irrigation. 4) Experiment with the use of dedicated landscape meters with separate water rates for landscapes larger than 2 acres OR adopt seasonal water pricing. 5) Absent/county action, support a requirement for waterefficiency irrigation technology (e.g., rain sensors) for new landscaping. 6) Incent retrofits of existing landscape irrigation systems to employ water-efficiency irrigation technology (e.g., rain sensors). Water Rate/Conservation Pricing 1) Ensure customer understanding of water-rate schedules, water bills, and meter reading. 2) Review and rank rate-setting objectives with stakeholder/ community input. 3) Implement rate structures based on full cost water price within a broader conservation program. 4) Work with local and state government to establish revenue stabilization funds, to enable simultaneous meeting of revenue requirements, conservation, and efficiency objectives. Graywater Use: Support local installation of graywater use systems. Drought Preparedness 1) Improve conveyance infrastructure efficiencies. 2) Develop local implementation procedures. Commercial, Industrial, Institutional Conservation Program Provide technical assistance to aide in audit processes. Public Information Campaign 1) As part of the broader conservation program, communicate regularly with water users about regional water demand/supply, the benefits of water conservation, and the actions being taken by the water utility to enhance conservation and stewardship. 2) Evaluate billing structure and frequency to provide more detailed water use information to customers. Comparative usage data, unit conversation equations, and conservation tips should be considered as informational additions to bill structure. School Education Program 1) Support state, regional, and local efforts to include water awareness into school curricula. 2) Commit to participating in local school curricula through activities such as classroom presentations by staff and facility tours. 169
186 Appendices Private Well User Recommendations Chloride Reduction 1) Adopt alternative water softening technologies such as electrodialysis or membrane filtration. 2) Reconfigure plumbing to bypass the water softener for certain indoor water uses. Agriculture Community Recommendations Nutrient Reduction 1) Conduct nutrient management, including regular soil testing, to determine optimum rates and locations for fertilizer application. 2) Exclude livestock from direct stream access and filter strip areas. 3) Install filter strips along streamside property that is not currently covered by year-round vegetation. 4) Install grassed waterways where runoff concentrates at topographic low points in farm fields. 5) Practice conservation tillage. 6) Restore farmed wetlands that will serve as pollutant sinks. Wastewater Treatment Facilities and Sanitary Districts Recommendations Nutrient Reduction 1) Provide for the reuse of effluent as a resource to produce revenue that can be used to aid in financing other improvement programs. 2) Expand or modify the existing waste treatment technology to reduce the nutrient loads discharged into receiving waters. 3) Participate in a nutrient trading program, designed to assure compliance with standards, and purchase nutrient credits that will result in reductions in nutrient loadings on a watershed basis. Wastewater Reuse 1) Pursue water reuse opportunities, beyond land application, during new wastewater treatment facility construction or expansion. 2) Consider water reuse as an alternative to upgrading treatment facilities to meet state antidegradation requirements and/or more stringent effluent water quality standards. Wholesale Water Utility Recommendations Wholesale Agency Assistance Programs Apply tools necessary to assist customer utilities in determining which conservation measures are most cost effective for implementation. 170
187 Appendix C: SARA Methodology Initial steps toward regionalizing the McHenry County method of delineating sensitive aquifer recharge areas The Sensitive Aquifer Recharge Area (SARA) map produced by McHenry County Water Resources and the Natural Resources Conservation Service (NRCS) office in Woodstock is based on ISGS Circular The methodology treats Aquifer Sensitivity Map Unit A ( High potential for aquifer contamination ) and Map Unit B ( Moderately high potential for aquifer contamination ) from Circular 559 as defining SARAs in the county, excluding soils with steep slopes (>4%), soils with restricted permeability, and hydric soils that discharge groundwater. CMAP undertook an initial attempt to regionalize the McHenry County map analysis by using available county soil data as well as statewide data on aquifer depth and thickness. Aquifer data The aquifer sensitivity map units A and B from Circular 559 show areas in McHenry County where: A) sand and gravel is more than 20 feet (6 m) thick and lies within 20 feet of the surface, and where B) sand and gravel deposits are less than 20 feet thick, lie within 20 feet of the surface, and are either at the surface or are overlain by a thin layer of fine-grained deposits or a material known as Haeger diamicton. However, mapping at the level of detail in Circular 559 is not available for the other counties in the water supply region. As a first approach, the NRCS Assistant State Conservationist for Area 3 provided CMAP a shapefile showing aquifer sensitivity to contamination on a statewide basis drawn from Illinois State Geological Survey (ISGS) Environmental Geology (EG) That publication describes aquifer sensitivity as a function of (1) the tendency of soils to leach contaminants and (2) the distance to the uppermost aquifer. Soil leaching is discussed for two common contaminants in agricultural areas, nitrate and pesticides, which can migrate differently in soils. Nitrate tends to move with water, whereas the fate of a pesticide in soil and water depends primarily on two of its properties: persistence and solubility. 3 However, it is difficult to use the EG 148 data to regionalize the McHenry map. First, EG 148 considers sensitivity for all aquifers, not just sand and gravel. Second, aquifer sensitivity ratings in EG 148 rely partly on soil data, but interpret the data differently than in the McHenry method. It would be fairer to say that the EG 148 report does not contain data to use in a McHenry-like study, but instead presents a different method of producing aquifer sensitivity rankings. Rather than the EG 148 sensitivity ratings, CMAP staff used the original stack unit map data from Circular that EG 148 used. Geologic formations containing sand and gravel were selected from statewide stack unit map data. The stack units are individual geologic formations that are found stacked in vertical succession, one on top of the other. These units are as follows: 1 B. Brandon Curry, Richard C. Berg and Robert C. Vaiden Geologic mapping for environmental planning, McHenry County, Illinois. Illinois State Geological Survey Circular Donald Keefer Potential for agricultural chemical contamination of aquifers in Illinois: 1995 revision. Illinois State Geological Survey Environmental Geology P.S.C. Rao, R.S. Mansell, L.B. Baldwin, and M.F. Laurent Pesticides and Their Behavior in Soil and Water. Florida Cooperative Extension Service, University of Florida. Available at: Pesticide Safety Education Program, Cornell University, Cooperative Extension. See facts-slides-self/facts/gen-pubre-soil-water.aspx. 4 Richard C. Berg and John P. Kempton Stack-unit mapping of geologic materials in Illinois to a depth of 15 meters. Illinois State Geological Survey Circular 542. The geospatial dataset is available through the Illinois Natural Resources Geospatial Data Clearinghouse. See nsdihome/outmeta/il_stack_units_to_15m_py.html. 171
188 Appendices Stack Unit Map Unit Number Lithostratigraphic Unit Name 1 Cahokia Alluvium 5 Parkland Sand 8 Equality formation, Dolton member 9 Henry formation Sand and gravel within Wedron formation (only within 6 m of surface) Sand and gravel within Winnebago formation (only within 6 m of surface) 16 Pearl formation 19 Sand and gravel within Glasford formation (only within 6 m of surface) The stack unit dataset also contains a field QUAL that presents a code for the thickness and continuity of the unit. These codes are as follows: Code Description 1 Drift unit > 6m thick, continuous throughout map area 2 Drift unit > 6m thick, locally less than 6m thick 3 Drift unit < 6m thick, continuous throughout map area 4 Drift unit < 6m thick, not continuous throughout map area 6 Bedrock unit present between 6 and 15 meters below surface 7 Bedrock unit not present continuously between 6 and 15 meters below surface; locally present at or just below 15 meters 8 Bedrock unit present within 6 meters of surface 9 Bedrock unit not present continuously above 6 meters below surface; but then is present between 6-15 meters There is a certain amount of guesswork in using these codes to show the thickness and depth of sand and gravel aquifers. The following combinations appear most appropriate to describe areas where sand and gravel is 20 feet thick and where the top of the sand and gravel unit(s) is within 20 feet of the surface: Unit 1 Unit 2 Unit 3 1 or 2 Any Any 3 or 4 1 or 2 Any 3 or 4 3 or 4 1 or 2 In other words, the top unit starts at the surface, and if it is > 6 m thick, then the other units can be any thickness. So that area has sand and gravel > 6 m thick and within 6 m of the surface. If the top unit is < 6 m thick but the next unit is > 6 m thick, then clearly that area has sand and gravel > 6 m thick lying within 6 m of the surface. However, if the first and second units are both < 6 m, then guesswork becomes necessary. We simply assumed that if unit 1 and unit 2 were both < 6 m thick, then unit 3 probably begins within 6 m of the surface. Then if it is > 6 m thick, the conditions for the McHenry method s A or B class are met. If unit 3 was also < 6 m thick, we assumed the McHenry conditions were not met. It is not really to the point to separate aquifer sensitivity into class A and B if there is only the statewide stack unit map to work with. The Circular 559 data are more detailed than the Circular 542 data, so they often show areas of more than one class that are within one polygon in the statewide stack unit map. 172
 for the seven-county sample region.")
189 Soil data The overlying soils that the McHenry SARA analysis excluded were excluded in this study by erasing them from the stack unit polygons through geoprocessing. The NRCS Assistant State Conservationist s office sent CMAP a single shapefile showing soil map units from the Soil Survey Geographic Database (SSURGO) for the seven-county sample region. 5 The shapefile contains, among others, a field indicating whether the map unit tended to discharge groundwater and a field indicating the permeability of the upper 40 inches of the soil profile. CMAP staff excluded soil map units with greater than C slopes as well as soils marked as discharge. The NRCS dataset did not have a field describing permeability as restricted as in Table 6 from the McHenry SSURGO database. For the present analysis, it was assumed instead that restricted would be approximately the same as very slow or impermeable from the soil dataset NRCS provided. Above, a comparison of the original McHenry map (left) with the regionalized map (right) produced by the methods described. 5 This study was conducted for the CMAP region due to in-house data availability, the remaining counties in the water supply planning area also have spatial and tabular Soil Survey Geographic Database SSURGO- datasets that can be obtained from the relevant agencies. 173


190 Appendices Above, areas where the McHenry SARA map and the regionalized map do not overlap. Finally, the draft sensitive aquifer recharge areas for the sample region are shown in the following map at right. Note that infiltration has the potential to occur on any soil type; the SARA map shows areas where soil characteristics make infiltration more likely and where the underlying aquifer units would likely be recharged from directly above. Note: No soil data for Cook County is available at this time. 174
Water Demand and Supply Outlook for Greater Chicago Area
 Southern Illinois University Carbondale OpenSIUC 2009 Conference Proceedings 7-2009 Water Demand and Supply Outlook for Greater Chicago Area Ben Dziegielewski Southern Illinois University Carbondale Follow
Potable Water Supply, Wastewater & Reuse Element
 Potable Water Supply, Wastewater & Reuse Element GOAL ONE: HIGH QUALITY AND AFFORDABLE POTABLE WATER WILL BE AVAILABLE TO MEET THE EXISTING AND PROJECTED DEMANDS OF PINELLAS COUNTY UTILITY CUSTOMERS. 1.1.
STATE OF MICHIGAN OFFICE OF THE GREAT LAKES LANSING. November 22, 2016
 RICK SNYDER GOVERNOR STATE OF MICHIGAN OFFICE OF THE GREAT LAKES LANSING JON W. ALLAN DIRECTOR November 22, 2016 Mr. David Naftzger Executive Director, Great Lakes-St. Lawrence River Basin Water Resources
APPENDIX A. Legislative Requirements. Urban Water Management Planning Act SBx7-7 Water Conservation Act of 2009 SB1478
 APPENDIX A Legislative Requirements Urban Water Management Planning Act SBx7-7 Water Conservation Act of 2009 SB1478 Section K: California Water Code, Division 6, Part 2.6: Urban Water Management Planning
Total Annual Lake Michigan Domestic Water Use
 Water Conservation and Efficiency Program Review Illinois Ninth Report to the Compact Council and Regional Body November 20, 2018 Lead agency and contact person Loren Wobig, Director Office of Water Resources
2.8 PLANNING ISSUES WATER RESOURCES
 2.8 PLANNING ISSUES WATER RESOURCES Objectives: 1. To recognize an integrated system of land and water resources is a major component of our built and natural environment. 2. To preserve and protect the
Adopt the Long-Term Conservation Plan and revised policy principles on water conservation
 Board of Directors Water Planning and Stewardship Committee 8/16/2011 Board Meeting Subject Adopt the Long-Term Conservation Plan and revised policy principles on water conservation Description In February,
State and Regional Water Supply Planning in Illinois
 State and Regional Water Supply Planning in Illinois Walt Kelly Illinois State Water Survey Prairie Research Institute University of Illinois at Urbana-Champaign Governor s Executive Order 2006-01 (re-)established
Draft Kane County 2040 Green Infrastructure Plan. Kane County Energy and Environment Committee October 10, 2013
 Kane County Energy and Environment Committee October 10, 2013 Natural Resources Advisers Mike Ander Ken Anderson Matt Bardol Steve Byers Seth Crackel Jerry Culp Sue Harney Russell Farnum Jane Holley Candice
Water Pricing as an Adaptive Climate Change Policy in Northeastern Illinois
 Water Pricing as an Adaptive Climate Change Policy in Northeastern Illinois 2010 Illinois Water Conference Margaret Schneemann Water Resource Economist Illinois-Indiana Sea Grant University of Illinois
Statewide Water Management Plan Association County Commissioners of Georgia May 2, 2008
 Statewide Water Management Plan Association County Commissioners of Georgia May 2, 2008 Introduction Coupled with Georgia s continued economic and population growth, the historicallysevere drought of 2007-08
Total Annual Lake Michigan Domestic Water Use
 Water Use (in million gallons per day) Water Conservation and Efficiency Program Review Illinois Eighth Report to the Compact Council and Regional Body November 29, 2017 Lead agency and contact person
Reclaimed Water. While the number and capacity of reclaimed water facilities is increasing, much of the potential as a resource remains underutilized.
 Reclaimed Water Issue Definition The Florida Department of Environmental Protection (FDEP) defines reclaimed water as water that has received at least secondary treatment and basic disinfection and is
CLEAN WATER PLAN Policies, Assessments and Management Programs
 METRO VISION 2020 CLEAN WATER PLAN Policies, Assessments and Management Programs June 17, 1998 Incorporating amendments through January, 2006 Denver Regional Council of Governments 4500 Cherry Creek Drive
3. Water Conservation Program
 3. Water Conservation Program The City of Tumwater s conservation program consists of both independent and regional cooperative efforts. Tumwater partners with the LOTT Alliance, the regional wastewater
Illinois Department of Natural Resources Office of Water Resources
 Illinois Department of Natural Resources Office of Water Resources February 2007 ILLINOIS COMPLIANCE WITH THE U.S. SUPREME COURT DECREE AND LAKE MICHIGAN ALLOCATION Compliance with the United States Supreme
M E M O R A N D U M. Workshop Discussion: Review of Results Neutral Crosswalk Methodology for Reforming the Comprehensive Plan Utility Elements
 M E M O R A N D U M DATE: April 14, 2015 TO: FROM: RE: Planning and Zoning Board Alaina Ray, Director Planning, Zoning and Building Department Workshop Discussion: Review of Results Neutral Crosswalk Methodology
Illinois Plumbing Code Modernization
 Illinois Plumbing Code Modernization Josh Ellis ISAWWA Regulatory Update October 3, 2013 1 Metropolitan Planning Council MPC forges innovative, pragmatic solutions bringing together government, businesses
A. POTABLE WATER SUB-ELEMENT GOAL I-1: STRIVE TO PROVIDE HIGH QUALITY POTABLE WATER TO CURRENT AND FUTURE RESIDENTS AND VISITORS.
 A. POTABLE WATER SUB-ELEMENT GOAL I-1: STRIVE TO PROVIDE HIGH QUALITY POTABLE WATER TO CURRENT AND FUTURE RESIDENTS AND VISITORS. Objective I-1.1 Water Supply Planning Walton County shall develop and maintain
Post-Development Stormwater Runoff Performance Standards
 Post-Development Stormwater Runoff Performance Standards December 9, 2014 Topics Why performance standards? What practices/requirements are in effect in other States? The Workgroup s preliminary and final
Unify efforts to address water resources for the Big Sky area and surrounding zone of influence in three co-equal water resources focus areas:
 EXECUTIVE SUMMARY The Big Sky Sustainable Water Solutions Forum (Water Forum) is a community-based, collaborative approach building a unified vision for future Big Sky water resources management to maintain
Chapter 1. Introduction
 Chapter 1 Introduction James P. Heaney, Robert Pitt, and Richard Field Introduction Stormwater has traditionally been considered a nuisance, requiring rapid and complete drainage from areas of habitation.
CHAPTER 4 Water Demand
 CHAPTER 4 4.1 OVERVIEW OF WATER USE As described in Chapter 2, the City s water service area consists of one large contiguous service area and several outlying non-contiguous service areas. The City is
CHAPTER SEVEN: UTILITIES
 CHAPTER SEVEN: UTILITIES 7.1 Introduction The Water Works Board of the City of Auburn (AWWB) is the primary potable water service provider for the City of Auburn (City) and Auburn University. There are
POTABLE WATER ELEMENT
 Goal 4.0. Provide current and future residents of the County's utility service areas, and large users of the regional raw water system a cost-effective and equitable potable or raw water supply system
Watershed Planning in Blackberry Creek We Save Land. We Save Rivers.
 Watershed Planning in Blackberry Creek We Save Land. We Save Rivers. What is a watershed? The area of land that catches rain and snow and drains into a stream, river, lake or groundwater. How land is used
PIMA COUNTY COMPREHENSIVE PLAN CO PIMA COUNTY REGIONAL COMPREHENSIVE PLAN POLICY MAJOR PLAN AMENDMENT
 PIMA COUNTY COMPREHENSIVE PLAN CO7-07-04 PIMA COUNTY REGIONAL COMPREHENSIVE PLAN POLICY MAJOR PLAN AMENDMENT Arizona law [A.R.S. 11-821(C)(3)] requires: Planning for water resources that addresses: a)
STRAWMAN OUTLINE March 21, 2008 ISWS/ISGS REPORT ON THE OPPORTUNITIES AND CHALLENGES OF MEETING WATER DEMAND IN NORTH-EAST ILLINOIS
 STRAWMAN OUTLINE March 21, 2008 ISWS/ISGS REPORT ON THE OPPORTUNITIES AND CHALLENGES OF MEETING WATER DEMAND IN NORTH-EAST ILLINOIS REPORT TO BE DELIVERED TO THE RWSPG BY SEPTEMBER 30, 2008 Table of Contents
National Water Demand Management Policy
 National Water Demand Management Policy Introduction In 1997, the Ministry of Water and Irrigation developed Jordan s Water Strategy and the following four policies, which include: Water Utility Policy;
State of Indiana Water Conservation and Efficiency Program Review December 2, 2013
 State of Indiana Water Conservation and Efficiency Program Review December 2, 2013 The State of Indiana submits the following Water Conservation and Efficiency Program review to the Regional Body and Compact
TWDB Statewide Municipal Water Conservation Quantification Project Report to the Plateau Regional Water Planning Group Region J 2017
 TWDB Statewide Municipal Water Conservation Quantification Project Report to the Plateau Regional Water Planning Group Region J 2017 1 Executive Summary In 2015, the Texas Legislature appropriated funds
UWMP Standardized Tables. King City District Urban Water Management Plan Appendix H
 UWMP Standardized Tables King City District 2015 Urban Water Management Plan Appendix H Table 2-1 Retail Only: Public Water Systems Public Water System Number Public Water System Name Number of Municipal
3. Engage stakeholders as active participants in developing effective, long-term water resource management objectives and strategies.
 Guidelines for Developing an Integrated Resource Plan Under the Delaware River Basin Commission Southeastern Pennsylvania Ground Water Protected Area Regulations September 25, 2002 A. Introduction Integrated
Julie Cunningham. OKLAHOMA COMPREHENSIVE WATER PLAN Ensuring Water Supply Reliability in Oklahoma. Society of American Military Engineers Tulsa Post
 OKLAHOMA COMPREHENSIVE WATER PLAN Ensuring Water Supply Reliability in Oklahoma Society of American Military Engineers Tulsa Post Tulsa District USACE Office June 21, 2016 Julie Cunningham Planning & Mgmt.
Sub-Regional Water Supply and Treatment Analysis Defines Sustainable Water Supply Plan For Three Lower Fox River Watershed Communities
 Sub-Regional Water Supply and Treatment Analysis Defines Sustainable Water Supply Plan For Three Lower Fox River Watershed Communities Presented By: Jeffrey W. Freeman, P.E., CFM, LEED AP Engineering Enterprises,
INFRASTRUCTURE ELEMENT Goal, Objectives and Policies
 INFRASTRUCTURE ELEMENT Goal, Objectives and Policies City of Bartow Comprehensive Plan Adopted August 5, 1991 Amended August 2, 1993, Amended 1996 & 1999 Adopted Changes January 16, 2001, Amended April
Sustainable Water Resource Practices
 Sustainable Water Resource Practices This section is related to and shoudl be read in conjunction with the Land Use Element, and Conservation Element. Implementing sustainable water resource practices
PUTNAM COUNTY COMPREHENSIVE PLAN EXHIBIT DD INFRASTRUCTURE ELEMENT
 COMPREHENSIVE PLAN EXHIBIT DD D. Infrastructure Element (Sanitary Sewer, Potable Water, Solid Waste, Drainage and Natural Groundwater Aquifer Recharge) Goals, Objectives and Policies GOAL D.1: Putnam County
20. UTILITIES AND SERVICE SYSTEMS
 June 28, 2018 Page 20-1 20. UTILITIES AND SERVICE SYSTEMS This EIR chapter describes existing conditions for and distribution, collection and, and solid waste disposal and recycling in the planning area.
INDIAN CREEK WATERSHED PLAN EXECUTIVE SUMMARY
 INDIAN CREEK WATERSHED PLAN EXECUTIVE SUMMARY The Indian Creek Watershed covers a 38 square mile area in southern Lake County, Illinois that drains 24,116 acres before discharging into the Des Plaines
UWMP Standardized Tables. City of Hawthorne District Urban Water Management Plan Appendix H
 UWMP Standardized Tables City of Hawthorne District 2015 Urban Water Management Plan Appendix H Table 2-1 Retail Only: Public Water Systems Public Water System Number Public Water System Name Number of
Chapter Nine, Potable Water Subelement City of St. Petersburg Comprehensive Plan
 POTABLE WATER SUBELEMENT Chapter Nine, Potable Water Subelement Sections: 9.1.1 INTRODUCTION 9.1.2 GOAL, OBJECTIVES AND POLICIES ISSUE: Rehab/Upgrade of Potable Water Facilities ISSUE: Extension of Potable
UWMP Standardized Tables. Livermore District Urban Water Management Plan Appendix H
 UWMP Standardized Tables Livermore District 2015 Urban Water Management Plan Appendix H Table 2-1 Retail Only: Public Water Systems Public Water System Number Public Water System Name Number of Municipal
CONSERVATION PLAN April 2009
 CONSERVATION PLAN April 2009 1. INTRODUCTION AND OBJECTIVES Water supply has always been a key issue in the development of Texas. In recent years, the growing population and economic development of North
RURAL RESIDENTIAL COMMUNITY ROLE COUNCIL ROLE RURAL RESIDENTIAL ALL COMMUNITIES
 Orderly and Efficient Land Use Align land use, development patterns, and infrastructure to make the best use of public and private investment. Discourage future development of rural residential patterns
UWMP Standardized Tables. Palos Verdes District Urban Water Management Plan Appendix H
 UWMP Standardized Tables Palos Verdes District 2015 Urban Water Management Plan Appendix H Table 2-1 Retail Only: Public Water Systems Public Water System Number Public Water System Name Number of Municipal
15A NCAC 02B.0281 FALLS WATER SUPPLY NUTRIENT STRATEGY: STORMWATER REQUIREMENTS FOR STATE AND FEDERAL ENTITIES The following is the stormwater
 15A NCAC 02B.0281 FALLS WATER SUPPLY NUTRIENT STRATEGY: STORMWATER REQUIREMENTS FOR STATE AND FEDERAL ENTITIES The following is the stormwater strategy, as prefaced in Rule 02B.0275, for the activities
UWMP Standardized Tables. Dominguez District Urban Water Management Plan Appendix H
 UWMP Standardized Tables Dominguez District 2015 Urban Water Management Plan Appendix H Table 2-1 Retail Only: Public Water Systems Public Water System Number Public Water System Name Number of Municipal
Planning for Water Reuse in Northeastern Illinois (and other places where most people think there is an abundant water supply)
") Planning for Water Reuse in Northeastern Illinois (and other places where most people think there is an abundant water supply) Illinois Waste Management and Research Center March 12, 2008 Paul Anderson,
Planning for Water Reuse in Northeastern Illinois (and other places where most people think there is an abundant water supply) Illinois Waste Management and Research Center March 12, 2008 Paul Anderson,
GREAT LAKES ST. LAWRENCE RIVER BASIN WATER RESOURCES COUNCIL RESOLUTION #5 ADOPTION OF BASIN-WIDE CONSERVATION AND EFFICIENCY OBJECTIVES
 GREAT LAKES ST. LAWRENCE RIVER BASIN WATER RESOURCES COUNCIL RESOLUTION #5 ADOPTION OF BASIN-WIDE CONSERVATION AND EFFICIENCY OBJECTIVES WHEREAS, Section 4.2.1 of the Great Lakes-St. Lawrence River Basin
INFRASTRUCTURE ELEMENT
 Goals, Objectives and Policies INFRASTRUCTURE ELEMENT SANITARY SEWER GOAL 4.A.1.: PROVIDE ADEQUATE CENTRAL SANITARY SEWAGE FACILITIES FOR RESIDENTIAL AND NON-RESIDENTIAL DEVELOPMENT AND REDEVELOPMENT IN
STRATEGIC PLAN FY 2018 FY 2019
 STRATEGIC PLAN FY 2018 FY 2019 This Strategic Plan is a blueprint for ANRC as we continue to work to manage and protect Arkansas s abundant natural resources. The plan reflects ANRC s commitment to build
Subsequent to these early efforts, the complexities associated with potable water provision have increased significantly.
 10.1 INTRODUCTION The reliable supply, treatment and distribution of potable water is vital to the health, safety and welfare of urban areas. The citizens and officials of the have long been involved with
DIVERSIFIED RURAL COMMUNITY ROLE COUNCIL ROLE DIVERSIFIED RURAL ALL COMMUNITIES
 Orderly and Efficient Land Use Align land use, development patterns, and infrastructure to make the best use of public and private investment. Plan for growth not to exceed forecasts and in patterns that
UWMP Standardized Tables. Salinas District Urban Water Management Plan Appendix H
 UWMP Standardized Tables Salinas District 2015 Urban Water Management Plan Appendix H Table 2-1 Retail Only: Public Water Systems Public Water System Number Public Water System Name Number of Municipal
UWMP Standardized Tables. Los Altos Suburban District Urban Water Management Plan Appendix H
 UWMP Standardized Tables Los Altos Suburban District 2015 Urban Water Management Plan Appendix H Table 2-1 Retail Only: Public Water Systems Public Water System Number Public Water System Name Number of
CHAPTER SEVEN: UTILITIES
 CHAPTER SEVEN: UTILITIES 7.0 Introduction T he Water Works Board of the City of Auburn (AWWB) is the primary potable water service provider for the City of Auburn (City) and Auburn University. There are
Notice of Public Hearing. Notice of Public Hearing
 2015 URBAN WATER MANAGEMENT PLAN Table 8-2: Notification to Cities and Counties Retail: Notification to Cities and Counties City Name 60 Day Notice Notice of Public Hearing Dana Point Mission Viejo County
Policy Resolution Water Quality in the West A. BACKGROUND
 Policy Resolution 2018-12 Water Quality in the West A. BACKGROUND 1. Clean water is essential to strong economies and quality of life. In most of the West, water is a scarce resource that must be managed
APPENDIX K ESTIMATION OF SAVINGS AND COSTS FOR WATER CONSERVATION STRATEGIES
 APPENDIX K ESTIMATION OF SAVINGS AND COSTS FOR WATER CONSERVATION STRATEGIES TECHNICAL MEMORANDUM ALAN PLUMMER ASSOCIATES, INC. Estimation of Savings and Costs for Potentially Feasible Water Conservation
MAJOR THEMES IN ARIZONA S WATER FUTURE
 Chapter 2 MAJOR THEMES IN ARIZONA S WATER FUTURE KATHY JACOBS AND MARSHALL A. WORDEN Seven major themes or overarching concerns regarding Arizona s water future are discussed in succeeding chapters. Information
Cannon River One Watershed, One Plan. POLICY COMMITTEE MEETING January 10, 2018 Rice County Government Center Faribault, MN
 Cannon River One, One Plan POLICY COMMITTEE MEETING January 10, 2018 Rice County Government Center Faribault, MN TASK Task 1. Aggregate Existing Physical & Spatial Data 1A. Create project maps 1B. Meeting
Goals, Objectives, and Policies Infrastructure Element Introduction
 Goals, Objectives, and Policies Infrastructure Element Introduction Pursuant to Section 163.3177 (6) (c), FS and Sections 9J-5.011 (2)(b) and (c), FAC, the following represents the Potable Water, Sanitary
3.0 MANAGEMENT ISSUES AND RECOMMENDATIONS
 3.0 MANAGEMENT ISSUES AND RECOMMENDATIONS The purpose of this section is to describe some of the policies and issues related to the management of groundwater resources and identify recommended actions.
2.9 PLANNING ISSUES SUSTAINABILITY AND ENERGY
 2.9 PLANNING ISSUES SUSTAINABILITY AND ENERGY Objectives: 1. To create an enduring future that promotes quality of life, financial prosperity and innovative ideas and technologies while respecting and
MEMORANDUM OF UNDERSTANDING to establish the DULUTH URBAN WATERSHED ADVISORY COMMITTEE
 MEMORANDUM OF UNDERSTANDING to establish the DULUTH URBAN WATERSHED ADVISORY COMMITTEE A. Introduction This Memorandum of Understanding (MOU) formalizes formation of the Duluth Urban Watershed Advisory
CHAPTER 6 SANITARY SEWER SUB-ELEMENT
 CHAPTER 6 SANITARY SEWER SUB-ELEMENT Page 1 of 10 CHAPTER 6 SANITARY SEWER SUB-ELEMENT A. OVERVIEW The following Future Land Use categories are considered to be urban and require the provision of sanitary
GENERAL ASSEMBLY OF NORTH CAROLINA SESSION 2011 SESSION LAW HOUSE BILL 609
 GENERAL ASSEMBLY OF NORTH CAROLINA SESSION 2011 SESSION LAW 2011-374 HOUSE BILL 609 AN ACT TO PROMOTE THE DEVELOPMENT OF WATER SUPPLY RESERVOIRS AND OTHER WATER SUPPLY RESOURCES, TO PROVIDE THAT FUNDS
Overview of Local Facilities. Integrated Resource Planning Advisory Committee
 Overview of Local Facilities Integrated Resource Planning Advisory Committee City of Henderson Utility Services System Overview 2 CITY OF HENDERSON Department of Utility Services The Department of Utility
CHAPTER 10 NATURAL GROUNDWATER AND AQUIFER RECHARGE ELEMENT
 CHAPTER 10 NATURAL GROUNDWATER AND AQUIFER RECHARGE ELEMENT Page 1 of 7 G:\Comp\Adopted Comprehensive Plans\15. Cylce 16-2 and 16-3\Elements not changed\ Groundwater & Aquifer A. OVERVIEW CHAPTER 10 NATURAL
Southeastern Wisconsin Regional Water Supply Planning Program Update. Focus on Alternative and Preliminary Recommended Plans
 Southeastern Wisconsin Regional Water Supply Planning Program Update Focus on Alternative and Preliminary Recommended Plans Waukesha County Public Informational Meeting January 20, 2009 #142063 Background
WATER SUPPLY NOW AND FOR THE FUTURE Steps toward sustainable water supplies
 WATER SUPPLY NOW AND FOR THE FUTURE Steps toward sustainable water supplies 2017 REPORT OF THE METROPOLITAN AREA WATER SUPPLY ADVISORY COMMITTEE TO THE MINNESOTA LEGISLATURE WE LIVE IN THE LAND OF 10,000
RURAL CENTER COMMUNITY ROLE COUNCIL ROLE RURAL CENTER ALL COMMUNITIES
 Orderly and Efficient Land Use Align land use, development patterns, and infrastructure to make the best use of public and private investment. Plan for forecasted population and household growth at overall
Chicago Area Waterways System - Industry and Transportation
 Chicago Area Waterways System - Industry and Transportation McHenry Lake k Sko ie R r ive De s P l aines River Ch re Salt C ica go Kane Riv ek er Cook DuPage n Sa me t d Will Sag ita Cha ry d an nne i
PENNSYLVANIA GREAT LAKES WATER CONSERVATION AND EFFICIENCY
 PENNSYLVANIA GREAT LAKES WATER CONSERVATION AND EFFICIENCY PROGRAM REVIEW 2015 Report December 2, 2015 The following information summarizes Pennsylvania s efforts regarding its Water Conservation and Efficiency
SUBURBAN EDGE COMMUNITY ROLE COUNCIL ROLE ALL COMMUNITIES SUBURBAN EDGE
 Orderly and Efficient Land Use Align land use, development patterns, and infrastructure to make the best use of public and private investment. Plan and stage development for forecasted growth through 2040
CHAPTER 3 Water Supply
 CHAPTER 3 3.1 WATER SUPPLY OVERVIEW This chapter describes the sources of water available to the City and MID. The chapter includes a description of each water source, including limitations, water quality
Progress Report. August 2000 Report No Purpose. 1 Section 11.45(7)(f), F.S. 2 Review of the Reuse of Reclaimed Water, OPPAGA Report
(f), F.S. 2 Review of the Reuse of Reclaimed Water, OPPAGA Report") Progress Report August 2000 Report No. 00-04 Wastewater Reuse Reduces Discharges and Provides Alternative Water Supplies at a glance Reuse of wastewater has significantly reduced the discharge of effluent
Progress Report August 2000 Report No. 00-04 Wastewater Reuse Reduces Discharges and Provides Alternative Water Supplies at a glance Reuse of wastewater has significantly reduced the discharge of effluent
Chapter Nine, Potable Water Subelement City of St. Petersburg Comprehensive Plan
 POTABLE WATER SUBELEMENT Sections: 9.1.1 INTRODUCTION 9.1.2 GOAL, OBJECTIVES AND POLICIES ISSUE: Rehab/Upgrade of Potable Water Facilities ISSUE: Extension of Potable Water Facilities ISSUE: Level of Service
Policy Responses to Climate Change: Climate Change & Our Regional
 Policy Responses to Climate Change: Climate Change & Our Regional Water Supply Derek Winstanley Chief, Illinois State Water Survey Creating a Regional Agenda to Address Climate Change University of Illinois
TITLE 9. ENVIRONMENT STATE WATER CONTROL BOARD
 November 2, 2005 TITLE 9. ENVIRONMENT STATE WATER CONTROL BOARD Title of Regulation: 9 VAC 25-780. Local and Regional Water Supply Planning (adding 9 VAC 25-780-10 through 9 VAC 25-780-190). Statutory
Water Governance Evaluation
 Water Governance Evaluation Streamline, strengthen and improve sustainable water management John Linc Stine MPCA Commissioner Suzanne Rhees Water Governance Evaluation Coordinator Clean Water Council November
APPENDIX A. Significant Policies, Rules, and Regulations
 Introduction APPENDIX A Significant Policies, Rules, and Regulations The development of recycled water is strongly influenced by political, regulatory, and economic factors. Recycled water policies shape
UWMP Standardized Tables. Kern River Valley District Urban Water Management Plan Appendix H
 UWMP Standardized Tables Kern River Valley District 2015 Urban Water Management Plan Appendix H Table 2-1 Retail Only: Public Water Systems Public Water System Number Public Water System Name Number of
List of Appendices APPENDIX A: WY 2000 LAKE MICHIGAN DIVERSION ACCOUNTING REPORT APPENDIX B: WY 2001 LAKE MICHIGAN DIVERSION ACCOUNTING REPORT
 EXECUTIVE SUMMARY This document is the Water Year (WY) 2000 Annual Report of the Chicago District, U. S. Army Corps of Engineers activities in the monitoring and review of the accounting of Lake Michigan
British Columbia s. VVater Act. Modernization. Policy Proposal on British Columbia s new Water Sustainability Act. December 2010
 British Columbia s VVater Act Modernization Policy Proposal on British Columbia s new Water Sustainability Act December 2010 British Columbia has a rich heritage in our lakes, rivers and streams. Linked
Model Drought Contingency Plans
 Model Drought Contingency Plans Table of Contents Model Drought Contingency Plan for Public Water Suppliers Model Drought Contingency Plan for Irrigation Districts Model Drought Contingency Plan for Wholesale
Surface Water Management Strategy
 Interim Report for the Surface Water Management Strategy WHAT WE HEARD SUMMARY November 2012 INTRODUCTION The surface water management strategy will outline a strategic plan to improve the management of
Anne Arundel County Programmatic Two-Year Milestones January 2018 December 2019
 Anne Arundel County 2018 2019 Programmatic Two-Year Milestones January 2018 December 2019 (Note: New Milestones are highlighted in green) Target Urban Stormwater 12/2016 Implement the County s Watershed
UWMP Standardized Tables. Chico-Hamilton City District Urban Water Management Plan Appendix H
 UWMP Standardized Tables Chico-Hamilton City District 2015 Urban Water Management Plan Appendix H Table 2-1 Retail Only: Public Water Systems Public Water System Number Public Water System Name Number
What are WSSC s conservation objectives? How is conservation linked to WSSC s environmental protection, resource management, sustainability goals?
 What are WSSC s conservation objectives? How is conservation linked to WSSC s environmental protection, resource management, sustainability goals? What are WSSC customers expectations about water conservation?
One Watershed, One Plan Plan Content Requirements
 One Watershed, One Plan Plan Content Requirements From the Board of Water and Soil Resources, State of Minnesota Version: 2.00 Effective Date: 03/28/2018 Approval: Board Decision #18-14 Policy Statement
Board of Directors Meeting Agenda Report
 Supplemental No. 1 AGENDA ITEM #10.B Distributed 6/21/18 Meeting Date: June 14, 2018 Board of Directors Meeting Agenda Report Subject: Initiated by: Previous Consideration: Fiscal Impact: Attachments Summary:
Infrastructure Element
 Infrastructure Element 1 2 3 4 5 6 7 8 9 10 11 12 13 14 15 16 17 18 19 20 21 22 23 24 25 26 27 28 29 30 31 32 33 34 35 36 37 38 39 40 41 42 43 44 45 INFRASTRUCTURE ELEMENT GOAL 1: To provide for environmentally
Integrated Planning for Meeting Clean Water Act Requirements
 Integrated Planning for Meeting Clean Water Act Requirements NAFSMA STORMWATER COMMITTEE Introduction Since the passage of the Federal Clean Water Act (CWA) in 1972, the Environmental Protection Agency
Western Governors Association Policy Resolution Water Resource Management in the West
 Western Governors Association Policy Resolution 2015-08 Water Resource Management in the West A. BACKGROUND 1. Water is a crucial resource for communities, industries, habitats, farms, and Western states.
CHAPTER SEVEN: UTILITIES
 CHAPTER SEVEN: UTILITIES 7.1 Introduction T he Water Works Board of the City of Auburn (AWWB) is the primary potable water service provider for the City of Auburn (City) and Auburn University. There are
Property of Presenter
 LakeCounty Department of Public Works WATER SUPPLY RESOURCES IN LAKE COUNTY County Green Presentation May 17, 2012 LakeCounty The Lake County Public Works Department was originally formed in 1964 to provide
Waukesha Water Supply. Frequently Asked Questions
 Waukesha Water Supply Frequently Asked Questions 1. Why is long-term water supply planning important? Long-term water supply planning is important because an affordable water supply that is healthy, reliable
Reuse of Wastewater Effluent through a Public and Private Partnership
 Reuse of Wastewater Effluent through a Public and Private Partnership 2016 Water Conference Chicago July 28, 2016 Presented by: Richard Hermann, PE Illinois American Water Presentation Agenda Challenges