GROUND WATER IMPACT ANALYSES FOR THE WILD TURKEY SAND MINE INDIAN RIVER COUNTY, FLORIDA. Prepared for: WILD TURKEY ESTATES OF VERO, L.L.C.
|
|
|
- Felix Owen
- 6 years ago
- Views:
Transcription
1 GROUND WATER IMPACT ANALYSES FOR THE WILD TURKEY SAND MINE INDIAN RIVER COUNTY, FLORIDA Prepared for: WILD TURKEY ESTATES OF VERO, L.L.C. Vero Beach, Florida Prepared by: BCI Engineers & Scientists, Inc W. Indiantown Road, Suite 107 Jupiter, Florida BCI Project No.: December 2007
2 TABLE OF CONTENTS 1.0 INTRODUCTION Site Description General Hydrogeology Ground Water MODEL(S) PROGRAM DESCRIPTIONS MODEL SETUP AQTESOLV MODFLOW MODEL RESULTS AQTESOLV MODFLOW MODEL LIMITATIONS AQTESOLV MODFLOW DISCUSSION AND CONCLUSIONS AQTESOLV MODFLOW Recommendations Conclusions REFERENCES... 18
3 LIST OF TABLES Table 1 Typical Soil Permeabilities Table 2 Monthly Averaged Temperatures for Vero Beach, Florida (degrees Fahrenheit). Table 3 Aquifer Characteristics East of Interstate 95 Table 4 Description of Active CUP s near Project Site Table 5 Corrigan Ranch Monitor Well Characteristics Table 6 Conductivities and Leakances of the Surficial Aquifer Table 7 Estimated Near Steady-State Pumping Rates Using AQTESOLV Table 8 Simulated Water Budget Using MODFLOW LIST OF FIGURES Figure 1 Site Location Figure 2 Topography Figure 3 Landuse Map Figure 4 Soils Map Figure 5 FEMA Flood Zones Figure 6 Historical Hurricanes with Paths near Site Figure 7 Active Consumptive Use Permits Near Site Figure 8 Floridan Potentiometric Surface Elevations of 2002 Figure 9 Recorded Water Levels at the Corrigan Ranch Monitor Well Figure 10 Location of the Corrigan Ranch Monitor Well Figure 11 Simulated Pre-Mined Water Table Elevations Using MODFLOW Figure 12 Simulated Drawdown with Active Mining Using MODFLOW Appendix A AQTESOLV Model Output Appendix B MODFLOW Output APPENDICES
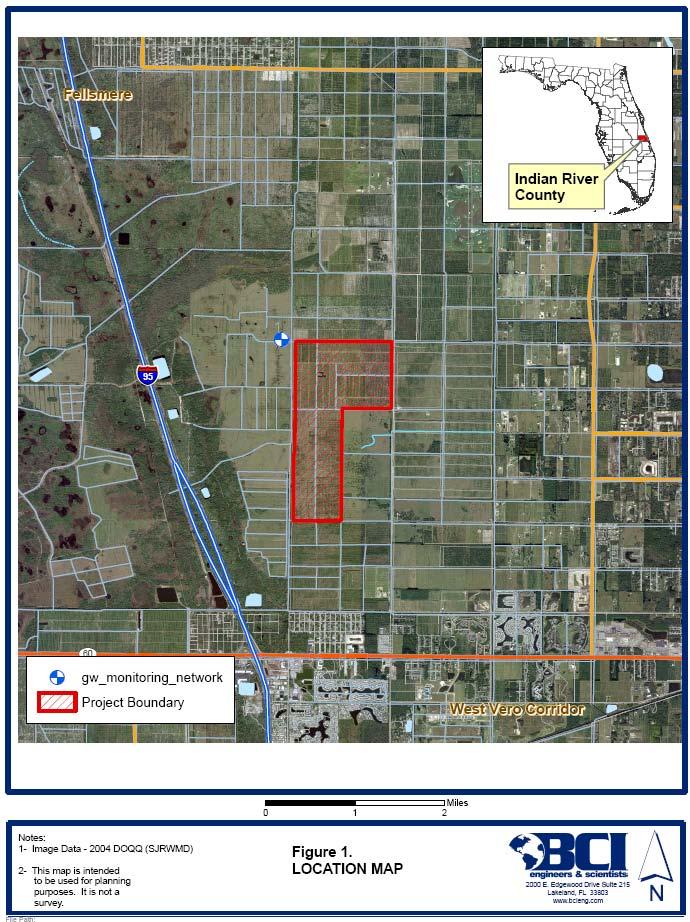
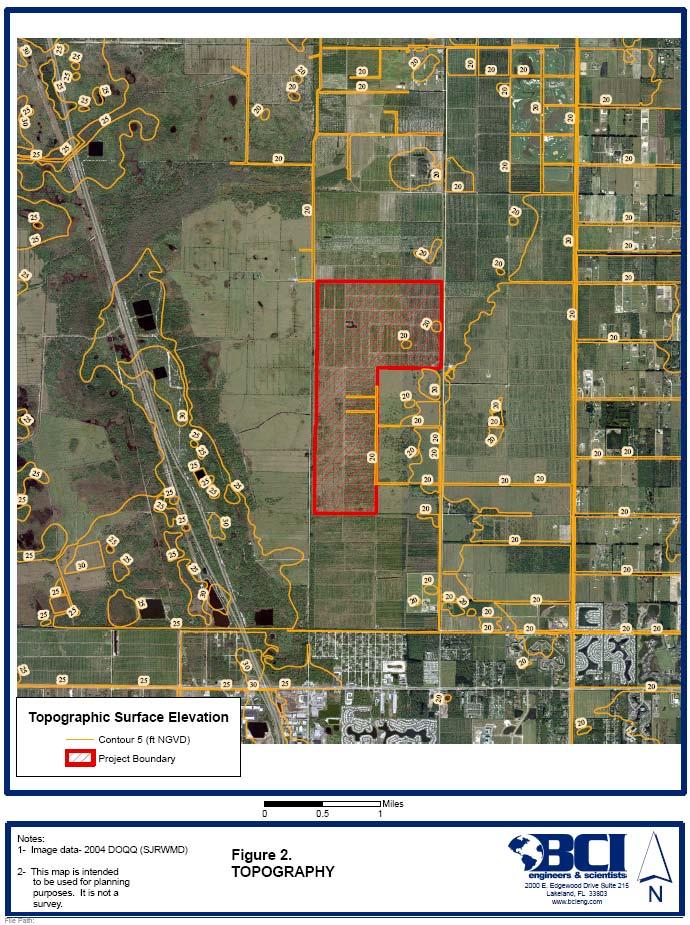
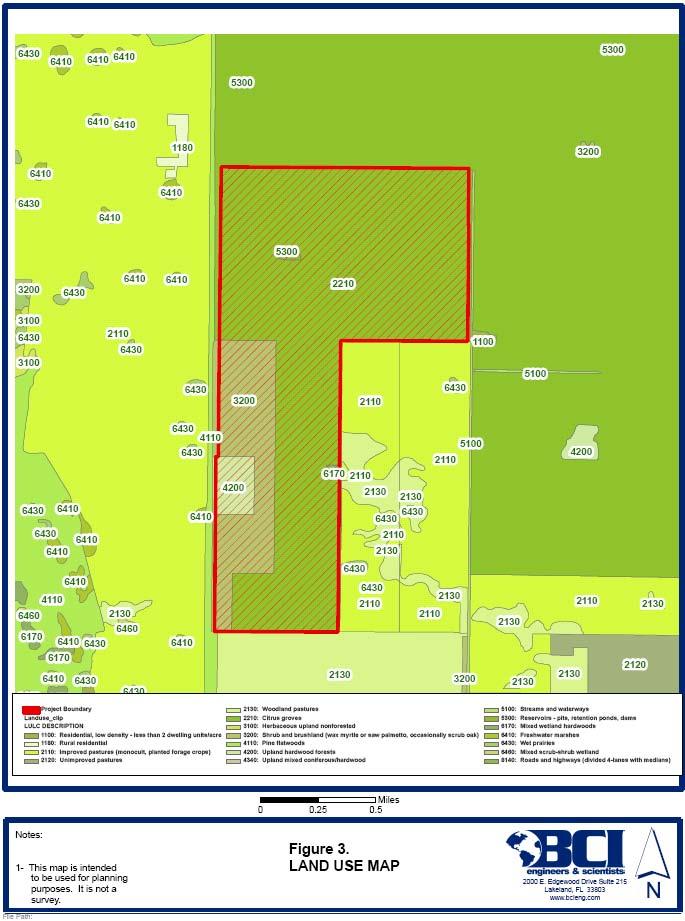
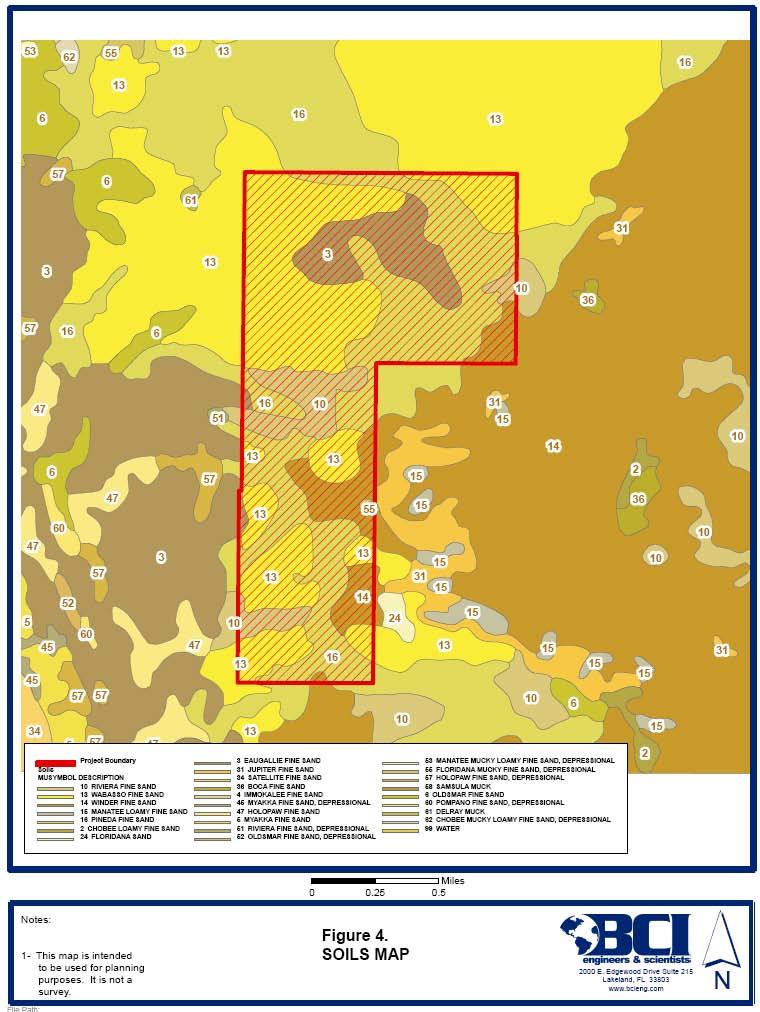
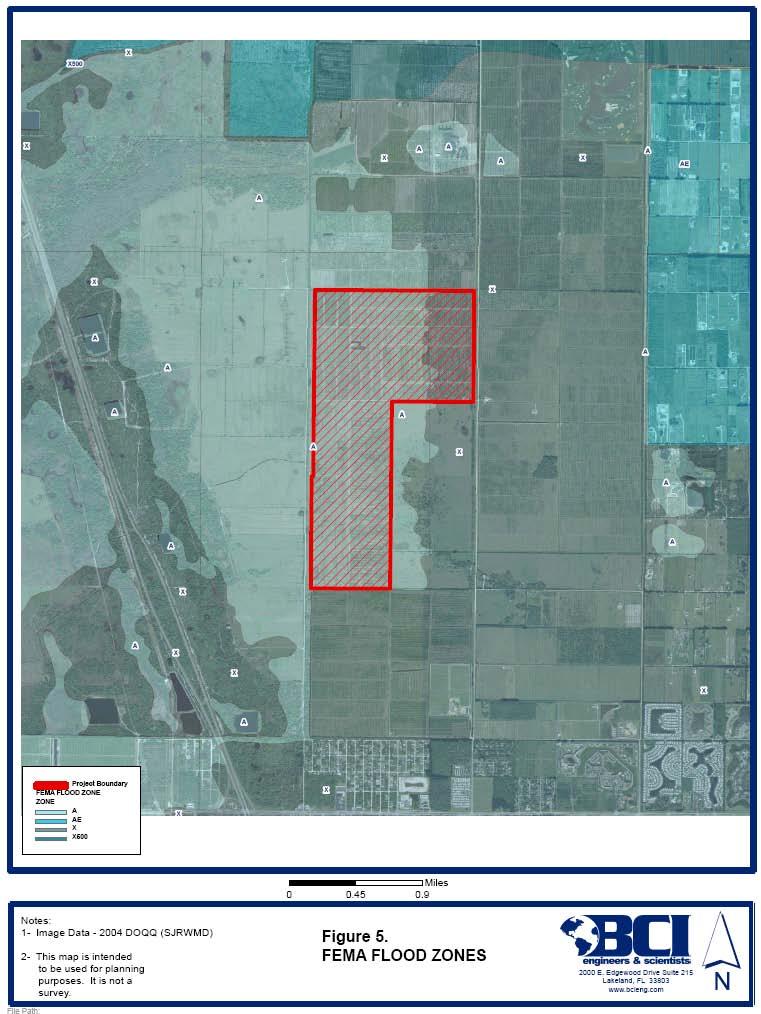
4 1.0 INTRODUCTION BCI Engineers & Scientists, Inc. conducted a ground water model analysis in support of permitting the Wild Turkey Sand Mine. The Sand Mine is located in Indian River County, Florida east of Interstate 95 and north of State Road 60 (Figure 1). The objective of the investigation is to estimate potential impacts of mining operations on ground water of adjacent properties. The proposed project is within an area of approximately 1,000 acres. Proposed mining will be in 20 acre blocks, allowing water levels of adjacent areas to recover as mining begins in a new block. At final build-out, mining operations will result in four reservoirs: two of about 80 acres, and two of about 46 acres. As mining operations proceed the water levels in a quarry will be maintained at approximately 35 ft below land surface (i.e., approximately -14 ft NGVD). Currently, runoff through the area is controlled by the numerous ditches installed to keep the water table below the roots of citrus trees grown in the area. During mining, direct rainfall and ground water inflow to the mine pits will be pumped into dewatering ditches. The dewatering ditches form a perimeter around the active mining and sand/gravel storage areas. These ditches will also intercept and prevent offsite runoff from entering the mine cut. After mining has ceased, water levels within a reservoir will rise as a function of rainfall and ground water inflow rates, reaching equilibrium with the surrounding ground water. During this project numerical and quasi-analytical simulations were used to characterize and compare ground water levels for conditions prior to mining and during mining. 1.1 Site Description General The area of the county where the proposed sand mine is sited has low topographic relief. Topographic surface elevations at the site are approximately 22 ft NGVD (Figure 2) with higher elevations along the east side of the property near Ranch Road. The predominant landuse at the site is citrus (Figure 3). On the property are also some shrub/brush and upland hardwood Forest. Adjacent to the property are citrus and pasture, with some wet prairies. Soils at the site include: Wabasso Fine Sand, Pineda Fine Sand, and Riviera Fine Sand (Figure 4). These are nearly level, poorly drained soils; some have a loamy subsoil at a depth of 20 to 40 inches, and some have a dark sandy subsoil underlain by loamy material at a depth of less than 40 inches...consists of soils in broad sloughs, depressions and poorly defined drainage ways (Ref. 1). Hydrologically, Wabasso and Pineda Fine Sands are listed as B/D and Riviera Fine Sands are listed as C/D. This indicates that without lowering the water table through artificial means,
5 Wild Turkey Estates of Vero, L.L.C. BCI Project No Ground Water Impact Analyses for December 2007 the Wild Turkey Sand Mind Page 2 these soils have a high runoff potential. Typically, the high water table of these soils without anthropomorphic changes is 0 to 1 feet below land surface. Table 1 lists typical permeabilities of these soils with depth. All three of the soils have zones of lower permeability (< 0.2 inches/hour) between zones of higher permeability (> 6 inches/hour). Table 1 Typical Soil Permeabilities Riviera Fine Sand Wabasso Fine Sand Pineda Fine Sand Depth (inches) Permeability (inches/hour) Depth (inches) Permeability (inches/hour) Depth (inches) Permeability (inches/hour) < < < < to Note: Taken from Ref. 1 The central part of the county is occupied by the St. Johns River marsh, which drains to the north. Much of the property is in Flood Zone A (i.e., the 100-year flood zone) with the remaining portions in Zone X (i.e., the 500-year flood zone) and drains to the west (Figure 5). The property is bordered to the east by Lateral C Canal and to the west by Lateral D Canal with the sub-lateral canals running east west across the property: C-10 through C-13 West. Annual rainfall amounts at Vero Beach Municipal Airport (approximately 4.8 miles from the site) range from 33 to greater than 60 inches/year, with a mean annual rainfall of approximately 50 inches/year. Rainfall rates are generally highest in the months of June and September, averaged 7.5 and 7.8 inches in these two months, respectively. Maximum rainfall depths of approximately 23.3 inches/month were reported for September 2004 when Hurricanes Frances and Jeanne visited the area. For the month of June, the maximum rainfall depth was 15.1 inches/month in The closest weather station used to estimate ET to this site is at Fort Pierce, Florida. Average annual potential evapotranspiration (ET) of 48 inches/year was estimated by at this station for the period of 1998 through 2007 (Ref. 2). Irrigation is generally applied to citrus in this area during the growing season from May through October and during drought conditions. The irrigation water requirement varies with climate, tree size and age, spacing of trees, ground covers, and seasonal growing condition. The required water volume ranges from 1 gallon/day/tree for small young trees to gallon/day/tree for old large trees in July and August (Ref. 10). During winter months from December to February, the irrigation requirement is about percent less than summer requirements (Ref. 4). The monthly averaged daily high and low temperatures for this region are shown in Table 2. July and August are the hottest months. The coldest month is January followed by
6 Wild Turkey Estates of Vero, L.L.C. BCI Project No Ground Water Impact Analyses for December 2007 the Wild Turkey Sand Mind Page 3 February. But the average monthly low temperatures are above 53 degrees Fahrenheit for the entire year. January and February are also the months with minimum rainfall during the entire year. However, the evapotranspiration rates for these two months are not the lowest. They are higher than the rates of November and December. Table 2 Monthly Averaged Temperatures for Vero Beach, Florida (degrees Fahrenheit). Month Jan Feb March April May June July Aug Sept Oct Nov Dec High Low Since this region is located in the tropical storm prone area, hurricanes will be a concern for the site. Hurricanes are often accompanied by heavy rainfalls, which can last for several days and inundate the low lying areas. In the past, these storms have disrupted power supplies and caused mass power outage for several weeks for each area they hit. Figure 6 shows the storm tracks for hurricanes passing within the 50 nautical mile radius during the past 50 years 1. A total of seven hurricanes have passed through this area since The most recent three storms occurred in 2004 and Hurricanes Frances and Jeanne caused severe floods for an extensive area across Central Florida in Hurricane Wilma (2005) moved into Atlantic Ocean from the coastline just south of this region. Wilma was a Category 5 storm before it moved inland from the Gulf of Mexico Hydrogeology A detailed description of the geology at the site is provided in Reference 2. The ground water system of Indian River County is generally described as having three aquifers: the surficial aquifer, Intermediate aquifer, and Floridan aquifer. Table 3 provides a list of characteristics for this system east of Interstate 95. West of Interstate 95 the Fort Thompson and Caloosahatchee Formation occurs and consists primarily of sand, silt, and clay. The soils at the site are generally poorly graded sands with lenses of sandy clay, silty sand, and rock. For one soil boring taken at the site, a foot of cap rock was observed starting at a depth of seven feet below land surface. The cap rock refers to consolidated shell and coquina that may include zones of lower permeability and reduced infiltration. A more detailed description of the boring logs is provided in a separate report. A ground water resource investigation for the site (Ref. 3) estimated ground water parameters at several locations within the county. One of the closest wells to the proposed Wild Turkey Sand Mine (i.e., Well No. 6) of 49.5 ft total depth had an estimated Specific Capacity of 5.3 gallons per minute per foot. That translates into an average saturated hydraulic conductivity 1 These data were obtained from the tropical storm data archive of National Hurricane Center, National Oceanic Administration Agency (NHC, NOAA s Website:
7 Wild Turkey Estates of Vero, L.L.C. BCI Project No Ground Water Impact Analyses for December 2007 the Wild Turkey Sand Mind Page 4 (K h ) of between 5 and 6 ft/day for an aquifer of 105 to 130 ft thickness 2. The upper 50 ft are the most productive interval of the surficial aquifer, and K h could exceed 6 ft/day in these soils. In addition, preliminary soils testing provided estimated K h values of approximately 1 ft/day (Rebecca Ascoli, personal communiqué). Table 3 Aquifer Characteristics East of Interstate 95 Aquifer Geological Unit Description Surficial Confining Unit & Intermediate Aquifer Florida Aquifer Anastasia Formation Tamiami Formation Hawthorn Group Ocala Limestone Group Williston and Inglis Formations Depth to top of Unit (ft) Transmissivity (ft 2 /day) sand, shell, and coquina to 11,000 interbedded sand and limestone sand, shell, and limestone 105 to 130 Unknown limestone and dolomite Approx. 400 ft. 4,800 to 1,500,000 Note: Data taken from Ref. 2 and 3. The Ocala Limestone Group was reported as the Crystal River Formation in those publications. Though the surficial aquifer is frequently used for irrigation, the Floridan aquifer is the major source of ground water in the county. This limestone aquifer is generally about 500 feet thick and of Eocene to Miocene age. The water of the Floridan aquifer can be highly mineralized but the yield is considerably greater than that of the Intermediate aquifer (Ref. 2). A ground water model of well fields for the City of Vero Beach use an estimated transmissivity of 408,000 ft 2 /day with a leakance rate of day -1 between the surficial and Upper Floridan aquifers (Ref. 5) Ground Water Estimated normal water levels within the surficial aquifer are 18 to 19 ft NGVD as controlled by the numerous canals and ditches adjacent and within the property. Ground water borings taken at the site encountered the water table at 2.5 to 3.5 feet below land surface. During mining, a dewatering ditch will receive pumped water from the internal rim ditch of the open mine cut. The distance between the dewater ditch and internal rim ditch will be approximately 100 ft. The dewater ditch will help maintaining aquifer water levels away from mining. 2 To estimate the hydraulic conductivity, it was assumed that the duration of pumping for Well 6 was 1.25 hour and that the specific yield was 0.2.
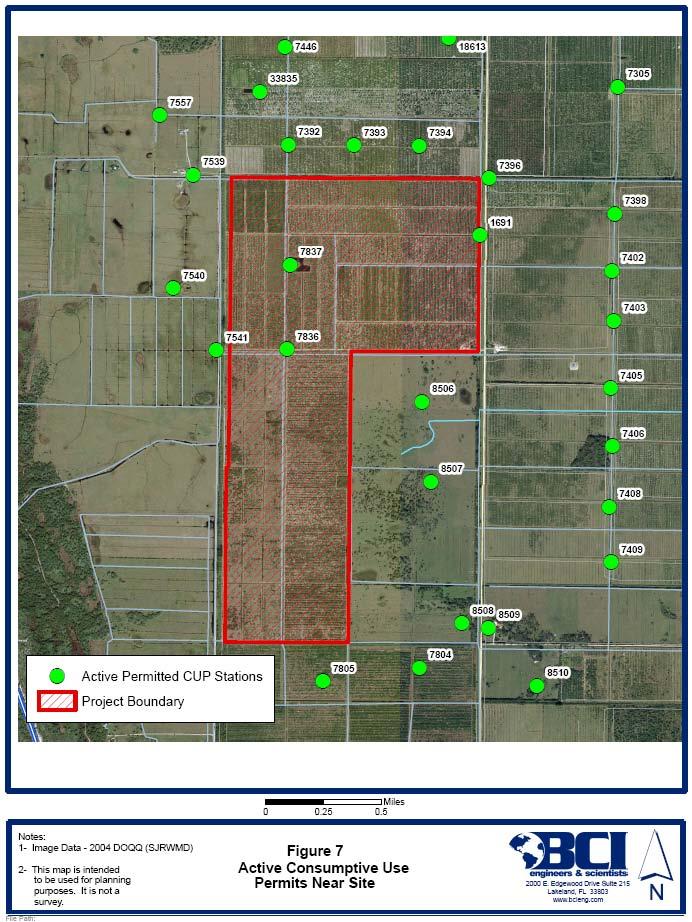
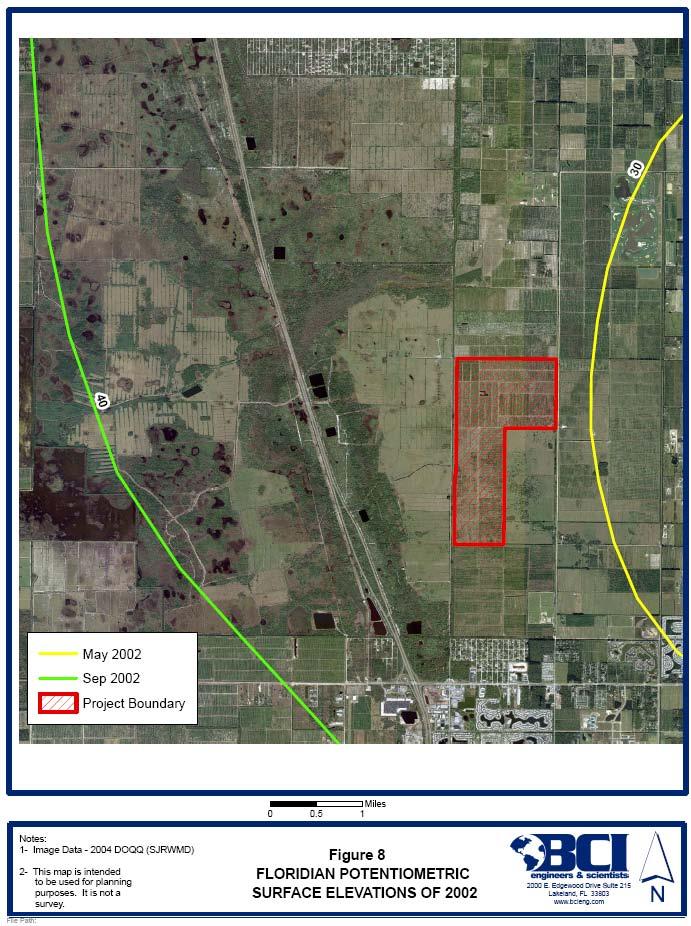
8 Wild Turkey Estates of Vero, L.L.C. BCI Project No Ground Water Impact Analyses for December 2007 the Wild Turkey Sand Mind Page 5 Figure 7 shows the location of active consumptive use permits (CUP) in the area of the proposed site. Table 4 lists characteristics of these wells, which are open to the Floridan aquifer except for two surface water pumps (i.e., Stations 1691 and 2177). The average withdrawal rate of wells listed in the table is 890 gallons per day. Casing Depth are generally less than 400 ft, indicating that these well may be screened within the Hawthorn Group of the Intermediate aquifer. Zones of salty water are known to occur in the Floridan aquifer, which increases with ground water withdrawals from the Floridan. Figure 8 shows the potentiometric surface of the Floridan aquifer in the area of the proposed quarry. The Floridan aquifer is a confined aquifer meaning it is under pressure, confined by the clays of the Hawthorn formation. In this case, the potentiometric heads of 30 to 40 ft NGVD are approximately 10 to 20 ft greater than the surrounding topography. Thus, the Floridan aquifer exhibits characteristics of an artesian aquifer in the area of the proposed site. The artesian pressures mean that water flows from the Floridan to the Intermediate and surficial aquifers in an upward direction. Figure 9 shows the recorded water levels for nested ground water monitoring wells at the northeast corner of the mine site. The location of these wells is indicated on Figure 10. Table 5 lists the casing depth and total depth of these wells. The average potentiometric head of the Floridan aquifer is 38 ft NGVD, and the average head of the upper surficial aquifer is 21 ft NGVD; an average difference of 17 ft during the period of 2000 through The average difference in water levels between the upper part of the surficial aquifer and the lower part of the surficial aquifer is 0.2 ft during this period. With a leakance of day -1 between the surficial and Upper Floridan aquifers, and a head difference of 17 feet, the average leakage from the Floridan into the surficial aquifer is approximately 35 inches/year.
9 Wild Turkey Estates of Vero, L.L.C. BCI Project No Ground Water Impact Analyses for December 2007 the Wild Turkey Sand Mind Page 6 Table 4 Description of Active CUP s near Project Site Station ID Permit ID 1 Water Source Casing Depth (ft) Total Depth (ft) Casing Diameter (inches) Well Capacity (gpd) Sebastian River, Dewatering Floridan Aquifer Floridan Aquifer Floridan Aquifer Floridan Aquifer Floridan Aquifer Floridan Aquifer Floridan Aquifer Floridan Aquifer Floridan Aquifer Floridan Aquifer Floridan Aquifer Floridan Aquifer Floridan Aquifer Floridan Aquifer Floridan Aquifer Floridan Aquifer Floridan Aquifer Floridan Aquifer Floridan Aquifer Floridan Aquifer Floridan Aquifer Floridan Aquifer Floridan Aquifer Floridan Aquifer Floridan Aquifer Floridan Aquifer Floridan Aquifer SRWCD Canal 1. GRS Station Identifier (System Generated) Note: zero values generally indicate missing, not set, or non-applicable values, which were replace with shading.
10 Wild Turkey Estates of Vero, L.L.C. BCI Project No Ground Water Impact Analyses for December 2007 the Wild Turkey Sand Mind Page 7 Table 5 Corrigan Ranch Monitor Well Characteristics Unit Monitored Casing Depth (ft) Total Depth (ft) Upper Surficial Aquifer Lower Surficial Aquifer Floridan Aquifer In 1958 (Ref. 2) it was estimated that the potentiometric heads of the Floridan aquifer had fallen 10 feet since 1934 as a result of ground water withdrawals. The Floridan aquifer water levels have undoubtedly fallen further since Depressed water levels of the Floridan aquifer reduce the head gradient driving the flow of water upward from the Floridan aquifer, potentially decreasing the migration of higher chloride levels into the Intermediate and surficial aquifers. Depressed water levels of the surficial aquifer will partially restore the natural gradient (i.e., head difference) between the Floridan and surficial aquifers. However, these activities could potentially increase the rate that higher concentrations of chlorides migrate upward into the Intermediate and surficial aquifers.
11 Wild Turkey Estates of Vero, L.L.C. BCI Project No Ground Water Impact Analyses for December 2007 the Wild Turkey Sand Mind Page MODEL(S) PROGRAM DESCRIPTIONS A quasi-analytical method was used representing the active mine area using the program AQTESOLV (Ref. 6). This provided an estimate of ground water withdrawals during mining that could be used as a rough comparison for the subsequent modeling. A quasi-three dimensional model MODFLOW (Ref. 7) was used to represent the surficial aquifer in the area of the wellfield. MODFLOW is a finite-difference model that simulates flow in three dimensions. For this project MODFLOW was used to represent flow and water levels of the surficial aquifer.
12 Wild Turkey Estates of Vero, L.L.C. BCI Project No Ground Water Impact Analyses for December 2007 the Wild Turkey Sand Mind Page AQTESOLV 3.0 MODEL SETUP Using AQTESOLV, the open mine pit was represented as a partially penetrating well with a constant pumping rate in an unconfined aquifer of 105 to 130 ft thickness. With an average saturated conductivity of 1 to 5 ft/day, the transmissivity is 130 to 650 ft 2 /day. Constant head boundary conditions were set at approximately 500 feet from the center of the well. The program gives the user the option to change the model parameters to adjust the time drawdown and distance drawdown curves. In the calculations, a constant pumping rate over a period exceeding 900 days was applied to reach near steady-state conditions. 3.2 MODFLOW MODFLOW was used to represent the surficial and Floridan aquifers in the area of the proposed mine. In these simulations, the Intermediate aquifer was represented as part of the confining unit. The surficial aquifer was assumed to be 130 feet thick with horizontal conductivities of 1 ft/day. The Floridan aquifer was represented as a constant head in the model simulations. The surficial aquifer was represented as three model layers. The first layer represents the aquifer to the bottom of the recharge ditches (i.e., about 10 ft NGVD), the second layer represents the aquifer to the bottom of mining (i.e., -14 ft NGVD), and the third layer represents the unit to the bottom of the surficial aquifer 3. Leakance values are used to represent vertical conductivities in MODFLOW. Between layers of the surficial aquifer, the leakance represents the net vertical conductivity between these two layers: m m L = + 2K v1 2K v2 where L is the leakance (1/day) m 1 is the thickness of the upper layer m 2 is the thickness of the lower layer K v1 is the vertical conductivity through the upper layer K v2 is the vertical conductivity through the lower layer 3 The leakance defined for this layer also represents the confinement between the surficial and Floridan aquifers. Simulations representing active mining used a bottom elevation of -15 ft NGVD to prevent numerical problems when using a constant head of -14 ft.
13 Wild Turkey Estates of Vero, L.L.C. BCI Project No Ground Water Impact Analyses for December 2007 the Wild Turkey Sand Mind Page 10 Table 6 Conductivities and Leakances of the Surficial Aquifer Layer Thickness (ft) K h (ft/day) K v (ft/day) Leakance (1/day) Boundary conditions include topographic land surface, mine pits, dewatering ditches, canals, and extents of the model area. These boundaries were represented as follows: Constant heads were used to represent mine pits and dewatering ditches. The constant heads representing the mine pits are in model layer 2. The constant heads representing the dewatering ditch are in model layer 1. River cells were used to represent canals and agricultural ditches. The river conductance was set at five times the product of the channel width and channel length in the cell. Channel bottom widths were assumed to be 10 ft wide and have a depth of 7 feet below land surface. Water levels in canals were assumed to be two feet deep (i.e., water surface were set 5 feet below land surface). Simulations of the pre-mined conditions were used to select aerial recharge rates such that the simulated water table elevation does not exceed land surface elevations. Constant heads (i.e., 37 ft NGVD) were used to represent the Floridan aquifer. No flow boundary conditions were used at the model extents. Conceptually, the agricultural ditches and canals are sinks that help reduce the water table elevations in the area. During mining, some canal sections could potentially act as a source of water to the open mine pit. The conductance values used to representing the agricultural ditches and canals indicate that leakage from and to these features are limited by aquifer characteristics and not bottom sediments characteristics. In the steady-state simulations, a constant grid spacing of 100 ft (i.e., square grids) was used with at total of 226 rows and 151 columns.
14 Wild Turkey Estates of Vero, L.L.C. BCI Project No Ground Water Impact Analyses for December 2007 the Wild Turkey Sand Mind Page AQTESOLV 5.0 MODEL RESULTS Using AQTESOLV, the pumping rate at the well was varied so that near steady-state drawdowns of 35 ft occur at the mine pit. Table 7 summarizes the results from these simulations. Appendix A contains printouts of time-drawdown and distance-drawdown curves from the model simulations. Table 7 Estimated Near Steady-State Pumping Rates Using AQTESOLV Aquifer Thickness (ft) K h (ft/day) K v /K h Pumping Rate (gpm) Notes: K h = horizontal conductivity, K v = vertical conductivity, ft = feet, gpm = gallons per minute Does not include surge pumping for rainfall or other recharge events Similar results could be obtained using the Dupuit-Forcheimer equation: Q = AK h h 2 1 h L A is the cross sectional area of flow 4. That is, it is the pit perimeter times depth of water below the pit (88,671 ft 2 ). K h is the hydraulic conductivity of the soils (1 to 5 ft/day). h 1 is the depth of the water table at the dewatering ditch (130 ft). h 2 is the depth of water at the mine pit (95 ft). L is the distance from the dewatering ditch from the edge of mine pit (100 ft). Using the Dupuit-Forcheimer equation: With K h equal 1 ft/day, Q is 363 gpm With K h equal 5 ft/day, Q is 1813 gpm. 4 In this case, flow is limited by the cross sectional area of the aquifer below the pit and not the area of the pit bottom.
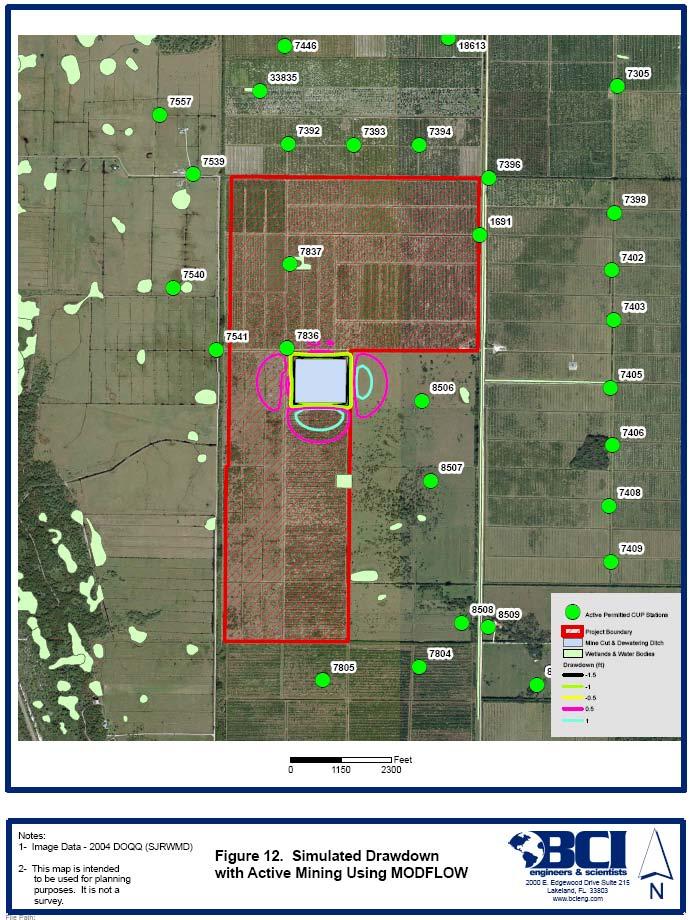
15 Wild Turkey Estates of Vero, L.L.C. BCI Project No Ground Water Impact Analyses for December 2007 the Wild Turkey Sand Mind Page MODFLOW A constant negative recharge rate of 26 inches/year (i.e., ft/day) was used to offset the inflows from the Floridan aquifer as simulated in the model. This rate was estimated in a trail-and-error manner to keep the water table at or below land surface. Figure 11 shows the simulated water levels in the upper layer of the model. The simulated average depth to the water table was 4.1 ft. Figure 12 shows the simulated drawdown near an open mine pit. In these simulations drawdown past the dewatering ditches is shown. Using MODFLOW, the estimated drawdown is approximately 2 ft. Simulated drawdowns exceeding 0.5 ft occurred at a maximum distance of approximately 900 ft from the dewatering ditch. The percent error in these simulations was less then 0.01, and no numerical incongruencies were apparent. Table 8 lists components of the water budget simulated using MODFLOW. These simulations indicate inflows to the mine pit of 131 gpm, with less than 20- percent of the flow supplied by the dewatering ditch. Model Layer Output files from the MODFLOW simulations are included in Appendix B. Table 8 Simulated Water Budget Using MODFLOW Component Existing (inches/year) Active Mining (inches/year) 1 Net Recharge Canals Dewatering Ditch Flow from Layer Flow up to Layer Flow from Layer 3 28/59 28/ Open Mine Cut Flow up to Layer Flow from Layer 4 (Upper Floridan Aquifer) [Existing-Active] (inches/year)
16 Wild Turkey Estates of Vero, L.L.C. BCI Project No Ground Water Impact Analyses for December 2007 the Wild Turkey Sand Mind Page AQTESOLV 6.0 MODEL LIMITATIONS The assumptions for the equations used in this analysis include: 1. The aquifer has infinite aerial extent 2. The aquifer is homogeneous and has uniform thickness 3. The water table surface is initially horizontal 4. The pumping well partially penetrates the aquifer 5. Flow is unsteady 6. The well diameter is small and its storage can be neglected 7. There is no rainfall recharge or leakage from other aquifers In this analysis, the well with a radius of 400 feet represents the open mine cut, which has significant storage and does not meet the conditions of assumption six. However the mine pit will not be instantly dug. Rather, pumping will progress with the mining and for the conditions of this investigation near steady-state conditions are of interest. This will diminish the importance of the sixth assumption. The constant head boundary conditions used to represent the perimeter ditch are not partially penetrating. So, no drawdown proceeds past these boundary conditions. This may unrealistically limit the extent of drawdown and overestimating the flow rates back to the mine pit. Calculations using the Dupuit-Forcheimer equation assume steady-state conditions. The Dupuit-Forcheimer equation as used here, does not account for a seepage face forming above the floor of the open mine pit. 6.2 MODFLOW Steady-state conditions were simulated using MODFLOW. During conditions of drought, water levels in the agricultural ditches will be lower and possible dry. This means that the zone of mine impacts will extend further into adjacent property. During wetter periods, water levels in the agriculture ditches and canals could be higher than represented in the model simulations. In that case, the mine impacts will not extend as far into adjacent property. The conductance values used in the model simulations are potentially large meaning the leakage to and from canal and agricultural ditches are limited by aquifer characteristics and not by ditch bottom sediments. Sediment deposition within the ditches and canals is likely heterogeneous; some areas having higher bottom permeabilities than others. Ditch geometries
17 Wild Turkey Estates of Vero, L.L.C. BCI Project No Ground Water Impact Analyses for December 2007 the Wild Turkey Sand Mind Page 14 will differ between canals and canal sections. The effect of these differences was not represented in the model. The potentiometric surface of the Floridan aquifer was represented as constant heads in the model simulations. Higher potentiometric surface elevations could reduce estimated impacts of mining to the water table. Conversely, lower potentiometric surface elevations could increase the estimated impacts of mining to the water table. However, these impacts would not occur instantaneously, and the model represents an average conditions. A constant negative recharge rate was used to represent the combined effects of ET and runoff in the steady-state simulations. This rate was not changed between the pre-mined and active-mining scenarios. However, there could possibly be decreased runoff and lower ET as a result of mine drawdown. This means that model potentially overestimates drawdown away from the mine cut.
18 Wild Turkey Estates of Vero, L.L.C. BCI Project No Ground Water Impact Analyses for December 2007 the Wild Turkey Sand Mind Page DISCUSSION AND CONCLUSIONS Without further site specific information, some conditions at the site remain unknown. These conditions include the total thickness of the aquifer and the ratio of vertical to horizontal conductivity of the soils. In addition, leakance rates and permeabilities for the lower aquifers (i.e., Intermediate and Floridan) were estimated for a site close to Vero Beach not on the proposed mine site. The simulations generally indicate that there will be drawdown away from the mine cut, with drawdowns exceeding 0.5 ft extending 900 ft or more past the dewatering ditches. These drawdowns will be associated with increased flow from the Floridan aquifer and agricultural canals in the area. There are several freshwater marshes within 900 feet of the property that might warrant additional monitoring during the period of mining. The Corrigan Ranch monitor well is near the property and could be used as an indicator of potential ground water changes with installation of continuous monitoring equipment. Excess water from the pit after satisfying the needs of the dewatering ditches could be used to maintain higher water levels in the nearby agricultural ditches. This might help offset impacts to the water table, especially during periods of drought. A continuous ground monitoring program will be developed and discussed in a separate document and data gathered during the mining operating period. The purpose of the monitoring program will be to document ground water elevations during mine operations. 7.1 AQTESOLV The AQTESOLV simulations were used to represent a near steady-state condition with 35 ft of drawdown at the mine pit. The estimated pumping rate at the mine pit based on these calculations is 450 to 2500 gpm at near steady-state conditions - assuming that there are no impacts beyond the recharge ditch. These simulations do not include additional surge capacity that may be required to overcome rainfall or other recharge events. Estimated pumping rates could be lower with greater vertical stratification than used in the model simulations. Calculations based on the Dupuit-Forcheimer equation provided similar results to those obtained using AQTESOLV. These analytical simulations assume near steady-state conditions. These equations provide a preliminary estimate of ground water inflows to the mine pit, but do not consider impacts beyond the recharge ditch. 7.2 MODFLOW The MODFLOW simulations indicate a maximum drawdown of approximately 2 ft beyond the dewatering ditches could be induced by mining. However, these larger impacts are
19 Wild Turkey Estates of Vero, L.L.C. BCI Project No Ground Water Impact Analyses for December 2007 the Wild Turkey Sand Mind Page 16 close to the dewatering ditch and simulated drawdown is less than 0.5 ft at distances greater than 900 ft from the dewatering ditches. The simulations indicate that drawdown beyond the dewater ditch is limited by decreased leakage to agricultural ditches and canals in the area. The MODFLOW simulations indicate seepage rates into the mine cut of 130 gpm, and that approximately 20 percent of the seepage into the mine cut is derived from the dewatering ditches. MODFLOW simulations indicate increased upward flow from the Floridan aquifer of approximately 0.3 inches/year over the 12 square mile area represented by the model. 7.3 Recommendations 1. Install monitoring wells at the edge of the mine property and near areas of active mining. This could include 5 monitor wells (one at each edges of the property) and several additional monitor wells just outside one or more selected dewatering ditch configurations. 2. Add continuous monitoring equipment at the existing Corrigan Ranch monitor wells. 3. Keep records of dewatering pumping rates and water levels within the rim ditches, dewatering ditch, and inactive mine reservoirs. 4. Keep daily records of rainfall depths using an onsite rain gage. 5. Use the existing irrigation canals on the site to reduce offsite ground water impacts. 6. Refine ground water computer models to better simulate ground water conditions during mining. 7. Conduct onsite pump test to estimate soil conductivities (horizontal and vertical). 8. Drill deep borings to estimate the total surficial aquifer thickness at the site. 7.4 Conclusions 1. The modeling supports the mining permit needs by demonstrating small impacts to ground water on adjacent properties. The simulations results indicate that drawdown falls to less than 0.5 feet at distance greater than 900 feet from the dewatering ditch. 2. The computer simulations indicate almost no drawdown at nearby active permitted wells. This is because of the large distances from the proposed mine pits to existing wells. In addition, the wells are open to the Intermediate and Floridan aquifers and not the surficial aquifer where mine impacts are most significant. 3. The modeling may be conservative, since it does not represent reduced hydraulic conductivities expected for a clay layer 60 feet below grade as shown in the boring logs. In addition, a single negative recharge rate is used in both the pre-mined and active mining
20 Wild Turkey Estates of Vero, L.L.C. BCI Project No Ground Water Impact Analyses for December 2007 the Wild Turkey Sand Mind Page 17 scenarios. However, there could be localized decreases in the negative recharge rates (i.e., less runoff during rain events) decreasing estimates of onsite and offsite drawdown. 4. There are a number of measures that if implemented could help reduce offsite impacts including the following: a. Increase the size and number of perimeter ditches and use them as recharge elements to minimize impacts to adjacent property. b. Dredge the existing agricultural ditches to remove any accumulated sediments. c. Provide surface water augmentation to sensitive wetlands and marshes within areas of ground water impact.
21 Wild Turkey Estates of Vero, L.L.C. BCI Project No Ground Water Impact Analyses for December 2007 the Wild Turkey Sand Mind Page REFERENCES 1. Soil Conservation Service Soil Survey of Indian River County, Florida. U.S. Department of Agriculture. 2. Bermes, Boris J Interim Report on Geology and Ground-Water Resources of Indian River County, Florida. Information Circular No. 18. Florida Geological Survey. 3. Toth, David J. and Ching-tzu Huang, Investigation of Ground water Resources in Central Indian River County, Florida. St. John River Water Management District. Palatka Florida. 4. Division of Agricultural Water Policy, Florida Department of Agriculture and Consumer Services Best Management Practices (BMPS) for Indian River Area Citrus Groves. 5. Toth, David J Projected Aquifer Drawdowns City of Vero Beach and Indian River County Wellfields, Indian River County, Florida. St. John River Water Management District, Palatka Florida 6. AQTESOLV for Windows Version 4.02, Developed by Glenn M. Duffield, HydroSolve, Inc 7. McDonald, Michael G. and Arlen W. Harbaugh A Modular Three-Dimensional Finite-Difference Ground-Water Flow Model. U.S. Geological Survey.
22 FIGURES
23
24
25
26
27

28 Source: National Hurricane Center, NOAA Figure 6 Historical Hurricanes with Paths near Site
29
30
31 Figure 9 Recorded Water Levels at the Corrigan Ranch Monitor Well 41 Upper Surficial Aquifer Lower Surficial Aquifer Floridan Aquifer Water Level, Ft NGVD Jan-00 Dec-01 Dec-03 Dec-05 Dec-07 Date
32

33
34
LAKE LABELLE DEWATERING MODEL. AUTHOR Gail Murray Doyle, P.G. September Murray Consultants, Inc 769 Skyview Dr Hayesville, NC
 LAKE LABELLE DEWATERING MODEL AUTHOR Gail Murray Doyle, P.G. September 2013 Murray Consultants, Inc 769 Skyview Dr Hayesville, NC 28904 828-389-2476 LAKE LABELLE DEWATERING MODEL INTRODUCTION Purpose The
Background Information on the. Peace River Basin
 Background Information on the Peace River Basin Resource Conservation & Development Department August 24 Background Physiography The Peace River drainage basin occupies large parts of Polk, Hardee, DeSoto,
Numerical Groundwater Flow Model Report. Caloosa Materials, LLC 3323 Gulf City Road Ruskin, Florida 33570
 Numerical Groundwater Flow Model Report Caloosa Materials, LLC 3323 Gulf City Road Ruskin, Florida 33570 GHD 2675 Winkler Ave Suite 180 Fort Myers, FL 33901 11138224 Report July 27, 2017 Table of Contents
LAKE LABELLE ENGINEERING REPORT
 154 N. Bridge Street, LaBelle, Florida 33935 -Tel: (863) 612-0011 Fax: (863) 612-0014 - email: rock@rockhendry.com LAKE LABELLE ENGINEERING REPORT PREPARED FOR Lake LaBelle, LLC March 2014 PREPARED BY:
FAX
 21335 Signal Hill Plaza Suite 100 Sterling, Virginia 20164 www.geotransinc.com 703-444-7000 FAX 703-444-1685 Mr. William Kutash Florida Department of Environmental Protection Waste Management Division
A MODEL OF SEAWATER INTRUSION IN SURFICIAL AND CONFINED AQUIFERS OF NORTHEAST FLORIDA
 The Second International Conference on Saltwater Intrusion and Coastal Aquifers - Monitoring, Modeling, and Management. Mérida, Yucatán, México, March 30 - April 2, 2003 A MODEL OF SEAWATER INTRUSION IN
Continuous Simulation Example Problem
 Continuous Simulation Example Problem The following examples provided an introduction to the continuous simulation hydrograph in the PONDS 3.2 Refined Method software, with an emphasis on wetland hydroperiod
DYNFLOW accepts various types of boundary conditions on the groundwater flow system including:
 Section 6 Groundwater Flow Model A groundwater flow model was developed to evaluate groundwater flow patterns in the site area and to provide a basis for contaminant transport modeling. 6.1 Model Code
Supplemental Guide II-Delineations
 Supplemental Guide II-Delineations Contents Source Water Protection Area Delineation... 1 Delineation Criteria for Systems Using Groundwater Sources... 2 Time of Travel... 4 Flow Boundaries... 4 Delineation
TNC Fisher Slough Final Design and Permitting Subject: Internal Memorandum for Levee Design Groundwater Mounding
 TNC Fisher Slough Final Design and Permitting Subject: Internal Memorandum for Levee Design Groundwater Mounding To: From: Internal Memo for Record David Cline (Tetra Tech) Date: Dec. 16, 2009 Introduction
Gravity driven dewatering systems for landfill expansion
 Waste Management and the Environment IV 183 Gravity driven dewatering systems for landfill expansion S. A. Smith. & J. A. Smyth Richardson Smith Gardner and Associates, Inc, USA Abstract A landfill site
Continuous Simulation Modeling of Stormwater Ponds, Lakes, & Wetlands: A BUILT-IN APPLICATION OF PONDS 3.2
 Continuous Simulation Modeling of Stormwater Ponds, Lakes, & Wetlands: A BUILT-IN APPLICATION OF PONDS 3.2 PRESENTED AT THE SFWMD WORKSHOP PRE-DEVELOPMENT VERSUS POST DEVELOPMENT RUNOFF VOLUME ANALYSIS
Professional Paper SJ2001-PP3 PROJECTED 2020 AQUIFER DRAWDOWNS AT THE CITY OF VERO BEACH AND INDIAN RIVER COUNTY WELLFIELDS. David Toth, Ph.D., P.G.
 Professional Paper SJ2001-PP3 PRJECTED 2020 AQUIFER DRAWDWNS AT THE CITY F VER BEACH AND INDIAN RIVER CUNTY WELLFIELDS by David Toth, Ph.D., P.G. Davi{pf. Toth Professional Geologist License No. PG110
Song Lake Water Budget
 Song Lake Water Budget Song Lake is located in northern Cortland County. It is a relatively small lake, with a surface area of about 115 acres, and an average depth of about 14 feet. Its maximum depth
Assessment of the Groundwater Quantity Resulting from Artificial Recharge by Ponds at Ban Nong Na, Phitsanulok Province, Thailand
 Research article erd Assessment of the Groundwater Quantity Resulting from Artificial Recharge by Ponds at Ban Nong Na, Phitsanulok Province, Thailand SIRIRAT UPPASIT* Faculty of Technology, Khon Kaen
CHAPTER 7 GROUNDWATER FLOW MODELING
 148 CHAPTER 7 GROUNDWATER FLOW MODELING 7.1 GENERAL In reality, it is not possible to see into the sub-surface and observe the geological structure and the groundwater flow processes. It is for this reason
Results of Morris Bridge Sink Pumping Test Hillsborough County, Florida Final Report
 Results of Morris Bridge Sink Pumping Test Hillsborough County, Florida Final Report Hydrologic Evaluation Section Southwest Florida Water Management District January 2010 Results of Morris Bridge Sink
GEOTECHNICAL INVESTIGATION & ASSESSMENT TO ESTIMATE AQUIFER PARAMETERS
 GEOTECHNICAL INVESTIGATION & ASSESSMENT TO ESTIMATE AQUIFER PARAMETERS SJRWMD PONDS WORKSHOP! Note the word is estimate & not determine! Must appreciate the physical meaning of each aquifer parameter!
WELLHEAD PROTECTION DELINEATION REPORT FOR THE VILLAGE OF BEAR LAKE DECEMBER 2002
 WELLHEAD PROTECTION DELINEATION REPORT FOR THE VILLAGE OF BEAR LAKE DECEMBER 2002 Prepared by: Gosling Czubak Engineering Sciences, Inc. 1280 Business Park Drive Traverse City, Michigan 48686 Telephone:
Memorandum. Introduction. Carl Einberger Joe Morrice. Figures 1 through 7
 Memorandum TO: Michelle Halley, NWF DATE: October 9, 2007 FROM: Carl Einberger Joe Morrice PROJ. NO.: 9885.000 CC: Project File PROJ. NAME: National Wildlife Federation ATTACHMENTS: Tables 1 through 6
Stormwater Retention Pond Recovery Analysis
 Stormwater Retention Pond Recovery Analysis By Nicolas E Andreyev The first in a series of courses on Green Drainage Design www.suncam.com Page 1 of 33 Forward To design a stormwater retention pond, one
PREDEVELOPMENT VERSUS POSTDEVELOPMENT VOLUME ANALYSIS: An Application of Continuous Simulation Modeling using PONDS Version 3 Software
 PREDEVELOPMENT VERSUS POSTDEVELOPMENT VOLUME ANALYSIS: An Application of Continuous Simulation Modeling using PONDS Version 3 Software PRESENTATION TO: SOUTH FLORIDA WATER MANAGEMENT DISTRICT RFP No. C-8501
ENGINEERING HYDROLOGY
 ENGINEERING HYDROLOGY Prof. Rajesh Bhagat Asst. Professor Civil Engineering Department Yeshwantrao Chavan College Of Engineering Nagpur B. E. (Civil Engg.) M. Tech. (Enviro. Engg.) GCOE, Amravati VNIT,
4. Groundwater Resources
 4. Groundwater Resources 4-1 Majority (97 %) of unfrozen fresh water on earth exists as groundwater. In comparison to surface water, - groundwater is available all year around - groundwater is mostly invisible
ORLANDO SANFORD INTERNATIONAL AIRPORT OUTPARCEL 1 SANFORD, FLORIDA
 PRELIMINARY GEOTECHNICAL STUDY ORLANDO SANFORD INTERNATIONAL AIRPORT OUTPARCEL 1 SANFORD, FLORIDA November 9, 2015 Prepared For: Ms. Diane H. Crews, A.A.E. Sanford Airport Authority 1200 Red Cleveland
Water Management Under Severe Storm Conditions in Central and South Florida
 Water Management Under Severe Storm Conditions in Central and South Florida Chandra S. S. Pathak, Ph.D., P.E. Severe Storm Prediction and Global Climate Impact in the Gulf Coast Conference October 29 to
Report of Preliminary Geotechnical Engineering Investigation for Ponds
 Report of Preliminary Geotechnical Engineering Investigation for Ponds Segment 2: State Road 400 (SR 400)/Interstate 4 (I-4) from West of SR 528 (Beachline Expressway) to West of SR 435 (Kirkman Road)
Water Resources Management: Vulnerability of Coastal Aquifers to Climate Change & Human Effects.
 Water Resources Management: Vulnerability of Coastal Aquifers to Climate Change & Human Effects. Water Resources of The Bahamas College of the Bahamas Lecture (Oct-2011) John A. Bowleg Engineer / Hydrologist
Tree Hill Nature Center. Tree Hill Nature Center Geothermal Heating & Cooling System
 Tree Hill Nature Center Geothermal Heating & Cooling System Kevin R. Hayes, M.S., P.G. City of Jacksonville, Environmental Quality Division Mark C. Mummaw Tree Hill Nature Center EPB/UNF Environmental
Comparison between Neuman (1975) and Jacob (1946) application for analysing pumping test data of unconfined aquifer
 and Jacob (1946) application for analysing pumping test data of unconfined aquifer") Comparison between Neuman (1975) and Jacob (1946) application for analysing pumping test data of unconfined aquifer Dana Mawlood 1*, Jwan Mustafa 2 1 Civil Engineering Department, College of Engineering,
Comparison between Neuman (1975) and Jacob (1946) application for analysing pumping test data of unconfined aquifer Dana Mawlood 1*, Jwan Mustafa 2 1 Civil Engineering Department, College of Engineering,
OPTIMIZED REMEDIAL GROUNDWATER EXTRACTION USING LINEAR PROGRAMMING
 John J. Q U ~ M EAD 9 Argonne, IL 6439 Tel.: 78-252-5357, Fax: 78-252-3611 OPTIMIZED REMEDIAL GROUNDWATER EXTRACTION USING LINEAR PROGRAMMING ABSTRACT Groundwater extraction systems are typically installed
AQUIFER STORAGE AND RECOVERY EVALUATION REPORT
 AQUIFER STORAGE AND RECOVERY EVALUATION REPORT Prepared for: CLALLAM COUNTY 228 East 4 th Street, Port Angeles, WA 98362 Prepared by: 12100 NE 195 th Street, Suite 200, Bothell, WA 99011 July 2003 TABLE
Novel Modeling Approach to Understand the Fate of Infiltrated Water at Green Stormwater Infrastructure in Philadelphia, PA
 Novel Modeling Approach to Understand the Fate of Infiltrated Water at Green Stormwater Infrastructure in Philadelphia, PA Matt Gamache 1*, Daniel O Rourke 2, and Mark Maimone 3 1 CDM Smith, Boston, Massachusetts
General Groundwater Concepts
 General Groundwater Concepts Hydrologic Cycle All water on the surface of the earth and underground are part of the hydrologic cycle (Figure 1), driven by natural processes that constantly transform water
University of Arizona Department of Hydrology and Water Resources Dr. Marek Zreda
 University of Arizona Department of Hydrology and Water Resources Dr. Marek Zreda HWR431/531 - Hydrogeology Final exam - 12 May 1997 Open books and notes The test contains 8 problems on 7 pages. Read the
Technical Publication SJ 91-4 COMPUTER SIMULATION OF THE PREDEVELOPMENT AND CURRENT FLORIDAN AQUIFER SYSTEM IN NORTHEAST FLORIDA
 Technical Publication SJ 91-4 COMPUTER SIMULATION OF THE PREDEVELOPMENT AND CURRENT FLORIDAN AQUIFER SYSTEM IN NORTHEAST FLORIDA By Douglas W. Durden Louis H. Motz St. Johns River Water Management District
within the Southwest Florida Water Management District
 within the Southwest Florida Water Management District Aquifer Characteristics Revised May 2009 Prepared by the Division of Resource Regulation of the Southwest Florida Water Management District Fifth
SEES 503 SUSTAINABLE WATER RESOURCES GROUNDWATER. Instructor. Assist. Prof. Dr. Bertuğ Akıntuğ
 SEES 503 SUSTAINABLE WATER RESOURCES GROUNDWATER Instructor Assist. Prof. Dr. Bertuğ Akıntuğ Civil Engineering Program Middle East Technical University Northern Cyprus Campus SEES 503 Sustainable Water
2016 ANNUAL ICR AND TRR WELL FIELD REPORT ICR WATER USERS ASSOCIATION
 2016 ANNUAL ICR AND TRR WELL FIELD REPORT Prepared for ICR WATER USERS ASSOCIATION Prepared By William Meyer 1 2016 ANNUAL ICR AND TRR WELL FIELD REPORT PURPOSE OF THE REPORT This report is one of an annual
4.4 MODEL CODE DESCRIPTION 4.5 WATER SOURCES AND SINKS 4.6 MODEL DOMAIN AND BOUNDARIES. SLR South Africa
 Page 4-18 The developed model should therefore be seen as an initial site model which should be refined and recalibrated once more groundwater monitoring and other data become available. 4.4 MODEL CODE
Surface Water and Seawater Interactions in the Coastal Environment of Biscayne Bay, Southeast Florida
 Surface Water and Seawater Interactions in the Coastal Environment of Biscayne Bay, Southeast Florida William C. Hutchings, MS, PG Nicholas Albergo, PE, DEE Paper No. 191-8 2005 Salt Lake City Annual Meeting
San Mateo Plain Groundwater Basin Assessment Stakeholder Workshop #8 17 APRIL 2018
 San Mateo Plain Groundwater Basin Assessment Stakeholder Workshop #8 17 APRIL 2018 PRESENTATION OVERVIEW Introductions Project Overview Summary of Analysis Supporting Model Development Model Development
A Partially Penetrating Seepage Barrier between Everglades National Park and the L-31N Canal
 A Partially Penetrating Seepage Barrier between Everglades National Park and the L-31N Canal Everglades National Park Seepage Control The increase in water level and sheetflow in Everglades National Park
Potential effects evaluation of dewatering an underground mine on surface water and groundwater located in a rural area
 Potential effects evaluation of dewatering an underground mine on surface water and groundwater located in a rural area ITRODUCTIO Michel Mailloux* Eng. M.Sc, Vincent Boisvert, M.Sc, Denis Millette, Eng.,
San Antonio Water System Mitchell Lake Constructed Wetlands Below the Dam Preliminary Hydrologic Analysis
 San Antonio Water System enhancement. This recommendation was based on limited water quality data provided by SAWS and using a free-water surface constructed wetland with approximately 112 acres of wetted
Investigation of a Floodplain Pond to Improve Alluvial Aquifer Sustainability: A Quantity and Quality Report
 Investigation of a Floodplain Pond to Improve Alluvial Aquifer Sustainability: A Quantity and Quality Report Water Resources Investigation Report 16 i P a g e Investigation of a Floodplain Pond to Improve
ORLANDO SANFORD INTERNATIONAL AIRPORT OUTPARCEL 6 SANFORD, FLORIDA
 PRELIMINARY GEOTECHNICAL STUDY ORLANDO SANFORD INTERNATIONAL AIRPORT OUTPARCEL 6 SANFORD, FLORIDA November 9, 2015 Prepared For: Ms. Diane H. Crews, A.A.E. Sanford Airport Authority 1200 Red Cleveland
B.2 HYDRAULICS B.2.3 HYDROLOGIC MODEL CALIBRATION AND VERIFICATION
 FINAL January 2004 COMPREHENSIVE EVERGLADES RESTORATION PLAN CENTRAL AND SOUTHERN FLORIDA PROJECT B.2 B.2.3 HYDROLOGIC MODEL CALIBRATION AND VERIFICATION EVERGLADES AGRICULTURAL AREA STORAGE RESERVOIRS
Appendix 4-2. Groundwater Modeling
 Appendix 4-2. Groundwater Modeling 1.0 Introduction For the WRWSA s 2010 Water Supply Plan, The SWFWMD and SJRWMD used regional groundwater flow models to assess the quantity of groundwater that could
Florida Department of Environmental Protection. Bureau of Mining and Minerals Regulation. Regulation of Mines. Howard J. Hayes, Program Administrator
 Florida Department of Environmental Protection Bureau of Mining and Minerals Regulation Regulation of Mines Howard J. Hayes, Program Administrator April 2011 What is a mine? Nonphosphate mine: Subsections
In support of an alternative water supply
 FWRJ Stormwater Harvesting for Alternative Water Supply in Volusia County Lena Rivera, Lee P. Wiseman, Scott Mays, and George Recktenwald In support of an alternative water supply plan for Volusia County
Groundwater Modeling Guidance
 Groundwater Modeling Guidance Richard J. Mandle Groundwater Modeling Program Michigan Department of Environmental Quality Draft 1.0 10/16/02 Executive Summary The use of groundwater models is prevalent
Groundwater Recharge from Agricultural Areas in the Flatwoods Region of South Florida 1
 ABE 370 Groundwater Recharge from Agricultural Areas in the Flatwoods Region of South Florida 1 Sanjay Shukla and Fouad H. Jaber 2 Introduction Groundwater provides freshwater for drinking, agricultural
Water Supply in Coastal Georgia Meeting Water Demand Using Alternative Water Sources to the Upper Floridan Aquifer
 Water Supply in Coastal Georgia Meeting Water Demand Using Alternative Water Sources to the Upper Floridan Aquifer John Clarke U.S. Geological Survey Georgia Water Science Center U.S. Department of the
PONDS 3.2 TECHNICAL MEMO
 PONDS 3.2 TECHNICAL MEMO Date: December 7, 2007 Re: Using PONDS for Dewatering Analysis The following technical memo outlines the use of the PONDS 3.2 Refined Method software to perform a dewatering analysis
SOUTHEAST FLORIDA S RESILIENT WATER RESOURCES INCLUDING A CASE STUDY FOR THE CITY OF POMPANO BEACH
 SOUTHEAST FLORIDA S RESILIENT WATER RESOURCES INCLUDING A CASE STUDY FOR THE CITY OF POMPANO BEACH SOUTHEAST FLORIDA S WATER INFRASTRUCTURE IS VULNERABLE TO CLIMATE CHANGE THE WATER INFRASTRUCTURE IN FLORIDA
Regulation of Mines In South Florida
 Florida Department of Environmental Protection Bureau of Mining and Minerals Regulation Regulation of Mines In South Florida Howard J. Hayes, Program Administrator February 8, 2011 What is a mine? Nonphosphate
Lab 6 - Pumping Test. Pumping Test. Laboratory 6 HWR 431/
 Pumping Test Laboratory 6 HWR 431/531 7-1 Introduction: Aquifer tests are performed to evaluate the capacity of an aquifer to meet municipal or industrial water requirements. Hydraulic characteristics
Report of Preliminary Geotechnical Engineering Investigation for Ponds
 Report of Preliminary Geotechnical Engineering Investigation for Ponds Segment 3: State Road 400 (SR 400)/Interstate 4 (I-4) from One Mile East of SR 434 to East of SR 15-600/US 17-92 Seminole County (77160),
STORMWATER HARVESTING FOR ALTERNATIVE WATER SUPPLY IN VOLUSIA COUNTY, FLORIDA
 STORMWATER HARVESTING FOR ALTERNATIVE WATER SUPPLY IN VOLUSIA COUNTY, FLORIDA Lena Rivera, P.E., D.WRE (CDM); Lee P. Wiseman, P.E., BCEE (CDM); Scott Mays, P.E. (Volusia County); and George Recktenwald
Task 4.2 Technical Memorandum on Pumping Impacts on Squaw Creek
 Task 4.2 Technical Memorandum on Pumping Impacts on Squaw Creek Aquifer Test 1 Aquifer Test 2 Prepared for: Squaw Valley Public Service District April 2013 Prepared by: This page left intentionally blank
PART 1b. Section 7.2 of SJRWMD Special Publication SJ93-SP10
 PART 1b GEOTECHNICAL INVESTIGATION TO ESTIMATE AQUIFER PARAMETERS Note the word is estimate & not determine. Must appreciate the physical meaning of each aquifer parameter. Aquifer, in this sense, does
MEMORANDUM. RAI Responses Related to East Lake Road Wellfield Drawdown Analysis, WUP No SDI Project No. PCF-180.
 SDI Environmental Services, Inc. 13911 N. Dale Mabry Hwy. Suite 201, Tampa, FL 33618; (813) 961-1935 MEMORANDUM TO: FROM: SUBJECT: Dave Slonena, P.G., Pinellas County Cathleen Beaudoin Jonas RAI Responses
Hydrogeology 101 3/7/2011
 Hydrogeology 101 W. Richard Laton, Ph.D., PG, CPG Associate Professor of Hydrogeology California State University, Fullerton Department of Geological Sciences 1 Hydrogeology 101 The objective is to obtain
Ground Water Issues of the South Platte River Basin. Presented by: James L. Jehn, C.P.G. Jehn Water Consultants, Inc.
 Ground Water Issues of the South Platte River Basin Presented by: James L. Jehn, C.P.G. Jehn Water Consultants, Inc. Ground Water Wells South Platte Alluvial Wells Approx. 10,000 Alluvial Wells in the
High-Resolution Groundwater Models for the Assessment of Riparian Restoration Options and River Conveyance Efficiency
 High-Resolution Groundwater Models for the Assessment of Riparian Restoration Options and River Conveyance Efficiency Karen L. MacClune 1, Gilbert Barth 1, Nabil Shafike 2, Deborah Hathaway 1 1 S. S. Papadopulos
Bioreactor Landfill Design
 Bioreactor Landfill Design Timothy Townsend, PhD, PE Department of Environmental Engineering Sciences University of Florida ttown@ufl.edu Bioreactor Landfill Design Modern landfill design entails many
Movement and Storage of Groundwater The Hydrosphere
 Movement and Storage of Groundwater The Hydrosphere The water on and in Earth s crust makes up the hydrosphere. About 97 percent of the hydrosphere is contained in the oceans. The water contained by landmasses
Sixth Semester B. E. (R)/ First Semester B. E. (PTDP) Civil Engineering Examination
/ First Semester B. E. (PTDP) Civil Engineering Examination") CAB/2KTF/EET 1221/1413 Sixth Semester B. E. (R)/ First Semester B. E. (PTDP) Civil Engineering Examination Course Code : CV 312 / CV 507 Course Name : Engineering Hydrology Time : 3 Hours ] [ Max. Marks
CAB/2KTF/EET 1221/1413 Sixth Semester B. E. (R)/ First Semester B. E. (PTDP) Civil Engineering Examination Course Code : CV 312 / CV 507 Course Name : Engineering Hydrology Time : 3 Hours ] [ Max. Marks
Modeling the Contamination of an Aquifer from a Highway Salt Storage Facility
 First International Conference on Saltwater Intrusion and Coastal Aquifers Monitoring, Modeling, and Management. Essaouira, Morocco, April 23 25, 01 Modeling the Contamination of an Aquifer from a Highway
LAKE COUNTY HYDROLOGY DESIGN STANDARDS
 LAKE COUNTY HYDROLOGY DESIGN STANDARDS Lake County Department of Public Works Water Resources Division 255 N. Forbes Street Lakeport, CA 95453 (707)263-2341 Adopted June 22, 1999 These Standards provide
Predicting Groundwater Sustainability: What Tools, Models and Data are Available?
 Predicting Groundwater Sustainability: What Tools, Models and Data are Available? Ray Wuolo Barr Engineering Company Assessing Sustainability is All About: Predicting (or describing) how potentiometric
PEACE RIVER MANASOTA REGIONAL WATER SUPPLY AUTHORITY BOARD OF DIRECTORS MEETING December 5, 2018 ROUTINE STATUS REPORTS ITEM 1
 PEACE RIVER MANASOTA REGIONAL WATER SUPPLY AUTHORITY BOARD OF DIRECTORS MEETING December 5, 218 ROUTINE STATUS REPORTS ITEM 1 Hydrologic Conditions Report MEMORANDUM Project: Hydrologic Conditions Report
SOURCES OF WATER SUPPLY GROUND WATER HYDRAULICS
 SOURCES OF WATER SUPPLY GROUND WATER HYDRAULICS, Zerihun Alemayehu GROUNDWATER Groundwater takes 0.6% of the total water in the hydrosphere 0.31% of the total water in the hydrosphere has depth less than
OUTLINE OF PRESENTATION
 GROUNDWATER?? OUTLINE OF PRESENTATION What is groundwater? Geologic investigation Definitions: aquifer and aquitard, unconfined and semi-confined Water level and interpretation of water level data Well
Deep River-Portage Burns Waterway Watershed 2015
 2.4 Soils Soil development is the product of the interaction of parent material, topography, climate, organisms and time. Understanding the types of soils that exist within a watershed and their characteristics
Evaluation of Cutoff Walls Impact on Groundwater Recharge (Kleinfelder)
") C3 Evaluation of Cutoff Walls Impact on Groundwater Recharge (Kleinfelder) December 19, 2007 Revised April 21, 2009 File No.: 72834 Mr. Timothy Washburn SAFCA 1007 7th Street, 7th Floor Sacramento, CA
C3 Evaluation of Cutoff Walls Impact on Groundwater Recharge (Kleinfelder) December 19, 2007 Revised April 21, 2009 File No.: 72834 Mr. Timothy Washburn SAFCA 1007 7th Street, 7th Floor Sacramento, CA
J. Wetstein and V. Hasfurther Conference Proceedings WWRC
 RESPONSE OF A SURFACE AQUIFER TO FLOOD IRRIGATION J. Wetstein and V. Hasfurther 1989 Conference Proceedings WWRC- 8 9-32 In Proceedings of the Specialty Conference Sponsored by the Irrigation and Drainage
GROUND WATER/SURFACE WATER INTERACTIONS AWRA SUMMER SPECIALTY CONFERENCE Judith Schenk'
 July 1-3 GROUND WATER/SURFACE WATER INTERACTIONS AWRA SUMMER SPECIALTY CONFERENCE 2002 326x6 pjf= INTEGRATION OF DATA USING GIS AND STATEPP TO ESTIMATE GROUNDWATER MODEL INPUT PARAMETERS Judith Schenk'
7.0 GROUNDWATER AND STABILIZER TRANSPORT MODELING
 7.0 GROUNDWATER AND STABILIZER TRANSPORT MODELING 7.1 Introduction The concept of passive site remediation is the slow injection of stabilizing materials at the up gradient edge of a site and delivery
Black Butte Copper Project Mine Operating Permit Application (Revision 3) Evaluation of Open Access Ramps and Ventilation Raises in Closure
 Evaluation of Open Access Ramps and Ventilation Raises in Closure") Black Butte Copper Project Mine Operating Permit Application (Revision 3) APPENDIX M-3: Evaluation of Open Access Ramps and Ventilation Raises in Closure Tintina Montana, Inc. July 2017 Hydrometrics, Inc.
Black Butte Copper Project Mine Operating Permit Application (Revision 3) APPENDIX M-3: Evaluation of Open Access Ramps and Ventilation Raises in Closure Tintina Montana, Inc. July 2017 Hydrometrics, Inc.
Groundwater 3/16/2010. GG22A: GEOSPHERE & HYDROSPHERE Hydrology
 GG22A: GEOSPHERE & HYDROSPHERE Hydrology Definitions Groundwater Subsurface water in soil or rock that is fully saturated. Aquifer Contains enough saturated material to yield significant quantities of
Aquifer Characterization and Drought Assessment Ocheyedan River Alluvial Aquifer
 Aquifer Characterization and Drought Assessment Ocheyedan River Alluvial Aquifer Iowa Geological Survey Water Resources Investigation Report 10 Aquifer Characterization and Drought Assessment Ocheyedan
Occurrence of Iron in Surface Waters of the Upper St. Johns River Basin
 Occurrence of Iron in Surface Waters of the Upper St. Johns River Basin Prepared by Florida Department of Environmental Protection Bureau of Watershed Management Ground Water Protection Section December
Numerical Groundwater Model for the Kaweah Delta Water Conservation District
 Numerical Groundwater Model for the Kaweah Delta Water Conservation District Nels Ruud and Peter Leffler Fugro West, Inc. Larry Dotson Kaweah Delta Water Conservation District Presentation Outline Background
Estimating the Seasonal High Water Table: A Mix of Art & Science
 Estimating the Seasonal High Water Table: A Mix of Art & Science PONDS WORKSHOP - SJRWMD Devo Seereeram, Ph.D., P.E. This paper was originally written over 4 years ago & generated a lot of interest. The
C-111 SPREADER CANAL Western Project and Design Test
 C-111 SPREADER CANAL Western Project and Design Test Integration of Science and Engineering into Innovative Ecosystem Restoration Concepts National Conference on Ecosystem Restoration August 2011 Ray Wimbrough
PART 2D. Section 7.2 of SJRWMD Special Publication SJ93-SP10
 PART 2D GEOTECHNICAL INVESTIGATION TO ESTIMATE AQUIFER PARAMETERS Note the word is estimate & not determine. Must appreciate the physical meaning of each aquifer parameter. Aquifer, in this sense, does
HYDROGEOLOGY OF THE HUMBOLDT RIVER BASIN, IMPACTS OF OPEN-PIT MINE DEWATERING AND PIT LAKE FORMATION
 HYDROGEOLOGY OF THE HUMBOLDT RIVER BASIN, IMPACTS OF OPEN-PIT MINE DEWATERING AND PIT LAKE FORMATION June, 2015 Tom Myers, Ph.D., Hydrologic Consultant, Reno NV tom_myers@charter.net Prepared for: Progressive
DRAFT. APPENDIX F Groundwater Flow Model Proposed El Segundo Desalination Facility
 APPENDIX F Proposed El Segundo Desalination Facility Proposed El Segundo Desalination Facility 1. GROUNDWATER FLOW MODEL Based on review of offshore and onshore hydrogeologic data including the Summer
Names: ESS 315. Lab #6, Floods and Runoff Part I Flood frequency
 Names: ESS 315 Lab #6, Floods and Runoff Part I Flood frequency A flood is any relatively high flow of water over land that is not normally under water. Floods occur at streams and rivers but can also
Hydrologic Cycle. Rain Shadow:
 Hydrologic Cycle The cyclical movement of water from the ocean to the atmosphere by evaporation, to the surface through precipitation, to streams through runoff and groundwater, and back to the ocean.
POROSITY, SPECIFIC YIELD & SPECIFIC RETENTION. Physical properties of
 POROSITY, SPECIFIC YIELD & SPECIFIC RETENTION Porosity is the the ratio of the voids to the total volume of an unconsolidated or consolidated material. Physical properties of n = porosity as a decimal
Numerical Modeling of Groundwater Flow in the Navajo Sandstone Aquifer at the Tuba City, Arizona, Disposal Site 15167
 Numerical Modeling of Groundwater Flow in the Navajo Sandstone Aquifer at the Tuba City, Arizona, Disposal Site 15167 ABSTRACT Richard Bush*, Timothy Bartlett** *US DOE, Office of Legacy Management **Stoller
August 15, 2006 (Revised) July 3, 2006 Project No A
 July 3, 2006 Project No A") August 15, 2006 (Revised) July 3, 2006 Project No. 01-05-0854-101A Mr. David Reed, P.E. Protean Design Group 100 East Pine Street, Suite 306 Orlando, Florida 32801 Preliminary Soil Survey Report Polk Parkway
August 15, 2006 (Revised) July 3, 2006 Project No. 01-05-0854-101A Mr. David Reed, P.E. Protean Design Group 100 East Pine Street, Suite 306 Orlando, Florida 32801 Preliminary Soil Survey Report Polk Parkway
Chippewa County Groundwater Study 3 rd Public outreach meeting
 Chippewa County Groundwater Study 3 rd Public outreach meeting Today s outline Brief review of hydrogeology (USGS) Brief overview of the groundwater study (WGNHS) Subsurface data collection and hydrostratigraphy
Illinois State Water Survey Division
 Illinois State Water Survey Division GROUND-WATER SECTION SWS Contract Report 456 SUMMARY REPORT: REGIONAL ASSESSMENT OF THE GROUND-WATER RESOURCES IN EASTERN KANKAKEE AND NORTHERN IROQUOIS COUNTIES by
Report on Effects of Groundwater Withdrawal from the Doghouse Meadow, Yosemite National Park
 Report on Effects of Groundwater Withdrawal from the Doghouse Meadow, Yosemite National Park William E. Sanford Department of Geosciences Colorado State University 03 March 2006 1 Purpose The purpose of
Numerical Modeling of Groundwater Flow in Karst Aquifer, Makeng Mining Area
 American Journal of Environmental Sciences 6 (1): 78-82, 2010 ISSN 1553-345X 2010 Science Publications Numerical Modeling of Groundwater Flow in Karst Aquifer, Makeng Mining Area 1,2 F.M. Rani and 1 Z.H.
 5. MODEL DESCRIPTION Several models were used in combination to estimate the impacts of the proposed 100,000 acre-ft dryyear yield program. MODFLOW and MODPATH were used to estimate the groundwater and