Power System Economics and Market Modeling
|
|
|
- Clarence Rich
- 6 years ago
- Views:
Transcription
1 Power System Economics and Market Modeling 2001 South First Street Champaign, Illinois (217)
2 PowerWorld Simulator OPF and Locational Marginal Prices This Section will: Provide background on Optimal Power Flow (OPF) Problem Show how OPF is implemented in PowerWorld Simulator OPF Demonstrate how Simulator OPF can be used to solve small and large problems Provide hands on Simulator OPF examples Talk about splitting the cost at a bus into Energy, Losses, and Congestion Demonstrate OPF results/visualization on a large system 2
3 Optimal Power Flow Overview The goal of an optimal power flow (OPF) is to determine the best way to instantaneously operate a power system. Usually best = minimizing operating cost. OPF considers the impact of the transmission system We ll introduce OPF initially ignoring the transmission system 3
4 Ideal Power Market No Transmission System Constraints Ideal power market is analogous to a lake. Generators supply energy to lake and loads remove energy. Ideal power market has no transmission constraints Single marginal cost associated with enforcing the constraint that supply = demand buy from the least cost unit that is not at a limit this price is the marginal cost 4
5 Two Bus Example Total Hourly Cost : 8459 $/hr Area Lambda : Bus A Bus B MW MW MW AGC ON AGC ON MW 5
6 Market Marginal Cost is Determined from Net Gen Costs Below are graphs associated with this two bus system. The graph on the left shows the marginal cost for each of the generators. The graph on the right shows the system supply curve, assuming the system is optimally dispatched Generator Power (MW) Total Area Generation (MW) Current generator operating point 6
7 Variation in Marginal Cost for Northeast U.S. Marginal Cost ($ / MWh) For each value of generation there is a single, systemwide marginal cost Total Generation (GW) 7
8 Real Power Market Different operating regions impose constraints total demand in region must equal total supply Transmission system imposes constraints on the market Marginal costs become localized Requires solution by an optimal power flow 8
9 Optimal Power Flow (OPF) Minimize cost function, such as operating cost, taking into account realistic equality and inequality constraints Equality constraints Bus real and reactive power balance Generator voltage setpoints Area MW interchange Transmission line/transformer/interface flow limits 9
10 Optimal Power Flow (OPF) Inequality constraints Transmission line/transformer/interface flow limits Generator MW limits Generator reactive power capability curves Bus voltage magnitudes (not yet implemented in Simulator OPF) Available Controls Generator MW outputs Load MW demands Phase shifters Area Transactions 10
11 OPF Solution Methods Non linear approach using Newton s method Handles marginal losses well, but is relatively slow and has problems determining binding constraints Linear Programming (LP) Fast and efficient in determining binding constraints, but has difficulty with marginal losses 11
12 Primal LP OPF Solution Algorithm Solution iterates between Solving a full ac power flow solution Enforces real/reactive power balance at each bus Enforces generator reactive limits System controls are assumed fixed Takes into account non linearities solving a primal LP Changes system controls to enforce linearized constraints while minimizing cost (or control change) 12
13 LP Solution Problem is setup to be initially feasible through the use of slack variables Slack variables have high marginal costs; LP algorithm will remove them if at all possible Slack variables are used to enforce Area/super area MW constraints MVA line/transformer constraints MW interface constraints 13
14 Two Bus Example No Constraints With no overloads the OPF matches the economic dispatch Bus A Total Hourly Cost : 8459 $/hr Area Lambda : Transmission line is not overloaded $/MWh Bus B $/MWh MW MW MW AGC ON AGC ON MW Marginal cost of supplying power to each bus (locational marginal costs) 14
15 Two Bus Example with Constrained Line Total Hourly Cost : 9513 $/hr Area Lambda : Bus A $/MWh Bus B $/MWh MW MW MW AGC ON AGC ON MW With the line loaded to its limit, additional load at Bus A must be supplied locally, causing the marginal costs to diverge. 15
16 Hands on: Three Bus Case Load B3LP case. In Run Mode go to the Add Ons ribbon tab. In the Optimal Power Flow ribbon group select Primal LP to solve the case. (Initially line limits are not enforced.) 60 MW 60 MW Bus 2 Bus $/MWh 0 MW 0 MW Total Cost 1800 $/hr $/MWh 60 MW 60 MW Bus 3 0 MW 120% 120 MW 120 MW $/MWh 180 MW 120% 180 MW Line from Bus 1 to Bus 3 is overloaded; all buses have same marginal cost 16
17 Hands on: Three Bus Case To enforce line limits: From the OPF ribbon group, Select OPF Options and Results to view the main options dialog Select Constraint Options Tab Remove the check in Disable Line/ Transformer MVA Limit Enforcement Click Solve LP OPF 17
18 Three Bus (B3) Example Consider a three bus case (bus 1 is system slack), with all buses connected through 0.1 pu reactance lines, each with a 100 MVA limit Let the generator marginal costs be Bus 1: 10 $ / MWhr; Range = 0 to 400 MW Bus 2: 12 $ / MWhr; Range = 0 to 400 MW Bus 3: 20 $ / MWhr; Range = 0 to 400 MW Assume a single 180 MW load at bus 3 18
19 Solving the LP OPF All LP OPF commands are accessed from the LP OPF menu item. Before solving, we first need to specify what constraints to enforce Select OPF Case Info OPF Areas to turn on area constraint; set AGC Status to OPF Initially we ll disable line MVA enforcement Select OPF Case Info Options and Results and go to the Constraint Options tab Check Disable Line/Transformer MVA Limit Enforcement 19
20 B3 with Line Limits NOT Enforced 60 MW 60 MW Bus 2 Bus $/MWh 0 MW 0 MW Total Cost 1800 $/hr $/MWh 60 MW 60 MW Bus 3 0 MW 120% 120 MW 180 MW 120 MW 120% $/MWh 180 MW Line from Bus 1 to Bus 3 is overloaded; all buses have same marginal cost 20
21 Line Limit Enforcement Previous LP tableau was PG1 PG2 PG3 S1 b Line limit tableau is PG1 PG2 PG3 S1 S2 b First row is from enforcing area constraint Second row is from enforcing the line flow MVA constraint 21
22 B3 with Line Limits Enforced 20 MW 20 MW Bus 2 Bus $/MWh 60 MW 0 MW Total Cost 1921 $/hr $/MWh 80 MW 80 MW Bus 3 0 MW 100 MW 80% 100% 80% 100% 100 MW $/MWh 180 MW 120 MW LP OPF redispatches to remove violation. Bus marginal costs are now different. 22
23 Verify Bus 3 Marginal Cost 19 MW 19 MW Bus 2 Bus $/MWh 62 MW 0 MW Total Cost 1935 $/hr $/MWh 81 MW 81 MW Bus 3 0 MW 100 MW 81% 100% 81% 100% 100 MW $/MWh 181 MW 119 MW One additional MW of load at bus 3 raised total cost by 14 $/hr, as G2 went up by 2 MW and G1 went down by 1MW 23
24 Why is bus 3 LMP = $14 /MWh All lines have equal impedance. Power flow in a simple network distributes inversely to impedance of path. For bus 1 to supply 1 MW to bus 3, 2/3 MW would take direct path from 1 to 3, while 1/3 MW would loop around from 1 to 2 to 3. Likewise, for bus 2 to supply 1 MW to bus 3, 2/3 MW would go from 2 to 3, while 1/3 MW would go from 2 to 1 to 3. 24
25 Why is bus 3 LMP = $ 14 / MWh? With the line from 1 to 3 limited, no additional power flows are allowed on it. To supply 1 more MW to bus 3 we need Pg1 + Pg2 = 1 MW 2/3 Pg1 + 1/3 Pg2 = 0; (no more flow on 1 3) Solving requires we up Pg2 by 2 MW and drop Pg1 by 1 MW a net increase of $14. 25
26 Marginal Cost of Enforcing Constraints Similarly to the bus marginal cost, you can also calculate the marginal cost of enforcing a line constraint For a transmission line, this represents the amount of system savings which could be achieved if the MVA rating was increased by 1.0 MVA. 26

27 MVA Marginal Cost Choose OPF Case Info OPF Lines and Transformers to bring up the OPF Constraint Records dialog Look at the column MVA Marginal Cost 27
28 Why is MVA Marginal Cost $6/MVAhr If we allow 1 more MVA to flow on the line from 1 to 3, then this allows us to redispatch as follows Pg1 + Pg2 = 0 MW 2/3 Pg1 + 1/3 Pg2 = 1; (no more flow on 1 3) Solving requires we drop Pg2 by 3 MW and increase Pg1 by 3 MW a net savings of $6 28
29 Both lines into Bus 3 Congested 0 MW 0 MW Bus 2 Bus $/MWh 100 MW 0 MW Total Cost 3201 $/hr $/MWh 100 MW 100 MW Bus 3 50 MW 100 MW 100% 100% 100% 100% 100 MW $/MWh 250 MW 100 MW For bus 3 loads above 200 MW, the load must be supplied locally. Then what if the bus 3 generator opens? 29
30 Case with G3 Opened Unenforceable Constraints 53 MW 53 MW Bus 2 Bus $/MWh 47 MW 0 MW Total Cost 2594 $/hr $/MWh 99 MW 99 MW Bus 3 0 MW 151 MW 100% 152% 99% 151% 151 MW $/MWh 250 MW 203 MW Both constraints cannot be enforced. One is unenforceable. Bus 3 marginal cost is arbitrary 30
31 Unenforceable Constraint Costs Is this solution Valid? Not really. If a constraint cannot be enforced due to insufficient controls, the slack variable associated with enforcing that constraint cannot be removed from the LP basis marginal cost depends upon the arbitrary cost of the slack variable this value is specified in the Maximum Violation Cost field on the LP OPF, Options dialog. 31
32 LP OPF Dialog, Options: Constraint Options Disables enforcement of Line constraints Enforcement tolerance deadband; needed because of system nonlinearities Previously binding line constraints with loadings above this value remain in tableau Similar fields for interfaces Cost of unenforceable line violations 32
33 Why report Unenforceable Violations Simulator tries its best to remove the line violations. High marginal prices will point you toward the line violations which are causing the system to be invalid. What should you do? Look for generators that are in/out of service near the constraint Look to see if it s a load or generator pocket without enough transmission Consider ignoring the line limit, or increasing its rating. 33
34 What does the Maximum Violation Cost for a Constraint represent? You can think of it as a penalty function The cost of violating the constraint is equal to 1000 $/hour for each MVA that the line is overloaded Therefore if Simulator s OPF determines that it would cost more to enforce the constraint, then it will just pay this cost and overload the constraint The penalty function would have the following form Penalty Cost ($/hour) Slope = 1000 $/MVAh Transmission Limit Violation Amount MVA 34
35 Specifying a Piece wise Limit Cost with the Limit Groups Each Limit Group can specify a piece wise limit cost which will then override the maximum violation cost specified in the OPF Go to the Tools ribbon tab and select the Limit Monitoring Settings button. Go to the Modify/Create Limit Groups tab Right click on your limit group and choose Show Dialog. On the right side of this dialog, you may define the limit cost This allows for a more complex penalty function as shown on next slide This allows the OPF to dispatch the amount of overload similar to a generator dispatch 35
36 Specifying a Piece wise Limit Cost with the Limit Groups Penalty Cost ($/hour) Slope = 1000 $/MWhr Slope = 10 $/MWhr Slope = 50 $/MWhr 100% of Limit 105% of Limit 110% of Limit Violation Amount MVA 36

37 OPF Line/Transformer MVA Constraints Display Line loadings Set to specify enforcement of individual lines Marginal costs are nonzero only for lines that are active constraints Indicates if line is unenforceable 37

38 LP OPF Dialog, Options: Common Options 38
39 LP OPF Dialog, Options: Common Options Objective Functions: Minimum Costs (includes generator costs and also load benefits if specified) Minimum Control Change (move the smallest amount of generation and/or load) LP Control Variables can be disabled globally Phase Shifters, Generator MW, Loads MW, Area Transactions, DC Line MW Maximum Number of LP Iterations Phase Shifter Cost ($/degree) The cost of moving the phase shifter. Normally this is zero (no cost) 39
40 LP OPF Dialog, Options: Common Options Calculate Bus Marginal Cost of Reactive Power Save Full OPF Results in PWB file Do Detailed Logging (i.e., each pivot) Start with Last Valid OPF Solution 40

41 LP OPF Dialog, Options: Control Options 41
42 LP OPF Dialog, Options: Control Options Fast Start Generators For generators with the column Fast Start set to YES, these check boxes determine if the generators are allowed to be turned on and/or off Modeling of OPF Areas/Super Areas During the Initial OPF Power Flow Solution At the start of an OPF solution, a solved power flow solution must be determined. Areas which are on OPF will use this. Participation Factor is recommended During Stand Alone Power Flow Solutions When solving a normal Power Flow Solution, this specifies how areas which are on OPF control will be solved. Participation Factor is recommended 42
43 LP OPF Dialog, Options: Control Options Modeling Generators Without Piecewise Linear Cost Curves Ignore Them (generators with cubic models are ignored) Change to Specified Points Per Curve Modify Total Points per Cost Curve as appropriate Change to Specified MWs per Segment Modify MWs per Cost Curve Segment Save Existing Piecewise Linear Cost Curves If unchecked then existing piecewise linear curves are overwritten 43
44 LP OPF Dialog, Options: Control Options Treat Area/Superarea MW Constraints as unenforceable even when the ACE is less than the AGC Tolerance Default is that this option is checked When checked, area/superarea constraints are unenforceable when the ACE is not zero When unchecked, area/superarea constraints are considered enforceable if the ACE is less than the AGC Tolerance 44
.")
45 Modeling Generator Costs Generator costs are modeled with either a cubic cost or piecewise linear cost function Cost model is specified on the generator dialog The LP OPF requires a piecewise linear model (It s called a linear program for a reason). Therefore any existing cubic models are automatically converted to piecewise linear before the solution, and then converted back afterward. 45
46 Comparison of Cubic and Piecewise Linear Marginal Cost Curves $ / MWh Generator Power (MW) Continuous generator marginal cost curve Generator Power (MW) Piecewise linear generator marginal cost curve with five segments This conversion may affect the final cost. Using more segments better approximates the original curve, but may take longer to solve
47 OPF Case Information Displays Several Case Information Displays exist for use with the OPF OPF Areas OPF Buses OPF DC Lines OPF Generators OPF Interfaces OPF Load Records OPF Lines and Transformers OPF Nomograms OPF Phase Shifters OPF Super Areas OPF Transactions OPF Zones To provide a good example of these displays, go to the Application Menu and choose Open Case and reopen the b7flatlp.pwb example case 47

48 OPF Area Records Display: Special Fields Controls Types that are available XF Phase specifies if phase shifters are available Load MW Dispatch specifies if load can be moved DC Line MW specifies if DC MW setpoint can be moved Constraint Types which should be enforced Branch MVA should branch limits be enforced Interface MW should interface limits be enforced (this will also apply to nomogram interfaces) Include Marg. Losses Specifies if marginal losses are used in the OPF 48
 Initial MW, Cost The output and cost at the start")
49 OPF Gen Records Display: Special Fields Fast Start Should the generator be available for being turned on/off by the OPF OPF MW Control (YES, NO, or If Agcable) Should the generator be made available for OPF dispatch IC for OPF The incremental cost of the generator used by the OPF (may be different than actual IC for cubic cost curve generators) Initial MW, Cost The output and cost at the start of the OPF solution Delta MW, Cost The change in the output and cost for the last OPF solution 49

50 OPF Super Area Records Display: Special Fields Control Types and Constraint Types continue to be governed by the settings by Area Include Marg. Losses must be specified with the Super Area AGC Status Remember that when a Super Area is set to an AGC status, this overrides the areas inside it. 50
51 Cost of Energy, Losses and Congestion Some ISO documents refer to the cost components of energy, losses, and congestion Go to the Add Ons ribbon tab and select OPF Case Info OPF Areas Toggle Include Marg. Losses column of each area to YES Choose OPF Case Info Primal LP to resolve. Now choose OPF Case Info OPF Options and Results Go to the Results Tab Go the the Bus MW Marginal Price Details subtab Here you will find columns for the MW Marg Cost, Energy, Congestion and Losses 51

52 Cost of Energy, Losses and Congestion The only value that is truly unique for an OPF solution is the total MW Marginal Cost k The cost of Energy, Losses, and Congestion are dependent on the reference for Energy and Losses k Ek Ck Lk 52
53 Cost of Energy, Loss, and Congestion Reference These references must be specified by the region being dispatched: either an area or super area This is for areas, so choose OPF Case Info OPF Areas Right click on Area Top and choose show Dialog Go to the OPF Tab and you will see a section of this dialog which is shown below. Similar settings can be found on the Super Area dialog 53
54 Cost of Energy The cost of energy at every bus in the area (or super area) is set to the same value n n n : marginal cost at bus n n N 1 L n Ek n :weighting factor at bus n n N n 1 L n L n : loss sensitivity at bus n The calculation of this value is based upon the specified reference Existing loss sensitivities directly: Cost of energy at every bus is equal to the cost of enforcing the area constraint for the area containing the bus, and the formula given above is not used Area s Bus Loads: Weighting factor is the load at each bus in the area Injection Group: Weighting factor is the participation factor of the points in the injection group Specific Bus: Weighting factor is 1 for the specified bus and zero for every other bus in the area The loss sensitivity at each bus is also determined from the same specified reference 54
55 Loss sensitivity must be calculated relative to the specified reference Existing loss sensitivities directly:the sensitivity contained in each bus Loss MW Sens field Area s Bus Loads or Injection Group: Simulator converts the loss sensitivities to a reference of having injections at each bus absorbed at a distributed set of buses defined by the Area s buses weighted by load, or the injection group buses Specific Bus: Simulator converts the loss sensitivities to a reference of having injections at each bus absorbed by the specific bus The cost of losses at each bus is then equal to the negative of the product of the loss sensitivity times the cost of energy. Cost of Losses ~ L Lk k Ek 55
56 Cost of Congestion The cost of congestion is simply the amount of the MW Marginal Cost which is leftover. Ck k Note: splitting this amount into pieces is completely dependent on how you choose the references Ek Lk 56

57 Example with Different References Go to the Area Dialog for Area TOP (1) Change the references for Area Top to use the Area s Bus Loads for the reference. Choose Add Ons Primal LP to resolve Compare results to previous ones and you will notice MW Marg. Cost has not changed Energy, Congestion, and Losses are all different 57
58 Super Areas Super areas are a record structure used to hold a set of areas By using super areas, a number of areas can be dispatched as though they were a single area For a super area to be used in the OPF, its AGC Status field must be OPF 58

59 Seven Bus Example Dispatched as Three Separate Areas Contour of Bus LMPs Average LMP = $ / MWh pu 1 49 MW 49 MW 1.04 pu 46 MW 46 MW 57 MW 57 MW 1.00 pu MW AGC ON 74 MW 73 MW $/hr 50 MW 150 MW AGC ON 0 MW 50 MW 25 MW 25 MW 1.04 pu 1.04 pu 6 25 MW 7 25 MW 250 MW 100% 40 MW 20 MVR 48 MW 0 MW 200 MW 0 MVR AGC ON 38 MW 48 MW Left Area Cost 4225 $/MWH 150 MW 40 MVR 38 MW Case Hourly Cost $/MWH Right Area Cost 4221 $/MWH 200 MW 7 MW 1.02 pu AGC ON 80 MW 30 MVR 107 MW AGC ON 1.00 pu 130 MW 40 MVR 200 MW 0 MVR 59

60 Seven Bus Case Dispatched as One Super Area Contour of Bus LMPs Average LMP = $ / MWh pu 1 49 MW 49 MW 1.04 pu 15 MW 15 MW 128 MW 129 MW 1.00 pu MW AGC ON 100% 98 MW 98 MW $/hr 26 MW 190 MW AGC ON 109 MW 25 MW 29 MW 29 MW 1.04 pu 1.04 pu 6 29 MW 7 29 MW 150 MW 100% 40 MW 20 MVR 7 MW 110 MW 200 MW 0 MVR AGC ON 15 MW 7 MW Left Area Cost 2493 $/MWH 150 MW 40 MVR 16 MW Case Hourly Cost $/MWH Right Area Cost 2389 $/MWH 116 MW 99% 58 MW 1.02 pu AGC ON 80 MW 30 MVR 283 MW AGC ON 1.00 pu 130 MW 40 MVR 200 MW 0 MVR Net result: Lower cost, yet with some higher LMPs 60
61 Hands on: Seven bus case Load the B7FlatLP case. Try to duplicate the results from the previous two slides. What are the marginal costs of enforcing the line constraints? How do the system costs change if the line constraints are relaxed (i.e., not enforced)? For example, try solving without enforcing line 1 to 2. 61
62 Hands on: Seven Bus Case Modify the cost model for the generator at bus one. How does changing from piece wise linear to cubic affect the final solution? How do the generation conversion parameters on the option dialog affect the results? Try resolving the case with different lines removed from service. 62
63 Some more Examples The remainder of these slides will present some further examples Using the OPF to perform profit maximization Using the OPF on a very large system 63


64 LP Application: Profit Maximization on 30 Bus System 30-Bus Case Demo Case Generation MW Demand MW Cost $/hr Losses 4.77 MW MW MW % N % 20 MW % 79% MW 13 57% Gen 13 LMP 7.00 $/MWh MW 19 MW 13 MW MW MW 54% MW 10 75% % 52% 24 68% 21 MW 2 MW MW The next slides illustrate how the OPF can be used to study the impact of bids on profit. Assume bus 13 generator has a true marginal cost of $ 7 / MWh. 64
65 Profit Maximization If the bus 13 generator were paid the multiple of its bus LMP and its output, its profit would be: Profit = LMP * MW 7 * MW What should the generator bid to maximize its profit? This problem can be solved using the OPF with different assumed generator costs. 65
66 Profit Maximization Generator 13 Profit Profit ($ / hr) Generator 13 Bid ($ / MWh) Generator 13 s best response is to bid about $ 9.5 / MWh 66

67 Profit Maximization 30-Bus Case Demo Case Generation MW Demand MW Cost $/hr Losses 4.36 MW MW MW % N % 20 MW % MW 13 55% % Gen 13 LMP 9.50 $/MWh 16 MW MW MW 14 MW MW 10 87% % 63% MW 55% 70% 22 MW 1 MW MW LMP contours with generator 13 maximizing its profit 67
68 Application of LP OPF to a Large System Next case is based upon the FERC Form Summer Peak case filed by NEPOOL Case has 9270 buses and 2506 generators, representing a significant portion of the Eastern Interconnect transmission and generation Estimated cost data for most generators in NEPOOL, NYPP, PJM, and ECAR These regions were modeled as a super area Results developed by joint project between PowerWorld and U.S. Energy Information Administration 68
69 NEPOOL/NYPP/PJM/ECAR Supply Curve 80.0 Increm entalcost($/mw hr) Flat portion of curve at 10 $/MWhr represents generators with default data Super area has total generation of about 160 GW, with imports of 2620 MW Total Area Generation (MW) 69
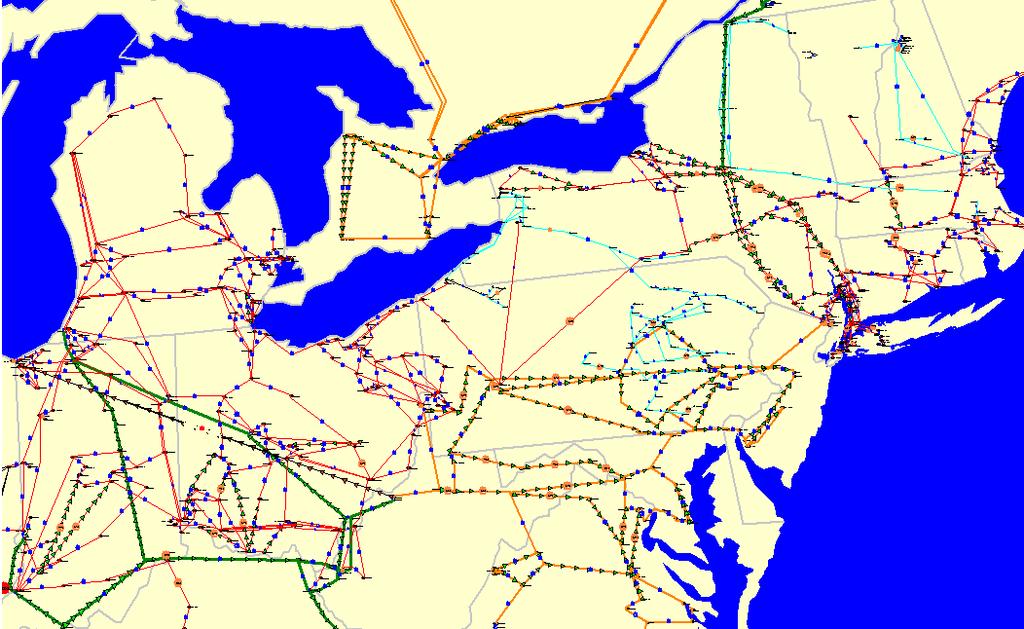
70 Case HEV Transmission 70

71 NYPP/NEPOOL Lower Voltage Transmission Optimal Solution The constrained lines are shown with the large red pie charts 71

72 Bus Marginal Prices Large Range Total operating cost = $ 4,445,990 / hr 72

73 Bus Marginal Prices Narrow Range 73

74 Bus Marginal Costs Individual Areas with Basecase Interchange Total operating cost = $4,494,170 / hr, an increase of $48,170 / hr 74
75 Superarea Case Again 85 MW Gen at 6642 is off 75
76 Superarea Case 85 MW Gen at 6642 is On 76
Introduction to PowerWorld Simulator: Interface and Common Tools
 Introduction to PowerWorld Simulator: Interface and Common Tools through Interconnected System Operation 2001 South First Street Champaign, Illinois 61820 +1 (217) 384.6330 support@powerworld.com http://www.powerworld.com
Dispatch Signal & Locational Marginal Pricing (LMP)
") Dispatch Signal & Locational Marginal Pricing (LMP) PJM State & Member Training Dept. Objectives Students will be able to: Identify how PJM dispatches & utilizes LMP Dispatch Rate Economic control signal
Dispatch Signal & Locational Marginal Pricing (LMP) PJM State & Member Training Dept. Objectives Students will be able to: Identify how PJM dispatches & utilizes LMP Dispatch Rate Economic control signal
Steady State Power System Security Analysis with PowerWorld Simulator
 Steady State Power System Security Analysis with PowerWorld Simulator S8: Security Analysis for a Generator Interconnection Study 2001 South First Street Champaign, Illinois 61820 +1 (217) 384.6330 support@powerworld.com
ELEN 460 Lab 7 Optimal Power Flow (OPF), Security Constrained OPF (SCOPF) and Locational Marginal Prices (LMPs) on Small and Medium Sized Systems
, Security Constrained OPF (SCOPF) and Locational Marginal Prices (LMPs) on Small and Medium Sized Systems") slack ELEN 460 Lab 7 Optimal Power Flow (OPF), Security Constrained OPF (SCOPF) and Locational Marginal Prices (LMPs) on Small and Medium Sized Systems Objective: Gain experience and insights on the use
slack ELEN 460 Lab 7 Optimal Power Flow (OPF), Security Constrained OPF (SCOPF) and Locational Marginal Prices (LMPs) on Small and Medium Sized Systems Objective: Gain experience and insights on the use
Technical Bulletin Comparison of Lossy versus Lossless Shift Factors in the ISO Market Optimizations
 Technical Bulletin 2009-06-03 Comparison of Lossy versus Lossless Shift Factors in the ISO Market Optimizations June 15, 2009 Comparison of Lossy versus Lossless Shift Factors in the ISO Market Optimizations
Locational Marginal Pricing (LMP): Basics of Nodal Price Calculation
: Basics of Nodal Price Calculation") MRTU Locational Marginal Pricing (LMP): Basics of Nodal Price Calculation CRR Educational Class #2 CAISO Market Operations Why are LMPs important to the CRR Allocation & Settlement Process The CRR revenue
MRTU Locational Marginal Pricing (LMP): Basics of Nodal Price Calculation CRR Educational Class #2 CAISO Market Operations Why are LMPs important to the CRR Allocation & Settlement Process The CRR revenue
Congestion Revenue Rights
 Congestion Revenue Rights CRR Basics for Market Redesign and Technologies Upgrade (MRTU) Presentation #2 Roger Treinen June 7 th and 8 th 2007 Congestion Revenue Rights Training This non-hands-on training
Dispatch Signal & Locational Marginal Pricing (LMP)
") Dispatch Signal & Locational Marginal Pricing (LMP) PJM State & Member Training Dept. PJM 2017 Objectives Students will be able to: Identify how PJM dispatches & utilizes LMP PJM 2017 2 Dispatch Rate Definition:
Dispatch Signal & Locational Marginal Pricing (LMP) PJM State & Member Training Dept. PJM 2017 Objectives Students will be able to: Identify how PJM dispatches & utilizes LMP PJM 2017 2 Dispatch Rate Definition:
Locational Marginal Pricing II: Unlocking the Mystery
 Locational Marginal Pricing II: Unlocking the Mystery Thomas D. Veselka Argonne National Laboratory Decision and Information Sciences Division Center for Energy, Environmental, and Economic Systems Analysis
Parameter Tuning for Uneconomic Adjustments. Lorenzo Kristov, Principal Market Architect
 Parameter Tuning for Uneconomic Adjustments Lorenzo Kristov, Principal Market Architect Stakeholder Meeting May 13, 2008 Topics for Discussion Objectives of Current Parameter Tuning Effort Parameter Tuning
Wide-Area Trans-Regional Northeast Reliability Assessment
 Wide-Area Trans-Regional Northeast Reliability Assessment Philip A. Fedora Kollin Patten Northeast Power Coordinating Council PowerWorld Corporation 1515 Broadway 43 rd Floor 1816 South Oak Street New
Generation Contingency Analysis
 Generation Contingency Analysis PJM 2016 Objectives Identify the procedure for redispatching generation to alleviate an overloaded monitored transmission line caused by a contingency PJM 2016 2 Agenda
Coordination of MRN-NEEM Modeling and High Level Transmission Analysis in Task 5
 Coordination of MRN-NEEM Modeling and High Level Transmission Analysis in Task 5 December 30 Revision of the presentation at Macro Future Workshop November 8-9, 2010 Project Objectives Phase I The Roll-Up
Implications of Cost and Bid Format on Electricity Market Studies: Linear Versus Quadratic Costs
 Large Engineering Systems Conference on Power Engineering, July 2004, Halifax Canada. IEEE 2004 1 Implications of Cost and Bid Format on Electricity Market Studies: Linear Versus Quadratic Costs Mary B.
ATC COMPUTATIONAL ISSUES
 ATC COMPUTATIONAL ISSUES Mark H. Gravener PJM Interconnection, L.L.C. Valley Forge, PA 19403 Gravener@pjm.com Chika Nwankpa Drexel University Philadelphia, PA 19104 chika@nwankpa.ece.drexel.edu Tai-Sim
Generation Dispatch. PJM State & Member Training Dept. PJM /13/2017
 Generation Dispatch PJM State & Member Training Dept. PJM 2017 Objectives Explain the difference between Dispatch Rate and LMP PJM 2017 2 Agenda Generation Dispatch PJM 2017 3 Dispatch Rate Definition:
Incidence Matrix-Based LMP Calculation: Algorithm and Applications
 Incidence Matrix-Based LMP Calculation: Algorithm and Applications Mohammad Sadegh Javadi Department of Electrical Engineering, Science and Research Branch, Islamic Azad University, Fars, Iran Abstract
Real-Time LMP and Impacts on Uplift
 Real-Time LMP and Impacts on Uplift Rebecca Carroll Manager, Knowledge Management Center MIC Special Session: Price Transparency February 24, 2017 Locational Marginal Price System Energy Price Transmission
Pivotal Supplier Analysis Internal Interfaces
 Pivotal Supplier Analysis Internal Interfaces FERC June 23, 2005 Market Monitoring Unit Local Markets In an LMP-based market, constraints create smaller, local markets with different structural characteristics
2016 ANNUAL VRL ANALYSIS
 2016 ANNUAL VRL ANALYSIS Published on 08/01/2016 By Ops Market Support/Forensics Chris Davis Ricky Finkbeiner REVISION HISTORY DATE OR VERSION NUMBER AUTHOR CHANGE DESCRIPTION COMMENTS 7/11/2016 Ricky
APPENDIX H CALCULATING LOCATIONAL MARGINAL PRICE
 2009 State of the Market Report for PJM CALCULATING LOCATIONAL MARGINAL PRICE H APPENDIX APPENDIX H CALCULATING LOCATIONAL MARGINAL PRICE In order to understand the relevance of various measures of locational
Reactive Power Support Services in Electricity Markets
 PSERC Reactive Power Support Services in Electricity Markets Costing and Pricing of Ancillary Services Final Project Report Power Systems Engineering Research Center A National Science Foundation Industry/University
Development of simultaneous energy and reserve dispatch model and corresponding pricing mechanism. Stefanos Delikaraoglou and Yi Ding
 Development of simultaneous energy and reserve dispatch model and corresponding pricing mechanism Stefanos Delikaraoglou and Yi Ding DTU CET March 2012 1. Abstract This study aims to develop a market structure
EE5721 FINAL EXAM MAY 11, 2011 NAME PLEASE DO NOT ENTER YOUR ID NUMBER
 Final Exam, EE5721, May 9, 2011 EE5721 FINAL EXAM MAY 11, 2011 NAME PLEASE DO NOT ENTER YOUR ID NUMBER Problem Max Points SCORE 1 20 2 30 3 20 4 30 TOTAL 100 Final Exam, EE5721, May 9, 2011 Problem 1)
ISO Net Surplus Collection & Allocation in Wholesale Power Markets under LMP
 ISO Net Surplus Collection & Allocation in Wholesale Power Markets under LMP Presenter: Leigh Tesfatsion Professor of Econ, Math, and Electrical and Comp. Engineering Iowa State University, Ames, Iowa
Applying PROBE for Congestion Analysis and Grid Planning
 Applying PROBE for Congestion Analysis and Grid Planning August 1, 2003 Jim Mitsche JMitsche@power-gem.com 518 393 3834 1 Topics Analysis Objectives Nature of Congestion Cost & Cost Calculation What is
LMP Implementation in New England
 IEEE PES General Meeting, Montreal Eugene Litvinov June, 2006 2006 ISO New England Inc. 1 New England s Electric Power System 14 million people; 6.5 million households and businesses 350+ generators 8,000+
Price Formation Education Session Day 1 Economic Dispatch
 Slide 1 Price Formation Education Session Day 1 Economic Dispatch Anthony Giacomoni Melissa Maxwell Laura Walter December 4, 2017 Slide 2 Disclaimer Slide This is not a committee meeting. This session
ISO REVISED STAGING PLAN NO. 7
 ID Work Item Description 2 COMPLETE HIM Server An archival database is to be created for permanent historical storage of bidding, price and schedule data. HIM is defined in section 3.2.5 of the SI DSOW:
Applications and Calculation of a Distribution Class Locational Marginal Price. Nick Steffan
 Applications and Calculation of a Distribution Class Locational Marginal Price by Nick Steffan A Thesis Presented in Partial Fulfillment of the Requirements for the Degree Master of Science Approved April
532 IEEE TRANSACTIONS ON POWER SYSTEMS, VOL. 23, NO. 2, MAY 2008
 532 IEEE TRANSACTIONS ON POWER SYSTEMS, VOL. 23, NO. 2, MAY 2008 Payment Cost Minimization Auction for Deregulated Electricity Markets With Transmission Capacity Constraints Feng Zhao, Student Member,
PJM ARR and FTR Market
 PJM ARR and FTR Market PJM State & Member Training Dept. PJM 2017 Objectives At the completion of this training, you should be able to describe the concepts and principles of Auction Revenue Rights and
Transmission Constraint Relaxation Parameter Revision ISO Straw Proposal
 Transmission Constraint Relaxation Parameter Revision ISO Straw Proposal October 18, 2012 Prepared by: Market and Infrastructure Development Version: 1.0 California Independent System Operator Contents
Key Issues and Consideration in Market Design, Operational and Oversight
 Key Issues and Consideration in Market Design, Operational and Oversight Patrick Donlon Amanda Gordon Kathryn Sophy Kenneth Villwock Public Utilities Commission of Ohio & Pennsylvania Public Utilities
3.2 Market Settlements.
 3.2 Market Settlements. If a dollar-per-mw-hour value is applied in a calculation under this section 3.2 where the interval of the value produced in that calculation is less than an hour, then for purposes
Financial Transmission Rights
 PJM Manual 06 Financial Transmission Rights Revision: 12 Effective Date: July 1, 2009 Prepared by Market Simulation Department PJM 2009 PJM Revision 05, Effective Date: 12/30/03 iii Table of Contents PJM
Transshipment. Chapter 493. Introduction. Data Structure. Example Model
 Chapter 493 Introduction The transshipment model is a special case of the minimum cost capacitated flow model in which there are no capacities or minimums on the arc flows. The transshipment model is similar
3.2 Market Buyers Spot Market Energy Charges.
 3.2 Market Buyers. 3.2.1 Spot Market Energy Charges. (a) The Office of the Interconnection shall calculate System Energy Prices in the form of Day-ahead System Energy Prices and Real-time System Energy
PJM Wholesale Markets. Hisham Choueiki, Ph.D., P.E. Ohio PUC Staff October 20-24, 2014 Tbilisi, Georgia
 PJM Wholesale Markets Hisham Choueiki, Ph.D., P.E. Ohio PUC Staff October 20-24, 2014 Tbilisi, Georgia PJM RTO Functions Grid Operation Non-discriminatory treatment Monitoring transmission system Reliability
International ejournals
 ISSN 2249 5460 Available online at www.internationalejournals.com International ejournals International Journal of Mathematical Sciences, Technology and Humanities 21 (2011) 205 212 ENERGY CONTROL CENTER
PJM PROMOD Overview. August 1, PJM
 PJM PROMOD Overview August 1, 2017 Market Analysis Software PROMOD PROMOD is a fundamental electric market simulation solution It incorporates future demand, generating unit operating characteristics,
Contingency Modeling Enhancements Issue Paper
 Contingency Modeling Enhancements Issue Paper March 11, 2013 California ISO Contingency Modeling Enhancements Issue Paper Table of Contents I. Executive Summary... 3 II. Plan for Stakeholder Engagement...
Local Market Power Mitigation Enhancements
 Local Market Power Mitigation Enhancements Draft Final Proposal May 6, 2011 CAISO/M&ID/CRH May 6, 2011 page 1 Draft Final Proposal Local Market Power Mitigation Enhancements Table of Contents 1. Introduction...
IEEE TRANSACTIONS ON POWER SYSTEMS, VOL. 22, NO. 4, NOVEMBER
 IEEE TRANSACTIONS ON POWER SYSTEMS, VOL. 22, NO. 4, NOVEMBER 2007 1475 DCOPF-Based LMP Simulation: Algorithm, Comparison With ACOPF, and Sensitivity Fangxing Li, Senior Member, IEEE, and Rui Bo, Student
PJM Fixed Transmission Rights (FTRs)
") PJM Fixed Transmission Rights (FTRs) Andrew Ott Manager, Market Development 1 What Are FTRs? Fixed Transmission Rights are a financial contract that entitles holder to a stream of revenues (or charges)
PJM Fixed Transmission Rights (FTRs) Andrew Ott Manager, Market Development 1 What Are FTRs? Fixed Transmission Rights are a financial contract that entitles holder to a stream of revenues (or charges)
Locational Based Marginal Pricing
 Locational Based Marginal Pricing Gina Craan Manager, Market Training, NYISO Market Overview Course March 8, 2018 Rensselaer, NY 12144 1 Locational Based Marginal Pricing Attendees will be able to Explain
Two Settlement PJM /06/2016
 Two Settlement PJM 2016 Objectives Describe Two-Settlement process Day-Ahead Market Balancing Market Explain Virtual Transactions and their settlement Inc Offers Dec Bids Up-to Congestion Transactions
Analysis of the Broader Regional Markets Initiatives
 Analysis of the Broader Regional Markets Initiatives Presented to: Joint NYISO-IESO-MISO-PJM Stakeholder Technical Conference on Broader Regional Markets David B. Patton, Ph.D. Potomac Economics September
Generator Interconnection Affected System Impact Study. Plains & Eastern Clean Line Final Report
 Generator Interconnection Affected System Impact Study Plains & Eastern Clean Line Final Report May 19, 2015 MISO 2985 Ames Crossing Eagan Minnesota - 55121 http://www.misoenergy.org Midcontinent Independent
PJM Organization and Markets. Saudi Delegation Columbus Ohio May 22, 2012
 PJM Organization and Markets Saudi Delegation Columbus Ohio May 22, 2012 Agenda Introduction & Governance Energy Markets LMP FTRs/ARRs Two Settlement Virtual Bids Ancillary Capacity - Reliability Pricing
Appendix 1 PRELIMINARY DELIVERABILITY BASELINE ANALYSIS STUDY REPORT
 Generation and Import Deliverability to the Aggregate of Load (Baseline) Study Methodology Executive Summary Deliverability is an essential element of any resource adequacy requirement. Specifically, Load
MARKET EFFICIENCY STUDY PROCESS AND PROJECT EVALUATION TRAINING
 MARKET EFFICIENCY STUDY PROCESS AND PROJECT EVALUATION TRAINING December 22, 2014 Training Objectives To Provide an Overview of: The Market Efficiency proposal window process The critical modeling inputs
On the Behavior of Responsive Loads in the Presence of DFACTS Devices
 On the Behavior of Responsive Loads in the Presence of DFACTS Devices Javad Mohammadi, Student Member, IEEE, Gabriela Hug, Member, IEEE, Soummya Kar, Member, IEEE. Abstract The paper studies a constrained
Pricing Enhancements Issue Paper and Straw Proposal
 Pricing Enhancements Issue Paper and Straw Proposal Guillermo Bautista Alderete, Ph.D. Manager, Market Validation and Quality Analysis July 10, 2014 ISO Stakeholder Initiative Process POLICY AND PLAN DEVELOPMENT
MISO/PJM Joint Modeling and Analysis of State Regulatory and Policy Drivers Case Study: Clean Power Plan Analysis
 MISO/PJM Joint Modeling and Analysis of State Regulatory and Policy Drivers Case Study: Clean Power Plan Analysis Muhsin Abdur-Rahman Senior Engineer, Emerging Markets Members Committee March 20, 2017
RTO Overview and Day 2 Markets. EAI Technical Conference May 26, 2011
 RTO Overview and Day 2 Markets EAI Technical Conference May 26, 2011 1 Agenda RTO Day 2 markets and Locational Marginal Pricing (LMP) Why RTO Day 2 markets may benefit Entergy s customers Quantifiable
Getting Started with OptQuest
 Getting Started with OptQuest What OptQuest does Futura Apartments model example Portfolio Allocation model example Defining decision variables in Crystal Ball Running OptQuest Specifying decision variable
Price Formation. Eric Ciccoretti Attorney-Advisor Office of Energy Policy and Innovation Federal Energy Regulatory Commission June 13, 2017
 Price Formation Eric Ciccoretti Attorney-Advisor Office of Energy Policy and Innovation Federal Energy Regulatory Commission June 13, 2017 The views and opinions presented are mine alone and do not reflect
PJM Markets. Energy and Ancillary Services. PJM State & Member Training Dept. PJM /29/2014
 PJM Markets Energy and Ancillary Services PJM State & Member Training Dept. LMP Basics 2 7/17/2013 What is LMP? Locational Marginal Price Pricing method PJM uses to: price energy purchases and sales in
California Independent System Operator Corporation Fifth Replacement Electronic Tariff
 Table of Contents 27 CAISO Markets And Processes... 2 27.1 LMPs And Ancillary Services Marginal Prices... 2 27.1.1 Locational Marginal Prices For Energy... 3 27.1.2 Ancillary Service Prices... 4 27.1.3
Flexible Ramping Products
 Flexible Ramping Products Revised Draft Final Proposal August 16, 2012 Lin Xu, Ph.D. Senior Market Development Engineer Don Tretheway Senior Market Design and Policy Specialist Agenda Time Topic Presenter
Price Inconsistency Market Enhancements. Draft Final Proposal
 Price Inconsistency Market Enhancements Draft Final Proposal August 31, 2012 Price Inconsistency Market Enhancements Table of Contents 1 Introduction... 4 2 Plan for Stakeholder Engagement... 4 3 Background...
A Dynamic Framework for Real time and Regulation Markets for Smart Grids
 A Dynamic Framework for Real time and Regulation Markets for Smart Grids Anuradha Annaswamy Active adaptive Control Laboratory Department of Mechanical Engineering Massachusetts Institute of Technology
Modelling of Locational Marginal Based Transmission Pricing in Restructured Power System
 Modelling of Locational Marginal Based Transmission Pricing in Restructured Power System 1 Mr.V.G.Umale, 2 Dr. S.B.Warkad 1 Priyadarshini College of Engineering, 2 Pote College of Engineering Abstract:
Report on Performance of the California ISO s Local Market Power Mitigation Mechanism
 Report on Performance of the California ISO s Local Market Power Mitigation Mechanism Frank A. Wolak Department of Economics Stanford University wolak@zia.stanford.edu http://www.stanford.edu/~wolak Chairman,
Energy Imbalance Market Year 1 Enhancements Phase 2. Draft Final Proposal
 Energy Imbalance Market Year 1 Enhancements Phase 2 Draft Final Proposal September 8, 2015 Energy Imbalance Market Year 1 Enhancements Phase 2 Draft Final Proposal Table of Contents 1 Introduction... 3
Background: ERCOT studies in 80 s and 90 s using NARP (N Area Reliability Program): o Small model in which each node represented a major load center
: o Small model in which each node represented a major load center") A Direct High Speed Calculation Procedure For Determining LOLE, LOLH, and EUE For Fossil, Wind, and Solar Generation With A Suggested Procedure For Also Including Transmission Constraints a presentation
A Direct High Speed Calculation Procedure For Determining LOLE, LOLH, and EUE For Fossil, Wind, and Solar Generation With A Suggested Procedure For Also Including Transmission Constraints a presentation
CHAPTER 5 SUPPLIER SELECTION BY LEXICOGRAPHIC METHOD USING INTEGER LINEAR PROGRAMMING
 93 CHAPTER 5 SUPPLIER SELECTION BY LEXICOGRAPHIC METHOD USING INTEGER LINEAR PROGRAMMING 5.1 INTRODUCTION The SCMS model is solved using Lexicographic method by using LINGO software. Here the objectives
CAISO Generator Deliverability Assessment Methodology. On-Peak Deliverability Assessment Methodology (for Resource Adequacy Purposes)
") Background On-Peak Deliverability Assessment Methodology (for Resource Adequacy Purposes) The CAISO s deliverability study methodology for resource adequacy purposes was discussed extensively in the CPUC
Background On-Peak Deliverability Assessment Methodology (for Resource Adequacy Purposes) The CAISO s deliverability study methodology for resource adequacy purposes was discussed extensively in the CPUC
UTC Activity Pre and Post 162 FERC 61,139: January 1, 2017 through March 8, 2018
 UTC Activity Pre and Post 162 FERC 61,139: January 1, 2017 through March 8, 2018 The Independent Market Monitor for PJM April 3, 2018 Monitoring Analytics 2018 www.monitoringanalytics.com This page intentionally
Real-Time PMU-Based Tools for Monitoring Operational Reliability (5.4)
") Real-Time PMU-Based Tools for Monitoring Operational Reliability (5.4) Alejandro Dominguez-Garcia (in collaboration with Y. Chen and P. Sauer) Department of Electrical and Computer Engineering University
Real-Time PMU-Based Tools for Monitoring Operational Reliability (5.4) Alejandro Dominguez-Garcia (in collaboration with Y. Chen and P. Sauer) Department of Electrical and Computer Engineering University
Congestion and Marginal Losses
 Section 11 Congestion and Marginal Losses Congestion and Marginal Losses The locational marginal price (LMP) is the incremental price of energy at a bus. The LMP at a bus is the sum of three components:
Congestion and Marginal Losses
 Section 11 Congestion and Marginal Losses Congestion and Marginal Losses The locational marginal price (LMP) is the incremental price of energy at a bus. The LMP at a bus is made up of three components:
the Real-Time Market will be based on the system marginal costs produced by the Real-Time
 17.1 LBMP Calculation The Locational Based Marginal Prices ( LBMPs or prices ) for Suppliers and Loads in the Real-Time Market will be based on the system marginal costs produced by the Real-Time Dispatch
Appendix H Calculating Locational Marginal Price
 2008 State of the Market Report for PJM CALCULATING LOCATIONAL MARGINAL PRICE H Appendix H Calculating Locational Marginal Price In order to understand the relevance of various measures of locational marginal
the Real-Time Market will be based on the system marginal costs produced by the Real-Time
 17.1 LBMP Calculation The Locational Based Marginal Prices ( LBMPs or prices ) for Suppliers and Loads in the Real-Time Market will be based on the system marginal costs produced by the Real-Time Dispatch
FirstEnergy Solutions Energy Market Update AEE Meeting March 20, John Ogurchak PE/CEM Manager, Commercial/Industrial Energy Sales
 FirstEnergy Solutions Energy Market Update AEE Meeting John Ogurchak PE/CEM Manager, Commercial/Industrial Energy Sales FirstEnergy Solutions Corp. (FES) Retail subsidiary of FirstEnergy Corp. and headquartered
Stepped Constraint Parameters. Issue Paper
 Stepped Constraint Parameters May 5, 2016 Table of Contents 1. Introduction... 3 2. Plan for Stakeholder Engagement... 4 3. Transmission constraint relaxation parameter... 5 4. Shift factor effectiveness
A Dynamic Market Mechanism for Integration of Renewables and Demand Response
 1 A Dynamic Market Mechanism for Integration of Renewables and Demand Response Anuradha Annaswamy aanna@mit.edu Panel on Market-based Approaches for Demand Response IEEE Power and Energy Society General
Interface Pricing Approach Whitepaper May 2015
 Interface Pricing Approach Whitepaper May 2015 This white paper represents MISO's current progress and assessment on the Interface Pricing issue. Additional analysis is underway and will be shared with
Deregulation, Locational Marginal Pricing, and Critical Load Levels with Applications
 ECE 620 Lecture Nov. 2nd, 2016 Deregulation, Locational Marginal Pricing, and Critical Load Levels with Applications Fangxing (Fran) Li, Ph.D., P.E. Professor Dept. of EECS The University of Tennessee
PJM Proposal: Reserve Market Enhancements
 PJM Proposal: Reserve Market Enhancements Adam Keech Executive Director, Market Operations Markets & Reliability Committee Meeting January 24, 2019 PJM 2019 Comprehensive Reserve Pricing Reform The PJM
NERC Reliability Functional Model
 NERC Reliability Functional Model Function Definitions and Responsible Entities Version 3 Approved by Standing Committees: Operating Committee: December 6, 2006 Planning Committee: December 6, 2006 Standards
Price Formation. PJM Market Participants February 14, Joe Bowring Catherine Tyler
 Price Formation PJM Market Participants February 14, 2019 Joe Bowring Catherine Tyler ISSUES WITH PJM ORDC 2019 www.monitoringanalytics.com 2 PJM ORDC Shape PJM s ORDCs persistently raise prices and procure
Power Flow Control Through Topology Optimization Software: Applications and Case Studies
 1 Power Flow Control Through Topology Optimization Software: Applications and Case Studies Pablo A. Ruiz IEEE PES Transmission & Distribution Conference and Expo Denver, CO, April 17, 2018 2 Current Congestion
5.1 Transmission Congestion Charge Calculation Calculation by Office of the Interconnection.
 5.1 Transmission Congestion Calculation. 5.1.1 Calculation by Office of the Interconnection. When the transmission system is operating under constrained conditions, or as necessary to provide third-party
FINAL REPORT PHASE IV MARKET TRIALS
 October 26, 1999 FINAL REPORT PHASE IV MARKET TRIALS Scott M. Harvey, William W. Hogan, Susan L. Pope, Andrew Hartshorn and Kurt Zala EXECUTIVE SUMMARY On behalf of the Member Systems of the New York Power
Evaluation of TCSC and DR Abilities for Congestion Management
 Australian Journal of Basic and Applied Sciences, 5(6): 1011-1019, 2011 ISSN 1991-8178 Evaluation of TCSC and DR Abilities for Congestion Management 1 Y. Hoseynpoor, 2 T. PirzadehAshraf, 1 Sh. Sajedi,
Congestion Cost Metrics
 Congestion Cost Metrics DRAFT One of the features of a locational marginal price (LMP) based market is the ability to identify grid locations that are difficult to serve with economic generation due to
MISO-PJM Interface Pricing Post Implementation Metrics and Criteria
 MISO-PJM Interface Pricing Post Implementation Metrics and Criteria Contents 1 Introduction... 2 2 Real-Time Market Interchange Price Signal Effectiveness Metrics... 2 2.1 Post Implementation Pricing Monitoring
Managing Flexibility in MISO Markets
 Managing Flexibility in MISO Markets Clean Energy Regulatory Forum November 9, 2012 Outline Impacts of Variable Generation on Ancillary Services Dispatchable Intermittent Resources Introduction to Proposed
3. Overview of Market Instruments
 3. Overview of Market Instruments 3.2 Ancillary Services Bids Four types of Ancillary Services are used by CAISO in its markets Regulation Up, Regulation Down, Spinning Reserve, and Non-Spinning Reserve.
The OTC Emission Reduction Workbook 2.1: Description and User s Manual
 The OTC Emission Reduction Workbook 2.1: Description and User s Manual Prepared by: Geoff Keith, David White and Bruce Biewald Synapse Energy Economics 22 Pearl Street, Cambridge, MA 02139 www.synapse-energy.com
New York Independent System Operator, Inc. NYISO Tariffs. OATT Schedules
 New York Independent System Operator, Inc. NYISO Tariffs OATT Schedules Document Generated On: 6/30/2010 Page 1 Contents 6 Schedules... 7 6.1 Schedule 1 Scheduling, System Control and Dispatch Service...
Price Formation Education 4: Shortage Pricing and Operating Reserve Demand Curve
 Price Formation Education 4: Shortage Pricing and Operating Reserve Demand Curve Patricio Rocha Garrido Lisa Morelli Laura Walter Disclaimer This is not a committee meeting. This session is for educational
Energy Uplift (Operating Reserves)
") Section 4 Energy Uplift Energy Uplift (Operating Reserves) Energy uplift is paid to market participants under specified conditions in order to ensure that resources are not required to operate for the
Section 4 Energy Uplift Energy Uplift (Operating Reserves) Energy uplift is paid to market participants under specified conditions in order to ensure that resources are not required to operate for the
STATE OF THE MARKET REPORT 2005
 STATE OF THE MARKET REPORT 2005 MRC Baltimore, MD March 15, 2006 Joseph E. Bowring Market Monitor Figure 4-4 - PJM s evolving footprint and its interfaces 1 PJM Market Monitoring Unit Independent Internal
2.1.1 Market Power Mitigation & Reliability Requirements Determination Market Power Mitigation & Reliability Requirements Determination
 2.1.1 Market Power Mitigation & Reliability Requirements Determination The Market Power Mitigation and Reliability Requirements Determination (MPM-RRD) function consists of two processes. The MPM is to
Standard Market Design in the Electric Market: Some Cautionary Thoughts. June 20, Prepared by: Philip Hanser Metin Celebi Peter Fox-Penner
 Standard Market Design in the Electric Market: Some Cautionary Thoughts June 20, 2002 Prepared by: Philip Hanser Metin Celebi Peter Fox-Penner 1 Introduction The standard market design about to be proposed