Non-point Source Pollution Assessment of the San Antonio - Nueces Coastal Basin
|
|
|
- Alexia Stephens
- 6 years ago
- Views:
Transcription
1 Non-point Source Pollution Assessment of the San Antonio - Nueces Coastal Basin By David R. Maidment and William K. Saunders Center for Research in Water Resources University of Texas Austin, TX Paper presented to the Scientific and Technical Advisory Committee Corpus Christi Bay National Estuary Program Corpus Christi, Texas January 11, 1996
2 Non-point Source Pollution Assessment of the San Antonio - Nueces Coastal Basin By David R. Maidment and William K. Saunders Abstract The amount of pollution from non-point sources flowing in the streams of the San Antonio - Nueces coastal basin in South Texas is estimated by a GIS-based method using rainfall, runoff and land use data. A fine grid of cells 100m in size is laid over the landscape. For each cell, mean annual runoff is estimated from rainfall, and expected pollutant concentration is estimated from land use. The product of runoff and concentration gives expected pollutant loading from that cell. These loadings are accumulated going downstream to give expected annual pollutant loadings in streams and rivers. By dividing these accumulated loadings by the similarly accumulated mean annual runoff, the expected pollutant concentration from non-point sources is determined for each location in a stream or river. Observed pollutant concentrations in the basin are averaged at each sample point and compared to the expected concentrations at the same locations determined from the grid cell model. Results for phosphorus indicate that non-point source pollution in the Mission and Copano watersheds, which have largely rangeland and forest land use, is at relatively low levels in the mg/l range, and is consistent with observed concentrations. There don t appear to be significant point sources of pollution in these watersheds. In the Aransas watershed, primarily of agricultural land use, observed concentrations are greater than non-point sources alone would indicate and there is evidence that a point source in the town of Beeville has been contributing a significant amount of phosphorus to the Aransas River. Results for Nitrogen suggest that observed pollutant levels in most parts of the basin are higher than expected, especially in the Aransas watershed, where the City of Beeville again appears to have been a significant point source contributor. Introduction The Texas Clean Rivers Program, a product of Texas Senate Bill 818, calls upon the Texas Natural Resource Conservation Commission to make a report to the Governor each two years on the condition of the water quality in Texas streams and rivers. Water quality status reports have been prepared for each basin assessing the frequency of exceedance of various pollutant levels in designated river segments as a means of identifying the location and types of significant contamination. Most of these reports have been prepared by the River Authorities responsible for particular river basins, but a few river basins, among them the San Antonio - Nueces Coastal Basin, do not fall within the jurisdiction of a River Authority and the TNRCC itself prepares assessments for these basins (TNRCC, 1994). The San Antonio - Nueces Coastal Basin drains into the coastal inland waterway system of Texas to the Northeast of Corpus Christi, as shown in Figure 1. 1
3
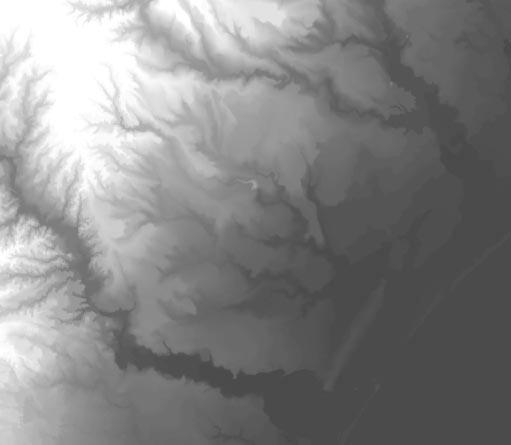
4 At present, a national estuary study is being conducted in the region, called the Corpus Christi Bay National Estuary Program. Participants in this study have expressed concern that estimates of pollution to the bay and estuary system derived from data measured outside the region might not reflect conditions within the region. They are initiating programs for conducting additional sampling of pollutant concentrations and have asked for some guidance as to the most appropriate locations at which sampling might be conducted. The research reported here addresses these concerns and issues. As part of the water quality assessment of the San Antonio - Nueces basin, a study is needed of pollutant sources, and in particular of non-point sources of pollutants, since even if all the point sources of contamination are eliminated, non-point sources can still be sufficient to degrade water quality to unacceptable levels. Non-point sources of pollution include runoff from agricultural lands contaminated with chemicals from fertilizer and herbicide applications, urban runoff from streets and parking lots which contain oil and grease, bacterial pollution, and other sources. A method of assessing non-point source pollution in river basins is thus needed. The traditional approach to this task has been to use a water quantity and quality computer model, such as HSPF (Hydrologic Simulation Program - Fortran), to simulate the physical and chemical processes governing runoff and contamination in a basin as a function of time. An examination of the application of this model has been made in Oso Creek, a 200 km 2 watershed near Corpus Christi (USDA - NRCS, 1995). The results suggest that the mean annual runoff can reasonably be reproduced by such a model but there are differences between observed and predicted runoff in individual years. Models such as HSPF contain many parameters and require a considerable amount of work to be calibrated for large basins. The San Antonio - Nueces Coastal basin, with an area of approximately 7000 km 2, is about thirty times larger than Oso Creek. Methodology In this report a simplified method of non-point source pollution assessment developed using the Arc/Info geographic information system is presented. The result of this method is an estimate of the mean annual runoff, pollutant concentration and pollutant loading for each cell in a fine mesh laid over the landscape of the basin. The steps involved in the method proposed are outlined in Figure 2 and described below: (1) Grid model of surface drainage: A fine mesh of 100m cells is laid over the landscape based on standard 3 arc-second USGS digital elevation data. In Figure 3 is shown the grayshaded image of the digital elevation data and an overlay of the principal streams and watersheds of the basin. There are approximately 1.7 million of these cells within the basin. The conceptual basis for the surface drainage path determination is illustrated in Figure 4. Drainage can pass from each cell to only one of its eight neighboring cells (four on the principal axes and four on the diagonals) in the direction of steepest descent, as defined by the digital elevation data grid, thus generating a flow direction for each grid cell. By tracing these cell to cell drainage connections downstream, the drainage path from every cell to the watershed outlet is determined, 3
5
6
7 (a) (b) (c) (d) Figure 4: Processing of Digital Elevation Data. (a) the 8-direction pour point model; (b) a grid of elevation values; (c) flow direction grid; (d) flow accumulation grid.
8 thus generating a flow connectivity network through the whole basin. From any cell, the number of cells upstream can be counted, which is called the flow accumuation grid. Streams are identified as lines of cells whose upstream drainage area exceeds a threshold value; watersheds are identified as the set of cells whose drainage passes through a particular outlet cell on a stream. In the very flat areas near the coast, the observed drainage network contains many straight constructed channels and to ensure that the mapped streams are correctly reproduced in the drainage paths derived from the digital elevation data, the mapped streams were burned in to the landscape by artificially raising the elevation of all the off-stream cells by an arbitrary amount (Saunders and Maidment, 1995). This device ensures that the grid streams and the mapped streams are completely consistent at some expense of some distortions in the watershed boundaries where the mapped streams and the digital elevation data are not completely in harmony with one another. Production of an improved digital elevation model for the basin from digital orthophotoquads would help to overcome this problem. (2) Mean annual runoff computed from rainfall: Five stream gages in the basin (Aransas, Chiltipin, Copano, Medio, and Mission) were used, of which Chiltipin and Medio are now closed and the Mission River record is the longest (1960 to present). For each gage, the watershed drainage area was delineated from the grid model, as shown in Figure 5. The derived drainage areas generally are within 3% of the corresponding drainage areas tabulated in the USGS gage records. The mean annual rainfall on each 100m cell is found by using a standard mean annual precipitation grid for the US for developed by Oregon State University and the USDA Natural Resources Conservation Service (Daly, et. al., 1994), for which the portion overlying the San Antonio - Nueces basin is shown in Figure 6(a). The mean annual precipitation for each gage was determined by spatially averaging the precipitation over the cells in its drainage area. The mean annual flow, Q g, at a specific gage for the period is estimated from the mean annual flow for that period at the Mission gage, Q m, by calculating the ratio of the mean annual flow at the gage, q g, with that at the Mission gage, q m, for the periods when records are available at both gages, according to the relation: q g Q g = Q m (1) q m The mean annual flow so computed is divided by the drainage area to give a result in mm/yr and plotted against mean annual precipitation, also in mm/yr, for the corresponding drainage area, as shown in Figure 6(b). A straight line fit is made to these five points, which yields the equation: Q = * P (2) The mean annual runoff can be found for each cell by applying Eq. (2) to the precipitation grid shown in Figure 6(a), to produce a grid of runoff per unit area, Q, in mm/yr as shown in Figure 6(c). 7
9
10
11 RELATIONSHIP BETWEEN RAINFALL AND STREAMFLOW IN THE SAN ANTONIO-NUECES COASTAL BASIN (LINEAR) 300 Depth of Streamflow (mm) Range of Q Estimated Q Actual Q Lower Boundary Upper Boundary 0 Q = * P , P > 759 mm Q = 0, P <= 759 mm Rainfall (mm) Figure 6(b)
12
13 The set of values for which Eq. (2) is derived ranges from P = 783 mm, Q = 34 mm at the Medio gage to P = 924 mm, Q = 181 mm at the Copano gage. In applying this equation to the precipitation grid to determine the runoff from each cell, the equation was applied over a wider range from 739 mm to 985 mm/yr of precipitation, mostly including the wetter areas near the coast for which there are no stream gaging records in this basin. While Eq. (2) gives a reasonable estimate for the inland portion of the basin for which stream gaging records exist, it would be more reliable to add data from gages in adjacent basins which have greater and less precipitation than that in the San Antonio - Nueces basin so that the range of application of the rainfall-runoff relation can be extended and its form estimated more accurately. In fact, if precipitation P falls below 759 mm/yr (30"/yr), then Q goes to 0 in Eq. (2), so this equation should not be applied outside this basin without further testing and addition of further gages. (3) Expected Pollutant Concentration Related to Land Use: The measure of pollutant level during a runoff event is the expected mean concentration, or EMC, measured in mg/liter or mg/l, defined as the ratio of the mass of pollutant in the event divided by the volume of runoff. The expected mean concentration has a statistical distribution, and varies in value from event to event but that statistical variation was not included in this study. It is assumed that the expected mean concentration is directly related to the land use in the drainage area. For the San Antonio - Nueces basin, the land use is defined by the USGS Land Use/Land Cover files which use a two level land use classification called the Anderson system. At the first level, major land use types are distinguished (Urban, Agriculture, Rangeland, Forest, Water, ) while subcategories of these types are identified at the second level. Figure 7 shows the land use in the San Antonio - Nueces basin. In the Mission and Copano watersheds to the North and East, the land use is primarily rangeland and low forest; in the Aransas watershed to the South and West, the land use is primarily agriculture. The USGS land use study which underlies the data presented in Figure 7 was conducted during the 1970 s using interpretation of remotely sensed images. It is likely that in some areas of the basin, the land use has altered since that time and it would be useful to have a more up to date land use map. As part of the Oso Creek study, the Natural Resource Conservation Service compiled expected mean concentration values for non-point source pollution for various land uses, as shown in Table 1, and they kindly made these estimates available for our study. Using the GIS, the land use in each 100 m cell was determined, and by employing Table 1, the corresponding expected mean concentration for various pollutants was determined for each cell, as shown in Figure 8 for total phosphorus. (4) Downstream Pollutant Loadings Determined: The contribution, L (kg/yr), that each cell makes to downstream pollutant loading can be found by taking the product of the cell area, A, from Step 1 (A = 10,000 m 2 ), the runoff per unit area, Q (mm/yr), from Step 2, and the expected concentration, C (mg/l), from Step 3, using the equation: L = KQCA (3) where K = 10-6 is a constant to make the units consistent. A value of L is computed for each cell in the landscape to represent its local contribution to contaminant loading. The accumulated 12
14
15 Urban Urban Urban Urban Urban Agr Range Undev/ Constituent Res Comm Ind Trans Mixed Open /17# 2* 3* 7* Total Nitrogen (mg/l) Total Kjeldahl N. (mg/l) Nitrate + Nitrite (mg/l as N) Total Phosphorus (mg/l) < Dissolved Phos (mg/l) Suspended Solids (mg/l) Dissolved Solids (mg/l) Total Lead (µg/l) Total Copper (µg/l) <10 Total Zinc (µg/l) Total Cadmium (µg/l) < <1 Total Chromium (µg/l) < Total Nickel (µg/l) < BOD (mg/l) COD (mg/l) Oil and Grease (mg/l)** Fec Coliform (col./100 ml)** 20,000 6,900 9,700 53,000 22, Fecal Strep (col./100 ml)** 56,000 18,000 6,100 26,000 26,525 # calculated as average of land uses * applied to all subcategories within the land use type **average concentrations base on instantaneous rather than flow-averaged samples Table 1 : Relationship Between Land Use and Expected Pollutant Concentrations
16
17 loading going downstream is determined by summing the loadings arising from all upstream cells. The result for phosphorus concentration is shown in Figure 9. Not surprisingly, the highest loadings arise in the Aransas watershed, because of its agricultural land use, and in the Mission watershed because it has the largest drainage area. An important assumption made in this computation is that the downstream transport process is conservative, that is, the pollutant concentration is not modified by instream water quality processes. A second important assumption is that the expected mean concentration from a runoff event is here applied to the mean annual runoff, which is the sum of all runoff events and the base flow that occurs between events. (5) Downstream Pollutant Concentrations Compared to Observations: The pollutant concentration sampled at a particular location on a stream is the result of a mixture of all the flows and pollutant loadings that drain from upstream of that location. This mixing process can be approximated for the grid model by taking the accumulated loadings computed in Step 4, and dividing them by similarly accumulated mean annual flows derived from the runoff per unit area found in Step 2. In other words, for each cell on a stream, if one knows the total mean annual pollutant loading, L a, and the mean annual runoff, Q a, from the upstream drainage area, the modeled concentration, C a, at that location is: C a = L a Q a (4) Pollutant concentrations have been sampled in the basin at various locations and at various times. Some locations have more data than others. A simplifying assumption is made that the expected concentration observed at a sampling site is simply the average of the measurements made there. In other words, at each sampling point if C i is the ith measured concentration, i = 1, 2,..., n, then the average observed concentration, C o, is: C o = 1 n n C i i = 1 (5) This is equivalent to assuming that the observed pollutant concentrations, C i, are statistically stationary through time, from year to year, and also within a year, so that seasonal effects are neglected. In studies of agricultural chemical contamination in the Midwest we are taking seasonal variations into account, but the intensity of agrichemical use in the Midwest is much higher than in the San Antonio - Nueces basin. 16
18
19 Results Phosphorus Colored maps can be created to compare the modeled and observed concentrations, as shown for Phosphorus in Figure 10(a). In this map, the cells along the streams have concentration, C a, computed by Eq. (4), and are color coded by concentration level. The same color coding scheme is used to shade the circles at each sampling location where the color shown indicates the observed concentration, C o, found from Eq. (5). The size of the circles at each sample location is proportional to the number of measurements made there. It is apparent by comparing the shading of the modeled streams and the sampled circles that, for total phosphorus, the expected concentration in the Mission and Copano watersheds is consistent with the values observed, a minimal level of approximately mg/l. In the Aransas watershed, the observed phosphorus concentrations are higher than expected, in particular just downstream of the City of Beeville, which appears to have been a significant point source of phosphorus. This conclusion should be tempered by the fact that the data plotted in this figure at that location are mostly from a period in the early 1980 s and it is possible that they are not representative of the current situation at Beeville. The observed data show an interesting pattern downstream of Beeville, as shown in Figure 10(b). It appears that water with a higher level of contamination gradually becomes diluted as it flows downstream, by the influence of cleaner water coming from downstream tributaries to the Aransas River. The map display of the data provides a useful way of interpreting the spatial pattern of the observed concentrations, as well as of the relation between the modeled and the observed values. Nitrogen Figure 11 shows a similarly constructed map comparing observed and modeled concentrations of total nitrogen. In this case, observed levels are everywhere higher than the expected values, with the discrepancy being larger in the Aransas watershed than it is in the Mission and Copano watersheds. It appears that the expected mean concentration levels for nitrogen for all land uses need to be adjusted upward to reflect conditions in this basin. Also, there again appears to be a significant point source effect from the City of Beeville. Cadmium Similar calculations to those presented for nitrogen and phosphorus were determined for Cadmium but there are very few observations (a total of 7 measurements) by which the computations can be evaluated and so the concentration map is not presented here. 18
20
21
22
23 Conclusions The non-point source pollution assessment method described here has a number of limitations: the results given are for mean annual flow and no variations within years or from year to year are given. Flows are highly correlated in space throughout the basin, especially when monthly or annual flows are considered, so a simple way to determine time sequences of runoff values would be to take the runoff data from the Mission gage as an index and use the spatial distribution of runoff per unit area shown in Figure 6(c) to infer the time pattern of flows and pollutant loadings at other locations in the basin. pollutant concentration from local runoff is assumed to be directly related to land use in that area and not to vary from event to event. This assumption might be relaxed by statistically sampling from a distribution of event mean concentration values and applying the result to the various cells in the grid mesh, rather than assuming a unique concentration value for each land use. pollutant transport is conservative in streams and rivers. No instream processes significantly alter concentrations. This assumption can be relaxed by applying the loadings determined to a water quality simulation model, such as WASP. the modeled downstream concentrations are compared to the average of the observed concentrations without differentiating whether the observed concentrations occurred during periods of high flow or base flow. A more detailed study might classify the observations according to the state of the flow at which they were measured to determine if concentration shows significant variations with discharge. point sources have not been separately accounted for in the pollutant loading calculations, although it is clear that the City of Beeville is potentially a significant point source. The advantages of the GIS-based non-point source pollution assessment method described here are: it makes use of all the recorded flow and concentration data in the basin and synthesizes them in a logical way that is consistent across the basin. the data sources used are all publicly available in digital form. The work of making such a study on a region of several thousand square kilometers in area is not large. The procedures to be employed use standard GIS routines without the need for special programming extensions. the principal data imported from outside the South Texas region is the table of values relating land use to expected pollutant concentration (Table 1). By comparing observed stream concentrations with those computed from the tabular relation, the validity of the relation can be examined and adjusted for each pollutant. For phosphorus, the expected concentrations used for 22
24 rangeland and forest appear to be appropriate for the San Antonio - Nueces Coastal Basin while those for agricultural land may be too low. For nitrogen, the expected concentrations used are too low for all land uses and need to be adjusted upward. the spatial analysis over the basin shows spatial patterns of pollutant levels and highlights areas where additional sampling is needed. In particular, sampling should be conducted on agricultural land use areas in the Aransas watershed, and in the Aransas river downstream of Beeville. Acknowledgments This research was supported in part by grants from the Texas Natural Resource Conservation Commission and the Texas Water Resources Institute. The cooperation of Angela Miller and Richard Kiesling of TNRCC, and of Darwin Ockerman of the US Geological Survey is gratefully acknowledged. List of Figures 1. Location of the San Antonio - Nueces Coastal Basin. 2. Outline of steps followed for the nonpoint source pollution assessment Method. 3. Drainage network and main watersheds of the basin laid over its digital elevation model grid. 4. Processing the digital elevation data 5. Drainage areas of the five stream gages in the basin. 6. (a) Mean annual precipitation grid (mm/yr) (b) Relation between mean annual precipitation and runoff (c) Mean annual runoff grid (mm/yr) 7. Land use map of the basin 8. Expected mean concentration of phosphorus computed as a function of land use (mg/l). 9. Mean annual loading of phosphorus (kg/yr) 10. (a) Expected concentration of phosphorus compared to the observed concentrations. (b) Expanded view of (a) in the region downstream of Beeville. 11. Expected concentration of total nitrogen compared to observed concentrations. List of Tables 1. Relation between land use and expected pollutant concentrations (supplied by courtesy of the Natural Resources Conservation Service). 23
25 References Daly, C., R.P. Neilson and D.L. Phillips (1994), A Statistical-Topographic Model for Mapping Climatological Precipitation over Mountainous Terrain, Journal of Applied Meteorology, 33, Saunders, W.K. and D.R. Maidment (1995), Grid-Based Watershed and Stream Network Delineation for the San Antonio - Nueces Coastal Basin, Proceedings, Texas Water '95, Texas Section, American Society of Civil Engineers, San Antonio, Texas, August 16-17, 1995, pp Texas Natural Resources Conservation Commission (1994), Regional Assessment of Water Quality in the Nueces Coastal Basins, TNRCC, Austin, TX. USDA Natural Resources Conservation Service (1995), Characterization of Nonpoint Sources and Loadings to Corpus Christi Bay National Estuary Program Study Area (DRAFT), USDA-NRCS, Temple, TX. 24
Table of Contents. Table of Figures
 Appendix A: Modeling Report Little Manatee WBID: 1790 Nutrients and Dissolved Oxygen September 30, 2009 Table of Contents 1. WATERSHED DESCRIPTION... 1 2. TMDL TARGETS... 2 3. MODELING APPROACH... 2 3.1.
Little Cypress Bayou Special Study - Subwatershed 1.10
 - Subwatershed 1.1 Sabine River Authority of Texas August 31, 21 Prepared in Cooperation with the Texas Natural Resource Conservation Commission Under the Authorization of the Texas Clean Rivers Act Table
by Keith Kennedy Manager of Environmental Programs North Central Texas Council of Governments
 by Keith Kennedy Manager of Environmental Programs North Central Texas Council of Governments What is NPDES? National Pollutant Discharge Elimination System USEPA outfall permitting program Storm water
World Environmental and Water Resources Congress 2008
 World Environmental and Water Resources Congress 2008 Honolulu, Hawai`i May 12-16, 2008 Bacterial Total Maximum Daily Load Analysis for Copano Bay Stephanie L. Johnson 1, David R. Maidment 2, Mary Jo Kirisits
Journal of Hydrology 263 (2002) Discussion
 Discussion") Journal of Hydrology 263 (2002) 257 261 Discussion Comment on the paper: Basin hydrologic response relations to distributed physiographic descriptors and climate by Karen Plaut Berger, Dara Entekhabi,
Journal of Hydrology 263 (2002) 257 261 Discussion Comment on the paper: Basin hydrologic response relations to distributed physiographic descriptors and climate by Karen Plaut Berger, Dara Entekhabi,
GIS as a Tool for Assisting TMDL Development
 GIS as a Tool for Assisting TMDL Development by Reem Zoun Jon Goodall Tim Whiteaker David Maidment, Ph.D. Center for Research in Water Resources University of Texas at Austin July 10, 2003 Outline Overview
WATER QUALITY SUMMARIES, CONCLUSIONS, and RECOMMENDATIONS of the 2018 BASIN SUMMARY REPORT
 WATER QUALITY SUMMARIES, CONCLUSIONS, and RECOMMENDATIONS of the 2018 BASIN SUMMARY REPORT San Antonio-Nueces Coastal Basin Nueces River Basin Nueces-Rio Grande Coastal Basin Bays and Estuaries 1 This
Lab 5: Watershed hydrology
 Lab 5: Watershed hydrology Objectives In this lab, you will learn the fundamentals of flow routing and channel network extraction, and analyze precipitation and discharge data to explore the control of
4.0 SAN GABRIEL RIVER WATERSHED MANAGEMENT AREA
 4.0 SAN GABRIEL RIVER WATERSHED MANAGEMENT AREA 4.1 Watershed Description 4.1.1 Watershed Land Use, Percent Impervious, and Population Land use in the San Gabriel River Watershed Management Area is approximately
Texas State Soil and Water Conservation Board Section 319(h) Nonpoint Source Program FY 2006 Project Grant Application
 Nonpoint Source Program FY 2006 Project Grant Application") Texas State Soil and Water Conservation Board Section 319(h) Nonpoint Source Program FY 2006 Project Grant Application NONPOINT SOURCE SUMMARY PAGE for the CWA, Section 319(h) Agricultural/Silvicultural
Texas State Soil and Water Conservation Board Section 319(h) Nonpoint Source Program FY 2006 Project Grant Application NONPOINT SOURCE SUMMARY PAGE for the CWA, Section 319(h) Agricultural/Silvicultural
1 THE USGS MODULAR MODELING SYSTEM MODEL OF THE UPPER COSUMNES RIVER
 1 THE USGS MODULAR MODELING SYSTEM MODEL OF THE UPPER COSUMNES RIVER 1.1 Introduction The Hydrologic Model of the Upper Cosumnes River Basin (HMCRB) under the USGS Modular Modeling System (MMS) uses a
Hydrological design of flood reservoirs by utilization of GIS and remote sensing
 Remote Sensing and Geographic Information Systems for Design and Operation of Water Resources Systems (Proceedings of Rabat Symposium S3, April 1997). IAHS Publ. no. 242, 1997 173 Hydrological design of
Impacts of Rainfall Events on Water Quality in the Houston Metro Area
 Impacts of Rainfall Events on Water Quality in the Houston Metro Area Hanadi Rifai and Anuradha Desai Civil and Environmental Engineering University of Houston, Houston, TX Acknowledgments TCEQ EPA Houston
Long-term change of stream water quality as a consequence of watershed development and management
 Long-term change of stream water quality as a consequence of watershed development and management T. Kinouchi, K. Musiake Department of Environment System Management, Fukushima University, Japan kinouchi@sss.fukushima-u.ac.jp.
5.0 LOS ANGELES RIVER WATERSHED MANAGEMENT AREA
 5.0 LOS ANGELES RIVER WATERSHED MANAGEMENT AREA 5.1 Watershed Description 5.1.1 Watershed Land Use, Percent Impervious, and Population The Los Angeles Watershed Management Area has more than half its area
CONTINUOUS TURBIDITY MONITORING AND REGRESSION ANALYSIS TO ESTIMATE TOTAL SUSPENDED SOLIDS AND FECAL COLIFORM BACTERIA LOADS IN REAL TIME
 CONTINUOUS TURBIDITY MONITORING AND REGRESSION ANALYSIS TO ESTIMATE TOTAL SUSPENDED SOLIDS AND FECAL COLIFORM BACTERIA LOADS IN REAL TIME By Victoria G. Christensen, Andrew C. Ziegler, and Xiaodong Jian
Comparison of Streamflow and Precipitation in the Upper Provo River Watershed
 Comparison of Streamflow and Precipitation in the Upper Provo River Watershed By: Steven McKee CEE 6440 GIS in Water Resources Final Project 12/6/2012 0 Table of Contents Introduction... 2 Methods to Determine
Globeville Landing Outfall Surface Water. December 12, 2017 Andrew Ross, Jon Novick Denver Department of Public Health & Environment
 Globeville Landing Outfall Surface Water December 12, 2017 Andrew Ross, Jon Novick Denver Department of Public Health & Environment Introductions Andrew Ross Environmental Program Manager, DDPHE Jon Novick
A GIS ASSESSMENT OF NONPOINT SOURCE POLLUTION IN THE SAN ANTONIO-NUECES COASTAL BASIN
 CRWR Online Report 96-1 A GIS ASSESSMENT OF NONPOINT SOURCE POLLUTION IN THE SAN ANTONIO-NUECES COASTAL BASIN by William Kelley Saunders, B.S.E.P., M.S.C.E. Graduate Research Assistant and David R. Maidment,
Development of the Long Term Hydrologic Impact Assessment (LTHIA) WWW Systems
 WWW Systems") This paper was peer-reviewed for scientific content. Pages 1018-1023. In: D.E. Stott, R.H. Mohtar and G.C. Steinhardt (eds). 2001. Sustaining the Global Farm. Selected papers from the 10th International
This paper was peer-reviewed for scientific content. Pages 1018-1023. In: D.E. Stott, R.H. Mohtar and G.C. Steinhardt (eds). 2001. Sustaining the Global Farm. Selected papers from the 10th International
Effects of Land Cover Changes on the Austin-Travis Lakes Watershed
 TERM PROJECT REPORT Effects of Land Cover Changes on the Austin-Travis Lakes Watershed Written By: Mengjia Tang (mt33793) Environmental and Water Resources Engineering University of Texas at Austin Instructed
Monitoring Stormwater Best Management Practices: Why Is It Important and What To Monitor
 Monitoring Stormwater Best Management Practices: Why Is It Important and What To Monitor Scott D. Struck, Ph.D. US EPA, Urban Watershed Management Branch New Jersey Water Monitoring Workshop 4/20/2006
SECTION III: WATERSHED TECHNICAL ANALYSIS
 Trout Creek Watershed Stormwater Management Plan SECTION III: WATERSHED TECHNICAL ANALYSIS A. Watershed Modeling An initial step this study of the Trout Creek watershed was the selection of a stormwater
Development of a GIS Tool for Rainfall-Runoff Estimation
 Development of a GIS Tool for Rainfall-Runoff Estimation Ashraf M. Elmoustafa * M. E. Shalaby Ahmed A. Hassan A.H. El-Nahry Irrigation and Hydraulics Department, Ain Shams University, Egypt NARSS, Egypt
remote sensing application in San Diego Luis De La Torre San Diego State University June 2012 June 2013 Dr. Trent Biggs San Diego State University
 Water quality and quantity during low flow in urbanized watersheds: A combined fieldwork and remote sensing application in San Diego Luis De La Torre San Diego State University June 2012 June 2013 Dr.
Water Resources/Water Quality
 Water Resources/Water Quality From where does your drinking water come? How much land should be set aside for aquifer protection? Why should we care about Barton Springs? What are the effects (if any!)
TECHNICAL NOTE: ESTIMATION OF FRESH WATER INFLOW TO BAYS FROM GAGED AND UNGAGED WATERSHEDS. T. Lee, R. Srinivasan, J. Moon, N.
 TECHNICAL NOTE: ESTIMATION OF FRESH WATER INFLOW TO BAYS FROM GAGED AND UNGAGED WATERSHEDS T. Lee, R. Srinivasan, J. Moon, N. Omani ABSTRACT. The long term estimation of fresh water inflow to coastal bays
Tools to Improve Water Quality
 Tools to Improve Water Quality SARA Water Quality Modeling Tool Development Client: San Antonio River Authority (SARA) Firm: Lockwood, Andrews & Newnam, Inc. Category A: Studies, Research and Consulting
Models Overview: Purposes and Limitations
 Models Overview: Purposes and Limitations Pollutant load originates from: Point-source discharges (NPDES facilities) Info is available on the discharges (DMRs, etc.) Some are steady-flow, others are precip-driven
Bronx River Pollutant Loading Model Summary
 Bronx River Pollutant Loading Model Summary Section of River Located in Bronx County Table of Contents Drainage Areas...2 Data Sets Used for Analysis...2 Land Use Statistics...3 Model Calculations...3
Historical Water Quality Data Analysis, Pearson Creek, Springfield, Missouri
 The Ozarks Environmental and Water Resources Institute (OEWRI) Missouri State University (MSU) Historical Water Quality Data Analysis, Pearson Creek, Springfield, Missouri Prepared by: Marc R. Owen, M.S.,
2
 1 2 3 4 5 6 The program is designed for surface water hydrology simulation. It includes components for representing precipitation, evaporation, and snowmelt; the atmospheric conditions over a watershed.
Oso Creek and Oso Bay Data Report
 Oso Creek and Oso Bay Data Report February 2011 Prepared by: Texas Stream Team River Systems Institute Texas State University San Marcos This report was prepared in cooperation with the Texas Commission
B1. Monitoring Stream Nitrogen Concentrations
 B1. Monitoring Stream Nitrogen Concentrations Author: David Wall, MPCA Assistance with project design, data analysis and mapping provided by: David Lorenz, Abigail Tomasek, and Chris Sanocki (U.S. Geologic
APPENDIX B: POLLUTANT LOADING ANALYSIS. Appendix B: Pollutant Loading Analysis
 APPENDIX B: POLLUTANT LOADING ANALYSIS Appendix B: Pollutant Loading Analysis This page has been intentionally left blank. Appendix B: Pollutant Loading Analysis Appendix B Pollutant Loading Analysis Methodology
Technical Memorandum. 1.0 Introduction
 Technical Memorandum To: Jennifer Saran and Christie Kearney, Poly Met Mining, Inc. Project: 23/69-0862.12 100 001 c: Keith Hanson and Tina Pint, Barr Engineering Co. Disclaimer: This is a working document.
2014 ASSINIBOINE RIVER MONITORING REPORT
 October 15, 2014 Temperature º C 9.7 9.6 9.6 9.6 9.7 9.7 10.1 10.2 10.1 Dissolved Oxygen mg/l 10.3 10.2 10.2 10.3 10.1 10.2 10.2 10.2 10.2 Conductivity ms/cm 1.262 1.235 1.253 1.307 1.315 1.307 1.322 1.32
Technical Memorandum No Basis of Comparison
 Pajaro River Watershed Study in association with Technical Memorandum No. 1.2.1 Basis of Comparison Task: Basis of Comparison To: PRWFPA Staff Working Group Prepared by: J. Schaaf Reviewed by: R. Raines
5. Basin Evaluation Salt and Nitrate Balance
 SNMP Attachment B, Section B.2.1.3 (originally Section 5 in CV-SALTS Phase 2 Conceptual Model Task 5 deliverables) 5. As part of the evaluation of water quality the SNMP requires loading estimates and
Pennsylvania Pequea and Mill Creek Watershed Section 319 National Monitoring Program Project
 Pennsylvania Pequea and Mill Creek Watershed Section 319 National Monitoring Program Project Figure 36: Pequea and Mill Creek (Pennsylvania) Watershed Project Location 231 T-1 C-1 T1-3 T-4 C1-2 T2-3 T-2
DOE/PPPO/ &D1 FBP-ER-PRO-WD-RPT-0001 Revision 3 April ENVIRONMENTAL NON-RADIOLOGICAL PROGRAM INFORMATION
 5. ENVIRONMENTAL NON-RADIOLOGICAL PROGRAM INFORMATION 5.1 SUMMARY Non-radiological environmental monitoring at PORTS includes air, water, sediment, and fish. Monitoring of non-radiological parameters is
Flood forecasting model based on geographical information system
 192 Remote Sensing and GIS for Hydrology and Water Resources (IAHS Publ. 368, 2015) (Proceedings RSHS14 and ICGRHWE14, Guangzhou, China, August 2014). Flood forecasting model based on geographical information
Determining upstream/downstream spatial distribution among point sources: Comparison of GIS-based methods
 [Add your own pictures here] Determining upstream/downstream spatial distribution among point sources: Comparison of GIS-based methods Ziyan Chu 2013 Esri International User Conference San Diego, CA RFF
Re: Request for proposal - TAES Water Conservation and Soil Management
 Temple, August 9, 2002 Re: Request for proposal - TAES Water Conservation and Soil Management Rosemary Payton Texas Water Resources Institute 1500 Research Parkway, Suite 240 2118 TAMU College Station,
Flood forecasting model based on geographical information system
 doi:10.5194/piahs-368-192-2015 192 Remote Sensing and GIS for Hydrology and Water Resources (IAHS Publ. 368, 2015) (Proceedings RSHS14 and ICGRHWE14, Guangzhou, China, August 2014). Flood forecasting model
Retrospective analysis of hydrologic impacts in the Chesapeake Bay watershed
 Retrospective analysis of hydrologic impacts in the Chesapeake Bay watershed Harsh Beria1,3, Rob Burgholzer2, Venkat Sridhar3 Indian Institute of Technology Kharagpur, India & Summer intern Virginia Department
SimWater: Simulating Water Supply, Demand, and Management Mountains to Valley: Balancing forests, rivers, and downstream water users
 Name: Date: SimWater: Simulating Water Supply, Demand, and Management Mountains to Valley: Balancing forests, rivers, and downstream water users Water managers are entrusted to best allocate water based
Watershed Modeling of Copper Loads to San Francisco Bay
 Watershed Modeling of Copper Loads to San Francisco Bay Tony Donigian AQUA TERRA Consultants Brake Pad Partnership Stakeholder Conference July 31, 2007 Watershed Model Objectives - Provide daily loadings
MODELING PHOSPHORUS LOADING TO THE CANNONSVILLE RESERVOIR USING SWAT
 MODELING PHOSPHORUS LOADING TO THE CANNONSVILLE RESERVOIR USING SWAT Bryan Tolson 1 & Christine Shoemaker 2 1. PhD Student, 2. Professor School of Civil & Environmental Engineering Cornell University PWT
Appendix 5. Fox River Study Group Interim Monitoring Evaluation
 Appendix 5. Fox River Study Group Interim Monitoring Evaluation Introduction Submitted to Fox River Study Group 6 March 3 The purpose of this report is to review data collected by the Fox River Study Group
River flow routing using Hydrosheds for North America
 River flow routing using Hydrosheds for North America Wen-Ying Wu (wenying@utexas.edu), Jackson School of Geosciences, The University of Texas at Austin Term Project for GIS November,2016 Abstract HydroSHEDS
Drought effects on the timing and influent water quality to Barr Lake, Colorado
 Hydrology Days 2005 Drought effects on the timing and influent water quality to Barr Lake, Colorado Curtis Cooper Department of Soil and Crop Sciences, Colorado State University, Fort Collins 80523-1170.
STORMWATER POLLUTANT ASSESSMENT AT THE CITY OF KISSIMMEE
 STORMWATER POLLUTANT ASSESSMENT AT THE CITY OF KISSIMMEE Eric Gurr and Fidelia Nnadi Department of Civil and Environmental Engineering University of Central Florida, Orlando, FL ABSTRACT Historically,
Appendix 7. Descriptions of Water Quality Models
 Appendix 7. Descriptions of Water Quality Models Watershed Loading Models An ArcView GIS Tool for Pollutant Load Application (PLOAD) Model Objective. The PLOAD model was designed to be a screening tool
GreenPlan Modeling Tool User Guidance
 GreenPlan Modeling Tool User Guidance Prepared by SAN FRANCISCO ESTUARY INSTITUTE 4911 Central Avenue, Richmond, CA 94804 Phone: 510-746-7334 (SFEI) Fax: 510-746-7300 www.sfei.org Table of Contents 1.
Recommendations for Refinement of a Spatially Representative Non-tidal Water Quality Monitoring Network for the Chesapeake Bay Watershed
 Recommendations for Refinement of a Spatially Representative Non-tidal Water Quality Monitoring Network for the Chesapeake Bay Watershed August 2005 Report of the Task Force on Non-tidal Water Quality
Eight Characterizing Trends in the Barnegat Bay Watershed, Ocean County, New Jersey
 Eight Characterizing Trends in the Barnegat Bay Watershed, Ocean County, New Jersey Gail P. Carter New Jersey Department of Environmental Protection Division of Science and Research, CN049 Trenton, New
Water Quality and Flow Building Blocks for Caddo Lake and Cypress Basin Flow-Ecology Workshop
 Water Quality and Flow Building Blocks for Caddo Lake and Cypress Basin Flow-Ecology Workshop December 2-4, 2008 Jefferson, TX Tim Osting Espey Consultants, Inc. 3809 S. 2nd Street, B-300 Austin, TX 78704
WATER QUALITY INDEX FOR THE SKUDAI RIVER AND ITS TRIBUTARIES FOR IDENTIFYING THE PROBLEMATIC AREAS FOR BETTER WATERSHED MANAGEMENT
 WATER QUALITY INDEX FOR THE SKUDAI RIVER AND ITS TRIBUTARIES FOR IDENTIFYING THE PROBLEMATIC AREAS FOR BETTER WATERSHED MANAGEMENT I.B. Naubi 1, N.H. Zardari 1, *, S.M. Shirazi 1, M.T. Shazwin 1 1 Department
Sugar Creek Watershed Watershed Number:
 Watershed Watershed Number: 512511 Location Map Mercer Jessam ine %g 27 %g15 41 Harrodsburg Burgin %g 152 %g 39 %g1268 Sugar C reek W atershed Richm ond %g1355 %g 876 Madison %g 34 %g 595 Boyle Danville
Communicating Models to Stakeholders. Nikki Dictson Texas Water Resources Institute
 Communicating Models to Stakeholders Nikki Dictson Texas Water Resources Institute Communicating to Stakeholders Throughout the process, there is a continuous need to inform, engage, and motivate water
LAVACA BASIN SUMMARY REPORT
 LAVACA BASIN SUMMARY REPORT July, 2002 Lavaca-Navidad River Authority PO Box 429 Edna, Texas 77957 Paul Price Associates, Inc. 3006 Bee Caves Road, Suite D-230 Austin, Texas 78746 Prepared in cooperation
Module 2 Measurement and Processing of Hydrologic Data
 Module 2 Measurement and Processing of Hydrologic Data 2.1 Introduction 2.1.1 Methods of Collection of Hydrologic Data 2.2 Classification of Hydrologic Data 2.2.1 Time-Oriented Data 2.2.2 Space-Oriented
TMDL Data Requirements for Agricultural Watersheds
 This is not a peer-reviewed article. Pp. 408-415 in Total Maximum Daily Load (TMDL) Environmental Regulations: Proceedings of the March 11-13, 2002 Conference, (Fort Worth, Texas, USA) Publication Date
Water Quality Study In the Streams of Flint Creek and Flint River Watersheds For TMDL Development
 Water Quality Study In the Streams of Flint Creek and Flint River Watersheds For TMDL Development Idris Abdi Doctoral Dissertation Presentation Major Advisor: Dr. Teferi Tsegaye April 18, 2005 Alabama
7 Section 7: Land to Water
 7 Section 7: Land to Water 7.1 Introduction As discussed in Section 1, the multiple modeling approach permits P6 to represent processes on a finer scale than previous versions of the Watershed Model. Table
Overview of NRCS (SCS) TR-20 By Dr. R.M. Ragan
 TR-20 By Dr. R.M. Ragan") Overview of NRCS (SCS) TR-20 By Dr. R.M. Ragan TR-20 is a computer program for the simulation of runoff occurring from a single storm event. The program develops flood hydrographs from runoff and routes
Overview of NRCS (SCS) TR-20 By Dr. R.M. Ragan TR-20 is a computer program for the simulation of runoff occurring from a single storm event. The program develops flood hydrographs from runoff and routes
DEVELOPMENT OF HYDROGRAPHIC DATASET FOR TURKEY: INITIAL STUDIES
 DVLOPMNT OF HYDROGRPHIC DTST FOR TURKY: INITIL STUDIS Serkan Girgin 1, Zuhal kyürek 2, Nurünnisa Usul 3 1 Middle ast Technical University, Department of nvironmental ngineering İnönü Bulvarı, 06531, nkara-turkey,
Term Project. NFIE-River: Cross section approximations for hydraulic channel routing model in the San Antonio and Guadalupe River Basins.
 Flood Forecasting Spring - 2015 Due Friday 05/08/2015 Alfredo Hijar Term Project NFIE-River: Cross section approximations for hydraulic channel routing model in the San Antonio and Guadalupe River Basins.
CADDO LAKE WATERSHED PROTECTION PLAN Technical Memo (Task 1.2.3)
") CADDO LAKE WATERSHED PROTECTION PLAN Technical Memo (Task 1.2.3) Prepared for: Northeast Texas Municipal Water District 4180 FM 250 P.O. Box 955 Hughes Springs, TX 75656 By: Espey Consultants, Inc. EC
CADDO LAKE WATERSHED PROTECTION PLAN Technical Memo (Task 1.2.3) Prepared for: Northeast Texas Municipal Water District 4180 FM 250 P.O. Box 955 Hughes Springs, TX 75656 By: Espey Consultants, Inc. EC
Water Quality Index Assessment for the Skudai Watershed and its Tributaries
 Water Quality Index Assessment for the Skudai Watershed and its Tributaries Irena Naubi 1, Noorul Hassan Zardari 2, *, Sharif Moniruzzaman Shirazi 2, Shazwin Binti Mat Taib 2 1 Department of Hydraulics
Chapter 2: Conditions in the Spring Lake Watershed related to Stormwater Pollution
 Chapter 2: Conditions in the Spring Lake Watershed related to Stormwater Pollution To identify the primary causes and consequences of stormwater discharges to Spring Lake and its adjoining waterbodies,
Summary of Basin Characteristics and Facilities. General Land-use Characteristics: Withdrawal and Discharge Sites: Sampling Site Statistics:
 -Digit Watershed Identity Number: 28 This report was prepared by the Kentucky Water Research Institute as a product of the statewide Kentucky Watershed Management process. Information presented in this
2008 AWRA Spring Specialty Conference March 17-19, 2008
 THE SAN FRANCISCO BAY WATERSHED MODEL FOR COPPER RUNOFF FROM BRAKE PAD WEAR DEBRIS: Part II Model Application and Results Anthony S. Donigian, Jr., Brian R. Bicknell, James N. Carleton, and Kirsten Sinclair
2.f. Two Parameter Comparisons
 2.f. Two Parameter Comparisons http://wql-data.heidelberg.edu/index2.html 9/27/05 Introduction Sometimes it is useful to study the relationships between two parameters in a stream. For example the relationships
USING ARCSWAT TO EVALUATE EFFECTS OF LAND USE CHANGE ON WATER QUALITY. Adam Gold Geog 591
 USING ARCSWAT TO EVALUATE EFFECTS OF LAND USE CHANGE ON WATER QUALITY Adam Gold Geog 591 Introduction The Soil and Water Assessment Tool (SWAT) is a hydrologic transport model with an objective to predict
SAN BERNARD RIVER ABOVE TIDAL - SEGMENT 1302
 SAN BERNARD RIVER ABOVE TIDAL - SEGMENT 1302 SAN BERNARD RIVER ABOVE TIDAL - SEGMENT 1302 LAND COVER BACTERIA DISSOLVED OXYGEN NUTRIENTS Impairment Concern No Impairments or Concerns SAN BERNARD RIVER
Sandies Creek Watershed
 SH 97 Sandies Creek Watershed Gonzales De Witt FM 1116 Sandies Creek SH 72 FM 240 FM 466 Sandies Creek Karnes Smiley Elm Creek FM 108 US 87 SH 80 FM 1117 Guadalupe FM 1681 Wilson Nixon 13657 1803B 1803B
A Comparison of SWAT and HSPF Models for Simulating Hydrologic and Water Quality Responses from an Urbanizing Watershed
 Paper Number: 032175 An ASAE Meeting Presentation A Comparison of SWAT and HSPF Models for Simulating Hydrologic and Water Quality Responses from an Urbanizing Watershed S. Im, Post-doc Research Associate
Narrative Water Quality Objective
 Narrative Water Quality Objective Waste discharges shall not contribute to excessive algal growth in inland surface receiving waters. (Basin Plan, 1995, pg. 4-5) Excessive is not defined No numeric standard
INVESTIGATING WATERSHEDS
 NAME DATE PARTNER(S) INVESTIGATING WATERSHEDS Rainfall or any form of precipitation collects on lawns, streets, and fields and runs directly into streams or into storm drains (where it is piped to streams).
Alix Scarborough, Project Manager. Melissa Keen, GIS Analyst. Matthew Leach, GIS Analyst. Chad Sydow, GIS Analyst
 Alix Scarborough, Project Manager Melissa Keen, GIS Analyst Matthew Leach, GIS Analyst Chad Sydow, GIS Analyst Watershed and Tree Canopy Association in Austin, TX Project Proposal Prepared by Trees in
Stream Reaches and Hydrologic Units
 Chapter United States 6 Department of Agriculture Natural Resources Conservation Service Chapter 6 Stream Reaches and Hydrologic Units Rain clouds Cloud formation Precipitation Surface runoff Evaporation
Salt Lake County Watershed Water Quality Model
 Salt Lake County Watershed Water Quality Model Watershed Symposium August 5, 2010 Presenters: Nicholas von Stackelberg Bryan Close Slide 1 Presentation Overview Background and Model Objectives (Nick) Model
Water Resources Element Appendix
 Appendix Housing Unit Projection Methodology The following assumptions were used to develop the housing unit projections for each Water Resources Element. All projections described in the and this Appendix
ICELANDIC RIVER / WASHOW BAY CREEK INTEGRATED WATERSHED MANAGEMENT PLAN STATE OF THE WATERSHED REPORT CONTRIBUTION SURFACE WATER HYDROLOGY REPORT
 ICELANDIC RIVER / WASHOW BAY CREEK INTEGRATED WATERSHED MANAGEMENT PLAN STATE OF THE WATERSHED REPORT CONTRIBUTION SURFACE WATER HYDROLOGY REPORT Disclaimer: The hydrologic conditions presented in this
Nehalem River Watershed Assessment 1
 Nehalem River Watershed Assessment 1 1.0 Introduction Purpose Watershed assessment is a process for evaluating how well a watershed is working. The purpose of this assessment was to determine how natural
Flow and sediment yield simulations for Bukit Merah Reservoir catchment, Malaysia: a case study
 2170 IWA Publishing 2012 Water Science & Technology 66.10 2012 Flow and sediment yield simulations for Bukit Merah Reservoir catchment, Malaysia: a case study Zorkeflee Abu Hasan, Nuramidah Hamidon, Mohd
1 n. Flow direction Raster DEM. Spatial analyst slope DEM (%) slope DEM / 100 (actual slope) Flow accumulation
 slope DEM / 100 (actual slope) Flow accumulation") 1 v= R S n 2/3 1/2 DEM Flow direction Raster Spatial analyst slope DEM (%) Flow accumulation slope DEM / 100 (actual slope) 0 = no cell contributing 215 = 215 cell contributing towards that cell sqrt (actual
1 v= R S n 2/3 1/2 DEM Flow direction Raster Spatial analyst slope DEM (%) Flow accumulation slope DEM / 100 (actual slope) 0 = no cell contributing 215 = 215 cell contributing towards that cell sqrt (actual
Water Quality indicators and How Human Activities Affect Water Quality
 Water Quality indicators and How Human Activities Affect Water Quality Name: Online Assignment: Period: Date: Purpose: to learn how to evaluate water quality and how pollution can make water unavailable
Is this the right tool for your needs? Lester McKee San Francisco Estuary Institute (SFEI) May 2001
 May 2001") The use of the Simple Model for informing environmental science and management: Is this the right tool for your needs? Lester McKee San Francisco Estuary Institute (SFEI) May 2001 Fact: Field data collection
The use of the Simple Model for informing environmental science and management: Is this the right tool for your needs? Lester McKee San Francisco Estuary Institute (SFEI) May 2001 Fact: Field data collection
 5. MODEL DESCRIPTION Several models were used in combination to estimate the impacts of the proposed 100,000 acre-ft dryyear yield program. MODFLOW and MODPATH were used to estimate the groundwater and
Falls Lake Watershed Analysis Risk Management Framework (WARMF) Development FINAL REPORT
 Development FINAL REPORT") Falls Lake Watershed Analysis Risk Management Framework (WARMF) Development FINAL REPORT Prepared by N.C. Department of Environment and Natural Resources Division of Water Quality Planning Section Modeling/TMDL
Falls Lake Watershed Analysis Risk Management Framework (WARMF) Development FINAL REPORT Prepared by N.C. Department of Environment and Natural Resources Division of Water Quality Planning Section Modeling/TMDL
Synthesis of Unit Hydrographs for Texas Watersheds
 Synthesis of Unit Hydrographs for Texas Watersheds Theodore G. Cleveland, UH William H. Asquith, USGS David B. Thompson, R.O. Anderson Xing Fang, Auburn University July 17, 2007 Acknowledgements Research
Continuous records for the Chariton River indicate that 2004 was an average water year, with total flow approximately equal to the average annual
 2004 Rathbun Report Iowa State University Limnology Laboratory John A. Downing, Ph.D. George Antoniou, Assistant Scientist For Rathbun Land and Water Alliance August 31, 2005 A. Tributaries Personnel of
Peach Creek Watershed
 SH 304 Peach Creek Watershed Bastrop Peach Cree FM 713 Caldwell Peach Creek, Sandy Fork Copperas Creek 1803C Peach Creek Fayette FM 1054 US 90 Waelder US IH US 90 FM 1680 IH 10 Dry Run Gonzales SH 97 Peach
Irrigation. Branch. Crowfoot Creek Watershed Study. Why was this study conducted? How was this study conducted?
 AGRICULTURE, FOOD AND RURAL DEVELOPMENT Irrigation Branch Crowfoot Creek Watershed Study The Crowfoot Creek Study was conducted to determine whether agricultural practices are contributing to the deterioration
Executive Summary EXECUTIVE SUMMARY. ES.1 Monitoring Program Objectives. ES.2 Summary of Monitoring Results
 EXECUTIVE SUMMARY ES.1 Monitoring Program Objectives The following are the major monitoring program objectives, as outlined in the Municipal Stormwater Permit: Assess compliance with the Municipal Stormwater
International Journal of Scientific & Engineering Research, Volume 5, Issue 7, July-2014 ISSN Sruthy Nattuvetty Manoharan
 ISSN 2229-5518 210 Sruthy Nattuvetty Manoharan Department of Civil Engineering Government Engineering College, Thrissur Thrissur, 680009 sruthy.n.m@gmail.com a spatially distributed excess rainfall. It
Nitrate Load Reduction Strategies for the Raccoon and Des Moines Rivers. Keith Schilling, Calvin Wolter Iowa DNR Geological and Water Survey
 Nitrate Load Reduction Strategies for the Raccoon and Des Moines Rivers Keith Schilling, Calvin Wolter Iowa DNR Geological and Water Survey Outline of Presentation Background of nitrate impairments Nitrate