P.O. Box 1749 Halifax, Nova Scotia B3J 3A5 Canada Item No. 2 North West Community Council July 17, 2017
|
|
|
- Archibald Fitzgerald
- 6 years ago
- Views:
Transcription
1 P.O. Box 1749 Halifax, Nova Scotia B3J 3A5 Canada Item No. 2 North West Community Council July 17, 2017 TO: Chair and Members of North West Community Council Original Signed SUBMITTED BY: Bob Bjerke, Director and Chief Planner, Planning & Development DATE: May 30, 2017 SUBJECT: Bedford West Water Quality Status Update INFORMATION REPORT ORIGIN Bedford Municipal Planning Strategy, Bedford West Secondary Planning Strategy, Policies BW-3, BW-4, and BW-5. Development Agreements between Halifax Regional Municipality and West Bedford Holdings Ltd, and between Halifax Regional Municipality and Cresco Ltd. LEGISLATIVE AUTHORITY The Halifax Regional Municipality Charter, Part VIII, Planning and Development, Section 240, Development Agreements.
2 Bedford West Water Quality Status Update Community Council Report July 17, 2017 BACKGROUND The Bedford West Secondary Planning Strategy, Policy BW-3, requires that a water quality monitoring program be undertaken for the Paper Mill Lake watershed to track the eutrophication process. Eutrophication is the process by which lakes naturally accumulate nutrients and biological material. This process is typically accelerated through the impacts of human activities, resulting in relatively rapid changes in trophic state, from lower states (fewer nutrients) to higher states (more nutrients), with corresponding changes in appearance, functional uses, and amenity values. The program was specified in the Planning Strategy in response to the Municipality s stated desire to stem the decline of lakes from the accelerated process of eutrophication, and sedimentation and inputs from other urban runoff, as published in the former Regional Municipal Planning Strategy. 1 The terms of the monitoring program are specified within Development Agreements that have been negotiated in consultation with the Bedford Watershed Advisory Board1 2 until its dissolution in 2013, and the Regional Watersheds Advisory Board since All such agreements have identified the value of 10 micrograms per Litre (µg/l) of Total Phosphorus as a trigger value, representing the transition point between the second-lowest trophic state (oligotrophic) to the next-highest trophic state (mesotrophic) per Environment Canada criteria (see Table 1). Trophic Status TP (µg/l) Ultra-oligotrophic < 4 Oligotrophic 4-10 Mesotrophic Meso-eutrophic Eutrophic Hypereutrophic > 100 Table 1. Summary of Canadian trophic state trigger ranges. From Environment Canada (2004). The municipality is required to submit test results to the Developer, the Community Council, and BWAB (now RWAB) within three months of being received from the consultant, or immediately, if total phosphorus ( TP ) or bacterial results exceed management thresholds identified therein. Furthermore, in spring 2015, staff reviewed historic contractor reports submitted from spring 2012 through fall 2014 and realized that a high proportion of water quality samples had TP results exceeding the trigger value of 10µg/L. This trend consequently initiated a three-phase assessment process to better understand the TP occurrences and to help devise a future approach to watershed management as follows: Phase 1: Report and discuss the TP exceedance findings with the developer and conduct a detailed assessment of existing water quality data from the Paper Mill Lake watershed to identify trends in Total Phosphorus measurements, considering CCME Guidelines. Phase 2: Investigate cause(s) of high TP measurements, considering all significant land uses and activities that have occurred in the Paper Mill Lake watershed since the inception of the monitoring program. Phase 3: Determine a course of action respecting watershed management and future land use development in the area. 1 The current Regional Municipal Planning Strategy states this objective as follows: This Plan will seek to maintain the existing trophic status of our lakes and waterways to the extent possible. 2 RWAB assumed the functions previously performed by BWAB respecting Bedford West SPS once it began conducting meetings in July 2013.
3 Bedford West Water Quality Status Update Community Council Report July 17, 2017 DISCUSSION This report presents an update to Council on the status of the assessment process regarding TP and water quality monitoring for Bedford West and the findings of the October 2016 monitoring event. Phase 1 (conduct detailed assessment of existing water quality data from the Paper Mill Lake watershed) was initiated in June 2015 and concluded in October of that year. The results of that phase were presented to NWCC in October Phase 2 (investigate cause(s) of high Total Phosphorus measurements) concluded in October 2016, with a presentation by Dalhousie University s Centre for Water Resource Studies delivered to NWCC in November 2016 and a staff report presented in January October TP Monitoring Event Summary The monitoring event held October 2016 found that total phosphorus concentrations exceeded the trigger value of 10 micrograms per Litre (10ug/L) at five of eleven stations monitored in October Staff will aim to submit any future reports of TP exceedance to Council more promptly. A summary of TP results observed at all stations during the October 2016 monitoring event is presented below in Table 2. These results only represent water quality at the time that the samples were collected, and as such have little significance on their own. Their value may be realized in the determination of whether water quality is trending towards a mesotrophic (or higher) trophic state, and in indicating possible sources of excess nutrient contributions. Sample Station Concentration Exceedance (µg/l) KL1 8 No KL2 13 Yes KL3 4 No KL4 7 No KL5 3 No HWY No HWY Yes LSD 12 Yes LU 12 Yes PML1 13 Yes PML2 5 No Table 2. Summary of TP results and exceedances October As noted in Table 2, five stations exceeded the TP trigger value. Although applicable Development Agreements allow the Municipality to require follow-up testing to confirm these results, this option was not selected due to the assessment process currently underway based on previous TP results exceeding the 10µg/L trigger value (Table 3).

4 Bedford West Water Quality Status Update Community Council Report July 17, 2017 Next Steps Phase 3, determining a course of action respecting watershed management and future land use development in the area, is now underway. This work is being performed within the context of a targeted watershed management and water quality program review, a key deliverable of Planning and Development s approved 2017/18 Business Plan. The review will consider what role lake-based water quality monitoring can play in providing decision-making support for land subdivision and development and the Municipality s role in monitoring watershed conditions through water quality monitoring. FINANCIAL IMPLICATIONS There are no financial implications for this report. COMMUNITY ENGAGEMENT No community engagement was required for this report. ATTACHMENTS Attachment A. Bedford West Water Quality Report October A copy of this report can be obtained online at then choose the appropriate Community Council and meeting date, or by contacting the Office of the Municipal Clerk at , or Fax Report Prepared by: Cameron Deacoff, Environmental Performance Officer, Original Signed Report Approved by: Holly Richardson, Acting Program Manager, Energy & Environment,


DOO 6DPSOLQJ")
LQDO 5HSRUW")

5 :DWHU 4XDOLW\ 0RQLWRULQJ 3URJUDP %HGIRUG :HVW %HGIRUG 16 )DOO 6DPSOLQJ (YHQW _ _ )LQDO 5HSRUW :DWHU 4XDOLW\ 0RQLWRULQJ )DOO 5HY &! 6/, UHI 7 ( 5(3
6 SNC-Lavalin Inc. Suite 200, Park Lane Terraces 5657 Spring Garden Road Halifax, Nova Scotia, Canada, B3J 3R January 4, 2017 Halifax Regional Municipality Energy and Environment PO Box 1749 Halifax, Nova Scotia B3J 3A5 Attention: Mr. Cameron Deacoff Dear Mr. Deacoff: RE: Final Report: Water Quality Monitoring Program, Fall 2016 Sampling Event Bedford West, Bedford, Nova Scotia SNC-Lavalin Inc. (SLI) is pleased to submit one electronic copy of the final report presenting the results of the fall 2016 surface water quality sampling event for the Bedford West Water Quality Monitoring Program in Bedford, Nova Scotia. If you have any questions or require clarification, please contact the undersigned at Yours truly, SNC LAVALIN INC. Original Signed Crysta Cumming, P. Eng Environmental Department Manager T-4E-REP _C01.docx Infrastructure
7 EXECUTIVE SUMMARY On October 25 and 26, 2016 SNC-Lavalin Inc. (SNCL) completed the Bedford West fall 2016 water quality monitoring sampling event on behalf of Halifax Regional Municipality (HRM). The sampling program consisted of collecting surface water samples from eleven (11) water quality sampling stations. Field parameters were recorded and samples collected for laboratory analyses. Based on HRM sampling schedule and analysis, the laboratory analysis included: Inorganics; Calculated Parameters; Standard Elements/Metals; and Microbiological analysis. Applicable water quality criteria included: Canadian Council of Ministers of the Environment (CCME) guidelines for the Protection of Aquatic Life Freshwater (PAL-F); Health Canada guidelines for Canadian Recreational Water Quality (2012, Third Edition); and Nova Scotia Environment (NSE) Environmental Quality Standards (EQS) for Surface Water, EQS for Contaminated Sites (NSE 2014) Table A2, Reference for Pathway Specific Standards for Surface Water Fresh Water. During the fall 2016 water quality monitoring event, the following four (4) parameters exceeded the recommended water quality criteria. Detailed information including station ID(s) and analytical results are outlined in the report: 1. Total Phosphorous (1m depth) 2. Dissolved Oxygen 3. ph (in Situ and Lab) 4. Metals (Total Iron and Total Zinc) WATER QUALITY MONITORING FALL 2016 FINAL REPORT T 4E REP /04/2017 HALIFAX REGIONAL MUNICIPALITY SNC Lavalin Inc All rights reserved. Confidential. i
8 TABLE OF CONTENTS EXECUTIVE SUMMARY... i 1 INTRODUCTION AND BACKGROUND METHODOLOGY ASSESSMENT STANDARDS FIELD OBSERVATIONS FIELD MEASUREMENTS ANALYTICAL RESULTS TOTAL PHOSPHOROUS GENERAL CHEMISTRY METALS MICROBIOLOGICAL STATISTICAL PRESENTATION GRAPHS CONCLUSIONS REFERENCES LIMITATIONS List of Tables Table 1: Bedford West Water Quality Sampling Stations...1 Table 2: Analytical Parameter Groups...3 Table 3: Surface Water Quality Monitoring Results...7 Table 4: Statistical Presentation of Key Water Quality Parameters...9 List of Figures Figure 1: Bedford West Water Quality Sampling Stations...2 Appendices Appendix A Appendix B Appendix C Appendix D Appendix E Instrument Calibration Report Field Reports Site Photographs Laboratory Certificates of Analysis Graphs WATER QUALITY MONITORING FALL 2016 FINAL REPORT 01/04/2017 HALIFAX REGIONAL MUNICIPALITY SNC Lavalin Inc All rights reserved. Confidential T 4E REP ii
9 1 INTRODUCTION AND BACKGROUND SNC-Lavalin Inc. (SNCL) has prepared this report to provide Halifax Regional Municipality (HRM) with water quality data for eleven (11) surface water stations throughout the Bedford West development area. Water quality monitoring in the Bedford West development area has been ongoing since SNCL was retained by HRM to complete water quality monitoring programs each spring, summer and fall for two years beginning in The results of the fall 2016 monitoring program are detailed herein. The overall purpose of the program is to conduct water quality sampling and testing prior to and during construction activities related to the development project in order to detect any impacts on and/or changes to water quality. The fall 2016 sampling stations are summarized in Table 1 and shown in Figure 1. Table 1: Bedford West Water Quality Sampling Stations Sample Location Updated Coordinates (UTM NAD 83) Water Course Name Easting Northing Kearney Lake KL-1 20T445718E N Kearney Lake KL-2 20T N Kearney Run KL-3 20T444390E N Kearney Run KL-4 20T444463E N Kearney Lake KL-5 20T E N Creek Above Highway HWY T444708E N Creek Below Highway HWY T444829E N Lake Shore Drive LSD 20T442583E N Larry Uteck Off-Ramp LU 20T444954E N Paper Mill Lake PML-1 20T445129E N Paper Mill Lake PML-2 20T445363E N WATER QUALITY MONITORING FALL 2016 FINAL REPORT 01 /04 /2017 HALIFAX REGIONAL MUNICIPALITY SNC Lavalin Inc All rights reserved. Confidential T 4E REP
10 HWY102-2! HWY102-1! PML2! PAPER M LAKE PML1! KL4! D KL3! KL2!! LU KEARNEY LAKE KL5! KL1! end
11 2 METHODOLOGY The fall 2016 water quality sampling event included the collection of Field Parameters (Group A) and surface water for laboratory analysis of: Inorganics (Group B); Calculated Parameters (Group C); Standard Elements/Metals (Group D); and Microbiological Analyses (Group E). Table 2 below summarizes the water quality parameters measured in the field or analyzed by the laboratory. Table 2: Analytical Parameter Groups Field Parameters (A) ph TDS Dissolved Oxygen Temperature Secchi Depth Conductance Air Temperature Cloud Cover Incidental Wildlife Sightings Inorganic (B) Calculated Parameters (C) Standard Metals (D) Microbiological (E) Total Alkalinity (as CaCO 3 ) Dissolved Chloride Colour Total Kjeldahl Nitrogen Nitrate + Nitrite Nitrate Nitrite Nitrogen (as NH4) Total Organic Carbon Orthophosphate (P) ph Low Total Phosphorus Reactive Silica Total Suspended Solids Dissolved Sulphate Turbidity Conductivity Anion Sum Cation Sum Ion Balance Bicarbonate Alkalinity(as CaCO 3 ) Carbonate Alkalinity (as CaCO 3 ) Hardness Total Dissolved Solids Saturation ph (@4 C & 20 C) Langelier Index (@4 C & 20 C) Calcium Copper Iron Magnesium Manganese Potassium Sodium Zinc Chlorophyll A E. coli Most Probable Number (MPN) or CFU per 100 ml All surface water samples and associated field parameters were collected on October 25, Due to unforeseen circumstances, secchi depth measurements at five (5) sampling locations were collected on October 26, Throughout the next sampling events, water samples and secchi depth measurements will be collected on the same day to represent same conditions. Field measurements of ph, dissolved oxygen, specific conductivity, water temperature and air temperature were taken at each station using an YSI PRO PLUS, instrument serial number The probe measures temperature, conductivity, DO, ph and ORP. The instrument is calibrated annually by the manufacturer and a pre-calibration was conducted by the provider (Pine Environmental) prior to WATER QUALITY MONITORING FALL 2016 FINAL REPORT T 4E REP /04 /2017 HALIFAX REGIONAL MUNICIPALITY SNC Lavalin Inc All rights reserved. Confidential. 3
12 conducting the water quality sampling event. See Appendix A, Instrument Calibration Report. Site conditions (i.e. weather, air temperature, cloud cover, site accessibility and wildlife sightings) and field parameters for each sampling location were recorded on a field report sheet. Each sample station was photographed during the sample event. Water samples and field parameter readings were collected within a depth of 1.0 m below surface. Water samples were collected from the shore at all sample locations. Surface water sampling followed SNCL s Standard Operating Procedures (SOP) for surface water sampling. A new pair of nitrile gloves was used at each sample location. Surface water samples were collected and placed in clean laboratory-supplied jars and stored in a chilled container together with a chain of custody record for transport to the laboratory. All surface water samples were submitted to AGAT Laboratories in Dartmouth, NS. 3 ASSESSMENT STANDARDS There is currently no national environmental quality guideline for phosphorus in freshwater aquatic environments. In the Canadian framework, trigger ranges are based on the trophic classification of the baseline condition. A trigger range is a desired concentration range for phosphorus; if the upper limit of the range is exceeded, it indicates potential for environmental quality issues, which triggers the need for further investigation. According to the Canadian Council of Ministers of the Environment (CCME) 10μg/L of total phosphorous is the threshold between oligotrophic and mesotrophic trophic classifications. For this water quality monitoring program, HRM defined a Total Phosphorous management threshold value of 10μg/L or 0.01mg/L. The Canadian Council of Ministers of the Environment (CCME) Guidelines for the Protection of Aquatic Life Freshwater (PAL-F) were used for parameter such as Dissolved Oxygen, ph (in Situ and Laboratory analysis), Dissolved Chloride, Nitrate, Nitrite, Nitrogen, as well as for total metals (i.e. Aluminum, Arsenic, Boron, Cadmium, Cooper, Iron, Lead, Molybdenum, Nickel, Selenium, Silver, Thallium, Uranium, and Zinc). For Total Suspended Solids (TSS), the CCME (2002) Water Quality Guidelines for the Protection of Aquatic Life at high flow conditions were applied. For TSS, the guideline value is equal to a maximum increase of 25 mg/l from background levels at any time when background levels are between 25 and 250 mg/l. When background concentrations are greater than 250 mg/l, the concentration should not increase more than 10% from background levels. The Health Canada guidelines for Canadian Recreational Water Quality (2012, Third Edition) were used for parameters such as Secchi Depth (i.e. the guidelines indicate that the clarity of the water should be sufficiently clear such that a Secchi disk is visible at a minimum depth of 1.2 WATER QUALITY MONITORING FALL 2016 FINAL REPORT 01 /04 /2017 HALIFAX REGIONAL MUNICIPALITY SNC Lavalin Inc All rights reserved. Confidential T 4E REP
13 metres); ph (guideline of ph); Turbidity (limit of 50 Nephelometric Turbidity Units); E. coli (400 MPN/100mL) and Fecal Coliform (400 MPN/mL). The Nova Scotia Environment (NSE) Environmental Quality Standards (EQS) for Contaminated Sites (NSE 2014) Table A2, Reference for Pathway Specific Standards for Surface Water ( g/l) for Fresh Water were used for assessment of total metals (i.e. Aluminum, Antimony, Arsenic, Barium, Beryllium, Boron, Cadmium, Chromium, Cobalt, Copper, Iron, Lead, Manganese, Molybdenum, Nickel, Selenium, Silver, Strontium, Thallium, Uranium, Vanadium and Zinc). 4 FIELD OBSERVATIONS The fall 2016 site conditions were recorded for all eleven (11) surface water quality monitoring stations and are included in the field data sheets in Appendix B. Site condition observations include weather, cloud cover, air temperature, wildlife sightings and site accessibility. In addition, site photographs are included in Appendix C. 5 FIELD MEASUREMENTS Field measurements were recorded on field data sheets, which are enclosed in Appendix B and include collection of parameters such as in Situ ph, dissolved Oxygen, water temperature, conductivity and Secchi depth (where applicable). Field measurements are also summarized in Table 3 attached at the end of Section 6. Dissolved oxygen Readings in seven (7) stations exceeded the CCME PAL-F recommended range of mg/l as follows: KL1 (12.06 mg/l), KL2 (9.65 mg/l), KL3 (11.41 mg/l), KL4 (10.11 mg/l), KL5 (9.92 mg/l), PML1 (12.96 mg/l) and PML2 (10.31 mg/l). ph (in Situ) All in situ ph readings were outside recommended guidelines. Ten (10) stations reported ph concentrations outside the CCME-PAL-F recommended range of as follows KL1 (6.23 ph), KL2 (5.54 ph), KL3 (5.58 ph), KL4 (6.14 ph), KL5 (5.72 ph), HWY102-1 (5.69 ph), HWY102-2 (5.36 ph), LSD (6.25 ph), LU (6.23 ph), and PML2 (5.37 ph). Station PML1 (4.63 ph) was outside the Health Canada Guideline for Recreational Water Quality of ph. WATER QUALITY MONITORING FALL 2016 FINAL REPORT 01 /04 /2017 HALIFAX REGIONAL MUNICIPALITY SNC Lavalin Inc All rights reserved. Confidential T 4E REP
14 6 ANALYTICAL RESULTS Laboratory (AGAT) Certificates of Analysis for the fall 2016 event are enclosed in Appendix D. Analytical results are summarized in Table 3 attached at the end of this section. 6.1 TOTAL PHOSPHOROUS Total Phosphorus: Five (5) stations reported concentrations that exceeded the management threshold criteria of 10 μg/l (0.01 mg/l) listed in the HRM RFP : KL mg/l HWY mg/l LSD mg/l LU mg/l PML mg/l 6.2 GENERAL CHEMISTRY ph (Lab): was outside the CCME-PAL-F recommended range of at the following four (4) stations: KL2 (6.19 ph), HWY102-1 (6.45 ph), HWY102-2 (6.15 ph) and LSD (6.38 ph). 6.3 METALS Total Iron: Exceeded the CCME-PAL-F recommended limit of 300 μg/l at the following two (2) stations: HWY102-2 (375 μg/l) and LSD (303 μg/l). The NSE EQS guideline is also 300 μg/l. Total Zinc: Exceeded the CCME-PAL-F recommended limit of 30 μg/l at station LU (52 μg/l). 6.4 MICROBIOLOGICAL Eleven (11) E.coli samples were collected during the fall 2016 sampling program. E.coli did not exceed the Heath Canada Guideline of 400 CFU /100 ml in any of the samples collected. WATER QUALITY MONITORING FALL 2016 FINAL REPORT 01 /04 /2017 HALIFAX REGIONAL MUNICIPALITY SNC Lavalin Inc All rights reserved. Confidential T 4E REP
15 g Program RDL (May 2016) NSE ESQs for Surface Water (Applied) Health Canada Guideline for Recreational Water Quality (Reference) CCME Guideline PAL-F (Applied) CCME Phosphorus Trigger Range (Applied) Kearney Lake d /06/ /08/ /10/ /05/ /08/ /11/ /05/ /08/ /10/ /05/ /08/ /10/ /05/ /08/ /10/ /05/ /08/ /10/ /05/ /08/ :00 11:45 08:30 11:00 13:10 12:00 11:00 14:30 14:00 8:30 11:20 9:50 10:20 11:10 13:30 10:30 14:15 14:55 08:30 14:54 KL N/A N/A NCC N/A N/A < <5 <5 < < <0.01 <0.01 < <0.01 <0.05 <0.05 <0.05 <0.05 <0.05 <0.05 <0.05 <0.05 <0.05 <0.010 < <0.05 <0.05 <0.05 <0.05 <0.05 <0.05 <0.05 <0.05 < < <0.03 <0.03 <0.03 <0.03 <0.050 < < < <0.01 <0.01 <0.01 <0.01 <0.01 <0.01 <0.01 <0.01 <0.01 <0.01 <0.01 < <0.01 <0.01 <0.01 <0.01 <0.01 <0.010 <0.01 N/A <0.02 <0.02 < < <5 <5 <5 <5 <5 5 <5 <5 <5 <1.0 < N/A < <5 <5 < < <1 <1 <1 <1 <1 <1 <1 <1 <1 <10 <10 <10 <10 <10 <10 <10 <10 <10 <1.0 <10 N/A N/A N/A N/A NC N/A NC N/A NC N/A NC <2 <1.0 < <1.0 <2 <2 <2 <2 <2 <2 <2 <2 <2 < <2 <1.0 < <1.0 <2 <2 <2 <2 <2 <2 <2 <2 <2 < <2 <1.0 < <1.0 <2 <2 <2 <2 <2 <2 <2 <2 <2 < <2 <2.0 < <2.0 <2 <2 <2 <2 <2 <2 <2 <2 <2 < <50 < < < < < < <2 <1.0 < <1.0 <1 <1 <1 <1 <1 <1 6 <1 <1 < < <1 <1 <1 <1 <1 <1 <1 <1 <1 < <2 5.8 <2.0 <2.0 <2.0 <2.0 <2.0 <2 <2 <2 <2 <1 1 1 <1 1 <2.0 < < < <0.50 <0.5 < <0.5 <0.5 < <0.5 <0.5 < <2 <2.0 < <2.0 <2 <2 <2 <2 <2 <2 <2 <2 <2 < < <2 <2 2 2 <2 <2 3 <2 3 < <2 <1.0 < <1.0 <1 <1 <1 <1 <1 <1 <1 <1 <1 < <0.5 <0.10 < <0.10 <0.1 <0.1 <0.1 <0.1 <0.1 <0.1 <0.1 <0.1 <0.1 < <0.1 <0.10 < <0.10 <0.1 <0.1 <0.1 <0.1 <0.1 <0.1 <0.1 <0.1 <0.1 < <2 <2.0 < <2.0 <2 <2 <2 <2 <2 <2 <2 <2 <2 < < < <2 2 < < < < <0.1 <0.1 < <2 <2.0 < <2.0 <2 <2 <2 <2 <2 <2 <2 <2 <2 < < < L > > > > > L >250 < < l < Notes: N/A - Not Applicable; NC - Not Calculable; NCC Not Collected RDL = Reported Detection Limit (represents most recent sampling event) " -- '' = no guideline available / Not Tested. CCME PAL-F Canadian Council of Ministers of the Environment Guidelines for the Protection of Aquatic Life - Freshwater (updated 2011) CCME PAL-F Guidelines for Aluminum, Lead, Copper and Nickel vary based on reported ph and water hardness (CCME PAL-F calculation equations). The largest guideline value for each respective element range was always used. Health Canada Guidelines for Canadian Recreational Water Quality - Draft (September 2009) Nova Scotia Environmental Quality Standards (EQS) for Contaminated Sites (NSE 2014) Table A2 Reference for Pathway Specific Standards for Surface Water (ug/l) - Fresh Water Bold (black shaded) Underlined (black shaded) = Present Result - Parameter concentration exceeds CCME FWAL Guideline. = Present Result - Parameter concentration exceeds NSE EQS Contaminated Sites Regulations and/or Health Canada Guideline for Recreational Water Quality
16 g Program RDL (May 2016) NSE ESQs for Surface Water (Applied) Health Canada Guideline for Recreational Water Quality (Reference) CCME Guideline PAL-F (Applied) CCME Phosphorus Trigger Range (Applied) d N/A N/A N/A N/A -- N/A -- N/A -- N/A -- N/A -- N/A -- N/A L 1 -- L l Kearney Lake 2009/06/ /08/ /10/ /05/ /08/ /11/ /05/ /08/ /10/ /05/ /08/ /10/ /05/ /08/ /10/ /05/ /08/ /10/ /05/ /08/ :00 10:30 10:45 10:15 12:25 10:50 09:30 14:00 13:15 9:50 10:30 10:20 09:10 16:10 14:30 10:45 9:20 14:04 09:15 13:29 KL2 N/A N/A N/A N/A N/A N/A N/A N/A N/A N/A N/A N/A N/A N/A N/A N/A N/A N/A NCC N/A <5 <5 7 <5 20 <5 8 <5 <5 < < < < <0.05 < <0.05 < < <0.05 < <0.05 < <0.05 <0.05 <0.05 <0.05 < <0.01 <0.05 <0.05 <0.05 <0.05 <0.05 <0.05 <0.05 <0.05 <0.05 <0.010 <0.05 <0.03 <0.03 <0.03 <0.03 <0.05 <0.05 <0.05 <0.05 <0.05 <0.03 <0.03 <0.03 < <0.03 < <0.03 <0.050 < < <0.4 < < <0.01 <0.01 <0.01 <0.01 <0.01 <0.01 < <0.01 < <0.01 <0.01 <0.01 <0.01 <0.01 <0.01 <0.01 <0.010 < <1 <1 <2 <1 <5 <5 <5 <5 135 <5 <5 <5 <5 <1.0 < <2 <2 <2 <2 < < < <1 8 <1 5 7 <1 <1 7 <1 20 <5 8 <5 <5 < < <1 <1 <1 <1 <1 <1 <1 <1 <1 <10 <10 <10 <10 <10 <10 <10 <10 <10 <1.0 < NC NC NC NC NC NC NC NC NC NC NC NC NC 9.78 NC NC NC NC NC NC NC NC NC NC NC <2 <1.0 < <1.0 <2 <2 <2 <2 <2 <2 <2 <2 <2 < <2 <1.0 < <1.0 <2 <2 <2 <2 <2 <2 <2 <2 <2 < < <2 <1.0 < <1.0 <2 <2 <2 <2 <2 <2 <2 <2 <2 < <2 <2.0 < <2.0 <2 <2 <2 <2 <2 <2 <2 <2 <2 < < <50 -- < < <0.017 <0.017 <0.017 <0.017 <0.017 < <0.017 < <2 <1.0 < <1.0 <1 <1 <1 <1 <1 <1 9 <1 <1 < <1 <0.40 < <0.40 <1 <1 <1 <1 <1 <1 <1 <1 <1 < <2 <2.0 <2.0 <2.0 <2.0 <2.0 <2.0 <2 <2 <2 <2 <1 2 <1 <1 4 <2.0 < < < <0.50 <0.5 < < < < < <2 <2.0 < <2.0 <2 <2 <2 <2 <2 <2 <2 <2 <2 < <2 <2.0 < <2.0 <2 <2 <2 <2 <2 <2 <2 <2 <2 < <2 <1.0 < <1.0 <1 <1 1 <1 <1 <1 <1 <1 <1 < < < <0.10 <0.1 <0.1 <0.1 <0.1 <0.1 <0.1 <0.1 <0.1 <0.1 < <0.1 <0.10 < <0.10 <0.1 <0.1 <0.1 <0.1 <0.1 <0.1 <0.1 <0.1 <0.1 < <2 <2.0 < <2.0 <2 <2 3 <2 <2 <2 <2 <2 <2 < <2.0 < < <2 2 2 < <0.1 <0.10 < <0.10 <0.1 <0.1 <0.1 <0.1 <0.1 <0.1 <0.1 <0.1 <0.1 < <2 <2.0 < <2.0 <2 <2 <2 <2 <2 <2 <2 <2 <2 < <5.0 <5.0 <5.0 <5 <5 7 <5 <5 <5 <5 <5 <5 <5.0 < > > > > >2420 >2420 >2420 > >2420 > > > >250 < < Notes: N/A - Not Applicable; NC - Not Calculable; NCC Not Collected RDL = Reported Detection Limit (represents most recent sampling event) " -- '' = no guideline available / Not Tested. CCME PAL-F Canadian Council of Ministers of the Environment Guidelines for the Protection of Aquatic Life - Freshwater (updated 2011) CCME PAL-F Guidelines for Aluminum, Lead, Copper and Nickel vary based on reported ph and water hardness (CCME PAL-F calculation equations). The largest guideline value for each respective element range was always used. Health Canada Guidelines for Canadian Recreational Water Quality - Draft (September 2009) (Referenced) Nova Scotia Environmental Quality Standards (EQS) for Contaminated Sites (NSE 2014) Table A2 Reference for Pathway Specific Standards for Surface Water (ug/l) - Fresh Water Bold (black shaded) Underlined (black shaded) = Present Result - Parameter concentration exceeds CCME FWAL Guideline. = Present Result - Parameter concentration exceeds NSE EQS Contaminated Sites Regulations and/or Health Canada Guideline for Recreational Water Quality
17 ing Program RDL (May 2016) NSE ESQs for Surface Water (Applied) Health Canada Guideline for Recreational Water Quality (Reference) CCME Guideline PAL-F (Applied) CCME Phosphorus Trigger Range (Applied) -dd rs s N/A N/A N/A N/A -- N/A -- N/A -- N/A -- N/A -- N/A -- N/A mL mL ml Kearney Lake 2009/06/ /08/ /10/ /05/ /08/ /11/ /05/ /08/ /10/ /05/ /08/ /10/ /05/ /08/ /10/ /05/ /08/ /10/ /05/ /08/ :00 11:00 09:30 11:30 14:12 11:40 10:30 12:20 12:00 10:26 12:20 11:20 9:50 10:00 14:00 11:00 11:50 14:25 10:35 11:45 KL3 N/A N/A N/A N/A N/A N/A N/A N/A N/A N/A N/A N/A N/A N/A N/A N/A N/A N/A NCC N/A < < < < < <0.01 <0.01 < <0.01 <0.05 <0.05 <0.05 <0.05 <0.05 <0.05 <0.05 <0.05 <0.05 <0.010 <0.05 < <0.05 <0.05 <0.05 <0.05 <0.05 <0.05 <0.05 < <0.03 <0.03 <0.03 <0.03 <0.03 <0.03 <0.03 <0.050 < < < < <0.01 <0.01 <0.01 <0.01 <0.01 <0.01 <0.01 <0.01 <0.01 <0.01 <0.01 <0.01 <0.01 <0.01 <0.01 <0.01 <0.01 <0.01 <0.010 < <0.02 < < < <2 <1 <1 <1 <1 <5 <5 <5 <5 <5 <5 <5 <5 <5 2.8 < < < < <1 <1 <1 <1 <1 <1 <1 <1 <1 <10 <10 <10 <10 <10 <10 <10 <10 <10 <1.0 < NC NC NC NC NC NC 9.92 NC NC <2 <2 -- <1.0 < <1.0 <2 <2 <2 <2 <2 <2 <2 <2 <2 < <2 <2 -- <1.0 < <1.0 <2 <2 <2 <2 <2 <2 <2 <2 <2 < <2 <2 -- <1.0 < <1.0 <2 <2 <2 <2 <2 <2 <2 <2 <2 < <2 <2 -- <2.0 < <2.0 <2 <2 <2 <2 <2 <2 <2 <2 <2 < < < < <0.017 < < <1 <1 -- <1.0 < <1.0 <1 <1 <1 <1 <1 <1 7 <1 <1 < <1 <1 -- <0.40 < <0.40 <1 <1 <1 <1 <1 <1 <1 <1 <1 < <2.0 <2.0 <2.0 <2.0 <2.0 <2.0 <2 <2 <2 <2 <1 1 1 <1 2 < <0.5 < < <0.50 <0.5 < <0.5 < <0.5 <0.5 < <2 <2 -- <2.0 < <2.0 <2 <2 <2 <2 <2 <2 <2 <2 <2 < <2 < < <2 <2 <2 <2 <2 <2 2 <2 <2 < <1 <1 -- <1.0 < <1.0 <1 <1 <1 <1 <1 <1 <1 <1 <1 < <0.1 < <0.10 < <0.10 <0.1 <0.1 <0.1 <0.1 <0.1 <0.1 <0.1 <0.1 <0.1 < <0.1 < <0.10 < <0.10 <0.1 <0.1 <0.1 <0.1 <0.1 <0.1 <0.1 <0.1 <0.1 < <2 <2 -- <2.0 < <2.0 <2 <2 <2 <2 <2 <2 <2 <2 <2 < <2.0 < <2 <2 <2 <2 <2 2 3 < <0.1 < <0.10 < <0.1 <0.1 <0.1 <0.1 <0.1 <0.1 <0.1 < <2 <2 -- <2.0 < <2.0 <2 <2 <2 <2 <2 <2 <2 <2 <2 < <5 < <5 < < > < <100 2 < <1 <1 <1 13 < Notes: N/A - Not Applicable; NC - Not Calculable; NCC Not Collected RDL = Reported Detection Limit (represents most recent sampling event) " -- '' = no guideline available / Not Tested. CCME PAL-F Canadian Council of Ministers of the Environment Guidelines for the Protection of Aquatic Life - Freshwater (updated 2011) CCME PAL-F Guidelines for Aluminum, Lead, Copper and Nickel vary based on reported ph and water hardness (CCME PAL-F calculation equations). The largest guideline value for each respective element range was always used. Health Canada Guidelines for Canadian Recreational Water Quality - Draft (September 2009) (Referenced) Nova Scotia Environment Environmental Quality Standards for Surface Water (Environmental Quality Standards (EQS) for Contaminated Sites (NSE 2014) Table A2 Reference for Pathway Specific Standards for Surface Water (ug/l) - Fresh Water Bold (black shaded) Underlined (black shaded) = Present Result - Parameter concentration exceeds CCME FWAL Guideline. = Present Result - Parameter concentration exceeds NSE EQS Contaminated Sites Regulations and/or Health Canada Guideline for Recreational Water Quality
18 ty Sampling Program Units RDL (May 2016) NSE ESQs for Surface Water (Applied) Health Canada Guideline for Recreational Water Quality (Reference) CCME Guideline PAL-F (Applied) CCME Phosphorus Trigger Range (Applied) yyyy-mm-dd -- hh:mm -- Meters Celsius mg/l ph N/A us/cm 1 -- mg/l 5 -- mg/l TCU 5 -- mg/l mg/l mg/l mg/l mg/l mg/l mg/l ph N/A mg/l mg/l mg/l mg/l mg/l mg/l mg/l 5 -- mg/l 2 -- NTU μs/cm 1 -- me/l N/A -- mg/l 5 -- mg/l 1 -- mg/l me/l N/A -- mg/l N/A -- % N/A -- N/A N/A -- N/A N/A -- N/A N/A -- N/A N/A -- μg/l μg/l 2 20 μg/l μg/l μg/l μg/l 2 -- μg/l μg/l μg/l 1-1 μg/l 1 10 μg/l μg/l μg/l μg/l μg/l μg/l μg/l μg/l μg/l μg/l μg/l 2 -- μg/l 2 -- μg/l μg/l 2 6 μg/l MPN/100mL 1 -- MPN/100mL MPN/ml μg/l μg/l Kearney Lake 2009/06/ /08/ /10/ /05/ /08/ /11/ /05/ /08/ /10/ /05/ /08/ /10/ /05/ /08/ /10/ /05/ /08/ /10/ /05/ /08/ /10/ 10:00 11:30 10:00 11:20 13:50 11:15 10:10 11:40 11:40 10:16 12:00 11:40 9:41 10:30 14:20 11:15 11:35 14:35 10:25 11:02 11:15 KL4 N/A N/A N/A N/A N/A N/A N/A N/A N/A N/A N/A N/A N/A N/A N/A N/A N/A N/A NCC N/A N/A <5 <5 <5 < < <0.01 <0.01 < <0.01 <0.05 <0.05 <0.05 <0.05 <0.05 <0.05 <0.05 <0.05 <0.05 <0.010 <0.05 <0.05 <0.05 <0.05 <0.05 <0.05 <0.05 <0.05 < < <0.03 <0.03 <0.03 <0.03 <0.03 <0.03 <0.03 < < < <0.4 <0.4 < <0.01 <0.01 <0.01 <0.01 <0.01 <0.01 <0.01 <0.01 <0.01 <0.01 <0.01 < <0.01 <0.01 <0.01 <0.01 <0.01 <0.010 <0.01 < <0.02 <0.02 < <0.002 < <1 1 <1 <2 <2 <1 2 <1 <2 <5 <5 <5 <5 <5 <5 <5 <5 <5 < < <5 <5 <5 < < <1 <1 <1 <1 <1 <1 <1 <1 <1 <10 <10 <10 <10 <10 <10 <10 <10 <10 <1.0 <10 < NC NC NC NC <2 <1.0 < <1.0 <2 <2 <2 <2 <2 <2 <2 <2 <2 < <2 <2 <1.0 < <1.0 <2 <2 <2 <2 <2 <2 <2 <2 <2 < < <2 <1.0 < <1.0 <2 <2 <2 <2 <2 <2 <2 <2 <2 < <2 <2 <2.0 < <2.0 <2 <2 <2 <2 <2 <2 <2 <2 <2 < < < <50 -- <5 < < < <0.017 < <0.017 <2 <1.0 < <1.0 <1 <1 6 <1 <1 <1 6 <1 <1 < <1 <1 <0.40 < <0.40 <1 <1 <1 <1 <1 <1 <1 <1 <1 < <1 <2 < < <2.0 <2.0 <2 <2 4 9 <1 1 <1 < < < <0.50 <0.5 < <0.5 < <0.5 <0.5 < < <2 <2.0 < <2.0 <2 <2 <2 <2 <2 <2 <2 <2 <2 < < < <2.0 <2 <2 5 <2 <2 <2 <2 <2 <2 < <2 <2 <1.0 < <1.0 <1 <1 <1 <1 <1 <1 <1 <1 <1 < <0.5 <0.10 < <0.10 <0.1 <0.1 <0.1 <0.1 <0.1 <0.1 <0.1 <0.1 <0.1 < < <0.1 <0.10 < <0.10 <0.1 <0.1 <0.1 <0.1 <0.1 <0.1 <0.1 <0.1 <0.1 < <0.1 <2 <2.0 < <2.0 <2 <2 <2 5 <2 <2 <2 <2 <2 < <2 <2 <2.0 < <2 <2 <2 <2 <2 3 2 <2 <2 < <2 <0.1 <0.10 < <0.1 <0.1 <0.1 <0.1 <0.1 <0.1 <0.1 <0.1 < <0.1 <2 <2.0 < <2.0 <2 <2 <2 <2 <2 <2 <2 <2 <2 < < <5 < <5 9 9 <5 < > > > > < <100 4 < <1 <1 1 8 < < Notes: N/A - Not Applicable; NC - Not Calculable; NCC Not Collected RDL = Reported Detection Limit (represents most recent sampling event) " -- '' = no guideline available / Not Tested. CCME PAL-F Canadian Council of Ministers of the Environment Guidelines for the Protection of Aquatic Life - Freshwater (updated 2011) CCME PAL-F Guidelines for Aluminum, Lead, Copper and Nickel vary based on reported ph and water hardness (CCME PAL-F calculation equations). The largest guideline value for each respective element range was always used. Health Canada Guidelines for Canadian Recreational Water Quality - Draft (September 2009) (Referenced) Nova Scotia Environment Environmental Quality Standards for Surface Water (Environmental Quality Standards (EQS) for Contaminated Sites (NSE 2014) Table A2 Reference for Pathway Specific Standards for Surface Water (ug/l) - Fresh Water Bold (black shaded) Underlined (black shaded) = Present Result - Parameter concentration exceeds CCME FWAL Guideline. = Present Result - Parameter concentration exceeds NSE EQS Contaminated Sites Regulations and/or Health Canada Guideline for Recreational Water Quality
19 West Water Quality Sampling Program 2016 Units RDL (May 2016) NSE ESQs for Surface Water (Applied) Health Canada Guideline for Recreational Water Quality (Reference) CCME Guideline PAL-F (Applied) CCME Phosphorus Trigger Range (Applied) yyyy-mm-dd -- hh:mm -- Meters Celsius mg/l ph N/A ce us/cm 1 -- aco3) mg/l 5 -- Cl) mg/l TCU 5 -- mg/l mg/l mg/l Nitrogen) mg/l en as N mg/l n mg/l P) mg/l ph N/A mg/l g) mg/l M depth) mg/l mg/l mg/l ) mg/l lids mg/l 5 -- (SO4) mg/l 2 -- NTU ) μs/cm 1 -- ters me/l N/A -- lc. as CaCO3) mg/l 5 -- mg/l as CaCO3) mg/l me/l N/A -- mg/l N/A -- rence) % N/A -- 20C) N/A N/A -- 4C) N/A N/A -- C) N/A N/A -- ) N/A N/A -- μg/l μg/l 2 20 μg/l μg/l μg/l μg/l 2 -- μg/l ) μg/l ) μg/l 1-1 μg/l 1 10 μg/l μg/l μg/l n) μg/l Mo) μg/l μg/l μg/l μg/l μg/l μg/l μg/l 2 -- μg/l 2 -- μg/l μg/l 2 6 μg/l L MPN/100mL 1 -- MPN/100mL MPN/ml ification method μg/l chmeyer method μg/l Kearney Lake KL5 2011/10/ /05/ /08/ /10/ /05/ /08/ /10/ /05/ /08/ /10/ /05/ /08/ /10/ /05/ /08/ /10/25 9:40 10:52 13:10 12:10 10:03 10:50 13:45 11:30 13:55 10:45 09:00 12:04 12:00 10:00 8:00 13:05 N/A N/A N/A N/A N/A N/A N/A N/A N/A N/A NCC N/A <5 < <5 < < <0.05 <0.05 <0.05 <0.05 < <0.05 <0.05 <0.05 <0.010 <0.05 <0.05 < <0.05 <0.05 < <0.03 <0.03 <0.03 <0.03 <0.03 < <0.050 < <0.03 < < < < < <0.01 <0.01 <0.01 <0.01 <0.01 <0.01 <0.01 <0.01 <0.01 <0.01 <0.010 <0.01 <0.01 <0.01 <0.01 < <5 <5 <5 <5 <5 <5 <5 <5 <5 <1.0 <5 <5 <5 <5 < <5 < <5 < < <1 <10 <10 <10 <10 <10 <10 <10 <10 <10 <1.0 <10 <10 <10 <10 < <2 <2 <2 <2 <2 <2 <2 <2 <2 < <2 <2 -- <2 <2 <2 <2 <2 <2 <2 <2 <2 < <2 < <2 <2 <2 <2 <2 <2 <2 <2 <2 < <2 <2 -- <2 -- <2 <2 <2 <2 <2 <2 <2 <2 <2 < <2 < < < < < <1 <1 5 <1 <1 <1 6 <1 <1 < <1 -- <1 <1 <1 <1 <1 <1 <1 <1 <1 < <1 <1 <2.0 <2 <2 <2 <2 <1 1 <1 <1 5 <2.0 1 <1 <1 <1 < < <0.5 < <0.5 <0.5 < < < <0.5 < <2 <2 <2 <2 <2 <2 <2 <2 <2 < <2 <2 -- <2 <2 5 <2 <2 <2 2 <2 <2 < <1 <1 <1 <1 <1 <1 <1 <1 <1 < <1 <1 -- <0.1 <0.1 <0.1 <0.1 <0.1 <0.1 <0.1 <0.1 <0.1 < <0.1 < <0.1 <0.1 <0.1 <0.1 <0.1 <0.1 <0.1 <0.1 <0.1 < <0.1 < <2 <2 <2 <2 <2 <2 <2 <2 <2 < <2 < <2 <2 <2 <2 <2 <2 < <2 < <0.1 < <0.1 <0.1 <0.1 <0.1 < <2 <2 <2 <2 <2 <2 <2 <2 <2 < <2 < < < <5 < > < < < Notes: N/A - Not Applicable; NC - Not Calculable; NCC Not Collected RDL = Reported Detection Limit (represents most recent sampling event) " -- '' = no guideline available / Not Tested. CCME PAL-F Canadian Council of Ministers of the Environment Guidelines for the Protection of Aquatic Life - Freshwater (updated 2011) CCME PAL-F Guidelines for Aluminum, Lead, Copper and Nickel vary based on reported ph and water hardness (CCME PAL-F calculation equations). The largest guideline value for each respective element range was always used. Health Canada Guidelines for Canadian Recreational Water Quality - Draft (September 2009) (Referenced) Nova Scotia Environment Environmental Quality Standards for Surface Water (Environmental Quality Standards (EQS) for Contaminated Sites (NSE 2014) Table A2 Reference for Pathway Specific Standards for Surface Water (ug/l) - Fresh Water Bold (black shaded) Underlined (black shaded) = Present Result - Parameter concentration exceeds CCME FWAL Guideline. = Present Result - Parameter concentration exceeds NSE EQS Contaminated Sites Regulations and/or Health Canada Guideline for Recreational Water Quality
20 Qs for ace Water ference) Recreational Water Quality (Reference) Guideline PAL- F (Applied) Phosphorus Trigger Range (Applied) Highway /06/ /08/ /10/ /05/ /08/ /11/ /05/ /08/ /10/ /05/ /08/ /10/ /05/ /08/ /10/ /05/ /08/ /10/ /05/20 07:00 12:45 08:00 13:00 10:20 09:00 13:40 11:00 11:00 14:50 11:00 9:50 14:15 12:22 12:30 12:00 10:10 9:30 13:15 HWY N/A N/A N/A N/A N/A N/A N/A N/A N/A N/A N/A N/A N/A N/A N/A N/A N/A N/A N/A <5 <5 <5 <5 <5 < <0.05 <0.05 < < <0.05 <0.05 <0.05 < < < < <0.05 <0.05 <0.05 < < <0.01 <0.01 < <0.01 <0.05 <0.05 <0.05 <0.05 <0.05 <0.05 <0.05 <0.05 <0.05 < < <0.05 <0.05 <0.05 < < < < < <0.01 <0.01 <0.01 <0.01 <0.01 <0.01 <0.01 <0.01 <0.01 <0.01 <0.01 <0.01 <0.01 <0.01 <0.01 <0.01 <0.01 <0.01 < <2 11 <2 <1 1 <1 9 6 <5 <5 <5 <5 6 <5 <5 < < <1 <1 <1 <1 <1 < <1 <1 <1 <1 <1 <1 <1 <1 <1 <10 <10 <10 <10 <10 <10 <10 <10 <10 < NC NC NC NC NC NC NC NC NC NC NC NC NC NC NC NC NC NC NC NC NC NC NC NC <2 <1.0 < <1.0 <2 <2 <2 <2 <2 <2 <2 <2 <2 < <2 <1.0 < <1.0 <2 <2 <2 <2 <2 <2 <2 <2 <2 < <2 <1.0 < <1.0 <2 <2 <2 <2 <2 <2 <2 <2 <2 < <2 <2.0 < <2.0 <2 <2 <2 <2 <2 <2 <2 <2 <2 < < < < < < <0.017 <0.017 < < <2 <1.0 < <1.0 <1 <1 <1 <1 <1 <1 8 <1 <1 < < <0.40 <1 <1 <1 <1 <1 <1 <1 <1 <1 < <2.0 <2.0 <2.0 <2.0 <2.0 <2 <2 3 <2 <1 2 <1 <1 2 < <0.50 < <0.5 <0.5 < < < <2 <2.0 < <2.0 <2 <2 <2 <2 <2 <2 <2 <2 <2 < <2 <2.0 < <2.0 <2 <2 <2 <2 <2 <2 <2 <2 <2 < <2 <1.0 < <1.0 <1 <1 <1 <1 <1 <1 <1 <1 <1 < <0.5 <0.10 < <0.10 <0.1 <0.1 <0.1 <0.1 <0.1 <0.1 <0.1 <0.1 <0.1 < <0.1 <0.10 < <0.10 <0.1 <0.1 <0.1 <0.1 <0.1 <0.1 <0.1 <0.1 <0.1 < <2 <2.0 < <2.0 <2 <2 <2 <2 <2 <2 <2 <2 <2 < <2.0 < <2 3 <2 <2 <2 4 2 <2 <2 < <0.1 <0.10 < <0.10 <0.1 <0.1 <0.1 <0.1 <0.1 <0.1 <0.1 <0.1 <0.1 < <2 <2.0 < <2.0 <2 <2 <2 <2 <2 <2 <2 <2 <2 < <5.0 < <5 6 <5 <5 < < > >250 > >2420 > > >2420 > > < < Notes: N/A - Not Applicable; NC - Not Calculable; NCC Not Collected RDL = Reported Detection Limit (represents most recent sampling event) " -- '' = no guideline available / Not Tested. CCME PAL-F Canadian Council of Ministers of the Environment Guidelines for the Protection of Aquatic Life - Freshwater (updated 2011) CCME PAL-F Guidelines for Aluminum, Lead, Copper and Nickel vary based on reported ph and water hardness (CCME PAL-F calculation equations). The largest guideline value for each respective element range was always used.
21 Qs for ce Water ference) Recreational Water Quality (Reference) Guideline PAL- F (Applied) Phosphorus Trigger Range (Applied) Highway /06/ /08/ /10/ /05/ /08/ /11/ /05/ /08/ /10/ /05/ /08/ /10/ /05/ /08/ /10/ /05/ /08/ /10/ /05/20 12:30 12:15 12:30 12:40 09:30 12:30 11:20 15:00 15:30 11:20 12:20 10:35 10:40 10:00 10:22 12:15 14:25 10:07 11:00 HWY102-2 N/A N/A N/A N/A N/A N/A N/A N/A N/A N/A N/A N/A N/A N/A N/A N/A -- N/A NCC <5 < <5 <5 5 < < <0.05 <0.05 < < < <0.05 <0.05 < <0.050 < < < <0.05 <0.05 < <0.050 <0.01 <0.01 < <0.01 <0.05 <0.05 <0.05 <0.05 <0.05 <0.05 < <0.05 <0.010 < <0.05 < <0.05 < <0.03 <0.03 < < < < <0.01 <0.01 <0.01 < <0.01 <0.01 <0.01 <0.01 <0.01 <0.01 <0.01 <0.01 <0.01 <0.01 < <0.01 < < < < <5 39 <5 <5 < <5 2 < < ( 1 ) <1 < <1 <1 5 < < <1 <1 <1 <1 <1 <1 <1 <1 <1 <10 <10 <10 <10 <10 <10 <10 -- <10 < NC NC NC NC NC NC NC NC NC NC NC NC NC NC NC NC NC NC NC NC <2 <1.0 < <1.0 <2 <2 <2 <2 <2 <2 <2 -- <2 <1.0 <2 < <1.0 <2 <2 <2 <2 <2 6 <2 -- <2 < <2 <1.0 < <1.0 <2 <2 <2 <2 <2 <2 <2 -- <2 <1.0 <2 <2.0 < <2.0 <2 <2 <2 <2 <2 <2 <2 -- <2 <2.0 < < <50 < < < < <2 < <1.0 <1 <1 <1 < <1 <1.0 < <0.40 <1 1 1 < < <2.0 <2.0 < <2 3 3 < < < < <2 <2.0 < <2.0 <2 <2 <2 <2 <2 <2 <2 -- <2 <2.0 <2 <2.0 < <2.0 <2 <2 <2 <2 < <2 <2.0 <2 <1.0 < <1.0 <1 <1 <1 <1 <1 <1 <1 -- <1 <1.0 <0.5 <0.10 < <0.10 <0.1 <0.1 <0.1 <0.1 <0.1 <0.1 < <0.1 < <0.1 <0.10 < <0.10 <0.1 <0.1 <0.1 <0.1 <0.1 <0.1 < <0.1 <0.10 <2 <2.0 < <2.0 <2 <2 <2 <2 <2 <2 <2 -- <2 <2.0 4 < < < <2.0 <0.1 <0.10 < <0.10 <0.1 <0.1 <0.1 <0.1 < < <0.1 <0.10 <2 <2.0 < <2.0 <2 2 <2 <2 <2 11 <2 -- <2 < < < > > > >2420 > > > <1 7 >250 <100 < <1 -- <1 < Notes: N/A - Not Applicable; NC - Not Calculable; NCC Not Collected RDL = Reported Detection Limit (represents most recent sampling event) " -- '' = no guideline available / Not Tested. CCME PAL-F Canadian Council of Ministers of the Environment Guidelines for the Protection of Aquatic Life - Freshwater (updated 2011) CCME PAL-F Guidelines for Aluminum, Lead, Copper and Nickel vary based on reported ph and water hardness (CCME PAL-F calculation equations). The largest guideline value for each respective element range was always used.
22 ESQs for Surface Water (Reference) Recreational Water Quality (Reference) Guideline PAL- F (Applied) Phosphorus Trigger Range (Applied) Lake Shore Drive 2009/06/ /08/ /10/ /05/ /08/ /11/ /05/ /08/ /10/ /05/ /08/ /10/ /05/ /08/ /10/ /05/ /08/ /10/ /05/ :00 09:30 11:45 09:00 11:28 10:00 08:45 13:20 9:00 9:15 13:00 9:10 08:40 15:30 11:55 9:30 12:45 13:30 09:50 LSD N/A N/A N/A N/A N/A N/A N/A N/A N/A N/A N/A N/A N/A N/A N/A N/A -- N/A NCC < < < < <0.01 <0.01 < <0.01 <0.05 <0.05 <0.05 <0.05 <0.05 <0.05 < <0.05 <0.010 < <0.05 <0.05 <0.05 <0.05 < <0.03 <0.03 < <0.03 < < <0.01 <0.01 <0.01 <0.01 <0.01 <0.01 <0.01 <0.01 <0.01 <0.01 <0.01 <0.01 <0.01 <0.01 <0.01 < <0.01 < < < < <1 <1 <1 <1 <1 <1 <1 <1 <1 <10 <10 <10 <10 <10 <10 <10 -- <10 < <2 <1.0 < <1.0 <2 <2 <2 <2 <2 <2 <2 -- <2 <1.0 <2 <1.0 < <1.0 <2 8 <2 <2 <2 <2 <2 -- <2 < <2 <1.0 < <1.0 <2 2 <2 <2 <2 <2 <2 -- <2 <1.0 <2 <2.0 < <2.0 <2 <2 <2 <2 <2 <2 <2 -- <2 < < <50 < < < <0.017 < < <2 <1.0 < <1.0 <1 11 <1 <1 <1 2 <1 -- <1 <1.0 <1 < <0.40 <1 34 <1 <1 <1 1 <1 -- <1 <0.40 <2 <2.0 <2.0 <2.0 <2.0 <2.0 <2.0 < < <1 3 < < < <0.5 <0.5 < <0.5 < <2 <2.0 < <2.0 <2 <2 <2 <2 <2 <2 <2 -- <2 <2.0 <2 <2.0 < <2.0 <2 13 <2 <2 <2 2 <2 -- <2 <2.0 <2 <1.0 < <1.0 <1 2 <1 <1 <1 <1 <1 -- <1 <1.0 <0.5 <0.10 < <0.10 < <0.1 <0.1 <0.1 <0.1 < <0.1 < <0.1 <0.10 < <0.10 < <0.1 <0.1 <0.1 <0.1 < <0.1 <0.10 <2 <2.0 < <2.0 <2 <2 <2 <2 <2 <2 <2 -- <2 <2.0 < < <0.1 <0.10 < <0.10 < <0.1 <0.1 < < <0.1 <0.10 <2 <2.0 < <2.0 <2 30 <2 <2 <2 2 <2 -- <2 < <5.0 <5.0 <5.0 5 < <5 15 <5 -- <5 < > >250 > > >2420 > >2420 > >250 < <1 -- >2420 <10 < < < Notes: N/A - Not Applicable; NC - Not Calculable; NCC Not Collected RDL = Reported Detection Limit (represents most recent sampling event) " -- '' = no guideline available / Not Tested. CCME PAL-F Canadian Council of Ministers of the Environment Guidelines for the Protection of Aquatic Life - Freshwater (updated 2011) CCME PAL-F Guidelines for Aluminum, Lead, Copper and Nickel vary based on reported ph and water hardness (CCME PAL-F calculation equations). The largest guideline value for each respective element range was always used.
23 016 Units RDL (May 2016) ESQs for Surface Water (Reference) Recreational Water Quality (Reference) Guideline PAL- F (Applied) Phosphorus Trigger Range (Applied) yyyy-mm-dd -- hh:mm -- Meters Celsius mg/l ph N/A e us/cm 1 -- aco3) mg/l 5 -- Cl) mg/l TCU 5 -- mg/l mg/l mg/l Nitrogen) mg/l en as N mg/l n mg/l P) mg/l ph N/A mg/l g) mg/l M depth) mg/l mg/l mg/l ) mg/l lids mg/l 5 -- SO4) mg/l 2 -- NTU ) μs/cm 1 -- ters me/l N/A -- lc. as CaCO3) mg/l 5 -- mg/l as CaCO3) mg/l me/l N/A -- mg/l N/A -- rence) % N/A -- 0C) N/A N/A -- C) N/A N/A -- C) N/A N/A -- ) N/A N/A -- μg/l μg/l 2 20 μg/l μg/l μg/l μg/l 2 -- μg/l μg/l ) μg/l μg/l 1 10 μg/l μg/l μg/l n) μg/l Mo) μg/l μg/l μg/l μg/l μg/l μg/l μg/l 2 -- μg/l 2 -- μg/l μg/l 2 6 μg/l L MPN/100mL 1 -- MPN/100mL MPN/ml ification method μg/l chmeyer method μg/l Larry Uteck Blvd 2011/10/ /05/ /08/ /10/ /05/ /08/ /10/ /05/ /08/ /10/ /05/ /08/ /10/ /05/ /0 10:30 15:20 11:30 10:10 14:30 14:30 13:00 11:45 10:45 9:54 13:45 10:23 10:05 12:20 11:2 LU N/A N/A N/A N/A N/A N/A N/A N/A N/A N/A NCC N/A N/A N/A N/A < <0.05 <0.05 <0.05 <0.05 <0.05 <0.05 <0.05 <0.05 <0.05 <0.010 <0.05 <0.05 < <0.03 < <0.03 <0.03 < < < < <0.01 <0.01 <0.01 <0.01 <0.01 <0.01 <0.01 <0.01 <0.01 <0.01 <0.010 <0.01 <0.01 <0.01 < <5 <5 <5 <5 626 <5 <5 <1.0 < < < <1 <10 <10 <10 <10 <10 <10 <10 <10 <10 <1.0 <10 <10 <10 < <2 <2 <2 <2 <2 <2 <2 <2 <2 < <2 < <2 <2 <2 <2 <2 <2 <2 <2 <2 < <2 < <2 <2 <2 <2 <2 <2 <2 <2 <2 < <2 < <2 <2 <2 <2 <2 <2 <2 <2 <2 < <2 < < <1 <1 <1 <1 1 <1 <1 <1 <1 < < <1 1 <1 <1 <1 <1 <1 <1 <1 < < < < < < < <0.5 <0.5 < < <2 <2 <2 <2 <2 <2 <2 <2 <2 < <2 < <2 <2 <2 <2 <2 <2 3 <2 <2 < < <1 <1 <1 <1 <1 <1 <1 <1 <1 < <1 < <0.1 <0.1 <0.1 <0.1 <0.1 <0.1 <0.1 <0.1 <0.1 < <0.1 < <0.1 <0.1 <0.1 <0.1 <0.1 <0.1 <0.1 <0.1 <0.1 < <0.1 < <2 <2 <2 <2 <2 <2 <2 <2 <2 < <2 < <2 3 < < <0.1 <0.1 <0.1 < <0.1 <0.1 <0.1 <0.1 < < <2 <2 <2 <2 <2 <2 <2 <2 <2 < < >2420 > > > > >2420 >2420 >2420 >242 <100 < <1 < < < Notes: N/A - Not Applicable; NC - Not Calculable; NCC Not Collected RDL = Reported Detection Limit (represents most recent sampling event) " -- '' = no guideline available / Not Tested. CCME PAL-F Canadian Council of Ministers of the Environment Guidelines for the Protection of Aquatic Life - Freshwater (updated 2011) CCME PAL-F Guidelines for Aluminum, Lead, Copper and Nickel vary based on reported ph and water hardness (CCME FWAL calculation equations). The largest guideline value for each respective element range was always u
24 Recreational Water Quality (Reference) Guideline PAL- F (Applied) Phosphorus Trigger Range (Applied) Paper Mill Lake 2009/06/ /08/ /10/ /05/ /08/ /11/ /05/ /08/ /10/ /05/ /08/ /10/ /05/ /08/ /10/ /05/ /08/ /10/ /05/ :45 13:00 13:00 13:35 15:15 13:00 13:00 16:50 17:00 12: :55 10:51 11:35 10:45 10:30 14:45 12:35 12:45 PML1 3.2 N/A N/A N/A N/A N/A N/A N/A N/A N/A -- N/A N/A N/A N/A N/A N/A N/A NCC <5 < <0.01 <0.01 < <0.01 < <0.05 <0.05 <0.05 <0.05 <0.05 <0.05 <0.05 <0.010 <0.05 <0.05 <0.05 <0.05 <0.05 <0.05 < < <0.03 < < <0.03 <0.03 < < < <0.01 <0.01 <0.01 <0.01 <0.01 <0.01 <0.01 <0.01 <0.01 < <0.01 <0.01 <0.01 <0.01 <0.01 <0.01 <0.01 < <0.02 < < < <2 <1 1 < <5 < <5 < <5 < <1 <1 <1 <1 <1 <1 <1 <1 <1 <10 -- <10 <10 <10 <10 <10 <10 <10 < <2 <1.0 < <1.0 <2 -- <2 <2 <2 <2 <2 <2 <2 <1.0 <2 <1.0 < <1.0 <2 -- <2 <2 <2 2 <2 <2 <2 < <2 <1.0 < <1.0 <2 -- <2 <2 <2 <2 <2 <2 <2 <1.0 <2 <2.0 < <2.0 <2 -- <2 <2 <2 <2 <2 <2 <2 < < <50 < < <0.017 < < < <2 <1.0 < <1.0 <1 -- <1 <1 <1 3 <1 <1 <1 <1.0 < < <0.40 < <1 <1 9 <1 <1 <1 <0.40 <2 2.0 <2.0 < < <2 -- <2 < <1 2 < < < <0.50 < <0.5 < <0.5 <0.5 < <2 <2.0 < <2.0 <2 -- <2 <2 <2 <2 <2 <2 <2 <2.0 <2 <2.0 < <2.0 < <2 <2 9 <2 <2 <2 <2.0 <2 <1.0 < <1.0 <1 -- <1 <1 <1 <1 <1 <1 <1 <1.0 <0.5 <0.10 < <0.10 < <0.1 <0.1 <0.1 <0.1 <0.1 <0.1 <0.1 < <0.1 <0.10 < <0.10 < <0.1 <0.1 <0.1 <0.1 <0.1 <0.1 <0.1 <0.10 <2 <2.0 < <2.0 <2 -- <2 <2 <2 <2 <2 <2 <2 <2.0 <2 7.8 < < <2 < <2 3 <2.0 <0.1 <0.10 < < <0.1 <0.1 < <0.1 <0.1 <0.1 <0.10 <2 <2.0 < <2.0 <2 -- <2 <2 <2 10 <2 <2 <2 < < <5 62 <5 < >250 >250 > > > > < <10 < Notes: N/A - Not Applicable; NC - Not Calculable; NCC Not Collected RDL = Reported Detection Limit (represents most recent sampling event) " -- '' = no guideline available / Not Tested. CCME PAL-F Canadian Council of Ministers of the Environment Guidelines for the Protection of Aquatic Life - Freshwater (updated 2011) CCME PAL-F Guidelines for Aluminum, Lead, Copper and Nickel vary based on reported ph and water hardness (CCME FWAL calculation equations). The largest gu
25 Recreational Water Quality (Reference) Guideline PAL- F (Applied) Phosphorus Trigger Range (Applied) Paper Mill Lake 2009/06/ /08/ /10/ /05/ /08/ /11/ /05/ /08/ /10/ /05/ /08/ /10/ /05/ /08/ /10/ /05/ /08/ /10/ /05/ :15 13:40 13:45 14:30 16:20 13:00 12:40 16:20 16:15 13:16 13:40 10:45 11:20 11:00 9:20 8:30 11:30 PML N/A N/A N/A N/A 3.1 NCC < < < < < <0.01 <0.01 < <0.01 <0.05 < <0.05 <0.05 <0.05 <0.05 <0.010 <0.05 <0.05 <0.05 <0.05 <0.05 <0.05 <0.05 <0.05 <0.05 < <0.03 < < < < <0.01 <0.01 <0.01 <0.01 <0.01 <0.01 <0.01 <0.01 <0.01 <0.01 < <0.01 <0.01 <0.01 <0.01 < <0.02 < < <1 15 <2 11 <1 8 <1 <5 <5 -- <5 16 <5 < < < < <1 <1 <1 <1 <1 <1 <1 <1 <1 <10 <10 -- <10 <10 <10 <10 < NC NC NC NC NC NC NC NC <2 <1.0 < <1.0 <2 <2 -- <2 <2 <2 <2 <1.0 <2 <1.0 < <1.0 <2 <2 -- <2 <2 <2 <2 < <2 <1.0 < <1.0 <2 <2 -- <2 <2 <2 <2 <1.0 <2 <2.0 < <2.0 <2 <2 -- <2 <2 <2 <2 < < <50 < < <2 <1.0 < <1.0 <1 <1 -- <1 <1 <1 <1 <1.0 < < <0.40 <1 < <1 <1 <1 <0.40 <2 3.3 <2.0 <2.0 <2.0 <2.0 <2.0 <2 < <1 2 < < < <0.50 <0.5 < <0.5 <0.5 < <2 <2.0 < <2.0 <2 <2 -- <2 <2 <2 <2 < < <2.0 <2 < <2 <2 <2 <2.0 <2 <1.0 < <1.0 <1 <1 -- <1 <1 <1 <1 <1.0 <0.5 <0.10 < <0.10 <0.1 < <0.1 <0.1 <0.1 < <0.1 <0.10 < <0.10 <0.1 < <0.1 <0.1 <0.1 <0.1 <0.10 <2 <2.0 < <2.0 <2 < <2 <2 <2 <2.0 < < <2 < <2 <2 2.1 < < < < <0.1 <0.1 <0.1 <0.1 <0.10 <2 <2.0 < <2.0 <2 <2 -- <2 <2 <2 <2 < < <5 < > > > < >250 < < < Notes: N/A - Not Applicable; NC - Not Calculable; NCC Not Collected RDL = Reported Detection Limit (represents most recent sampling event) " -- '' = no guideline available / Not Tested. CCME PAL-F Canadian Council of Ministers of the Environment Guidelines for the Protection of Aquatic Life - Freshwater (updated 2011) CCME PAL-F Guidelines for Aluminum, Lead, Copper and Nickel vary based on reported ph and water hardness (CCME FWAL calculation equations). The largest g er )
26 7 STATISTICAL PRESENTATION Table 4 attached at the end of this section provides seasonal (i.e. fall) statistics for each of the eleven (11) water quality sampling stations representing water quality data from 2009 to October 2016 for six (6) key water quality parameters as follows: a. Total Phosphorous b. Chloride c. Laboratory measured ph d. Total Suspended Solids e. Conductivity f. Chlorophyll-A WATER QUALITY MONITORING FALL 2016 FINAL REPORT 01 /04 /2017 HALIFAX REGIONAL MUNICIPALITY SNC Lavalin Inc All rights reserved. Confidential T 4E REP
27 TABLE 4: Fall 2016 Statistical Presentation of Key Water Quality Parameters - Bedford West Water Quality Sampling Program Station 1 KL-1 Seasonal Results Seasonal Minimum Seasonal Maximum Seasonal Median Seasonal Mean Total Phosphorous (μg/l) Chloride (mg/l) Lab ph Total Suspended Solids (mg/l) < Conductivity (us/cm) Chlorophyll-A (μg/l) Station 2 KL-2 Seasonal Results Seasonal Minimum Seasonal Maximum Seasonal Median Seasonal Mean Total Phosphorous (μg/l) Chloride (mg/l) Lab ph Total Suspended Solids (mg/l) < Conductivity (us/cm) Chlorophyll-A (μg/l) Station 3 KL-3 Seasonal Results Seasonal Minimum Seasonal Maximum Seasonal Median Seasonal Mean Total Phosphorous (μg/l) Chloride (mg/l) Lab ph Total Suspended Solids (mg/l) < Conductivity (us/cm) Chlorophyll-A (μg/l) Station 4 KL-4 Seasonal Results Seasonal Minimum Seasonal Maximum Seasonal Median Seasonal Mean Total Phosphorous (μg/l) Chloride (mg/l) Lab ph Total Suspended Solids (mg/l) Conductivity (us/cm) Chlorophyll-A (μg/l) Note: When calculating the minimum, maximum, media and average, SNC-Lavalin Inc sets the reported values that are less than the laboratory detection limit <RDL (i.e. Total Phosphorus, Total Suspended Solids, etc.) to the value of the "RDL". This allows the minimum, maximum, media and average to take into account all data points resulting in a conservative approach.
28 Station 5 KL-5 Seasonal Results Seasonal Minimum Seasonal Maximum Seasonal Median Seasonal Mean Total Phosphorous (μg/l) Chloride (mg/l) Lab ph Total Suspended Solids (mg/l) < Conductivity (us/cm) Chlorophyll-A (μg/l) Station 6 HWY102-1 Seasonal Results Seasonal Minimum Seasonal Maximum Seasonal Median Seasonal Mean Total Phosphorous (μg/l) Chloride (mg/l) Lab ph Total Suspended Solids (mg/l) < Conductivity (us/cm) Chlorophyll-A (μg/l) Station 7 HWY102-2 Seasonal Results Seasonal Minimum Seasonal Maximum Seasonal Median Seasonal Mean Total Phosphorous (μg/l) Chloride (mg/l) Lab ph Total Suspended Solids (mg/l) < Conductivity (us/cm) Chlorophyll-A (μg/l) Station 8 LSD Seasonal Results Seasonal Minimum Seasonal Maximum Seasonal Median Seasonal Mean Total Phosphorous (μg/l) Chloride (mg/l) Lab ph Total Suspended Solids (mg/l) Conductivity (us/cm) Chlorophyll-A (μg/l) Note: When calculating the minimum, maximum, media and average, SNC-Lavalin Inc sets the reported values that are less than the laboratory detection limit <RDL (i.e. Total Phosphorus, Total Suspended Solids, etc.) to the value of the "RDL". This allows the minimum, maximum, media and average to take into account all data points resulting in a conservative approach.
29 Station 9 LU Seasonal Results Seasonal Minimum Seasonal Maximum Seasonal Median Seasonal Mean Total Phosphorous (μg/l) Chloride (mg/l) Lab ph Total Suspended Solids (mg/l) < Conductivity (us/cm) Chlorophyll-A (μg/l) Station 10 PML1 Seasonal Results Seasonal Minimum Seasonal Maximum Seasonal Median Seasonal Mean Total Phosphorous (μg/l) Chloride (mg/l) Lab ph Total Suspended Solids (mg/l) Conductivity (us/cm) Chlorophyll-A (μg/l) Station 11 PML2 Seasonal Results Seasonal Minimum Seasonal Maximum Seasonal Median Seasonal Mean Total Phosphorous (μg/l) Chloride (mg/l) Lab ph Total Suspended Solids (mg/l) < Conductivity (us/cm) Chlorophyll-A (μg/l) Note: When calculating the minimum, maximum, media and average, SNC-Lavalin Inc sets the reported values that are less than the laboratory detection limit <RDL (i.e. Total Phosphorus, Total Suspended Solids, etc.) to the value of the "RDL". This allows the minimum, maximum, media and average to take into account all data points resulting in a conservative approach.
30 8 GRAPHS Appendix E includes seasonal (i.e. fall event) and yearly graphs that illustrate concentrations from Year 2009 to 2016 of key water quality parameters listed below at each of the eleven (11) water quality monitoring sites. The graphs allow for comparison between water quality sampling stations and identification of concentration increases (i.e. above applicable CCME guidelines): Dissolved chloride (mg/l), ph, Total phosphorus (mg/l), Total suspended solids (mg/l), Conductivity ( S/cm) and Chlorophyll A ( g/l) As many parameters show seasonal concentration fluctuations, the data were also graphed showing only the concentrations for a given season (i.e. fall in this report). Where results were found to be less than the recordable detection limit (<RDL), they were graphed as half the recordable detection limit ( 1 / 2 RDL). WATER QUALITY MONITORING FALL 2016 FINAL REPORT T 4E REP /04 /2017 HALIFAX REGIONAL MUNICIPALITY SNC Lavalin Inc All rights reserved. Confidential. 10
31 9 CONCLUSIONS The fall 2016 water quality monitoring program included collection of surface water samples at eleven (11) water quality sampling stations for the analysis of general chemistry, total metals, total phosphorus, total suspended solids, E.coli, and chlorophyll-a. Additionally, field parameters collected at each station included in Situ ph, water temperature, dissolved oxygen, conductivity, Secchi depth (where applicable), air temperature, cloud cover and wildlife sightings. Based on the fall 2016 water quality monitoring results and their comparison with applicable guidelines, the following results were obtained: TOTAL PHOSPHOROUS It was above the management threshold criteria of 10 μg/l (0.01 mg/l) at five stations: KL2 (0.013 mg/l), HWY (0.012 mg/l), LSD (0.012 mg/l), LU (0.012 mg/l) and PML-1 (0.013 mg/l) FIELD PARAMETERS Dissolved Oxygen was above the CCME PAL-F recommended range of mg/l at seven stations: KL1 (12.06 mg/l), KL2 (9.65 mg/l), KL3 (11.41 mg/l), KL4 (10.11 mg/l), KL5 (9.92 mg/l), PML1 (12.96 mg/l) and PML2 (10.31 mg/l) ph (in Situ) was outside the CCME-PAL-F recommended range of ph at ten stations: as follows KL1 (6.23 ph), KL2 (5.54 ph), KL3 (5.58 ph), KL4 (6.14 ph), KL5 (5.72 ph), HWY102-1 (5.69 ph), HWY102-2 (5.36 ph), LSD (6.25 ph), LU (6.23 ph), and PML2 (5.37 ph). In addition, one (1) station, PML1 (4.63 ph) reading was outside the Health Canada Guideline for Recreational Water Quality of ph GENERAL CHEMISTRY METALS ph (Lab) was outside the CCME-PAL-F recommended range of ph at four stations: KL2 (6.19 ph), HWY102-1 (6.45 ph), HWY102-2 (6.15 ph) and LSD (6.38 ph) Total Iron exceeded the CCME-PAL-F recommended limit of 300 μg/l at two stations: HWY102-2 (375 μg/l) and LSD (303 μg/l) Total Zinc exceeded the CCME-PAL-F recommended limit of 30 μg/l at station LU (52 μg/l). MICROBIOLOGICAL E.coli analytical results did not report exceedances of the Heath Canada Guideline of 400CFU/100mL in any of the eleven (11) stations. WATER QUALITY MONITORING FALL 2016 FINAL REPORT T 4E REP /04 /2017 HALIFAX REGIONAL MUNICIPALITY SNC Lavalin Inc All rights reserved. Confidential. 11
32 10 REFERENCES Canadian Environmental Quality Guidelines for the Protection of Aquatic Life, 2004, Phosphorous: Canadian Guidance Framework for the Management of Freshwater Systems. Canadian Council of Ministers of the Environment (CCME) guidelines for the Protection of Aquatic Life Freshwater (FWAL). For TSS and turbidity, the CCME Narrative Total Particulate Matter Table 1 Suspended Sediments and Turbidity, High Flow Conditions, updated 2002 were used. Environment Canada (EC), 2005, The Inspector s field sampling manual. Second Edition. Retrieved on March 6, 2015 from Health Canada guidelines for Canadian Recreational Water Quality (2012, Third Edition). For turbidity, the guidelines indicate a limit of 50 Nephelometric Turbidity Units (NTU). Nova Scotia Environment (NSE), Environmental Quality Standards for Surface Water (Environmental Quality Standards (EQS) for Contaminated Sites (NSE 2014) Table A2 Reference for Pathway Specific Standards for Surface Water (μg/l) Fresh Water WATER QUALITY MONITORING FALL 2016 FINAL REPORT T 4E REP /04 /2017 HALIFAX REGIONAL MUNICIPALITY SNC Lavalin Inc All rights reserved. Confidential. 12
33 11 LIMITATIONS This report has been prepared and the work referred to in this report has been undertaken by SNC- Lavalin Inc (SNCL) for Halifax Regional Municipality (HRM), hereafter referred to as the Client. It is intended for the sole and exclusive use of Halifax Regional Municipality. The report has been prepared in accordance with the Scope of Work and agreement between SNCL and the Client. Other than by the Client and as set out herein, copying or distribution of this report or use of or reliance on the information contained herein, in whole or in part, is not permitted without the express written permission of SNCL. This report has been prepared in a manner generally accepted by professional consulting principles and practices for the same locality and under similar conditions. No other representations or warranties, expressed or implied, are made. Opinions and recommendations contained in this report are based on conditions that existed at the time the services were performed and are intended only for the client, purposes, stations, time frames and project parameters as outlined in the Scope or Work and agreement between SNCL and the Client. The data reported, findings, observations and conclusions expressed are limited by the Scope of Work. SNCL is not responsible for the impacts of any changes in environmental standards, practices, or regulations subsequent to performance of services. SNCL does not warranty the accuracy of information provided by third party sources. WATER QUALITY MONITORING FALL 2016 FINAL REPORT T 4E REP /04 /2017 HALIFAX REGIONAL MUNICIPALITY SNC Lavalin Inc All rights reserved. Confidential. 13
34
35
36
37
38
39 FIELD REPORT OCTOBER 2016 Project: Water Quality Monitoring - Bedford West Sub-Area(s): 2, 3, 4, 5 Client: Halifax Regional Municipality Site: Kearney Lake Site ID: KL1 Watercourse: Kearney Lake Location: Kearney Lake Road Monitoring Well Pumping Well Surface Water Spring/Seep Discharge Pipe Other: GPS Coordinates: 20T E, N (UTM, NAD83) SNC Field Personnel: Alex Hayes Site Conditions Weather: Clear Air Temperature: Cloud Cover : 30% Wildlife Sightings: No Site Accessibility: Yes, Accessible Off Kearney Lake Road Site Access Detail: Sample taken off the end of dock at Kearney Lake beach. Parked in public parking of Hamshaw Dr. and walked down to beach area. Field Parameter Data Remarks Date (d.m.y): 25/10/2016 Time (hh:mm): 1: 20 pm Sample Depth (m): 0.15 ph: 6.23 Dissolved Oxygen (mg/l): Secchi Depth (m): 2.5 meters (26/10/2016) Water Temperature (degrees Celsius): 11.9 Conductivity (μs/cm): Additional Comments / Notes Secchi depth was depth to bottom. Report October SNC-Lavalin Inc. All rights reserved Confidential
40 FIELD REPORT OCTOBER 2016 Project: Water Quality Monitoring - Bedford West Sub-Area(s): 2, 3, 4, 5 Client: Halifax Regional Municipality Site: Kearney Lake Site ID: KL2 Watercourse: Kearney Lake Location: Kearney Lake Road Monitoring Well Pumping Well Surface Water Spring/Seep Discharge Pipe Other: GPS Coordinates: 20T E, N (UTM, NAD83) SNC Field Personnel: Alex Hayes Site Conditions Weather: Clear Air Temperature: Cloud Cover: 30% Wildlife Sightings: No Site Accessibility: Yes, Accessible Off Colin s Rd. Site Access Detail: Sample taken on the lake side of the culvert between residential buildings 20 and 28. Walked down rock to left of culvert. Note: Sample when standing downstream of bottle. Field Parameter Data Remarks Date (d.m.y): 25/10/2016 Time (hh:mm): 12:50 pm Sample Depth (m): 0.15 ph: 5.54 Dissolved Oxygen (mg/l): 9.65 Secchi Depth (m): 1.85 meters (26/10/2016) Water Temperature (degrees Celsius): 10.2 Conductivity (μs/cm): Additional Comments / Notes Report October SNC-Lavalin Inc. All rights reserved Confidential
41 FIELD REPORT OCTOBER 2016 Project: Water Quality Monitoring - Bedford West Sub-Area(s): 2, 3, 4, 5 Client: Halifax Regional Municipality Site: Kearney Lake Run Site ID: KL3 Watercourse: Kearney Lake Run Location: Kearney Lake Road Monitoring Well Pumping Well Surface Water Spring/Seep Discharge Pipe Other: GPS Coordinates: 20T E, N (UTM, NAD83) SNC Field Personnel: Alex Hayes Site Conditions Weather: Clear Air Temperature: Cloud Cover: 30% Wildlife Sightings: No Site Accessibility: Yes, Accessible Off walking trail from Amesbury Gate Rd. Access to site is via a walking path clearly evident off of Amesbury Gate Rd. (off Larry Uteck Blvd.) roughly 205m down road on left. Walk down path, follow Site Access Detail: gravel walkway down hill and take sample at the low point facing the dam. Look for large rock outcrop on right. Field Parameter Data Date (d.m.y): 25/10/2016 Time (hh:mm): 11:00 am Sample Depth (m): 0.15 ph: 5.58 Dissolved Oxygen (mg/l): Secchi Depth (m): N/A Water Temperature (degrees Celsius): 12.5 Conductivity (μs/cm): Remarks Additional Comments / Notes Report October SNC-Lavalin Inc. All rights reserved Confidential
42 FIELD REPORT OCTOBER 2016 Project: Water Quality Monitoring - Bedford West Sub-Area(s): 2, 3, 4, 5 Client: Halifax Regional Municipality Site: Kearney Lake Run Site ID: KL4 Watercourse: Kearney Lake Run Location: Kearney Lake Road Monitoring Well Pumping Well Surface Water Spring/Seep Discharge Pipe Other: GPS Coordinates: 20T E, N (UTM, NAD83) SNC Field Personnel: Alex Hayes Site Conditions Weather: Clear Air Temperature: Cloud Cover: 30% Wildlife Sightings: No Site Accessibility: Yes, Accessible Via the extended road at the end of Weybridge Ln. At Weybridge, go to end of extended road on right Site Access Detail: and walk and take sample above the rocky area at the base of the wider, slow moving section of the river. Field Parameter Data Date (d.m.y): 25/10/2016 Time (hh:mm): 11:11 am Sample Depth (m): 0.15 ph: 6.14 Dissolved Oxygen (mg/l): Secchi Depth (m): N/A Water Temperature (degrees Celsius): 12.3 Conductivity (μs/cm): 228 Remarks Additional Comments / Notes Report October SNC-Lavalin Inc. All rights reserved Confidential
43 FIELD REPORT OCTOBER 2016 Project: Water Quality Monitoring - Bedford West Sub-Area(s): 9 Client: Halifax Regional Municipality Site: Kearney Lake Site ID: KL5 Watercourse: Kearney Lake Location: Kearney Lake Road Monitoring Well Pumping Well Surface Water Spring/Seep Discharge Pipe Other: GPS Coordinates: 20T E, N (UTM, NAD83) SNC Field Personnel: Alex Hayes Site Conditions Weather: Clear Air Temperature: Cloud Cover: 30% Wildlife Sightings: No Site Accessibility: Yes, Accessible Along Kearney Lake Road Site Access Detail: Easily accessible, sample location is directly off the Kearney Lake Road on a rocky outcrop supporting a power line pole (two pole structure). Slow truck down carefully, turn hazard lights on. Samples were taken on left front of outcrop facing lake. Field Parameter Data Remarks Date (d.m.y): 25/10/2016 Time (hh:mm): 1:05 pm Sample Depth (m): 0.15 ph: 5.72 Dissolved Oxygen (mg/l): 9.92 Secchi Depth (m): 4.20 meters (26/10/2016) Water Temperature (degrees Celsius): 12.7 Conductivity (μs/cm): Additional Comments / Notes Report October SNC-Lavalin Inc. All rights reserved Confidential
44 FIELD REPORT OCTOBER 2016 Project: Water Quality Monitoring - Bedford West Sub-Area(s): 2, 3, 4, 5 Client: Halifax Regional Municipality Site: Highway 102 Site ID: HWY Watercourse: Marsh area Location: Highway 102, south of exit 3 Monitoring Well Pumping Well Surface Water Spring/Seep Discharge Pipe Other: GPS Coordinates: 20T E, N (UTM, NAD83) SNC Field Personnel: Alex Hayes Site Conditions Weather: Clear Air Temperature: Cloud Cover: 30% Wildlife Sightings: No Site Accessibility: Yes, Accessible Off Highway 102 Park before guardrail. Carefully slow truck down while pulling off highway 102. Park truck with hazard lights on before the start of the guardrail. Walk along outside of guardrail (for approximately 150m). Site is on right Site Access Detail: fed by a swampy bog area. Samples were taken in front of culvert. There is a concrete pad to step on to take samples. Sample while standing downstream. Field Parameter Data Date (d.m.y): 25/10/2016 Time (hh:mm): 10:20 am Sample Depth (m): 0.15 ph: 5.69 Dissolved Oxygen (mg/l): 7.35 Secchi Depth (m): N/A Water Temperature (degrees Celsius): 9.2 Conductivity (μs/cm): Remarks Additional Comments / Notes Report October SNC-Lavalin Inc. All rights reserved Confidential
45 FIELD REPORT OCTOBER 2016 Project: Water Quality Monitoring - Bedford West Sub-Area(s): 2, 3, 4, 5 Client: Halifax Regional Municipality Site: Highway 102 Site ID: HWY Watercourse: Marsh area Location: HWY 102, south of exit 3 Monitoring Well Pumping Well Surface Water Spring/Seep Discharge Pipe Other: GPS Coordinates: 20T E, N (UTM, NAD83) SNC Field Personnel: Alex Hayes Site Conditions Weather: Clear Air Temperature: Cloud Cover: 30% Wildlife Sightings: No Site Accessibility: Yes, Accessible Off Highway 102 (Small gravel drive way- *Back in) Site Access Detail: Travel along Highway 102 toward Bedford NS. Site is on right easily to identify based on swamp/bog. Carefully slow truck down with hazard lights flashing. There is a small driveway to park truck. Pull a head of driveway and when lanes are clear back truck down into spot. Take samples in water body in front of culvert. Field Parameter Data Date (d.m.y: 25/10/2016 Time (hh:mm): 10:40 am Sample Depth (m): 0.15 ph: 5.36 Dissolved Oxygen (mg/l): 6.80 Secchi Depth (m): N/A Water Temperature (degrees Celsius): 10.2 Conductivity (μs/cm): Remarks Additional Comments / Notes Report October SNC-Lavalin Inc. All rights reserved Confidential
46 FIELD REPORT OCTOBER 2016 Project: Water Quality Monitoring - Bedford West Sub-Area(s): 2, 3, 4, 5 Client: Halifax Regional Municipality Site: Lake Shore Drive Site ID: LSD Watercourse: Lakeshore Dr. Location: Kingswood Subdivision Monitoring Well Pumping Well Surface Water Spring/Seep Discharge Pipe Other: GPS Coordinates: 20T E, N (UTM, NAD83) SNC Field Personnel: Alex Hayes Site Conditions Weather: Clear Air Temperature: Cloud Cover: 30% Wildlife Sightings: Bugs Site Accessibility: Yes, Accessible Via Lakeshore Drive in Kingswood Subdivision Site Access Detail: Take Kingswood Drive off Hammonds Plains Road. Travel down to Diana Drive on left go to end and take a left on Lakeshore drive. Travel approximately 1.0 km. There will be a clearing on left down to power lines. Drive truck (4X4) down until larger clearing is reached and park. Continue (walk) down hill to ATV pathway on left. Follow pathway for approximately 250m. Sample location is on right (river with a lot of vegetation throughout) Field Parameter Data Remarks Date (d.m.y): 25/10/2016 Time (hh:mm): 12:25 pm Sample Depth (m): 0.15 ph: 6.25 Dissolved Oxygen (mg/l): 8.67 Secchi Depth (m): N/A Water Temperature (degrees Celsius): 9.4 Conductivity (μs/cm): Additional Comments / Notes Report October SNC-Lavalin Inc. All rights reserved Confidential
47 FIELD REPORT OCTOBER 2016 Project: Water Quality Monitoring - Bedford West Sub-Area(s): 9 Client: Halifax Regional Municipality Site: Larry Uteck Blvd. Site ID: LU Watercourse: Pond Location: Larry Uteck off-ramp Monitoring Well Pumping Well Surface Water Spring/Seep Discharge Pipe Other: GPS Coordinates: 20T E, N (UTM, NAD83) SNC Field Personnel: Alex Hayes Site Conditions Weather: Clear Air Temperature: Cloud Cover: 30% Wildlife Sightings: No Site Accessibility: Yes, Accessible From Larry Uteck Blvd. Site Access Detail: Take Larry Uteck off ramp and continue down Larry Uteck Blvd. for approximately 320m. Park truck safely on grassy clearing on left. Sample location is at shore line of lake across road. Take walking pathway to wooded area and travel approximately 80m to lake shore. Avoid walking through the bog area on right. Field Parameter Data Remarks Date (d.m.y): 25/10/2016 Time (hh:mm): 11:45 am Sample Depth (m): 0.15 ph: 6.23 Dissolved Oxygen (mg/l): 9.68 Secchi Depth (m): N/A Water Temperature (degrees Celsius): 11.6 Conductivity (μs/cm): Additional Comments / Notes Report October SNC-Lavalin Inc. All rights reserved Confidential
48 FIELD REPORT OCTOBER 2016 Project: Water Quality Monitoring - Bedford West Sub-Area(s): 2, 3, 4, 5 Client: Halifax Regional Municipality Site: Paper Mill Lake Site ID: PML1 Watercourse: Paper Mill Lake Location: Moirs Mill Subdivision Monitoring Well Pumping Well Surface Water Spring/Seep Discharge Pipe Other: GPS Coordinates: 20T E, N (UTM, NAD83) SNC Field Personnel: Alex Hayes Site Conditions Weather: Clear Air Temperature: Cloud Cover: 40% Wildlife Sightings: No Site Accessibility: Yes, Accessible Travel down Ahmadi Cr. approximately 340m (around second bend in road). Park truck in front of Halifax Water station and carefully walk down rock wall on left. At the bottom locate the small stream and continue along the left and side facing lake. Sample location is a small clearing to the left at the mouth of the river. Field Parameter Data Remarks Date (d.m.y): 25/10/2016 Time (hh:mm): 9:15 am Sample Depth (m): 0.15 ph: 4.63 Dissolved Oxygen (mg/l): Secchi Depth (m): 3.79 meters (26/10/2016) Water Temperature (degrees Celsius): 12.1 Conductivity (μs/cm): Additional Comments / Notes Report October SNC-Lavalin Inc. All rights reserved Confidential
49 FIELD REPORT OCTOBER 2016 Project: Water Quality Monitoring - Bedford West Sub-Area(s): 2, 3, 4, 5 Client: Halifax Regional Municipality Site: Paper Mill Lake Site ID: PML2 Watercourse: Paper Mill Lake Location: Moirs Mill Subdivision Monitoring Well Pumping Well Surface Water Spring/Seep Discharge Pipe Other: GPS Coordinates: 20T E, N (UTM, NAD83) SNC Field Personnel: Alex Hayes Site Conditions Weather: Clear Air Temperature: Cloud Cover: 40% Wildlife Sightings: Bugs Site Accessibility: Yes, Accessible Via Lake Dr., off Hammonds Plains Rd. Site Access Detail: Follow pathway along lake bank to small clearing, use GPS to find exact sample location. Travel over small ridge to reach lake and sample at edge. Field Parameter Data Remarks Date (d.m.y): 25/10/2016 Time (hh:mm): 9:50 am Sample Depth (m): 0.15 ph: 5.37 Dissolved Oxygen (mg/l): Secchi Depth (m): 2.55 meters (26/10/2016) Water Temperature (degrees Celsius): 11.8 Conductivity (μs/cm): Additional Comments / Notes Secchi depth was depth to bottom. Report October SNC-Lavalin Inc. All rights reserved Confidential
50


51 Appendix C: Site Photographs Fall 2016 Bedford West Water Quality Monitoring Photo 1: KL1 Kearney Lake Sample Location Photo 2: KL2 Kearney Lake Sample Location. Report October SNC-Lavalin Inc. All rights reserved Confidential


52 Appendix C: Site Photographs Fall 2016 Bedford West Water Quality Monitoring Photo 3: KL3 Kearney Lake Sample Location Photo 4: KL4 Kearney Lake Sample Location Report October SNC-Lavalin Inc. All rights reserved Confidential


53 Appendix C: Site Photographs Fall 2016 Bedford West Water Quality Monitoring Photo 5: KL5 Kearney Lake Sample Location Photo 6: HWY Sample Location Report October SNC-Lavalin Inc. All rights reserved Confidential


54 Appendix C: Site Photographs Fall 2016 Bedford West Water Quality Monitoring Photo 7: HWY102-2 Sample Location Photo 8: LSD Lake Shore Drive Sample Location Report October SNC-Lavalin Inc. All rights reserved Confidential


55 Appendix C: Site Photographs Fall 2016 Bedford West Water Quality Monitoring Photo 9: LU Larry Uteck Sample Location Photo 10: PML-1 Paper Mill Lake Sample Location Report October SNC-Lavalin Inc. All rights reserved Confidential

56 Appendix C: Site Photographs Fall 2016 Bedford West Water Quality Monitoring Photo 11: PML-2 Paper Mill Lake Sample Location Report October SNC-Lavalin Inc. All rights reserved Confidential
57
58 11 Morris Drive, Unit 122 Dartmouth, Nova Scotia CANADA B3B 1M2 TEL (902) FAX (902) CLIENT NAME: SNC Lavalin Inc SPRING GARDEN RD, SUITE 200 HALIFAX, NS B3J3R4 (902) ATTENTION TO: Maria Gutierrez PROJECT: AGAT WORK ORDER: 16X WATER ANALYSIS REVIEWED BY: Jason Coughtrey, Inorganics Supervisor DATE REPORTED: Nov 03, 2016 PAGES (INCLUDING COVER): 8 VERSION*: 1 Should you require any information regarding this analysis please contact your client services representative at (902) *NOTES All samples will be disposed of within 30 days following analysis. Please contact the lab if you require additional sample storage time. Laboratories (V1) Page 1 of 8 Member of: Association of Professional Engineers, Geologists and Geophysicists of Alberta (APEGGA) Western Enviro-Agricultural Laboratory Association (WEALA) Environmental Services Association of Alberta (ESAA) AGAT Laboratories is accredited to ISO/IEC by the Canadian Association for Laboratory Accreditation Inc. (CALA) and/or Standards Council of Canada (SCC) for specific tests listed on the scope of accreditation. AGAT Laboratories (Mississauga) is also accredited by the Canadian Association for Laboratory Accreditation Inc. (CALA) for specific drinking water tests. Accreditations are location and parameter specific. A complete listing of parameters for each location is available from and/or The tests in this report may not necessarily be included in the scope of accreditation. Results relate only to the items tested and to all the items tested All reportable information as specified by ISO 17025:2005 is available from AGAT Laboratories upon request
59 CLIENT NAME: SNC Lavalin Inc. SAMPLING SITE: Certificate of Analysis AGAT WORK ORDER: 16X PROJECT: ATTENTION TO: Maria Gutierrez SAMPLED BY: SNC-Lavalin Bedford West Custom Inorganics Package 11 Morris Drive, Unit 122 Dartmouth, Nova Scotia CANADA B3B 1M2 TEL (902) FAX (902) DATE RECEIVED: DATE REPORTED: SAMPLE DESCRIPTION: KL-1 KL-2 KL-3 KL-4 KL-5 HWY HWY LSD SAMPLE TYPE: Water Water Water Water Water Water Water Water DATE SAMPLED: Parameter Unit G / S RDL Alkalinity mg/l Chloride mg/l True Color TCU Nitrate + Nitrite as N mg/l <0.05 Nitrate as N mg/l <0.05 Nitrite as N mg/l 0.05 <0.05 <0.05 <0.05 <0.05 <0.05 <0.05 <0.05 <0.05 Ammonia as N mg/l 0.03 <0.03 <0.03 <0.03 <0.03 <0.03 <0.03 <0.03 <0.03 Total Organic Carbon mg/l Ortho-Phosphate as P mg/l 0.01 <0.01 <0.01 <0.01 <0.01 <0.01 <0.01 <0.01 <0.01 ph Total Calcium mg/l Total Magnesium mg/l Total Phosphorus mg/l Total Potassium mg/l Total Sodium mg/l Reactive Silica as SiO2 mg/l Total Suspended Solids mg/l 5 <5 <5 <5 10 <5 <5 <5 15 Sulphate mg/l Turbidity NTU Electrical Conductivity umho/cm Anion Sum me/l Bicarb. Alkalinity (as CaCO3) mg/l Calculated TDS mg/l Carb. Alkalinity (as CaCO3) mg/l 10 <10 <10 <10 <10 <10 <10 <10 <10 Cation sum me/l Hardness mg/l % Difference/ Ion Balance (NS) % Langelier Index (@20C) NA Langelier Index (@ 4C) NA Saturation ph (@ 20C) NA Certified By: Original Signed CERTIFICATE OF ANALYSIS (V1) Page 2 of 8 Results relate only to the items tested and to all the items tested
60 CLIENT NAME: SNC Lavalin Inc. SAMPLING SITE: Certificate of Analysis AGAT WORK ORDER: 16X PROJECT: ATTENTION TO: Maria Gutierrez SAMPLED BY: SNC-Lavalin Bedford West Custom Inorganics Package 11 Morris Drive, Unit 122 Dartmouth, Nova Scotia CANADA B3B 1M2 TEL (902) FAX (902) DATE RECEIVED: DATE REPORTED: Parameter Unit SAMPLE DESCRIPTION: SAMPLE TYPE: DATE SAMPLED: G / S RDL KL-1 KL-2 KL-3 KL-4 KL-5 HWY HWY LSD Water Water Water Water Water Water Water Water Saturation ph (@ 4C) NA Total Beryllium ug/l 2 <2 <2 <2 <2 <2 <2 <2 <2 Total Copper ug/l <1 <1 <1 2 2 <1 Total Iron ug/l Total Manganese ug/l Total Zinc ug/l <5 <5 < <5 Total Coliforms (MPN) MPN/100 ml 1 >2420 > > >2420 >2420 E. Coli (MPN) MPN/100 ml Chlorophyll A - Acidification Method ug/l Chlorophyll A - Welschmeyer Method ug/l Total Kjeldahl Nitrogen as N mg/l Certified By: Original Signed CERTIFICATE OF ANALYSIS (V1) Page 3 of 8 Results relate only to the items tested and to all the items tested
61 CLIENT NAME: SNC Lavalin Inc. SAMPLING SITE: Certificate of Analysis AGAT WORK ORDER: 16X PROJECT: ATTENTION TO: Maria Gutierrez SAMPLED BY: SNC-Lavalin Bedford West Custom Inorganics Package 11 Morris Drive, Unit 122 Dartmouth, Nova Scotia CANADA B3B 1M2 TEL (902) FAX (902) DATE RECEIVED: DATE REPORTED: Parameter Unit SAMPLE DESCRIPTION: SAMPLE TYPE: DATE SAMPLED: G / S RDL Alkalinity mg/l 5 Chloride mg/l 1 True Color TCU 5 Nitrate + Nitrite as N mg/l 0.05 Nitrate as N mg/l 0.05 Nitrite as N mg/l 0.05 Ammonia as N mg/l 0.03 Total Organic Carbon mg/l 0.5 Ortho-Phosphate as P mg/l 0.01 ph Total Calcium mg/l 0.1 Total Magnesium mg/l 0.1 Total Phosphorus mg/l Total Potassium mg/l 0.1 Total Sodium mg/l 0.1 Reactive Silica as SiO2 mg/l 0.5 Total Suspended Solids mg/l 5 Sulphate mg/l 2 Turbidity NTU 0.1 Electrical Conductivity umho/cm 1 Anion Sum me/l Bicarb. Alkalinity (as CaCO3) mg/l 5 Calculated TDS mg/l 1 Carb. Alkalinity (as CaCO3) mg/l 10 Cation sum me/l Hardness mg/l % Difference/ Ion Balance (NS) % Langelier Index (@20C) NA Langelier Index (@ 4C) NA Saturation ph (@ 20C) NA LU PLM-1 PLM-2 Water Water Water <0.05 <0.05 <0.05 <0.03 <0.03 < <0.01 <0.01 < <5 18 < <10 <10 < Certified By: Original Signed CERTIFICATE OF ANALYSIS (V1) Page 4 of 8 Results relate only to the items tested and to all the items tested
62 CLIENT NAME: SNC Lavalin Inc. SAMPLING SITE: Certificate of Analysis AGAT WORK ORDER: 16X PROJECT: ATTENTION TO: Maria Gutierrez SAMPLED BY: SNC-Lavalin Bedford West Custom Inorganics Package 11 Morris Drive, Unit 122 Dartmouth, Nova Scotia CANADA B3B 1M2 TEL (902) FAX (902) DATE RECEIVED: DATE REPORTED: Parameter Unit Saturation ph 4C) NA SAMPLE DESCRIPTION: SAMPLE TYPE: DATE SAMPLED: G / S RDL Total Beryllium ug/l 2 Total Copper ug/l 1 Total Iron ug/l 50 Total Manganese ug/l 2 Total Zinc ug/l 5 Total Coliforms (MPN) MPN/100 ml 1 E. Coli (MPN) MPN/100 ml 1 Chlorophyll A - Acidification Method ug/l 0.05 Chlorophyll A - Welschmeyer Method ug/l 0.05 Total Kjeldahl Nitrogen as N mg/l 0.4 LU PLM-1 PLM-2 Water Water Water <2 <2 <2 3 < <5 <5 >2420 >2420 > Comments: RDL - Reported Detection Limit; G / S - Guideline / Standard Total Phosphorus was analysed at AGAT Mississauga. Chlorophyll A was analysed by a sub-contracted laboratory. Certified By: Original Signed CERTIFICATE OF ANALYSIS (V1) Page 5 of 8 Results relate only to the items tested and to all the items tested
63 CLIENT NAME: SNC Lavalin Inc. PROJECT: SAMPLING SITE: Quality Assurance Water Analysis AGAT WORK ORDER: 16X ATTENTION TO: Maria Gutierrez SAMPLED BY: 11 Morris Drive, Unit 122 Dartmouth, Nova Scotia CANADA B3B 1M2 TEL (902) FAX (902) RPT Date: Nov 03, 2016 DUPLICATE REFERENCE MATERIAL METHOD BLANK SPIKE MATRIX SPIKE PARAMETER Batch Sample Id Dup #1 Dup #2 RPD Method Blank Measured Value Acceptable Acceptable Acceptable Limits Recovery Limits Recovery Limits Lower Upper Lower Upper Lower Upper SNC-Lavalin Bedford West Custom Inorganics Package Alkalinity % < 5 99% 80% 120% NA 80% 120% NA 80% 120% Chloride % < 1 93% 80% 120% NA 80% 120% NA 80% 120% True Color NA < 5 95% 80% 120% 80% 120% 80% 120% Nitrate as N NA < % 80% 120% NA 80% 120% 96% 80% 120% Nitrite as N <0.05 <0.05 NA < % 80% 120% NA 80% 120% 102% 80% 120% Ammonia as N <0.03 <0.03 NA < % 80% 120% 80% 120% 105% 80% 120% Total Organic Carbon NA < % 80% 120% 80% 120% 95% 80% 120% Ortho-Phosphate as P NA < % 80% 120% 80% 120% 106% 80% 120% ph % < 100% 80% 120% NA 80% 120% NA 80% 120% Total Calcium % < % 80% 120% 113% 80% 120% 76% 70% 130% Total Magnesium % < % 80% 120% 112% 80% 120% 92% 80% 120% Total Phosphorus NA < % 90% 110% 104% 90% 110% 110% 80% 120% Total Potassium % < % 80% 120% 108% 80% 120% 102% 70% 130% Total Sodium % < % 80% 120% 110% 80% 120% 87% 70% 130% Reactive Silica as SiO % < % 80% 120% 80% 120% 101% 80% 120% Total Suspended Solids < 5 NA < 5 103% 80% 120% 120% 120% 104% 80% 120% Sulphate % < 2 112% 80% 120% NA 80% 120% 91% 80% 120% Turbidity % < % 80% 120% 80% 120% 80% 120% Electrical Conductivity % < 1 96% 80% 120% NA 80% 120% NA 80% 120% Bicarb. Alkalinity (as CaCO3) % < 5 NA 80% 120% NA 80% 120% NA 80% 120% Carb. Alkalinity (as CaCO3) <10 <10 NA < 10 NA 80% 120% NA 80% 120% NA 80% 120% Total Beryllium < 2 < 2 NA < 2 103% 80% 120% 109% 80% 120% 102% 70% 130% Total Copper NA < 1 111% 80% 120% 120% 80% 120% 107% 70% 130% Total Iron % < % 80% 120% NA 80% 120% 124% 70% 130% Total Manganese % < 2 115% 80% 120% 120% 80% 120% 109% 70% 130% Total Zinc NA < 5 114% 80% 120% 116% 80% 120% 99% 70% 130% Total Kjeldahl Nitrogen as N <0.4 <0.4 NA < % 80% 120% 80% 120% 112% 80% 120% Comments: If RPD value is NA, the results of the duplicates are less than 5x the RDL and the RPD will not be calculated. Certified By: QUALITY ASSURANCE REPORT (V1) Page 6 of 8 AGAT Laboratories is accredited to ISO/IEC by the Canadian Association for Laboratory Accreditation Inc. (CALA) and/or Standards Council of Canada (SCC) for specific tests listed on the scope of accreditation. AGAT Laboratories (Mississauga) is also accredited by the Canadian Association for Laboratory Accreditation Inc. (CALA) for specific drinking water tests. Accreditations are location and parameter specific. A complete listing of parameters for each location is available from and/or The tests in this report may not necessarily be included in the scope of accreditation. Results relate only to the items tested and to all the items tested Original Signed
64 CLIENT NAME: SNC Lavalin Inc. PROJECT: SAMPLING SITE: PARAMETER Method Summary AGAT S.O.P AGAT WORK ORDER: 16X ATTENTION TO: Maria Gutierrez SAMPLED BY: LITERATURE REFERENCE 11 Morris Drive, Unit 122 Dartmouth, Nova Scotia CANADA B3B 1M2 TEL (902) FAX (902) ANALYTICAL TECHNIQUE Water Analysis Alkalinity INORG SM 2320 B PC-TITRATE Chloride INORG SM 4110 B IC True Color INORG EPA NEPHELOMETER Nitrate + Nitrite as N INORG SM 4110 B CALCULATION Nitrate as N INORG SM 4110 B IC Nitrite as N INORG SM 4110 B IC Ammonia as N INORG SM 4500-NH3 G COLORIMETER Total Organic Carbon INORG SM 5310 B TOC ANALYZER Ortho-Phosphate as P INORG SM 4110 B COLORIMETER ph INOR SM 4500 H+B PC-TITRATE Total Calcium MET & MET SM 3125 ICP/MS Total Magnesium MET & MET SM 3125 ICP/MS Total Phosphorus INOR SM 4500-P B & E SPECTROPHOTOMETER Total Potassium MET & MET SM 3125 ICP/MS Total Sodium MET & MET SM 3125 ICP/MS Reactive Silica as SiO2 INORG SM 4110 B COLORIMETER Total Suspended Solids INOR , 6025 SM 2540C, D GRAVIMETRIC Sulphate INORG SM 4110 B IC Turbidity INORG SM 2130 B NEPHELOMETER Electrical Conductivity INOR SM 2510 B PC-TITRATE Anion Sum CALCULATION SM 1030E CALCULATION Bicarb. Alkalinity (as CaCO3) INORG SM 2320 B PC-TITRATE Calculated TDS SM 1030E CALCULATION Carb. Alkalinity (as CaCO3) INORG SM 2320 B PC-TITRATE Cation sum CALCULATION SM 1030E CALCULATION Hardness CALCULATION SM 2340B CALCULATION % Difference/ Ion Balance (NS) CALCULATION SM 1030E CALCULATION Langelier Index (@20C) CALCULATION CALCULATION CALCULATION Langelier Index (@ 4C) CALCULATION CALCULATION CALCULATION Saturation ph (@ 20C) CALCULATION CALCULATION CALCULATION Saturation ph (@ 4C) CALCULATION CALCULATION CALCULATION Total Beryllium MET & MET SM 3125 ICP/MS Total Copper MET & MET SM 3125 ICP/MS Total Iron MET & MET SM 3125 ICP/MS Total Manganese MET & MET SM 3125 ICP/MS Total Zinc MET & MET SM 3125 ICP/MS Total Coliforms (MPN) MIC Based on SM 9223B INCUBATOR E. Coli (MPN) MIC Based on SM 9223B INCUBATOR Chlorophyll A - Acidification Method Subcontracted Subcontracted Chlorophyll A - Welschmeyer Method Subcontracted Subcontracted ICP-MS Total Kjeldahl Nitrogen as N INOR SM 4500 NORG D COLORIMETER METHOD SUMMARY (V1) Page 7 of 8 Results relate only to the items tested and to all the items tested

65 Dalhousie University Department of Oceanography Halifax, N.S. B3H 4R2 28-Oct-16 AGAT Laboratories, 11 Morris Dr. Unit 122, Dartmouth, NS, B3B 1M2 Attention: Janetta Fraser Re: Determination of chlorophyll a in algae by fluorescence AGAT Job#: 16X PO#: Acidification Technique: Sample ID KL-1 KL-2 KL-3 KL-4 KL-5 HWY HWY LDS LU PML-1 PML-2 Chl a (µg/l) Welschmeyer Technique: Sample ID KL-1 KL-2 KL-3 KL-4 KL-5 HWY HWY Chl a (µg/l) phone: (902) fax: (902)
66 LDS LU PML-1 PML CHl a = chlorophyll a An underestimation of chl a occurs by the fluorescence acidification technique in the presence of Chl b. Since chl b containing chlorophytes are often present in freshwater ecosystems another technique (welschmeyer) was also employed. Reference for Welschmeyer technique Limnol. Oceanogr., 39(8) 1994, Received: 26-Oct-16 Completed: 27-Oct-16 Original Signed Shannah Rastin phone: (902) fax: (902)

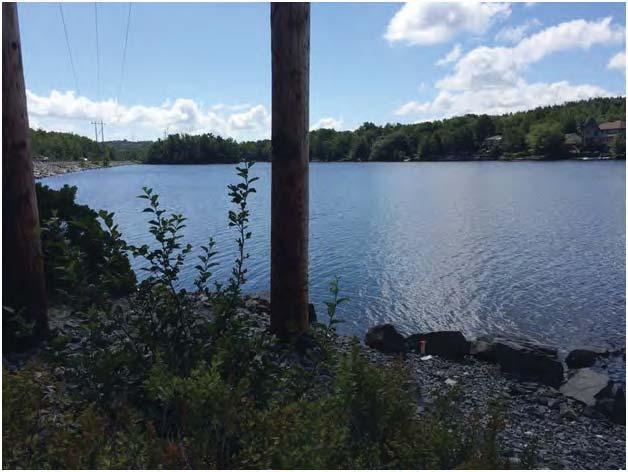
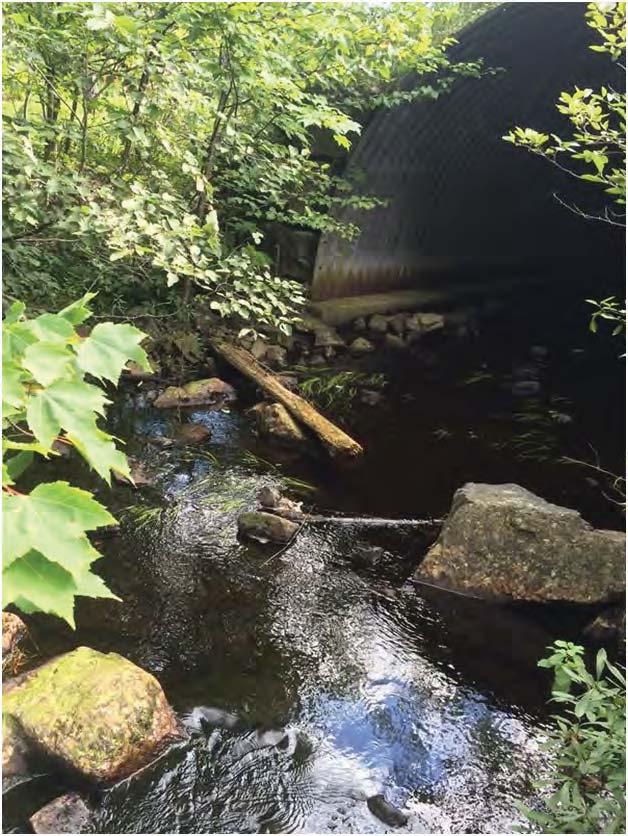
67
68 Dissolved Chloride ( mg/l) /06/ /10/ /02/ /06/ /10/ /02/ /06/ /10/ /02/ /06/ /10/ /02/ /06/ /10/ /02/ /06/ /10/ /02/ /06/ /10/ /02/ /06/ /10/01 Date (year/month/day) KL1 KL2 KL3 KL4 KL5 HWY102 1 HWY102 2 LSD LU PML1 PML2 CCME Guideline (LTE) Figure 1 - Dissolved chloride concentrations Seasonal Dissolved Chloride ( /10/ /02/ /06/ /10/ /02/ /06/ /10/ /02/ /06/ /10/ /02/ /06/ /10/ /02/ /06/ /10/ /02/ /06/ /10/ /02/ /06/ /10/01 Date (year/month/day) KL1 KL2 KL3 KL4 KL5 HWY102 1 HWY102 2 LSD LU PML1 PML2 CCME Guideline (LTE) Figure 2 Seasonal dissolved chloride concentrations APPENDIX E BEDFORD WEST WATER QUALITY MONITORING FINAL REPORT FALL T 4E REP
69 APPENDIX E BEDFORD WEST WATER QUALITY MONITORING FINAL REPORT FALL T 4E REP Figure 3 ph Figure 4 Seasonal ph /06/ /10/ /02/ /06/ /10/ /02/ /06/ /10/ /02/ /06/ /10/ /02/ /06/ /10/ /02/ /06/ /10/ /02/ /06/ /10/ /02/ /06/ /10/01 KL1 KL2 KL3 KL4 KL5 HWY102 1 HWY102 2 LSD LU PML1 PML2 CCME Upper Guideline CCME Lower Guideline ph Date (year/month/day) /10/ /02/ /06/ /10/ /02/ /06/ /10/ /02/ /06/ /10/ /02/ /06/ /10/ /02/ /06/ /10/ /02/ /06/ /10/ /02/ /06/ /10/01 KL1 KL2 KL3 KL4 KL5 HWY102 1 HWY102 2 LSD LU PML1 PML2 CCME Upper Guideline CCM Lower Guideline Seasonal ph Date (year/month/day)
70 Total Suspended Solids (mg/l) /06/ /10/ /02/ /06/ /10/ /02/ /06/ /10/ /02/ /06/ /10/ /02/ /06/ /10/ /02/ /06/ /10/ /02/ /06/ /10/ /02/ /06/ /10/01 KL1 KL2 KL3 KL4 KL5 HWY102 1 HWY102 2 LSD LU PML1 PML2 Date (year/month/day) Figure 5 Total suspended solids concentrations Seasonal Total Suspended Solids (mg/l) /10/ /02/ /06/ /10/ /02/ /06/ /10/ /02/ /06/ /10/ /02/ /06/ /10/ /02/ /06/ /10/ /02/ /06/ /10/ /02/ /06/ /10/01 KL1 KL2 KL3 KL4 KL5 HWY102 1 HWY102 2 LSD LU PML1 PML2 Date (year/month/day) Figure 6 Seasonal total suspended solids concentrations APPENDIX E BEDFORD WEST WATER QUALITY MONITORING FINAL REPORT FALL T 4E REP
71 Total Phosphorus (mg/l) /06/ /10/ /02/ /06/ /10/ /02/ /06/ /10/ /02/ /06/ /10/ /02/ /06/ /10/ /02/ /06/ /10/ /02/ /06/ /10/ /02/ /06/ /10/01 Date (year/month/day) KL1 KL2 KL3 KL4 KL5 HWY102 1 HWY102 2 LSD LU PML1 PML2 HRM Management Threshold Figure 7 Total phosphorus concentrations KL1 1 KL2 Seasonal Total Phosphorus (mg/l) /10/ /02/ /06/ /10/ /02/ /06/ /10/ /02/ /06/ /10/ /02/ /06/ /10/ /02/ /06/ /10/ /02/ /06/ /10/ /02/ /06/ /10/01 Date (year/month/day) KL3 KL4 KL5 HWY102 1 HWY102 2 LSD LU PML1 PML2 HRM Management Threshold Figure 8 Seasonal total phosphorus concentrations APPENDIX E BEDFORD WEST WATER QUALITY MONITORING FINAL REPORT FALL T 4E REP
72 APPENDIX E BEDFORD WEST WATER QUALITY MONITORING FINAL REPORT FALL T 4E REP Figure 9 Conductivity Figure 10 Seasonal conductivity /06/ /10/ /02/ /06/ /10/ /02/ /06/ /10/ /02/ /06/ /10/ /02/ /06/ /10/ /02/ /06/ /10/ /02/ /06/ /10/ /02/ /06/ /10/01 KL1 KL2 KL3 KL4 KL5 HWY102 1 HWY102 2 LSD LU PML1 PML2 Conductivity (μs/cm) Date (year/month/day) /10/ /02/ /06/ /10/ /02/ /06/ /10/ /02/ /06/ /10/ /02/ /06/ /10/ /02/ /06/ /10/ /02/ /06/ /10/ /02/ /06/ /10/01 KL1 KL2 KL3 KL4 KL5 HWY102 1 HWY102 2 LSD LU PML1 PML2 Seasonal Conductivity (μs/cm) Date (year/month/day)
73 Chlorophyll A (μg/l) /06/ /10/ /02/ /06/ /10/ /02/ /06/ /10/ /02/ /06/ /10/ /02/ /06/ /10/ /02/ /06/ /10/ /02/ /06/ /10/ /02/ /06/ /10/01 KL1 KL2 KL3 KL4 KL5 HWY102 1 HWY102 2 LSD LU PML1 PML2 Date (year/month/day) Figure 11 Chlorophyll A concentrations Seasonal Chlorophyll A (μg/l) /10/ /02/ /06/ /10/ /02/ /06/ /10/ /02/ /06/ /10/ /02/ /06/ /10/ /02/ /06/ /10/ /02/ /06/ /10/ /02/ /06/ /10/01 KL1 KL2 KL3 KL4 KL5 HWY102 1 HWY102 2 LSD LU PML1 PML2 Date (year/month/day) Figure 12 Seasonal chlorophyll A concentrations APPENDIX E BEDFORD WEST WATER QUALITY MONITORING FINAL REPORT FALL T 4E REP


74
French Creek Well # 2 Water Analysis Behind 1221 Ormonde Road
 French Creek Well # 2 Water Analysis Behind 1221 Ormonde Road October 27 2010 Inorganics Fluoride 1.5 MAC 0.17 0.13
Appendix C Aquatic Environment - Photographs and Tables
 Appendix C Aquatic Environment Photographs and Tables AECOM Hudson Bay Mining and Smelting Co., Limited Reed Project Environmental Baseline Assessment Photograph P113. Reed Lake Station 5 (Looking West)
SPECIFICATION NO.1197S Addendum No.4 Attachment D. Appendix L- Ground Water Quality Data and Revised Construction Groundwater Discharge Plan
 SPECIFICATION NO.1197S Addendum No.4 Attachment D Appendix L- Ground Water Quality Data and Revised Construction Groundwater Discharge Plan Page 1 of 2 Specification No. 1197S Addendum No. 4 ATTACHMENT
Appendix C: Water Quality Data
 Appendix C: Water Quality Data Your Project #: 111257005 Site: TIM HORTONS SYLVIA LAKE NSD # 16300R Attention: DAVID WHETTER STANTEC CONSULTING LTD 603-386 BROADWAY AVENUE WINNIPEG, MB CANADA R3C
CERTIFICATE OF ANALYSIS
 Site#: WISOR FORKS Your C.O.C. #: Attention: Karen Hardacker PO Box 340 Berwick, NS CANADA B0P E0 Report Date: 8/2/0 Report #: R55937 Version: Final MAXXAM JOB #: B8W452 Received: 8/2/04, :29 Sample Matrix:
CERTIFICATE OF ANALYSIS
 Your Project #: 001\DRINKABLE WATER Your C.O.C. #: na Attention: Michael Bourgon 7111 Syntex Dr Suite 354 Mississauga, ON CANADA L5B 4P5 CERTIFICATE OF ANALYSIS MAXXAM JOB #: B2H1428 Received: 2012/11/01,
CERTIFICATE OF ANALYSIS
 Your C.O.C. #: 32531001 Attention: Scott Churko Engineering and Operations Dpt PO Box 1390 Parksville, BC Canada V9P 2H3 CERTIFICATE OF ANALYSIS MAXXAM JOB #: B279455 Received: 2012/09/06, 09:15 Sample
CERTIFICATE OF ANALYSIS
 BAY 3, 4500 5TH STREET NE CALGARY, AB CANADA T2L 7C3 MAXXAM JOB #: A814851 Received: 2008/04/02, 13:15 Matrix: Water # s Received: 1 This report supersedes all previous reports with the same Maxxam job
Appendix U. Mapping of Water Quality Concentration Contours across the Province
 ALDERON IRON ORE CORP. ENVIRONMENTAL IMPACT STATEMENT KAMI IRON ORE MINE AND RAIL INFRASTRUCTURE, LABRADOR Appendix U Mapping of Water Quality Concentration Contours across the Province Figure 17I.1 Alkalinity
CANADA BRITISH COLUMBIA WATER QUALITY MONITORING AGREEMENT
 CANADA BRITISH COLUMBIA WATER QUALITY MONITORING AGREEMENT WATER QUALITY ASSESSMENT OF Fraser River AT RED PASS (1984 4) Prepared by: L. G. Swain, P. Eng. B.C. Ministry of Environment Prepared for: B.C.
CANADA BRITISH COLUMBIA WATER QUALITY MONITORING AGREEMENT
 CANADA BRITISH COLUMBIA WATER QUALITY MONITORING AGREEMENT WATER QUALITY ASSESSMENT OF Salmon River AT SALMON ARM (1985 24) Prepared by: L. G. Swain, P. Eng. B.C. Ministry of Environment Prepared for:
In the fall of 2008, Barr and PolyMet identified four sources of historical Colby Lake water quality data. Those sources are listed below:
 External Memorandum To: Dave Blaha, ERM From: Miguel Wong and Katie Wenigmann Project: 23/69 0862.00 006 001 c: Jim Scott, PolyMet; Stuart Arkley, MDNR; John Borovsky, Barr PolyMet has not been requested
CERTIFICATE OF ANALYSIS REVISED REPORT
 Your C.O.C. #: XXXXXXXX Attention: 23 MAIN ST, CITY, PROVIE COUNTRY POSTAL CODE Report Date: 5/09/7 Report #: XXXXXXXX Version: 2 - Revision MAXXAM JOB #: XXXXXXX Received: 5/09/03, 5:9 Sample Matrix:
ANALYTES available for testing
 ANALYTES available for testing codes WS = water supply, drinking water, potable water WP = wastewater, general water quality, ODA OK = Oklahoma DEQ ODA = Oklahoma Department of Agriculture KS = Kansas
CANADA BRITISH COLUMBIA WATER QUALITY MONITORING AGREEMENT
 CANADA BRITISH COLUMBIA WATER QUALITY MONITORING AGREEMENT WATER QUALITY ASSESSMENT OF KOOTENAY RIVER NEAR FENWICK STATION (1984 25) Prepared by: L. G. Swain, P. Eng. B.C. Ministry of Environment Prepared
Surface Water Monitoring Report CE4A Pumping Test Caledon East, Ontario
 Surface Monitoring Report CE4A Pumping Test Caledon East, Ontario Prepared for: Hatch Mott MacDonald Prepared by: Azimuth Environmental Consulting, Inc. September 2013 AEC 09-016e AZIMUTH ENVIRONMENTAL
Raw Potable Well Water Analysis: Grid Water Analysis: 2009 & 2016
 Raw Potable Well Analysis: 2006-2016 Grid Analysis: 2009 & 2016 Sun Peaks, British Columbia Sun Peaks Utilities Co., Ltd. 1280 Alpine Road Sun Peaks, BC V0E 5N0 Tel: 250-578-5490 Fax: 250-578-5516 Email:
State of Nevada Department of Conservation and Natural Resources Division of Environmental Protection Laboratory Scope of Accreditation
 Matrix: CWA (Non Potable Water) Discipline EPA 120.1 Chemistry Conductivity 8/1/2015 Aluminum 8/1/2015 Antimony 8/1/2015 Arsenic 8/1/2015 Barium 8/1/2015 Beryllium 8/1/2015 Boron 8/1/2015 Cadmium 8/1/2015
BLACK STURGEON LAKES WATER QUALITY MONITORING
 BLACK STURGEON LAKES WATER QUALITY MONITORING 2015 REPORT Prepared by: Ryan Haines, B.Sc. Biologist and Project Management Kenora Resource Consultants Inc. Site 155, Compartment 14, RR #1 Kenora, ON P9N
Final Report WP-225. WatR Pollution Study. Open Date: 10/18/13. Close Date: 12/02/13. Report Issued Date: 12/04/13
 WP-225 Final Report WatR Pollution Open : 10/18/13 Close : 12/02/13 Report Issued : December 4, 2013 Enclosed is your final report for ERA's WP-225 WatR Pollution Proficiency Testing (PT) study. Your final
CALA Directory of Laboratories
 CALA Directory of Laboratories Membership Number: 2635 Laboratory Name: Taiga Environmental Laboratory Parent Institution: Government of Northwest Territories (GNWT) Address: P.O. Box 1320 4601-52nd Avenue
BLACK STURGEON LAKES WATER QUALITY MONITORING
 BLACK STURGEON LAKES WATER QUALITY MONITORING 2017 REPORT Prepared by: Ryan Haines, B.Sc. Biologist and Project Management Kenora Resource Consultants Inc. Site 155, Compartment 14, RR #1 Kenora, ON P9N
DROGHEDA LANDFILL SITE COLLON ROAD, MELL, DROGHEDA
 GROUNDWATER MONITORING INFORMATION QUARTERLY REPORT FOR PERIOD APRIL TO JUNE 216 BY LOUTH COUNTY COUNCIL TO ENVIRONMENTAL PROTECTION AGENCY FOR WASTE LICENCE REFERENCE: W33-1 DROGHEDA LANDFILL SITE COLLON
State of Nevada Department of Conservation and Natural Resources Division of Environmental Protection Laboratory Scope of Accreditation
 Matrix: CWA (Non Potable Water) Discipline: Chemistry ASTM D516-07 ASTM D6888-09 ASTM D7511-09e2 EPA 160.4 EPA 1631E EPA 1664A EPA 1664A (SGT-HEM) EPA 180.1 Sulfate 8/1/2018 Cyanide, Amenable 8/1/2018
CERTIFICATE OF ANALYSIS
 Your Project #: QUARTERLY Your C.O.C. #: G883 Attention:Simon Palmer 3567 East Road Denman Island, BC CANADA V0R T0 Report Date: 7/04/3 Report #: R236969 Version: Final MAXXAM JOB #: B725550 Received:
04-H Rocky Lake Tap Water 04/09/30 04/09/ B nd. nd nd nd nd. nd nd
 norganic Parameters page: 1. ANALYTCAL SERVCES : Alpha Chemical Ltd. NS B3B 1T8 pac Project NUmber 0417932H Project Number FAX # : 468-8540 Printed: 2004/10/07 (Event 669) Reported. 2004/10/07 Matrix Philip
CERTIFICATE OF ANALYSIS
 Your Project #: VIHA LIST Your C.O.C. #: Attention:Don Buchner 24 Lions Way Qualicum Beach, BC Canada V9K 2E2 Report : 16/11/28 Report #: R207445 Version: 1 Final MAXXAM JOB #: B6A568 Received: 16/11/18,
Appendix C1: Batch Kinetics Tests
 Appendix C1: Batch Kinetics Tests This appendix contains the entire data set for the batch kinetics tests for the potential biofilter components. These tests were performed to provide estimates of optimal
CANADA BRITISH COLUMBIA WATER QUALITY MONITORING AGREEMENT
 CANADA BRITISH COLUMBIA WATER QUALITY MONITORING AGREEMENT WATER QUALITY ASSESSMENT OF Elk River AT SPARWOOD (2 5) Prepared by: L. G. Swain, P. Eng. B.C. Ministry of Environment Prepared for: B.C. Ministry
Final Report DMR-QA 36. NPDES Permit: IL DMR-QA Study. Open Date: 03/18/16. Close Date: 07/01/16. Report Issued Date: 07/29/16
 Keith Richard Decatur Sanitary District Decatur, IL 62522-1842 USA DMR-QA 36 Final Report NPDES Permit: IL0028321 DMR-QA Study Open Date: 03/18/16 Close Date: 07/01/16 Report Issued Date: 07/29/16 Study
As a reminder, continued participation in the Ecology Lab Accreditation Program requires the lab to:
 April 11, 2017 Mr. Brad Barfuss 350 Hills Street Suite 107 Richland, WA 99354 Dear Mr. Barfuss: Thank you for your application for renewal in the Environmental Laboratory Accreditation Program. Enclosed
NEILSON RESEARCH CORPORATION
 NEILSON RESEARCH CORPORATION Environmental Testing Laboratory 5/23/2016 Russell Deen Southern Oregon University TEL: (541) 552-6798 FAX (541) 552-6415 RE: Dear Russell Deen: Order No.: 1605610 received
CANADA BRITISH COLUMBIA WATER QUALITY MONITORING AGREEMENT
 CANADA BRITISH COLUMBIA WATER QUALITY MONITORING AGREEMENT WATER QUALITY ASSESSMENT OF Thompson River AT SPENCES BRIDGE (1984 24) Prepared by: L. G. Swain, P. Eng. B.C. Ministry of Environment Prepared
Holcim (Australia) Pty Limited. Lynwood Quarry Groundwater Monitoring Program Revision 2
 Pty Limited. Lynwood Quarry Groundwater Monitoring Program Revision 2") Holcim (Australia) Pty Limited Lynwood Quarry Groundwater Monitoring Program Revision 2 June 2011 Lynwood Quarry Groundwater Monitoring Program Revision 2 Prepared by on behalf of Holcim (Australia) Pty
Holcim (Australia) Pty Limited Lynwood Quarry Groundwater Monitoring Program Revision 2 June 2011 Lynwood Quarry Groundwater Monitoring Program Revision 2 Prepared by on behalf of Holcim (Australia) Pty
Statewide Characterization of Oklahoma s Major Aquifers
 Statewide Characterization of Oklahoma s Major Aquifers Mark Belden, Brittany McCall, Sarah Yepez Water Quality Programs Division, OWRB Oklahoma Clean Lakes & Watersheds Conference April 5-6, 2017 Groundwater
CERTIFICATE OF ANALYSIS
 Attention:Simon Palmer 3567 East Road Denman Island, BC CANADA V0R T0 Your Project #: COMPREHENSIVE 7 Your C.O.C. #: G86 Report Date: Report #: R2435 Version: Final MAXXAM JOB #: B754384 Received: 7/07/05,
1.0 INTRODUCTION 2.0 APPROACH. DATE 13 April 2012 PROJECT No
 DATE 13 April 2012 PROJECT No. 10-1373-0037 TO Rick Schryer Fortune Minerals Limited CC Jen Gibson (Golder) Tammie Morgan-Gray; Stephen Cioccio; Andrea FROM Amendola; Theresa-Repaso-Subang; Rein Jaagumagi
CANADA-BRITISH COLUMBIA WATER QUALITY MONITORING AGREEMENT
 CANADA-BRITISH COLUMBIA WATER QUALITY MONITORING AGREEMENT WATER QUALITY ASSESSMENT OF THE ISKUT RIVER BELOW JOHNSON RIVER, BRITISH COLUMBIA (199 7) PREPARED BY: T. C. E. DESSOUKI B.C. MINISTRY OF ENVIRONMENT
2016 Performance Report FRenCh Creek
 2016 Performance Report FRenCh Creek 2016 PERFORMANCE HIGHLIGHTS Table of Contents Operational Excellence 3 Measuring Success 3 2016 Highlights 3 Water Quality & Quality Assurance 4 Safety 6 Customer Care
Environment Environnement Canada Canada. Ministry Of Environment, Lands And Parks. Canada - British Columbia Water Quality Monitoring Agreement
 State Of Water Quality Of Unuk River Near U.S. Border 1991-1993 Environment Environnement Canada Canada Ministry Of Environment, Lands And Parks Canada - British Columbia Water Quality Monitoring Agreement
CERTIFICATE OF ANALYSIS REVISED REPORT
 Your C.O.C. #: A122303 Attention: STEPHEN LEGAREE EDMONTON 9331 9331-48 Street EDMONTON, AB CANADA T6B 2R4 Report #: R1787645 Version: 2R CERTIFICATE OF ANALYSIS REVISED REPORT MAXXAM JOB #: B4B4991 Received:
um"ts: m1 1grams per rt1er (mg./l)
") 28 Clark Avenue St. Louis, MO 633-257 4 (314) 531-8080 FAX (31 4) 531-8085 P.O. Box 897 Page 1of8 REPORT OF ALYSIS ID: WATER NO. 1-1 5 T FLOOR BREAKROOM, 05/09/16 um"ts: m1 1grams per rt1er (mg./l) ANION
28 Clark Avenue St. Louis, MO 633-257 4 (314) 531-8080 FAX (31 4) 531-8085 P.O. Box 897 Page 1of8 REPORT OF ALYSIS ID: WATER NO. 1-1 5 T FLOOR BREAKROOM, 05/09/16 um"ts: m1 1grams per rt1er (mg./l) ANION
Quality Compost from Source Separated Organic Material and Biosolids in East Prince County Prince Edward Island
 Quality Compost from Source Separated Organic Material and Biosolids in East Prince County Prince Edward Island A Paper presented by D.E. Jardine Director of Pollution Prevention, Department of Fisheries,
As a reminder, continued participation in the Ecology Lab Accreditation Program requires the lab to:
 April 9, 2015 Ms. Elisa Nguyen Energy Northwest Environmental Services Lab 350 Hills Street Suite 107 Richland,WA 99354 Dear Ms. Nguyen: Thank you for your application for renewal in the Environmental
Globeville Landing Outfall Surface Water. December 12, 2017 Andrew Ross, Jon Novick Denver Department of Public Health & Environment
 Globeville Landing Outfall Surface Water December 12, 2017 Andrew Ross, Jon Novick Denver Department of Public Health & Environment Introductions Andrew Ross Environmental Program Manager, DDPHE Jon Novick
Results from the 2017 Water Quality Monitoring Program
 Results from the 217 Water Quality Monitoring Program As part of a larger project, this summer the BWC conducted water sampling throughout the Belleisle Bay to get a baseline of data and determine the
CALA Directory of Laboratories
 CALA Directory of Laboratories Membership Number: 1429 Laboratory Name: Saint John Laboratory Services Ltd. Parent Institution: Address: 1216 Sand Cove Rd. Saint John NB E2M 5V8 Contact: Dr. Apollos Ikejiani
 TABLE 4 Water Chemistry Proposed Quarry, Whites Cove, Digby Neck, NS JWEL Project No NSD17221 Parameters EQL Units Criteria* NS-02-01 (Sept 9, 2002) Sodium 0.1 mg/l 200 AO 18 Potassium 0.1 mg/l - 0.7 Calcium
Acidity and Alkalinity:
 Evaluation of Pollution Sources to Lake Glenville Quarterly Report December 2018 Kimberlee K Hall, PhD Environmental Health Program, Western Carolina University Summary Chemical and microbial analysis
FORTUNE MINERALS LIMITED 140 Fullarton Street, Suite 1902, London, Ontario, Canada N6A 5P2 Tel ~ Fax
 FORTUNE MINERALS LIMITED 140 Fullarton Street, Suite 1902, London, Ontario, Canada N6A 5P2 Tel. 519-858-8188 ~ Fax. 519-858-8155 September 30, 2011 Chuck Hubert Environmental Assessment Officer Mackenzie
CANADA BRITISH COLUMBIA WATER QUALITY MONITORING AGREEMENT
 CANADA BRITISH COLUMBIA WATER QUALITY MONITORING AGREEMENT WATER QUALITY ASSESSMENT OF KETTLE RIVER AT MIDWAY (1972 2) Prepared by: BWP Consulting Kamloops, B.C. January, 23 Environment Canada Environnement
CERTIFICATE OF ANALYSIS
 Attention: REAL GUILBAULT 330 CANAL STREET BOX 638 BROOKS, AB CANADA T1R 1B6 Your Project #: 2014 TREATED SUMMER SAMPLE Your C.O.C. #: A185329 Report #: R1670505 Version: 1 CERTIFICATE OF ANALYSIS MAXXAM
El Dorado Hydroelectric Project FERC Project No Water Quality Monitoring Report
 El Dorado Hydroelectric Project FERC Project No. 184 21 Water Quality Monitoring Report EL DORADO IRRIGATION DISTRICT 289 Mosquito Road Placerville, CA 95667 March 211 1. Introduction The El Dorado Irrigation
CERTIFICATE OF ANALYSIS
 1 CERTIFICATE OF ANALYSIS ATTENTION: Water Purification Solutions DATE: 29 November 2018 1. GENERAL: Table-1: Tierkloof Borehole & Product - Sampled 1 November 2018 Results expressed in parts per million
Lake Washington. Water Quality Assessment Report. Copyright 2012 PLM Lake & Land Management Corp.
 Lake Washington 2012 Water Quality Assessment Report Copyright 2012 PLM Lake & Land Management Corp. Water Quality Report On May 22nd, June 18th, July 30th, August 29th, and September 27 th, 2012, PLM
4.0 SAN GABRIEL RIVER WATERSHED MANAGEMENT AREA
 4.0 SAN GABRIEL RIVER WATERSHED MANAGEMENT AREA 4.1 Watershed Description 4.1.1 Watershed Land Use, Percent Impervious, and Population Land use in the San Gabriel River Watershed Management Area is approximately
Farm Water Quality Considerations
 Farm Water Quality Considerations The quality of water on farm can have economic impacts for farmers through its effects on livestock, crop production, and the effectiveness of pesticides and other agricultural
Certificate of Analysis
 Town of Niverville ATTN: RYAN DYCK/ANDREW REMPEL PO Box 267 Niverville MB R0A 1E0 Date Received: Report Date: Version: 27-APR-16 14:57 (MT) FINAL Client Phone: 204-392-3012 Certificate of Analysis Lab
CALA Directory of Laboratories
 CALA Directory of Laboratories Membership Number: 2907 Laboratory Name: Avalon Laboratories Inc. Parent Institution: Avalon Laboratories Inc. Address: 85C Bremigens Blvd Paradise NL A1L 4A2 Contact: Ms.
Warm Mineral Springs Sampling by Sarasota County
 Warm Mineral Springs Sampling by Sarasota County John Ryan, Kathryn Meaux, Rene Janneman and Jon S. Perry Sarasota County Environmental Services Sarasota, Florida September 11 Warm Mineral Springs is a
PROJECT NO. G E1
 PROPOSED GROUNDWATER MONITORING PROGRAM PROPOSED RESIDENTIAL DEVELOPMENT PART OF LOT 30, CONCESSION 11 FORMER TOWNSHIP OF OTONABEE COUNTY OF PETERBOROUGH PROJECT NO. G023286 E1 Prepared for: Safe Harbour
Water Quality Protection Issues for New Water Supply Wells
 Water Quality Protection Issues for New Water Supply Wells Water Quality Protection Issues for New Water Supply Wells Project siting Facility water balance Supply well water quality analysis Supply well
KKB Micro Testing Labs Pvt. Ltd., , 2 nd Floor, Tarun Plaza, NFC Main Road, Krishna Nagar Colony, Moula Ali, Hyderabad, Telangana
 Last Amended on - Page 1 of 7 I. AIR, GASES & ATMOSPHERE 1. Ambient Air Monitoring RSPM ( PM 10) IS 5182 (Part 23): 2006 (RA ) 5 µg/m 3 to 750 µg/m 3 PM 2.5 SOP 11 dated 17.11.2014 12.5 µg/m 3 to 500 µg/m
EPA Primary. (mg/l as CaCO3) (mg/l as CaCO3)
 (mg/l as CaCO3)") NORTH TEXAS MUNICIPAL WATER DISTRICT - Wylie Water Analysis Jan-2018 Mineral Analysis Raw Treated Standards Residue on Evaporation 412 456 500 1000 Silica (SiO2) 3.63 3.41 Iron (Fe) 0.378 0.259 0.3 0.3
NORTH TEXAS MUNICIPAL WATER DISTRICT - Wylie Water Analysis Jan-2018 Mineral Analysis Raw Treated Standards Residue on Evaporation 412 456 500 1000 Silica (SiO2) 3.63 3.41 Iron (Fe) 0.378 0.259 0.3 0.3
CALA Directory of Laboratories
 CALA Directory of Laboratories Membership Number: 4114 Laboratory Name: African Assay Laboratories Ltd (Tanzania)- Environmental Laboratory Parent Institution: Address: Balewa Road Mwanza 255 Contact:
That there is sufficient quantity of groundwater from the water well for the intended use.
 Houle Chevrier Engineering Ltd. 32 Steacie Drive Ottawa, Ontario K2K 2A9 tel: 613.836.1422 fax: 613.836.9731 ottawa@hceng.ca www.hceng.ca ArchNova Design Inc. 45 Banner Road Ottawa, Ontario January 12,
Drinking Water Quality Monitoring Report Vancouver Police Department Vancouver, British Columbia
 Drinking Water Quality Monitoring Report Vancouver Police Department Vancouver, British Columbia Prepared for: City of Vancouver Environmental Services 4 West th Avenue Vancouver, British Columbia VY V4
CALIFORNIA STATE ENVIRONMENTAL LABORATORY ACCREDITATION PROGRAM Accredited Fields of Testing
 CALIFORNIA STATE ENVIRONMENTAL LABORATORY ACCREDITATION PROGRAM Accredited Fields of Testing Basic Laboratory, Inc. 2218 Railroad Avenue Redding, CA 96001 Phone: (530) 243-7234 Field of Testing: 101 -
CALA Directory of Laboratories
 CALA Directory of Laboratories Membership Number: 3086 Laboratory Name: E3 Laboratories Inc. Parent Institution: Address: Unit #10, SS#4 360 York Road Niagara-on-the Lake ON L0S 1J0 Contact: Dr. Nilou
Statistics valid as of January 2004.
 After completion each well typically requires initial fracturing (fracing) operation to realize maximum gas production with additional fracing every few years. Statistics valid as of January 2004. Basic
QUESTIONNAIRE FOR GENERAL WTP REQUESTED DATA FOR THE WATER TREATMENT PLANT (WTP) - Application : groundwater (well pit); urban wastewater;
 - Application : groundwater (well pit); urban wastewater;") REQUESTED DATA FOR THE WATER TREATMENT PLANT (WTP) - Application : ENVIRONMENTAL DATA - Temperature min. : C - Temperature max. : C - Altitude (m.a.s.l) : m - Plant location (geographic area, seismic zone,
REQUESTED DATA FOR THE WATER TREATMENT PLANT (WTP) - Application : ENVIRONMENTAL DATA - Temperature min. : C - Temperature max. : C - Altitude (m.a.s.l) : m - Plant location (geographic area, seismic zone,
The licensee shall take the actions specified to close out the non-compliances and observations raised in this Site Visit Report.
 Site Visit Report The site visit process is a sample on a particular day of an installation's compliance with some of its licence conditions. Where non-compliance against a particular condition has not
Jacqueline Ho, Mackenzie Valley Land and Water Board
 To: From: cc: Subject: Jacqueline Ho, Mackenzie Valley Land and Water Board Judy Dudley John Key, Julian Morse, Tim Smith, Jeff Hussey MVLWB May 15, 2018 Information Request for MV2018L2-003 Pine Point
CANADA BRITISH COLUMBIA WATER QUALITY MONITORING AGREEMENT
 CANADA BRITISH COLUMBIA WATER QUALITY MONITORING AGREEMENT WATER QUALITY ASSESSMENT OF SIMILKAMEEN RIVER AT US BORDER (1976 2) Prepared by: Burke Phippen BWP Consulting March, 22 Environment Canada Environnement
2017 FReNCH CReeK PerFormanCe Report
 2017 FReNCH CReeK PerFormanCe Report TABLe OF ContentS About us Quality Assurance Safety and Environment Customer Care Operational Excellence 3 4 7 8 9 ABOUT US EPCOR has been providing clean drinking
Influent preheating (note that the heat will be recovered before discharge);
;") TO Rick Schryer - Fortune Minerals Limited DATE 23 February 2012 CC Jen Gibson FROM Bridgette Hendricks, Kevin Conroy PROJECT No. 09-1373-1004.9600 UNDERTAKING #1 EFFLUENT TREATMENT SYSTEM INFORMATION
TO Rick Schryer - Fortune Minerals Limited DATE 23 February 2012 CC Jen Gibson FROM Bridgette Hendricks, Kevin Conroy PROJECT No. 09-1373-1004.9600 UNDERTAKING #1 EFFLUENT TREATMENT SYSTEM INFORMATION
State of Utah. Department of Health Environmental Laboratory Certification Program. Certification is hereby granted to
 State of Utah Department of Health Environmental Laboratory Certification Program Certification is hereby granted to 1673 Terra Avenue Sheridan, WY 82801 Has conformed with the 2009 TN/ Standard Scope
Table B1: Analytical Results for Nutrients in Surface Water
 Table B1: Analytical Results for Nutrients in Surface Water Sample ID 1 2 Physical Tests Colour, True (Colour Units) 15 (4) units absolute, or 5 units above background (30-day average)
BINDER #8 Appendix K to O
 BINDER #8 Appendix K to O GEOCHEMICAL SAMPLING, TRENCHING AND DIAMOND DRILLING ASSESSMENT REPORT FOR 2007 FRASERGOLD PROPERTY, WILLIAMS LAKE AREA, BRITISH COLUMBIA APPENDIX NAME PAGE APP.K Specific Gravity
CANADA BRITISH COLUMBIA WATER QUALITY MONITORING AGREEMENT
 CANADA BRITISH COLUMBIA WATER QUALITY MONITORING AGREEMENT WATER QUALITY ASSESSMENT OF Fraser River AT MARGUERITE (1984 24) Prepared by: L. G. Swain, P. Eng. B.C. Ministry of Environment Prepared for:
Please find information regarding the Leachate reporting requirements for the July 15, 2018
 From: Sent: To: Subject: Attachments: SPOMO1701@outlook.com Monday, July 16, 2018 10:16 PM Environmental Compliance ENV:EX; marty@chholdings.ca SPO MO1701 20180715 Status Update July 15, 2018 CHH Progress
BC Approved Water Quality Guidelines (updated to 2014) Compendium of Working Water Quality Guidelines (updated to 2006)
 Compendium of Working Water Quality Guidelines (updated to 2006)") 13477-116 Ave Surrey, BC Canada V3R 6W4 April 15, 2014 Web Kassa Environment Canada 401 Burrard Street Vancouver, British Columbia V6C 3S5 Re: Addendum to April 9, 2014 submission: Summary of in situ and
13477-116 Ave Surrey, BC Canada V3R 6W4 April 15, 2014 Web Kassa Environment Canada 401 Burrard Street Vancouver, British Columbia V6C 3S5 Re: Addendum to April 9, 2014 submission: Summary of in situ and
Laboratory Report. Analytical Sciences. Report Date: September 22, Ray's Well Testing Service 4853 Vine Hill Rd. Sebastopol, CA 95472
 Analytical Sciences Report Date: September 22, 2017 Laboratory Report Ray's Well Testing Service 4853 Vine Hill Rd. Sebastopol, CA 95472 Project Name: Lab Project Number: 2781 Warm Springs Rd. 7091218
2019 Microbac Laboratories Inc. Ohio Valley Division
 STATE OF NORTH CAROLINA DEPARTMENT OF ENVIRONMENTAL QUALITY DIVISION OF WATER RESOURCES LABORATORY CERTIFICATION BRANCH In accordance with the provisions of N.C.G.S. 143-215.3 (a) (1), 143-215.3 (a)(10)
Environmental Protection Agency
 PO Box 3000, Johnstown Castle Estate, Wexford Testing Laboratory Registration number: 113T is accredited by the Irish National Board (INAB) to undertake testing as detailed in the Schedule bearing the
Village of McBride Annual Water System Report
 Village of McBride Annual Water System Report - 2016 June 2017 The Village of McBride Annual Water System Report - 2016 McBride Water System Annual Report for 2016 In 2016 the McBride water system supplied
Independent Analytical Supplies Ltd (Trading as) IAS Laboratories
 IAS Laboratories") Independent Analytical Supplies Ltd (Trading as) IAS Laboratories Unit 4 Bagenalstown Business Park, Bagenalstown, Co Carlow Testing Laboratory Registration number: 275T is accredited by the Irish National
Independent Analytical Supplies Ltd (Trading as) IAS Laboratories Unit 4 Bagenalstown Business Park, Bagenalstown, Co Carlow Testing Laboratory Registration number: 275T is accredited by the Irish National
SAMPLE COLLECTION DATE March 25, st Quarter SOUTH WATER PURIFICATION PLANT
 laboratory ACCREDITATION NUMBER: 100228 Page 1 of2 TEMPERATURE TURBIDITY THRESHOLD ODOR, STRAIGHT THRESHOLD ODOR, DECHLORINATED COLOR ph FREE CHLORINE RESIDUAL SATURATION INDEX, LANGELIER ALKALINITY, PHENOLPHTHALEIN
TITLE: SABS PROFICIENCY TESTING SCHEME, RSA
 TITLE: SABS PROFICIENCY TESTING SCHEME, RSA PRESENTED BY: Ms C. MODIKA Contact Info : +7(0) 48 6383 Fax No. ; +7(0) 48 609 Email : Modikac@sabs.co.za TANZANIA, 3 8 December 007 Mission Mission Statement
DRINKING WATER ANALYSIS SUMMARY
 End : Iron 1,000 ug/l 621 3/4/2013 15:10 Lead 0.11 ug/l J Iron 2,400 ug/l Nickel 0.50 ug/l J Zinc 7.9 ug/l J Nickel 0.54 ug/l J 621 3/4/2013 15:10 Manganese 34 ug/l Manganese 26 ug/l 621 3/4/2013 15:10
Hamlet of Aklavik. Water Licence Number: N3L Municipal Water Licence. Annual Report for the Year Date Prepared: March 9, 2017.
 Hamlet of Aklavik Water Licence Number: N3L3-0570.. Municipal Water Licence Annual Report for the Year 2016 Date Prepared: March 9, 2017. -2- Municipal Water Licence Annual Report Hamlet of Aklavik Licence
Notikewin and Keg Rivers Water Quality Monitoring Program 2017
 Notikewin and Keg Rivers Water Quality Monitoring Program 2017 The County of Northern Lights and the North Peace Applied Research Association (NPARA) Prepared for: County of Northern Lights 600-7 th Avenue
April 23, 2018 File:
 GEMTEC Consulting Engineers and Scientists ed 32 Steacie Drive Ottawa, ON, Canada K2K 2A9 613.836.1422 ottawa@gemtec.ca www.gemtec.ca April 23, 2018 File: 62712.02 Boone Plumbing 1282 Algoma Drive Ottawa,
Participate in proficiency testing studies semi-annually, with the following exception
 July 02, 2015 Mr. Dave Wunderlich Eurofins Frontier Global Sciences 11720 North Creek Parkway North, Suite 400 Bothell,WA 98011 Dear Mr. Wunderlich: Thank you for your application for renewal in the Environmental
West Virginia Department of Environmental Protection hereby certifies Microbac - Ohio Valley Division
 West Virginia Department of Environmental Protection hereby certifies Microbac - Ohio Valley Division to perform analyses for the purpose of determining compliance with the requirements of the state's
Water Monitoring - Teralba Quarry EPA Point No.4 - Adit Overflow
 No. Dates Water Monitoring - Teralba Quarry - 2018 - EPA Point No.4 - Adit Overflow EPA No 4-148 ABCDE EPA No 4-149 ABCDE EPA No 4-150 ABCDE January 2018. Febrary 2018. March 2018. EPA No 4-151 AB April
Durban Height Waterworks, Design capacity: 615 ML/d, Period: 01 July June 2014
 Durban Height Waterworks, Design capacity: 615 ML/d, Period: 01 July 2013-30 June 2014 Durban Heights WW Raw Durban Heights WW Final Determinands Units Minimum Average Percentile Maximum Minimum Average
Kawishiwi Watershed Metals Data Summary 2012
 Kawishiwi Watershed Metals Data Summary 212 Prepared for the Kawishiwi Watershed Protection Project Nolan Baratono, Watershed Ecologist Jesse Anderson, Research Scientist Background The Kawishiwi Watershed
ENVIRONMENTAL LABORATORY LICENSE. ACZ Laboratories, Inc. AZ0102
 ARIZONA DEPARTMENT OF HEALTH SERVICES ENVIRONMENTAL LABORATORY LICENSE Issued to: Laboratory Director: Owner/Representative: Brett Dalke Matt Sowards ACZ AZ0102 is in compliance with Environmental Laboratory
LABORATORY TURNAROUND TIMES AND CHARGES
 LABORATORY TURNAROUND TIMES AND CHARGES The enclosed prices reflect a 5 business day turnaround time. There will be a $25.00 minimum charge per report. Same Day Rush 24 Hour Rush 48 Hour Rush 72 Hour Rush