TAUSSIG. & Associates, Inc. DAVID. Public Finance Facilities Planning Urban Economics CAPACITY FEE STUDY FOR SAN GORGONIO PASS WATER AGENCY
|
|
|
- Noreen Davidson
- 6 years ago
- Views:
Transcription
1 DAVID TAUSSIG & Associates, Inc. CAPACITY FEE STUDY FOR SAN GORGONIO PASS WATER AGENCY JULY 21, 2015 Public Finance Facilities Planning Urban Economics Newport Beach Riverside San Francisco Chicago
2 CAPACITY FEE STUDY FOR SAN GORGONIO PASS WATER AGENCY JULY 21, 2015 Prepared for SAN GORGONIO PASS WATER AGENCY 1210 Beaumont Avenue Beaumont, California (951) Prepared by DAVID TAUSSIG & ASSOCIATES, INC Birch Street, Suite 6000 Newport Beach, California (949)
3 Table of Contents Executive Summary... i I. Background... 1 II. Introduction to Analysis... 2 III. Definitions... 5 IV. Demographics Existing Number of Residential Units and Non-Residential Square Footage Future Residential and Non-Residential Development... 9 V. Facility Component of the Facility Capacity Fee Facility Costs Methodology Facility Fee Structure VI. Water Component of the Facility Capacity Fee Appendix A Demographic Background Appendix B Facility Costs Letter to Jeff Davis from Webb Associates, July 17, 2015 Appendix C Section 1 of Implementation Plan For Capacity Fee, Webb Associates, October 2010 Appendix D Updated Water Rights Appraisal Memo from Water Consultancy, July 20, 2014
4 Executive Summary The San Gorgonio Pass Water Agency ( SGPWA or Agency ) is a State Water Project ( SWP ) contractor located in the northwest portion of Riverside County east of San Bernardino, California. The mission of SGPWA "is to import supplemental water and to protect and enhance local water supplies for use by present and future water users and to sell imported water to retail water distributors within the service areas of the SGPWA service area." 1 The SGPWA provides, or can potentially provide, wholesale water service within its boundaries to and including the City of Banning, the Beaumont-Cherry Valley Water District, Cabazon Water District, South Mesa Water Company, Banning Heights Mutual Water Company, High Valleys Water District, Mission Springs Water District, and Yucaipa Valley Water District. To provide capacity in SGPWA's system, sufficient water supply and levels of service to existing and future development over the next twenty years consistent with the mission of the Agency, SGPWA will need to invest at least $12.6M in infrastructure during this period. This infrastructure will include a basin recharge facility and the purchase of additional capacity in existing pipelines that convey SWP water along the route from the SWP turnout at Devil Canyon to the SGPWA service area. Also, due to uncertainties related to the quantity of SWP allotments year to year, SGPWA will need to purchase additional water rights outside of the SWP contract. The current price of additional water rights is estimated at $6,200 per acre-ft and will be purchased on an asneeded basis. To ensure that new development pays its fair share of these costs, SGPWA will implement a facility capacity fee as authorized by SGPWA Law (Water Code App ) and consistent with California Government Code Section 66013, which requires that the capacity fee shall not exceed the estimated reasonable cost of providing the service for which the fee or charge is imposed. In 2011 a nexus study was prepared that proposed the implementation of a Facility Capacity Fee to be imposed on new development. The SGPWA board approved the nexus study, however the fee was not adopted at that time. This nexus study is a new and independent evaluation of (1) current demographics; (2) reconciliation of various local demographic estimates; (3) assessment of facilities and water supplies needed to serve new and expanded development; (4) and the allocation of costs reflecting current demographics and current cost estimates of facilities; and (5) calculation of new fee schedules. The proposed capacity fee has two components: the Facility Fee, and the Water Capacity Fee. The Facility Fee will fund a portion of the new infrastructure and the Water Capacity Fee will fund a portion of the purchase of new water rights and/or entitlements. The future capital projects are evaluated on a project-by-project basis to determine the costs that should be allocated to future development. Based on this approach, projects that are required to only meet the needs of future development are allocated 100% to such development. Projects that benefit both existing demands and future development are allocated to both existing demands and future development proportionally according to appropriate factors. 1 The SGPWA Mission Statement as indicated in the Agency's website San Gorgonio Pass Water Agency July 21, 2015 Capacity Fee Study Page i
5 The Table below shows the proposed fee per residential dwelling unit that represents the reasonable fair share contribution of new residential development to the cost of the required infrastructure. Residential Facilty Fee Land Use Facility Element ($ unit ) Admin Element ($ per Unit) Total Facility Fee per DU Single Family $ $ 0.86 $ Multi-Family $ $ 0.42 $ The fees for the non-residential uses (commercial/retail and industrial) are determined in a similar manner. Because water demand from commercial/retail and industrial uses varies widely with building uses, meter size is a reasonable indicator of water demand and basis for allocation. The allocations to non-residential uses in the 2011 Study used building size and water use factors to allocate costs based on equivalent dwelling units ("EDUs"). This Study converts the non-residential allocations to meter size, using a 5/8 inch meter (typical of a single family residence) as the baseline, whose demand is equivalent to a single family dwelling unit, or one (1) EDU. The Table below shows the proposed fee structure that represents the reasonable fair share contribution of new non-residential development to the cost of the required infrastructure. Non-Residential Facilty Fee Meter Size Facility Element Admin Element Total Facility Fee 5/8" $ $ 0.86 $ /4" $ $ 0.94 $ " $ $ 1.20 $ /2" $ $ 1.54 $ " $ $ 2.48 $ " $ 1, $ 9.41 $ 1, " $ 2, $ $ 2, " $ 3, $ $ 3, " $ 4, $ $ 4, Finally, to maintain reliability for the benefit of future development, SGPWA will need to purchase additional water rights and entitlements outside of its SWP contract. The Table below shows the recommended fee charged to new development to fund the purchase of new water rights and entitlements over the twenty-year period. San Gorgonio Pass Water Agency July 21, 2015 Capacity Fee Study Page ii
6 Water Capacity Fee Item units Fee Fee for New Water Rights and Entitlements $ per ac-ft $ 6, Administrative Overhead $ per ac-ft $ Total $ 6, Please note that the above tables represent the maximum fee that the board can adopt and impose on new development, based on the cost of facilities and water rights or entitlements planned to be constructed or acquired prior to 2035 and identified in this Study. Also, it is recommended that SGPWA review these fee structures periodically to adjust for changes in demographics, water demands, and facility requirements, as well as adjustments for inflation. Based on the above fee structures, a typical single family house would pay a Facility Fee of $170.89, and using an average water use factor of acre-feet per year, that same single family house would be subject to a water capacity fee of $3, ($6, per acre-feet per year x 0.548), for a total of $3, San Gorgonio Pass Water Agency July 21, 2015 Capacity Fee Study Page iii
7 I. Background In 1961 SGPWA was formed pursuant to Chapter 101 of the California Water Code Appendix as a result of the approval by the voters of the Burns-Porter Act, which authorized the financing and construction of the SWP. SGPWA entered into a contract with the Department of Water Resources ( DWR ) in 1962 for Table A Water capacity in the SWP, which is currently 17,300 acre-ft per year ( AFY ), to bring supplemental water to the SGPWA service area. The SWP system originates at Oroville Reservoir in Northern California and water is delivered through a series of dams, pipelines, rivers, Sacramento Delta canals, sloughs, reservoirs and pumping stations to the SGPWA turnout at Devil Canyon in San Bernardino County. From that point it is delivered by pipeline, pump stations and reservoir to the SGPWA SWP terminus at Cherry Valley, in Northern Riverside County. The primary source of local water supply to the SGPWA service area at the present time is natural surface runoff and groundwater basins. The major groundwater basin is the Beaumont Storage Unit ( BSU ), which serves the City of Beaumont and the community of Cherry Valley through the Beaumont-Cherry Valley Water District ( BCVWD ), the City of Calimesa through the Yucaipa Valley Water District ( YVWD ), the City of Banning and the South Mesa Water Company ( SMWC ). The BSU was determined by the Riverside Superior Court in 2004 to be in overdraft and a Watermaster was appointed to manage the BSU through controlled overdraft (temporary surplus) through The BSU is now required to operate in a balanced condition, replacing an amount of water equal to the amount removed from the basin to meet local demands, over time. The Beaumont Basin Adjudication is an official document of the State of California, on file with the Riverside County Superior Court as Case No. RIC , and on file with SGPWA. Increased demand from new development and decreasing reliability of imported water supplies will continue to exert pressure on the ability of SGPWA to deliver supplemental water on a reliable basis. Adjudication of the BSU, requiring a balanced operating condition, will also exert pressure on the SGPWA to find additional reliable sources of water to meet increasing demands. Revenue from the proposed Facility Capacity Fee program is necessary to provide reliable water service to new development by helping fund new capacity in delivery pipelines, new recharge basins, related land acquisitions and the purchase of new water rights and entitlements. These investments are necessary to continue to provide an adequate level of service and reliability to retail agencies over time. No revenues from this Facility Capacity Fee program will be used to fund the correction of existing deficiencies in the system. 2 See also, San Gorgonio Pass Water Agency Report on Water Conditions (Reporting Period 2013), dated December San Gorgonio Pass Water Agency July 21, 2015 Capacity Fee Study Page 1
8 II. Introduction to Analysis The San Gorgonio Pass Water Agency ( SGPWA or Agency ), a State Water Project ( SWP ) Contractor, authorized David Taussig & Associates, Inc. ( DTA ) to prepare a nexus study ("Study") for proposed Facility Capacity Fees that the appropriate retail water agencies and/or land use planning agencies would collect from new development on behalf of SGPWA. These fees will provide a source of revenue for SGPWA needed to mitigate the regional water related impacts of such new development. California Government Code et seq ("Mitigation Fee Act") governs the imposition by a local agency of a fee or charge to a development project for "...the purpose of defraying all or a portion of the cost of public facilities related to the development project...". California Government Code 66013(b)(3) further defines a Capacity Charge as "... charges for new public facilities to be acquired or constructed in the future that are of proportional benefit to the person or property being charged.'' New public facilities are further defined in Section as "facilities for the storage, treatment and distribution of non-agricultural water." California Water Code authorizes SGPWA to impose a Facility Capacity Fee, which is in the nature of a connection fee, for the right to make a new retail connection to the water distribution system of any retail water distributor that is located within the boundaries of the SGPWA and that obtains all or any portion of its water supplies from SGPWA. For the purposes of this Study, the term "Facility Capacity Fee" shall mean Capacity Charge as defined in the Mitigation Fee Act. The Facility Capacity Fee is imposed and authorized in California Water Code and will meet the requirements of California Government Code Section 66013, and will achieve the following goals related to said Section: Ensure that the Facility Capacity Fee does not exceed the estimated reasonable cost of providing the service for which the fee is imposed; and Provide a clear and concise document that will serve as the basis for the proposed fee levels. The Board of Directors of SGPWA may contract with the counties in which SGPWA is located, and cities and retail water distributors located within the boundaries of SGPWA, for the collection of the Facility Capacity Fees subject to certain conditions. SGPWA water made available through facilities built, and/or water rights acquired, with capacity fee revenue will be sold to retail water distributors who in turn serve SGPWA water to new and expanded water users. This Study and the resulting fee structure will focus on the use of the SGPWA Facility Capacity Fee to fund (1) the purchase of capacity in existing pipeline systems owned by other public agencies; (2) an additional basin recharge project for underground water storage in the Beaumont groundwater basin, including land purchases associated with such basin facility; and (3) the purchase of new water and/or water rights and entitlements to meet future water demand. The underlying principle that supports the identification and allocation of costs to new development for these facilities and new water rights or entitlements is that new development throughout the SGPWA service will have access to additional water delivery capacity, additional storage capacity San Gorgonio Pass Water Agency July 21, 2015 Capacity Fee Study Page 2
9 and additional water rights and entitlements necessary to meet the demands of future development. This is more fully discussed in Section V, "Facility Component of the Facility Capacity Fee." The Facility Capacity Fee will consist of two components: the Facility Component of the Facility Capacity Fee ( Facility Fee ). This component will fund the facilities identified in items (1) and (2) above; and the Water Component of the Facility Capacity Fee ( Water Capacity Fee ). This component will fund the purchase of new water and/or water rights or entitlements, as identified in item (3) above. The Facility Fee will be charged to all new development within the SGPWA service area (except the Morongo Tribal Land as discussed in Section IV, Demographics ) and is designed to fund the cost of facilities needed to mitigate the cost of facilities needed to meet the additional demands of such new development through the year The steps followed in calculating the Facility Fee component include: Demographic Assumptions: Identify future development through 2035 that represents the increased demand for facilities. The demographic assumptions are discussed in Section IV, Demographics. Facility Needs and Costs: List the public facilities that can be clearly identified and have a reasonably accurate estimate of costs, that best mitigate the demands of new development through The needs list and estimate of costs are presented in Section V.1, Facility Costs. Cost Allocation: Allocate costs between new and existing residential and non-residential development based on estimated percentage utilization factors related to a proposed conjunctive use facility and additional capacity in the East Branch Extension ("EBX" pipeline system owned by other public agencies). Further allocate costs between single family and multi-family land use by equivalent dwelling unit ( EDU ) methodology, and between non-residential buildings by meter sizes. A detailed discussion of the cost allocation methodology is included in Section V.2, Methodology. Fee Schedule: Calculate the fee per residential unit or per non-residential meter size based on weighted average water usage factors, providing a uniform fee structure for the SGPWA service area. The resulting Facility Fee component structure is presented in Section V.3 Fee Structure. The Water Capacity Fee will be charged to new development based upon the amount of new water capacity needed to serve such development. The steps to calculate the Water Capacity Fee is discussed in Section VI, Water Component of the Facility Capacity Fee. It is important to note that all new development will be required to pay the Facility Fee and the Water Capacity Fee. While the Facility Fee is a fixed amount, depending upon land use, the Water Capacity Fee will be calculated based on expected water demands on a project by project basis. This revenue is required for SGPWA to build the proposed facilities and purchase the necessary San Gorgonio Pass Water Agency July 21, 2015 Capacity Fee Study Page 3
10 water rights and entitlements discussed herein that are needed to provide reliable water deliveries to water retailers. It is expected that the SGPWA will review both the Facility Fee and the Water Capacity Fee at reasonable intervals to incorporate changes in prices, facility requirements, water demands and demographics in order to ensure that the Facility Capacity Fees are allocated fairly and continue to generate sufficient revenues. The Facility Capacity Fee program will work in conjunction with SGPWA s other sources of revenue to play a part in a coordinated financing plan that provides a balance of rates and charges needed to fund current and future costs of service. For instance, the current commodity rate structure the amount charged for actual water deliveries includes an allocation to partially fund the purchase of new water rights and entitlements needed to enhance the reliability of water deliveries for existing development. Thus the commodity rates will work in conjunction with Water Capacity Fee revenues and other general fund revenue to fund the purchase of new water rights and entitlements over time that are needed to provide an ongoing reliable water source for both new and existing development. San Gorgonio Pass Water Agency July 21, 2015 Capacity Fee Study Page 4
11 III. Definitions The following key defined terms are used throughout this Study: Acre-foot ( AF ) a volumetric unit of measurement commonly used for water supply purposes. It is the amount of water required to cover one acre of land one foot deep, one acre being equal to 43,560 square feet. For illustrative purposes, it is the amount of water required to cover a football playing field, including end zones, 9 inches deep. AFY Acre-feet per year. A unit of measurement commonly used for large scale water supply purposes to represent flow, or volume of water over a period of time. BSU - the Beaumont Storage Unit, an adjudicated groundwater basin underlying a portion of the SGPWA service area. Build Out or Build Out Condition The state of development within the SGPWA service area in which there are no longer any undeveloped parcels or lots identified as residential or non residential uses on approved local land use plans from which capacity fees can be collected. Conjunctive Use is the interactive use of SWP supplemental water and local groundwater for water deliveries. The recharge of groundwater basins with SWP and local surface water during years of surplus and the pumping of stored groundwater to augment SWP allocations during years of deficit assist SGPWA in providing water deliveries on a reliable basis. cfs - cubic feet per second, a measure of volumetric rate of water conveyance DTA David Taussig & Associates, Inc., the public finance consulting firm that prepared the 2011 Capacity Fee Study and this current Capacity Fee Study. DWR - State of California ( State ) Department of Water Resources, the agency that contracts on behalf of the State with SGPWA to deliver water through the SWP under the terms of Contract Between the State of California Department of Water Resources and San Gorgonio Pass Water Agency, For Water Supply. EDU Factor the ratio of the water demand for a unit of a given land use to the baseline water demand for a single family residential unit. Equivalent Dwelling Unit ( EDU ) for given land uses, a method of comparison of that land use to a baseline land use, using a common demand variable. A demand variable is a measurable factor that is directly related to the required size or extent of a public facility. For the purposes of this Study the demand variable used is water demand, in gallons per day or acre-feet per year ( AFY ), and the baseline demand is that of a single family residential unit, which is the assumed baseline land use. For non-residential uses costs are allocated by meter size. A 5/8" meter is assumed as the baseline, equivalent in demand to a single family unit. San Gorgonio Pass Water Agency July 21, 2015 Capacity Fee Study Page 5
12 Existing Development - residential and non-residential land use improvements that exist as of June, 2014, within the SGPWA service area. The sources of data used to quantify the extent of such improvement includes local agency permit activity and studies, local UWMPs and County of Riverside demographic data. Facility Capacity Fee a charge imposed by a local water agency on new development, or increased usage (such as remodels or expansions), to fund or to recover the estimated reasonable cost of providing water, water conveyance or water storage facilities to the person or property being charged. For purposes of this Study the Facility Capacity Fee consists of two components: the facility component ( Facility Component of the Facility Capacity Fee or Facility Fee ) and the water component ( Water Component of the Facility Capacity Fee or Water Capacity Fee ). Facility Component of the Facility Capacity Fee for the purposes of this Study and hereafter referred to as the Facility Fee, is a facility capacity fee imposed on new development to pay that development s fair share of the costs to construct water storage and conveyance facilities that benefit such development. Floor Area Ratio ( FAR ) is the ratio of useable non-residential building square feet to the area, in square feet, of the property within whose boundaries the building is located. For the purposes of this Study a FAR of 0.40 for commercial/retail uses and an FAR of 0.20 for industrial uses was assumed, these ratios being common industry norms and generally accepted where site specific local investigations related to non-residential densities do not exist. Future Development - projected residential and non-residential land use improvements within the SGPWA service area anticipated to occur by the year The sources of data used to quantify the extent of such improvement includes local agency demographic projections, local UWMPs and County of Riverside demographic studies. KSF the unit of measurement used for non residential building size equal to one thousand square feet. SBVMWD - San Bernardino Valley Municipal Water District State Water Project ( SWP ) the system of dams, reservoirs, channels, pipelines, pumping stations, delivery structures and all other conveyance systems whose purpose is to convey and deliver water from the Sacramento-San Joaquin Delta to the various water contractors, including SGPWA. Specific to SGPWA such deliveries are in accordance with the terms of Contract Between the State of California Department of Water Resources and San Gorgonio Pass Water Agency, For Water Supply. Table A Water - The total annual amount of SWP water, entitled by DWR to SGPWA under the terms of Contract Between the State of California Department of Water Resources and San Gorgonio Pass Water Agency, For Water Supply, Amendment No. 18 dated December 26, Table A of that contract, as amended by Amendment No. 18, indicates that the current maximum annual entitlement to SGPWA is 17,300 Acre-feet. UWMP is an Urban Water Management Plan. California Water Code et. seq. directs certain water agencies to carry out long term planning to ensure that adequate water supplies are San Gorgonio Pass Water Agency July 21, 2015 Capacity Fee Study Page 6
13 available to both existing demand and new development. Agencies that are required by this code to produce this plan must document its long-term planning effort in an Urban Water Management Plan. This planning document is required to be updated every five years. Water Component of the Facility Capacity Fee - for the purposes of this Study and hereafter referred to as the Water Capacity Fee, is a facility capacity fee imposed on new development to pay that development s fair share of the costs to purchase new water or new water rights or entitlements necessary to meet future water demands and ensure acceptable levels of reliability with regard to the ability of the servicing agency or special district to deliver water in the future. Water Use Factor ( WUF ) a measure of average water demand for a given land use within a given area, expressed as Acre-feet per year per acre (AFY/acre) Study a capacity fee nexus study prepared by David Taussig & Associates, Inc. for SGPWA in This study was adopted by SGPWA but not implemented. The demographic analysis for existing residential units and non-residential building square feet in the 2011 Study is used in this Study as the baseline demographics for Existing Development through San Gorgonio Pass Water Agency July 21, 2015 Capacity Fee Study Page 7
14 IV. Demographics The SGPWA boundary includes the areas within the Cities of Banning, Beaumont, and Calimesa, the communities of Cabazon, Cherry Valley, Poppet Flat, the Morongo Indian Reservation, and other portions of the unincorporated area of Riverside County ( County ). A small area of undeveloped land within the service area at the headwaters of the San Gorgonio River extends into San Bernardino County. At the eastern edge of the SGPWA the Mission Springs Water District straddles the boundary line, serving a portion of the community of Verbania. Water is provided or is planned to be provided to retail customers by various retail water agencies, including the City of Banning, Beaumont Cherry Valley Water District, Cabazon Water District, South Mesa Water Company, Banning Heights Mutual Water Company, High Valleys Water District, Mission Springs Water District, and Yucaipa Valley Water District. As noted in this Study, certain of these agencies will require additional water deliveries and the facilities to convey that water sooner while other agencies may not require additional water and facilities until after the planning period used in this Study. Note that, for purposes of this Study, any property designated as Morongo Tribal Land has been excluded from our analysis because the Morongo Band of Mission Indians is a sovereign nation. Property within the Morongo Tribal lands will not be subject to either component of the Facility Capacity Fee. Therefore, the demographic analysis as described below reflects the property located within the three cities mentioned above and the unincorporated area of Riverside County excluding the Morongo Tribal Land. For purposes of this Study David Taussig & Associates, Inc. ( DTA ) categorized developed residential land uses as Single Family Residential and Multi-Family Residential units. Single Family Residential units include detached and attached residential units, while Multi-Family Residential units include those units with two or more living units on one Assessor s parcel as well as mobile homes. Non-residential land uses are categorized as Commercial/Retail or Industrial. Because it is difficult to assign a specific year in the distant future in which the Build Out state (as identified by the various local agencies) is realized, the year 2035 was determined to present a reasonable horizon to achieve funding and construction goals. This planning horizon is also consistent with 2035 horizons identified in county and local city studies and local water district UWMPs. 1. Existing Number of Residential Units and Non-Residential Square Footage The estimate of the number of current residential units and non residential square feet in the Cities of Beaumont, Banning, and the unincorporated areas emanate from the 2011 Study and are used as a baseline level of development (see Appendix A). The numbers for residential units and nonresidential square footage in the 2011 Study represented existing development through DTA then added to the 2009 baseline numbers the number of residential units and non-residential square footage indicated by building permits issued, not necessarily constructed, within the three cities and the unincorporated area for the years 2010 to mid 2014 to establish the present baseline. The permit data was provided by the respective planning departments. The City of Calimesa provided existing land use data as of year 2014 and projected land use data at build out conditions. San Gorgonio Pass Water Agency July 21, 2015 Capacity Fee Study Page 8
15 A detailed discussion of the demographic assumptions and methods used to determine the increase in development from 2009 to mid 2014 can be found in Appendix A of this Study. The estimated existing residential units by jurisdiction and by single family and multi-family land uses are shown in Table 1 below: Residential Land use TABLE 1 Existing Residential Units Through June City of Banning City of Beaumont City of Calimesa Unincorporated Area Total Existing Residential Units Single Family 9,900 12,700 2,200 6,200 31,000 Multi-Family 2,300 1,500 1,500 1,400 6,600 Totals 12,200 14,200 3,700 7,600 37, Rounded to the nearest 100 units The estimated existing non-residential building square feet, rounded to the nearest 1,000, by jurisdiction and by Commercial/Retail and Industrial land uses is shown in Table 2 below: Non-Residential Land use TABLE 2 Existing Non-Residential Square Feet Through June City of Banning City of Beaumont City of Calimesa Unincorporated Area Total Existing Non Residential Square Feet Comercial/Retail 4,536,000 3,639,000 1,482,000 3,780,000 13,437,000 Industrial 4,231,000 1,982, ,000 60,000 6,685,000 Totals 8,767,000 5,621,000 1,894,000 3,840,000 20,122, Rounded to the nearest 1,000 square feet 2. Future Residential and Non-Residential Development Although projections for Build-Out conditions can be found in studies by various other sources, it was felt that the year 2035 is consistent with local studies and provides a period from which a reasonable prediction of new development growth may be estimated. This quantified estimate of growth may then be used to allocate the cost of facilities that SGPWA staff has determined are needed at this time to mitigate the impacts of current and future demands. There are several sources that project future residential and non-residential demographics for various horizons within SGPWA boundaries, including housing elements from City General Plans, Urban Water Management Plans ( UWMP ) and development projections from interested agencies such as the Southern California Association of Governments ( SCAG ). Differing development trends unique to jurisdictional areas within the Agency boundary suggest that the local retail water agencies UWMP projections or projections from independent studies might be the most in tune with actual development trends within their purview. Specifically, the growth projections for the Cities of Beaumont and Banning San Gorgonio Pass Water Agency July 21, 2015 Capacity Fee Study Page 9
16 were taken from the Beaumont Cherry Valley Water District UWMP and the City of Banning UWMP, respectively; however the City of Calimesa provided current growth projections based on its own independent study. Development projections for unincorporated areas within the Agency are more difficult to determine using local UWMP s as a source. Some retail water districts include unincorporated areas within their boundaries. Those areas may or may not be within the Agency. Also, there are unincorporated areas within the SGPWA that are not covered by a local UWMP. For this reason the County of Riverside was contracted to provide a special study, or addendum, to their 2013 Progress Report that compiles data from only unincorporated areas within census tracts that lie within the SGPWA boundary. In this special study the County estimated the housing units in such census tracts in the year The results of this study are shown graphically in Figure 1, Appendix A, "Demographic Background." Furthermore, the Yucaipa Valley Water District UWMP does not segregate water demands from the parts of its service area that lie within the City of Calimesa and the County of Riverside. In addition, the South Mesa Water Company services portions of the City of Calimesa but does not have a UWMP. For these reasons, development projections for the City of Calimesa were provided by the City of Calimesa staff and are based on City General Plan projections and current development trends considering active development projects at various stages of planning. The following sources were used to project total new housing units to 2035: City of Banning UWMP (2010) Beaumont Cherry Valley Water District UWMP (2010) City of Calimesa planning data provided by City staff Riverside County 2013 Progress Report, with a special study that includes unincorporated areas within SGPWA boundaries (2014). See Figure 1, Appendix A For the City of Banning, their 2010 UWMP provides a total housing projection of 17,988 units in However, a breakdown of single family and multi family units was not provided. Using projected water usage and water usage factors provided in the UWMP, the 17,988 total units was broken down into single family and multi family units in proportion to each category s water usage. In similar fashion, the Beaumont Cherry Valley Water District UWMP (2010) projects total residential units in 2035 at 21,958 units, however it does not break that figure down to single family and multi-family units. Again, projected water usage for multi-family units in 2035 and water usage factors were used to calculate the percentage split between single family housing units and multi-family housing units in The resulting number of housing units were then rounded to the nearest 500 housing units and entered into Table 3 below (see Appendix A, Section A-5). San Gorgonio Pass Water Agency July 21, 2015 Capacity Fee Study Page 10
17 The City of Calimesa staff provided the number of existing and projected single family and multi-family housing units within the City limits 3. The City projects 12,100 new residential dwelling units between 2014 and The City projects over 23,000,000 new commercial building square feet and over 18,000,000 new industrial square feet by For the unincorporated areas the special study by the County of Riverside, mentioned above, projected a total of 10,068 residential units in It is assumed that most of the growth between 2015 and 2035 will be single family units. DTA assumed a 2% cumulative growth in multi-family units during this period, with the balance being single family units. A detailed discussion of the analysis used to estimate the number of future residential units can be found in Appendix A of this Study. Table 3 below summarizes the expected residential units within the study area at year 2035 Residential Land Use TABLE 3 Projected Residential Units in City of Banning 2 City of Beaumont City of Calimesa Unincorporated Area Total Residential Units Single Family 15,707 20,500 11,500 8,700 56,400 Multi-Family 2,281 1,500 4,300 1,400 9,500 Total 17,988 22,000 15,800 10,100 65, Rounded off to the nearest 100 units 2. Total units are not rounded. The 17,988 is taken directly from the City of Banning UWMP, Table 3-1. The UWMP s that cover the Cities of Banning and Beaumont do not provide projections for non-residential building square feet. Their projections consisted of growth in water demand, as it should for water planning purposes. The percentage growth in water demand for the land use categories within the city limits was applied to the data for existing development to project building square feet in The City of Calimesa staff provided projections for non-residential building square feet in Table 4 below summarizes the total expected non-residential square feet within the study area in Non-Residential Land Use TABLE 4 Projected Non-Residential Building Square Feet in City of Banning City of Beaumont City of Calimesa Unincorporated Area Total Non- Residential SF Commercial/Retail 7,018,000 4,921,000 24,895,000 5,112,000 41,946,000 Industrial 6,546,000 2,493,000 18,700,000 75,000 27,814,000 Total 13,564,000 7,414,000 43,595,000 5,187,000 69,760, Rounded off to the nearest 1,000 square feet 3 Letter from City of Calimesa to San Gorgonio Pass Water Agency dated July 15, Subject line reads "CITY OF CALIMESA LAND USE PROJECTIONS". San Gorgonio Pass Water Agency July 21, 2015 Capacity Fee Study Page 11
18 A detailed discussion of projected residential units and non-residential building square feet can be found in Appendix A of this Study. The numbers found in Table 3 and 4 above represent total numbers through To determine the amount of growth between 2014 and 2035 the data in Tables 1 and 2 (existing development) must be subtracted from the corresponding data in Tables 3 and 4 (total projected at 2035). This difference is shown in column (5), Table 7, Section V below. San Gorgonio Pass Water Agency July 21, 2015 Capacity Fee Study Page 12
19 V. Facility Component of the Facility Capacity Fee The estimated reasonable cost to SGPWA of providing water supplies to new development is divided into two components: the Facility Component of the Facility Capacity Fee ( Facility Fee ) and the Water Component of the Facility Capacity Fee (Water Capacity Fee ). This section will address the identification, the cost, the method of cost allocation, and the fee structure for new water facilities. SGPWA owns and maintains an integrated system of water storage and conveyance that provides benefit to all lands within SGPWA boundaries by providing access to an imported water supply through the SWP. Each facility within the system provides delivery of water for groundwater basin replenishment, storage for local use when imported water is in short supply, or direct delivery to retail agencies. SGPWA will need to construct new facilities within this system to augment current storage capacity and delivery capabilities in order to meet the demands of current and future development. Thus, imported water stored in the Beaumont Basin, or any other groundwater basin, by SGPWA can be locally used as part of a conjunctive use program in times of shortage, allowing SGPWA imported water supplies to be beneficially used by water users within the SGPWA service area. The integrated system will provide the central core access to a water supply for lands that would not otherwise have such access during prolonged periods of limited imported water deliveries and during years of surplus. For example, the Beaumont Basin Recharge Facility, more fully described in Section V.1 herein, provides an interconnected system of water delivery to local water agencies that overlie the Beaumont and Banning groundwater basins. The Beaumont Basin Recharge Facility adds recharge capacity and storage to an overdrafted basin in order to provide reliable water supplies to both new and existing development within the entire SGPWA service area. In July, 2015 Webb Associates submitted a letter report to SGPWA included herein as Appendix B, ( Implementation Update ). This document included detailed cost estimates, list of facilities, and detailed graphics that describe the location of recharge basins and alignments of interconnecting pipelines. The fair share allocation of the cost of facilities anticipated to be needed during this planning horizon is discussed in detail in Section V.2, Methodology herein. 1. Facility Costs For purposes of the Facility Fee calculation, SGPWA decided at this time to include only the facilities related to conjunctive use of the Beaumont Basin and the purchase of additional capacity from San Bernardino Valley Municipal Water District ( SBVMWD ) because these facilities will be needed prior to the year 2035 based on projected water demands for that year. The facilities to be financed consist of (1) the purchase of additional capacity in existing pipeline systems owned by others, and (2) an additional basin recharge project for underground water storage in the Beaumont basin, including land purchases associated with that basin facility. Itemized facility costs totaling $12.66M were provided San Gorgonio Pass Water Agency July 21, 2015 Capacity Fee Study Page 13
20 by Webb Associates in its Implementation Update document prepared for SGPWA. See Appendix B herein. The East Branch Extension Phase II project by DWR will include pipelines, pump station additions and expansions, and a reservoir that will convey SWP water from Highland to the SGPWA service area. SGPWA is negotiating with SBVMWDfor the purchase of an additional 32 cubic feet per second ( cfs ) capacity in the SBVMWD pipeline between Highland and Devil Canyon. This purchase will provide additional capacity for SGPWA, increasing its capacity from 32 cfs to 64 cfs for the entire East Branch Extension. It has been determined by SGPWA that the full additional 32 cfs capacity will be needed to meet the demands of expected development through The estimated cost of this capacity, as indicated in the Implementation Update (see Appendix B) is $4M. Beaumont Basin Recharge Facility SGPWA proposes to construct a 54 acre recharge basin (also known as the Beaumont Avenue Recharge Facility) at the intersection of Beaumont Avenue and Brookside Avenue for the purpose of storing SWP water conveyed through a 6,000 lineal feet pipeline. Water will be used to recharge the Beaumont Basin, thereby replenishing water used to meet the demands of expected development. The estimated cost to improve the site, not including land purchase costs, as indicated in the Implementation Update, is $5.46M. This facility will provide additional storage that can be filled in wet years and drawn down in dry years. The land cost for Beaumont Basin Recharge Facility is $3.2M. Table 5 below provides a summary of the list of facilities and the respective estimated costs that will be financed, or partially financed, by the revenue from the Facility Fee recommended in this Study. Maps showing the location of each facility can be found in the Implementation Update, found in Appendix B of this Study. Part of the additional capacity provided by the Beaumont basin recharge facility is needed for new development. This additional capacity will also provide a benefit to existing development. The total additional capacity from SBVMWD is required to meet the demands of new development. Therefore, only a portion of the cost of the basin recharge facility is allocated to new development and the full cost of the additional capacity from SBVMWD is allocated to new development. The allocations are more fully described in Section V.2, Methodology. Facility Name TABLE 5 Needs List and Estimate of Costs 1 Cost Estimate % Allocated To New Development Cost to New Development Beaumont Basin Recharge Facility $ 5,460, % $ 4,368,000 Land Costs for Beaumont Basin Recharge Facility $ 3,200, % $ 2,560, cfs capacity from SBVMWD $ 4,000, % $ 4,000,000 Total Facility and Land Cost $ 12,660,000 $ 10,928,000 Administrative 0.50% $ 55, Rounded to nearest $1,000 Grand Total $ 10,983,000 An Administrative Cost Component is included in the total cost to be financed in order to cover the costs incurred by SGPWA associated with the administration of the Facility San Gorgonio Pass Water Agency July 21, 2015 Capacity Fee Study Page 14
21 Capacity Fee program. Administrative costs include staff time associated with fee collection, maintenance of trust funds into which the fees are deposited, preparation of annual reports, and negotiation and implementation of agreements between SGPWA and the retail agencies or land use planning agencies. A budget of 0.50% of the total facility cost is a reasonable number to spread over the next twenty years of development, amounting to $55,000. This represents approximately one man-hour per month over the next twenty years. The revenue to fund these activities will be a component of the Facility Fees collected. 2. Methodology The Beaumont Basin Recharge Facility discussed above will benefit both existing and new development within the SGPWA boundaries while the additional capacity in the SBVMWD pipeline is needed solely to meet the demands of new development. Because the reliability of SWP deliveries is partially dependent upon weather trends, regulations and court cases, uncertainty becomes a major factor in the management of wholesale water deliveries. Also, the Beaumont Basin is now in balance and the adjudicated requirement that the basin cannot be in overdraft on a continual basis substantiates the need for SGPWA to find additional water rights and entitlements to improve reliability. The Beaumont Basin Recharge Facility will rely on imported water to operate as planned. The Beaumont Avenue Recharge Facility is a conjunctive use facility designed to take advantage of greater water supplies in wet years. With the reliability of the State Water Project decreasing, a regional conjunctive use project has value to current residents, enabling SGPWA as the regional water agency to import more water in those wet years and store it for future dry years. However, this value will increase substantially as the area grows, as more water supplies will be required and hence the value of being able to import and store more water in wet years increases greatly. With current water demands the conjunctive use facility might be used once in five years, providing a 20% utilization rate. That rate will increase in future years as additional supplies are obtained for the growing region. As the region grows and the Agency obtains additional water supplies, the facility will likely be used every year, increasing the utilization rate to 100%. Since in the near term it might only be used an average of 20% of the time, it makes sense to have 20% of the cost of the facility funded by current residents. With additional growth causing the facility to eventually be used continuously at 100% capacity, the remaining 80% should be funded by that growth. Thus the funding of the cost of the Beaumont Avenue Recharge Basin Facility and its land cost are components of the Facility Fee. The allocated costs are shown in Table 5 above. Based on current water demands and projections of future development to 2035, an additional 32 cfs capacity from SBVMWD is required solely to meet the demands of future development. Therefore the cost to purchase this additional capacity is allocated 100% to new development. Negotiations between SBVMWD and SGPWA are ongoing. The Implementation Update (see Appendix B) indicates that a $4M purchase price for this additional capacity is a reasonable estimate. Refer to Section V.1 above. San Gorgonio Pass Water Agency July 21, 2015 Capacity Fee Study Page 15
22 To fairly distribute the cost of new facilities allocated to the various land use designations for new development, a distribution based on an Equivalent Dwelling Unit ( EDU ) methodology will be used whereby water demand will serve as the unit of comparison. The water demand for a residential dwelling or one thousand square feet ( KSF ) of building floor area is compared as a ratio of that value to the demand for a single family residential unit. This ratio is defined as the EDU factor and is used to calculate the total existing EDUs, as shown in Table 6 below, and the increase in EDUs through 2035, as shown in Table 7 below. Data for projected residential and non residential development to 2035 is subtracted from the corresponding existing data as of 2014 to identify the growth in development from 2014 to 2035, as shown in Table 7. Converting this growth into EDUs, the allocated costs can then be distributed to the various land uses. Table 7 shows that the total growth in EDUs from 2014 to 2035 is 61,828 EDUs. Table 6 below shows the calculation for total existing EDUs, while Table 7 below shows similar calculations for future EDUs through Water use factors ( WUF ), in acre-ft of water demand per year ( AFY ) per acre, are shown in column (1) of both tables and the values are taken from Table 1-7 of the Webb Implementation Plan (see Appendix C) that was made a part of the 2011 Study, where the value entered for Unincorporated Areas and Others is the average of the values shown for Riverside County and Cabazon Area. In column (2) of both tables, Density (DU per acre or FAR), the residential densities are assumed to be the higher end of the range given for Residential Low and Residential High given in Table 1-7 of the Webb Implementation Plan for Single Family and Multi- Family land use designations, respectively. This is a reasonable and more conservative method to calculate the estimated densities in that it generates higher EDU counts, resulting in lower calculated residential fees. The densities for Commercial/Retail and Industrial categories use floor area ratios ( FARs ) of 0.20 and 0.40 respectively, which are also conservative for the same reasons discussed above for residential uses. In column (3) of both tables the unit water use, in AFY per DU for residential uses or AFY per KSF for nonresidential uses, for each land use category was then calculated from the values in the columns (1) and (2). For example, for the City of Banning, single family land use for existing development, as shown in Table 6, the WUF shown in column (1) is divided by the density shown in column (2). Thus 2.73 AFY/acre divided by 5 DU per acre equals AFY per DU. In a similar manner, for City of Banning, Commercial/Retail land use in Table 6, the WUF shown in column (1) is divided by the density in column (2), the result then divided by the KSF per acre conversion factor 4. Thus 5.76 AFY per acre divided by 0.20, the result then divided by KSF per acre equals AFY per KSF, as shown in column (3). The EDU factor in column (4) was determined by dividing each unit water use in column (3) by the unit water use for a single family dwelling unit in the City of Banning, Beaumont or Calimesa (0.546). For example, the unit water use calculated above for commercial/retail use, in column (3) is divided by for single family also shown in column (3) to produce an EDU factor of 1.21, shown in column (4). 4 1 acre = 43,560 square feet, or KSF San Gorgonio Pass Water Agency July 21, 2015 Capacity Fee Study Page 16
23 In Table 6 below, the total existing residential dwelling units and the total existing nonresidential building area in KSF shown in column (5) was taken from Tables 1 and 2. For instance, for the City of Banning, single family land use, the value of 9,936 DU s corresponds to the same value shown for the City of Banning, single family land use in Table 1. The total EDUs for existing development for the various agencies and land uses shown in column (6) were calculated by multiplying the residential dwelling units and commercial/industrial KSF shown in column (5) by the corresponding EDU factors shown in column (4). Land Use TABLE 6 EDU Calculation - Existing Development (1) (2) (3) (4) (5) (6) Water Use Factor (AFY/Ac) Density (DU per acre or FAR) Water Use (AFY per DU or KSF) EDU Factor DU or KSF EDU 1 City of Banning: Single Family ,936 9,936 Multi-Family ,281 1,115 Commercial/Retail ,536 5,497 Industrial , Total 17,113 City of Beaumont: Single Family ,681 12,681 Multi-Family , Commercial/Retail ,639 4,410 Industrial , Total 18,071 City of Calimesa: Single Family ,200 2,200 Multi-Family , Commercial/Retail ,482 1,796 Industrial Total 4,785 Unincorporated Areas & others Single Family ,208 6,481 Multi-Family , Commercial/Retail ,780 4,598 Industrial Total 11, totals are rounded Total Existing EDUs = 51,735 % of total 44.60% The total EDUs for new development shown in Table 7 below are calculated in a similar manner as Table 6 while using future development to The new development ( growth ) value is the difference between 2035 and existing residential DUs or nonresidential square feet from Tables 1 through 4. San Gorgonio Pass Water Agency July 21, 2015 Capacity Fee Study Page 17
24 Land Use (1) (2) (3) (4) (5) (6) Water Use Factor (AFY/Ac) Density (DU per acre or FAR) TABLE 7 EDU Calculation - Future Development Water Use (AFY per DU or KSF) EDU Factor DU or KSF EDU City of Banning: Single Family ,771 5,771 Multi-Family Commercial/Retail ,482 3,008 Industrial , Total 9,088 City of Beaumont: Single Family ,819 7,819 Multi-Family Commercial/Retail ,282 1,553 Industrial Total 9,458 City of Calimesa: Single Family ,300 9,300 Multi-Family ,800 1,369 Commercial/Retail ,413 28,371 Industrial ,288 2,441 Total 41,481 Unincorporated Areas & others Single Family ,492 2,602 Multi-Family Commercial/Retail ,332 1,620 Industrial Total 4,242 Total Future EDUs = 64,269 % of total 55.40% Total EDU's = 116,004 Based on the numbers shown in Table 6 and Table 7, it is anticipated that in the year 2035 there will be 116,004 EDUs within the SGPWA service area (51,735 existing EDUs plus 64,269 future EDUs). The summary of existing EDUs and growth EDUs at 2035 by land use is shown below in Table 8, EDU Summary at 2035 : San Gorgonio Pass Water Agency July 21, 2015 Capacity Fee Study Page 18
25 Land Use TABLE 8 EDU Summary at 2035 Existing EDUs New Growth Between 2015 and 2035 EDUs Total EDUs at 2035 Single Family 31,298 25,492 56,790 Multi-Family 3,243 1,405 4,648 Commercial/ Retail 16,301 34,552 50,853 Industrial 893 2,820 3,713 Totals 51,735 64, ,004 % of Total EDU's at % 55.40% % 3. Facility Fee Structure As indicated in Table 5 in this Section, the estimated total facility cost allocated to new development is $10.9M. This amount is divided by the total EDUs assigned to new development through 2035 to arrive at a cost per EDU of $ The administrative cost element is calculated in a similar fashion to be $0.89 per EDU. The total cost per EDU is $ These unit costs are shown in Table 9 below: TABLE 9 Facilites Cost Per EDU Item Cost EDUs for New Development Cost per EDU New Water Facilities $ 10,928,000 64,269 $ Administrative Overhead $ 55,000 64,269 $ 0.86 Totals $ 10,983,000 64,269 $ The proposed Facility Fee for the respective land uses is determined by multiplying the cost per EDU by the appropriate EDU factor. Because the EDU factors and the WUFs upon which the EDUs are based do vary between local service areas, as shown in Table 10, it is reasonable that weighted average WUFs are used to calculate uniform SGPWA service area EDU factors. This will result in one uniform fee structure to be used throughout the service area. Table 10 also shows the method for determining weighted average WUF for each land use. The WUF for each agency is weighted by the ratio of future EDUs for such agency to the total future EDUs. For example the City of Banning has 9,088 future EDUs, which represents 14.14% of the total future EDUs (refer to Table 7, EDU Calculation Growth at 2035 for EDU totals). Each land use within a given agency has its own specific WUF, which is multiplied by the weighting ratio specific to that agency (14.14% for the City of Banning). The weighted average WUF for each land use within the SGPWA service area is calculated by summing the weighted average WUF for each agency, by land use, and this value is shown in bold in the extreme right column labeled Total in Table 10. San Gorgonio Pass Water Agency July 21, 2015 Capacity Fee Study Page 19
26 Since EDUs are based on water demand, weighting based on EDUs presents a fair and rational means of determining service area wide EDU factors. For any of the four land use designations, the variation between EDU factors calculated by this weighted average method and the EDU factor determined on an individual retail agency basis, as shown in Table 10, is less than 4%, therefore use of the weighted average is reasonable. The calculation of the weighted average WUF for each land use designation is shown in Table 10 below: TABLE 10 Weighted Average Water Use Factors WUF by LandUse City of Banning City of Beaumont City of Calimesa Unincorporated Areas and Other Total Weighting Factors: subtotal of EDUs 9,088 9,458 41,481 4,242 64,269 % of total EDUs 14.14% 14.72% 64.54% 6.60% % Single Family: Water Use Factor ("WUF") Weighted WUF Multi-Family: Water Use Factor ("WUF") Weighted WUF Commercial/Retail: Water Use Factor ("WUF") Weighted WUF Industrial: Water Use Factor ("WUF") Weighted WUF If future data show that water use within the SGPWA service area is significantly different than the WUFs used in this study, it is recommended that SGPWA update the Facility Fee portion of this Update to reflect such changes. For residential land uses the Facility Fee is determined based on a per unit water demand, whereby a dwelling unit in a multi-family building would demand less water by volume than that demanded by a single family dwelling unit. In Table 11A below the weighted average WUFs, the densities, the resulting water uses and EDU factors were used to calculate a uniform Facility Fee structure for residential land uses only. In column (1) the weighted average WUFs were taken from Table 10 above. The densities in column (2), the water usages in column (3) and the EDU factors in column (4) are the same as used in Tables 6 and 7. The fee for each of the two land uses was calculated by multiplying the cost per EDU from Table 9 of $ by the service area wide EDU factor. For instance, the Facility Fee for a multi-family dwelling unit is found by multiplying the unit facility cost by 0.49, the EDU factor. San Gorgonio Pass Water Agency July 21, 2015 Capacity Fee Study Page 20
27 TABLE 11A Residential Facilty Component Fee Structure (1) (2) (3) (4) (5) (6) (7) Land Use Weighted Ave. WUF (AFY/Ac) Density (DU per acre ) Water Use (AFY per DU ) EDU Factor Facility Element ($ unit ) Admin Element ($ per Unit) Total Facility Fee per DU Single Family $ $ 0.86 $ Multi-Family $ $ 0.42 $ Commercial and industrial land uses include any one of many specific building uses, ranging from low water demand uses such as retail, office and warehouse to high demand uses such as commercial laundry and car wash. Consequently, a fee structure based on building meter size is reasonable and prudent. A 5/8 meter size is typical for a single family unit, therefore a 5/8 meter is assigned one EDU. EDU factors for larger meter sizes are determined by the ratio of meter operational capacities, as determined by values given by the American Water Works Association, Manual M-1 5. Table 11B below lists the various EDU factors, by meter size, and the corresponding Facility Fee. The facility element and the administration fees are calculated by multiplying the EDU factor by the costs per EDU from Table 9. TABLE 11B Non-Residential Facilty Component Fee Structure Meter Size AWWA Demand Ratio 1 EDU Factor Facility Element Admin Element Total Facility Fee 5/8" $ $ 0.86 $ /4" $ $ 0.94 $ " $ $ 1.20 $ /2" $ $ 1.54 $ " $ $ 2.48 $ " $ 1, $ 9.41 $ 1, " $ 2, $ $ 2, " $ 3, $ $ 3, " $ 4, $ $ 4, American Water Works Association, Manual M-6 It is recommended that SGPWA include in its fee resolution a provision to automatically increase the Facility Fee on July 1st of each year, beginning July 1, 2016 by a percentage equal to the change in Construction Cost Index for Los Angeles as published by Engineering News Record for the preceding twelve months. It is also recommended that SGPWA review the Facility Fee levels at reasonable intervals to incorporate changes in unit prices, facility requirements, water demands and demographics in order to ensure that Facility Fee cost allocations are reasonable and that collections over time will fund the required facilities. Finally, the Facility Fee is a requirement of all new development or redevelopment in the SGPWA service area, irrespective of whether a Water Capacity Fee (discussed in Section VI below) is required. 5 Principles of Water Rates, Fees and Charges, Manual M-1, and Water Meters- Selection, Installation, Testing and Maintenance, Manual M-6, American Water Works Association. San Gorgonio Pass Water Agency July 21, 2015 Capacity Fee Study Page 21
28 VI. Water Component of the Facility Capacity Fee The second component of the Facility Capacity Fee is the water component ( Water Capacity Fee ). The task of meeting the demands of new growth with scarce water sources is exacerbated by the significant reduction in reliability of imported water deliveries from the SWP due to periodic drought conditions, regulatory and court case cutbacks in allocations. SGPWA will need to purchase new water rights and entitlements to insure that additional water supplies will be available in the future as the SGPWA service area experiences new development. It has been estimated that total water demand at build-out is expected to be in excess of local supplies and existing imported SWP water, with allowances for reduced reliability. This deficit will need to be balanced by the purchase of new water rights and entitlements. The water rights and entitlements (authorized by SGPWA Act (b), (d) and (g)) that are needed to meet the demands of new development shall be purchased with funds provided by new development in the form of a Water Capacity Fee. In July of 2014 SGPWA instructed Water Consultancy to prepare a memorandum that updates the estimated cost of purchasing additional Table A water (see Appendix D). Water Consultancy, by this July 2014 memorandum, estimates the market value of the cost of additional water rights and entitlements at $6,200 per acre-ft. The amount charged to new development as a Water Capacity Fee will be determined based on water demand, on a project by project basis, by SGPWA in cooperation with the permitting agency that has jurisdiction over the project. Administrative overhead is estimated to be 0.50% of the fee revenue, or $31.00 per acre-ft. This amounts to $31,000 for a purchase of 10,000 acre-ft of water, which is sufficient funding to cover the costs of administrative actions required for such purchase. See Table 12 below: TABLE 12 Water Capacity Fee Item units Fee Fee for New Water Rights and Entitlements $ per ac-ft $ 6, Administrative Overhead $ per ac-ft $ Total $ 6, For example, using an annual water use amount of AFY as indicated in Table 11A, a hypothetical single family dwelling unit would pay a Water Capacity Fee of $3, (0.548 AFY x $6,231 per acre-foot). It is recommended that SGPWA include in its fee resolution a provision to review the Water Capacity Fee on July 1st of each year, beginning July 1, 2016, and adjust the Water Capacity Fee by a reasonable percentage based on the cost of actual water purchases, an updated water rights appraisal, or comparisons of recent purchases of additional water rights by statewide municipalities and special districts over the preceding twelve months. San Gorgonio Pass Water Agency July 21, 2015 Capacity Fee Study Page 22
29 Appendix A: Demographic Background San Gorgonio Pass Water Agency July 21, 2015 Capacity Fee Study Page A-1
30 Appendix A Demographic Background The purpose of this appendix is to document the methodology used to process raw residential dwelling unit data and non-residential building square feet data provided by local agencies in order to update existing development data given in the 2011 Study to mid 2014 levels. This Study will project residential and non-residential development to a 2035 development horizon. These changes are necessary in order to calculate a fee structure for the Facility Fee, as discussed in Section V of this Study. The Water Capacity Fee is not affected by updated demographic information, since this fee is based on expected water usage on a project by project basis, as discussed in Section VI of this Study. The updated existing development data and the revised projected development levels at 2035 will yield growth data that will ultimately affect the proposed Facility Fee structure. This demographic data was updated in order to recommend a Facility Fee structure that will insure that new development will pay its reasonable fair share of the cost of wholesale water delivery systems necessary to continue to meet the demand in the SGPWA service area. The Facility Fee will be implemented based on a fee per new residential unit and a fee by meter size for new non-residential buildings. A.1 Existing Development Existing residential units and non-residential building square feet as of 2009 are shown in Tables 1 and 2 of the 2011 Study. In order to update these numbers for existing development to June 2014, it was determined that building permit activity between 2009 and June 2014, where available, would be the best data source to add to the 2009 numbers. A.1.1 Existing Residential Units Table 1 of the 2011 Study lists the total single family and multi-family residential units in the Cities of Banning, Beaumont and Calimesa, and a portion of the unincorporated area of Riverside County that lies within the SGPWA service area, as of Annual permit data provided by the Cities and the County of Riverside was used to sum the number of new residential units permitted from 2009 to mid These numbers were then added to the data found in the 2011 Study to determine the extent of existing residential development as of June See Table A1 below: A-1
31 Residential Land use City of Banning City of Beaumont City of Calimesa Unincorporated Area Total Existing Residential Units Single Family Thru ,927 11,421 2,200 6,201 29,749 Single Family from 2010 Thru June , ,276 Total Existing Single Family 9,936 12,681 2,200 6,208 31,025 Multi Family Thru ,281 1,463 1,500 1,363 6,607 Multi Family from 2010 Thru June Total Existing Multi Family TABLE A1 Existing Residential Units 2,281 1,463 1,500 1,363 6,607 Total 12,217 14,144 3,700 7,571 37,632 A.1.2 Existing Non-Residential Building Square Footage In a manner similar to the method discussed above for updating existing residential units within the study area, permit activity for non-residential square feet between 2009 and June 2014 was added to the non-residential building square feet through The permit activity for the cities of Banning, Beaumont and Calimesa was provided by the respective City Building and Safety Departments while permit activity for the unincorporated areas within the SGPWA service area was provided by the County of Riverside. The numbers for existing development as of 2009 were taken from the 2011 Study. See Table A2 below: Non-Residential Land Use City of Banning TABLE A2 Existing Non-Residential Square Feet 1 City of Beaumont City of Calimesa Unincorporated Area Total Existing Non-Residential SF Comercial/Retail Thru ,502,000 3,624,000 1,482,000 3,471,000 13,079,000 Commercial /Retail from 2010 Thru June ,000 15, , ,000 Total Existing Commercia/Retail 4,536,000 3,639,000 1,482,000 3,780,000 13,437,000 Industrial Thru ,231,000 1,982, ,000 60,000 6,685,000 Industrial from 2010 Thru June Total Existing Industrial 4,231,000 1,982, ,000 60,000 6,685,000 Total 8,767,000 5,621,000 1,894,000 3,840,000 20,122, Actual numbers rounded to the nearest 1,000 square feet A-2
32 A.2 Future Residential and Non-Residential Development Section IV of this Study, Demographics, refers to revising the development horizon to Many sources of information are available for selecting or computing residential units and non residential square feet in year 2035, such as local city planning departments, county planning and GIS department, and local water district planning departments and Urban Water Management Plans ( UWMPs ), for example: City of Banning City of Beaumont City of Calimesa County of Riverside Yucaipa Valley WD Beaumont Cherry Valley WD Since this Study relates to the recommendation of a facility capacity fee, in most cases UWMP s from retail water agencies within SGPWA boundaries were used as the primary source of 2035 demographic data. Reconciliation of Various Demographic Estimates Upon review the form of the data available from all sources is not consistent and easily related to residential units or non-residential square feet. For instance, the Banning UWMP lists total residential units (17,988), but lists projected water use for single family, multi family, commercial and industrial land uses in Therefore a calculation must be made to convert water use to residential units and non residential square feet. A similar approach is used for the City of Beaumont and the Community of Cherry Valley whereby total household data and water delivery projections in the Beaumont Cherry Valley Water District UWMP ( BCVWD UWMP ) are used in order to determine a reasonable projection for residential units and non residential square feet. The Yucaipa Valley Water District UWMP ( YVWD UWMP ) provides water demand projections for 2035 but does not break down the data into local agencies or communities within the district, including the City of Calimesa and unincorporated areas of the County. Consequently, the City of Calimesa staff provided projected residential housing units and non-residential building square feet to the year Approximately 75% of the residential housing unit projection was based on current projects before the City planning department at various stages of planning. City staff also provided projections to build out conditions for Commercial/Retail and Industrial building square feet. In several cases, using common conversion factors such as water use factors and persons per household to convert data to the desired units, the results led to possible inconsistencies that can be easily reconciled. For instance, the City of Banning shows no additional multi-family units during the period from 2009 to June 2014 and therefore has 2,281 multi-family units as of June 2014, according to Table 3 of this report. However, using Banning UWMP data and converting to residential units, this approach calculates only 711 units. A three-fold reduction in multi-family units is unreasonable. See Table 1 Letter from the City of Calimesa to San Gorgonio Pass Water Agency dated July 15, Subject line reads: "CITY OF CALIMESA LAND USE PROJECTIONS." A-3
33 A3 below for the calculation using water usage to arrive at the 711 units. Similar disconnects lead one to believe that there is not one independent source of raw demographic data (population or households and building square feet) and not one set of conversion factors (per capita water use, persons per household) that is used by local agencies and retail water districts alike to determine water projections, residential units and non residential square feet. It should not be expected that universal conversion factors be used and residential and non-residential data be provided, as the primary objectives of local UWMP s is to identify projected water demands and water sources, not necessarily in terms of dwelling units and building square feet. Listed below are a few of the factors that can vary by agency depending on local conditions. To the extent that these factors become variable across agencies within the Agency, it becomes necessary to reconcile differences in demographic projections when comparing data. Persons per Household Water Growth Rates Per Capita Water Use Population Growth Rates Floor Area Ratios Service Area Water Demand Projections for residential dwelling units for the Cities of Banning, Beaumont and Calimesa are found in the various UWMP s that cover those areas. Projections for residential units for the unincorporated areas of Riverside County are found in special studies conducted by County staff. Projections for non-residential building square feet are basically projections of water usage converted to building square feet with the use of reasonable water use factors accepted in the 2011 Study. The methodology used to convert this data into single family and multi-family units and non-residential square feet is discussed below by jurisdiction. City of Banning Table 3-1 of the City of Banning UWMP projects the level of residential development in 2035 to be 17,988 units. This is based on the City s 2008 Housing Element and this number is consistent with Table 2-3 in Banning UWMP, which bases population projections on a 2% per year population increase from 2010 and an average of 2.7 persons per household. Table 3-1 does not break down the total units into single family and multi-family units. However, Table 3-1 does project the annual water demand for single family and multi-family dwelling units by multiplying a water use factor of 0.52 AFY per dwelling unit by 17,988 total units. This product is then broken down into single family and multi-family demand by applying percentages based on historical usage. These water demands are converted back to dwelling units by applying the water use factor 0.52 AFY. See Table A3 below: A-4
34 Water use 1 (AF/yr) % Dwelling Units 2 Water use 1 (AF/yr) % Dwelling Units 2 Single Family 8, % 15,648 8, % 17,277 Multi Family % % 711 totals 8, % 16,292 9, % 17,988 Notes: Table A3 Residential Dwelling Units in the City of Banning per Table 3-1, 2010 UWMP: City of Banning, 2010 UWMP, Table City of Banning, 2010 UWMP, Table 3-1 and Table 2-3 Table A1 indicates that 2,281 multi-family units exist in the City of Banning as of June Table A3 above indicates that there are only 711 units projected for 2035 based on water demand. It is not plausible to expect a three-fold reduction in multi-family units to occur over the next twenty years. Therefore, for the purposes of this Study it will be assumed that the growth in residential units over the next twenty years will occur solely within the single family category, with the total housing unit count to remain at 17,988 as indicated in the City of Banning UWMP. See Table A4 below: Table A4.1 City of Banning - Projected Residential Units Single Family 14,011 15,707 Multi Family 2,281 2,281 Total 16,292 17,988 Table 3-1 of the City of Banning 2010 UWMP also indicates projected water usage for commercial and industrial uses for future years in 5 year increments. Using average increases during these intervals and prorating this average over the twenty year study period, an increase of 54.72% over current levels is calculated. That percentage increase is applied to existing levels to estimate non-residential levels of development in See Table A4.2 below: City of Beaumont and Cherry Valley Table A4.2 City of Banning Non-Residential Square Feet Commercial 4,536,000 7,018,004 Industrial 4,231,000 6,546,115 Total 8,767,000 13,564,119 Table 2-11 of the Beaumont Cherry Valley Water District Urban Water Management Plan ( BCVWD UWMP ) shows 21,958 households in However Table 2-11 does not break down the households into single family and multi-family categories. Table 3-8c of the BCVWD UWMP projects water deliveries (acre-ft per yr) in 2035 for single family and multi family categories. Using water use factors (acre-ft per year per DU) for each A-5
35 category from Table 7 of the 2011 Study for SGPWA, the number of single family and multi-family units were projected based on water use. Since the total number of units determined by water use does not match the 21,958 units found in Table 2-11, the percentage split from the water use information was applied to the 21,958 total units to split single family and multi-family categories, as shown in Table A5.1 below: Table A5.1 City of Beaumont - Projected Residential Units projected water deliveries (acre-ft/yr) 1 water use factors (acreft/yr/du) 2 DU's Single Family 14, , % 20,610 Multi Family , % 1,348 15,127 28, % 21,958 Notes: 1. From Table 3-8c, BCVWD UWMP, year From Table 6, Capacity Fee Study for SGPWA, 2011 % DU's in 2035 The BCVWD UWMP does not provide data for projected non-residential building square feet, however, Tables 3-8b and 3-8c of the BCVWD UWMP indicate water usage in AFY for 2015 and The calculated percentage increases were then applied to the 2015 levels of existing commercial and industrial building square feet to project the corresponding 2035 levels. See Table A5.2 below: Table A5.2 City of Beaumont Non-Residential Square Feet increase Commercial % 3,639,000 4,920,920 Industrial % 1,982,000 2,493,484 Totals ,621,000 7,414,404 see Table 3-8b and Table 3-8c, BCVWD UWMP City of Calimesa The City of Calimesa General Plan is not clear with regards to demographic projections to the year Table 3-13 of the Yucaipa Valley Water District UWMP indicates projected water demands from areas within their district that lie within the SGPWA service boundary. For year 2035, water demand for domestic water, conjunctive use and long term supply sustainability is projected to be 1,453.7 MG. However, this data does not break down into land use categories. The Yucaipa Valley Water District UWMP demands include areas of Calimesa and portions of the unincorporated area of Riverside County that lie within SGPWA boundaries. In addition, the City of Calimesa is served in part by the South Mesa Water District. By segregating demographic data from the two Districts that apply only to the City of Calimesa results in projections for the City of Calimesa that would be inaccurate and possibly incomplete. For this reason it is A-6
36 determined that projections provided by City staff would represent the latest and best data regarding growth within the City of Calimesa limits. Table A6 City of Calimesa - Projections to 2035 Dwelling Units Building S.F. Single Family 11,500 Multi-Family 4,300 Commercial 24,895,000 Industrial 18,700,000 Unincorporated Areas of Riverside County (not including Cherry Valley) The County of Riverside ( County ), Information Technology and Center for Demographic Research publishes a progress report that contains a wide range of demographic information for cities lying within the County limits as well as unincorporated areas within the County. However, the data in the progress report for the unincorporated area is countywide, and does not breakdown the areas within wholesale water districts. At the direction of SGPWA staff, Webb Associates contracted with County staff to have County staff prepare a special study that compiles population data and housing data for unincorporated areas that lie within the SGPWA service area. In November of 2014 the County submitted their study in the form of an area map and table of population and housing data for the years 2010, 2020 and See Figure 1 below: A-7

37 FIGURE 1 Figure 1 above indicates that there are 10,068 housing units projected for the year 2035 that lie within unincorporated areas of the County that are within SGPWA service area. Based on current development trends, it is very unlikely that there will be much new multi-family development in the unincorporated areas. Therefore it is assumed that the current level of multi-family development (1,363 units) will increase by only 2% total over the next twenty years, and the remainder of the 10,068 projected units will fall into the single family residential category. See Table A7 below: Table A7 Unincorporated Areas - Residential Single Family 6,208 8,678 Multi Family 1,363 1,390 totals 7,571 10,068 The County progress report does not include non-residential data. However the Beaumont Cherry Valley Water District UWMP does indicate levels of water deliveries in 2015 and A-8
38 2035, by land use categories. The study area in this UWMP includes undeveloped unincorporated areas in addition to the City of Beaumont. Similar to the method used for non-residential property within the City of Beaumont, it is reasonable to assume that the non-residential growth in these areas will be uniform and the magnitude of which is a percentage increase in the development that exists as of mid Also, it is assumed that the increase in water deliveries projected by the UWMP is a reflection of the judgment of BCVWD with regard to growth in its service area. Using these percentage increases in deliveries and applying those increases to current building square feet (in 1,000 square feet units, or KSF), 2035 projected commercial and industrial building square feet can be estimated. See Table A8 below: Table A8 Unincorporated Areas - Non Residential 2015 water deliveries 2035 water deliveries1 increase Existing KSF projected KSF Commercial % 3,780 5,112 Industrial % Tables 3-8b and 3-8c, BCVWD UWMP A-9
39 Appendix B: Facility Costs Letter to Jeff Davis from Webb Associates, July 17, 2015 San Gorgonio Pass Water Agency July 21, 2015 Capacity Fee Study Page B-1
40


41


42

43


44
45
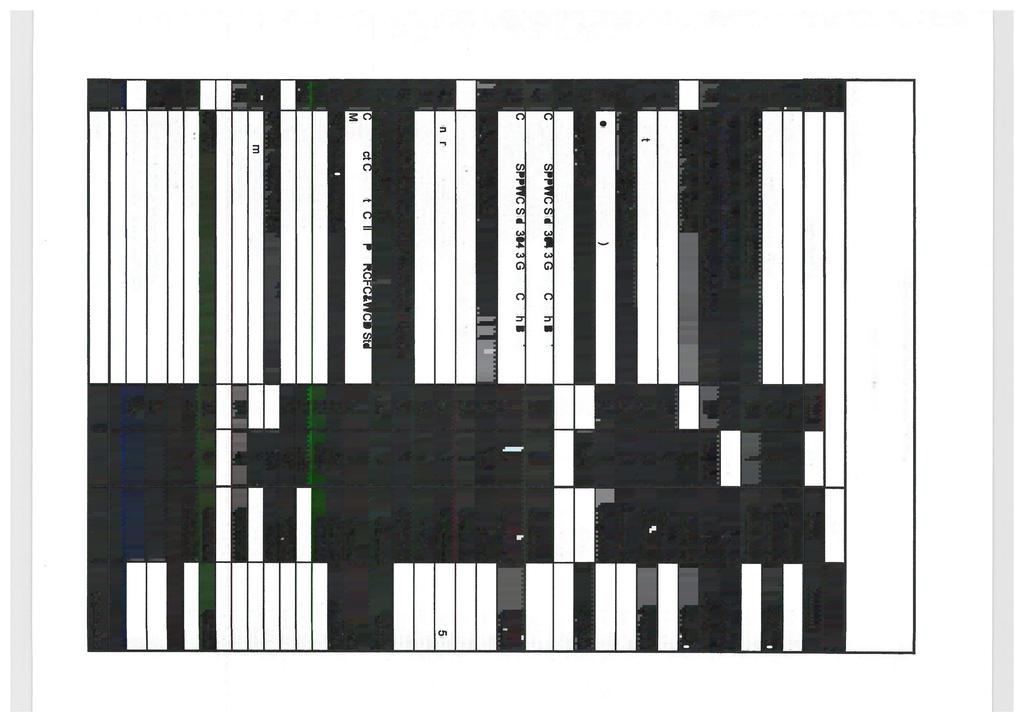
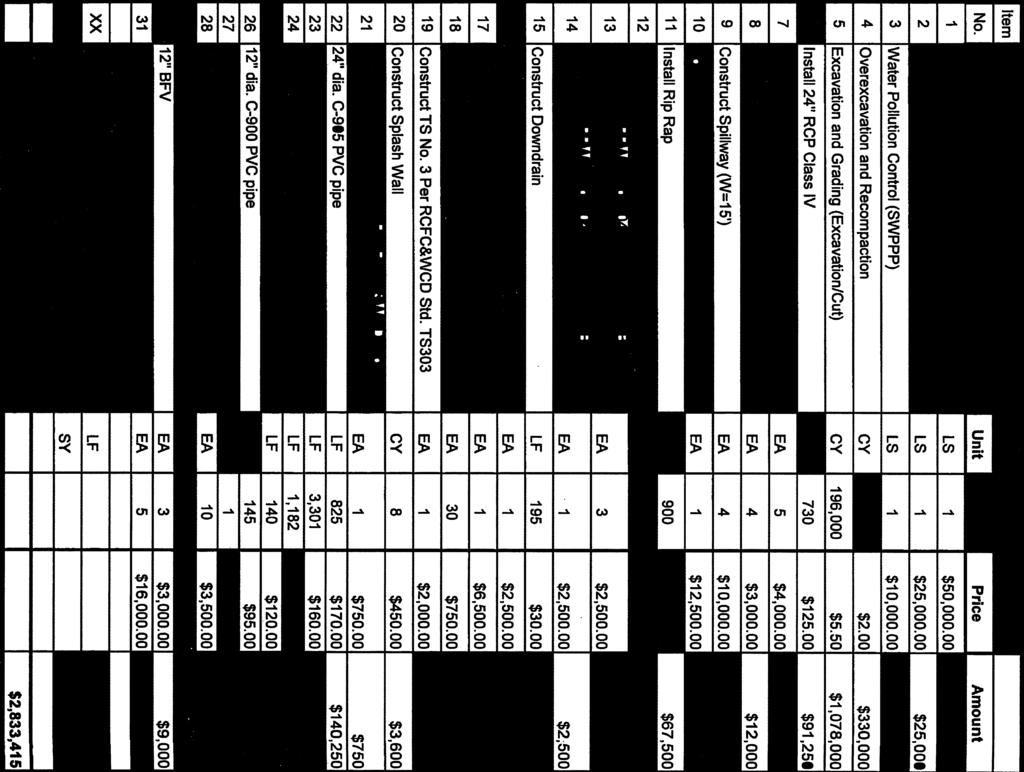
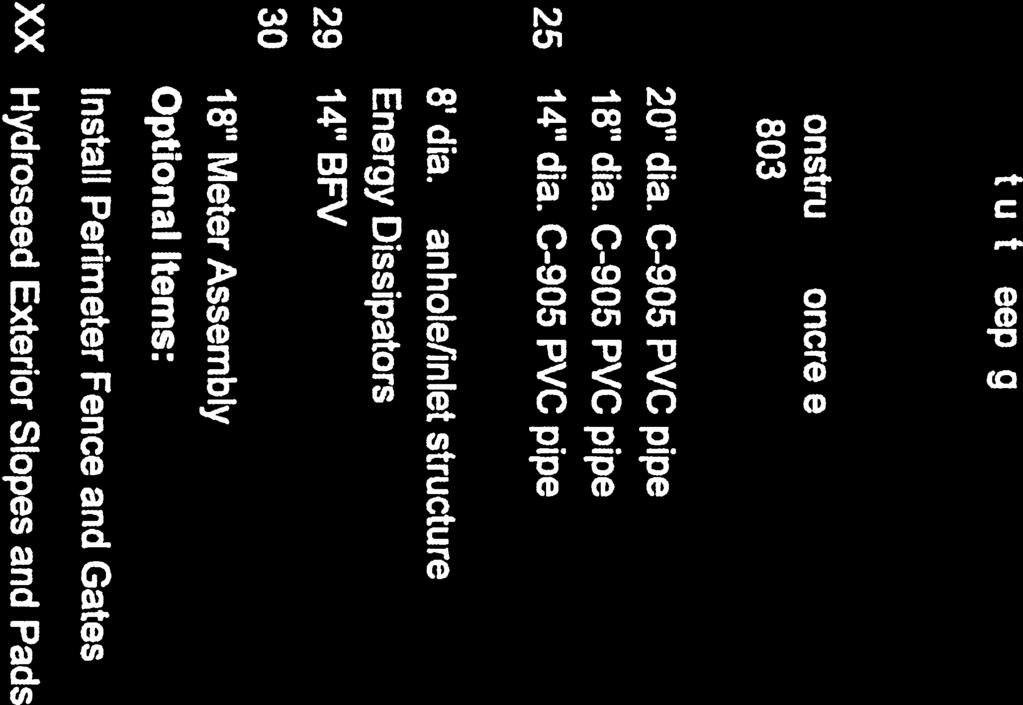


46
47

48


49

50
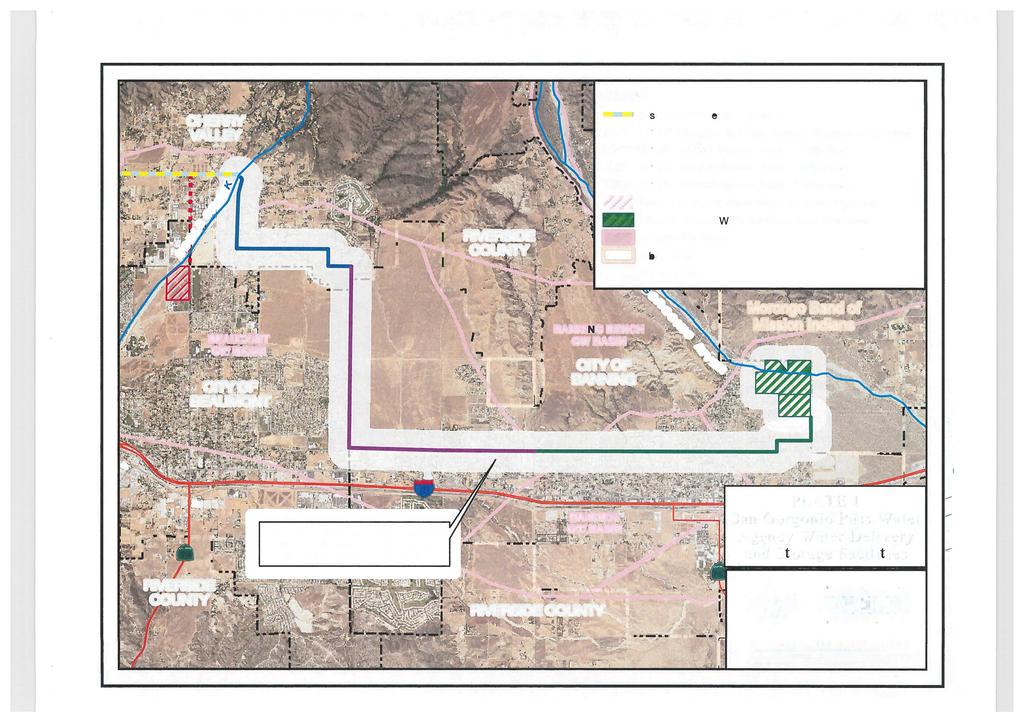
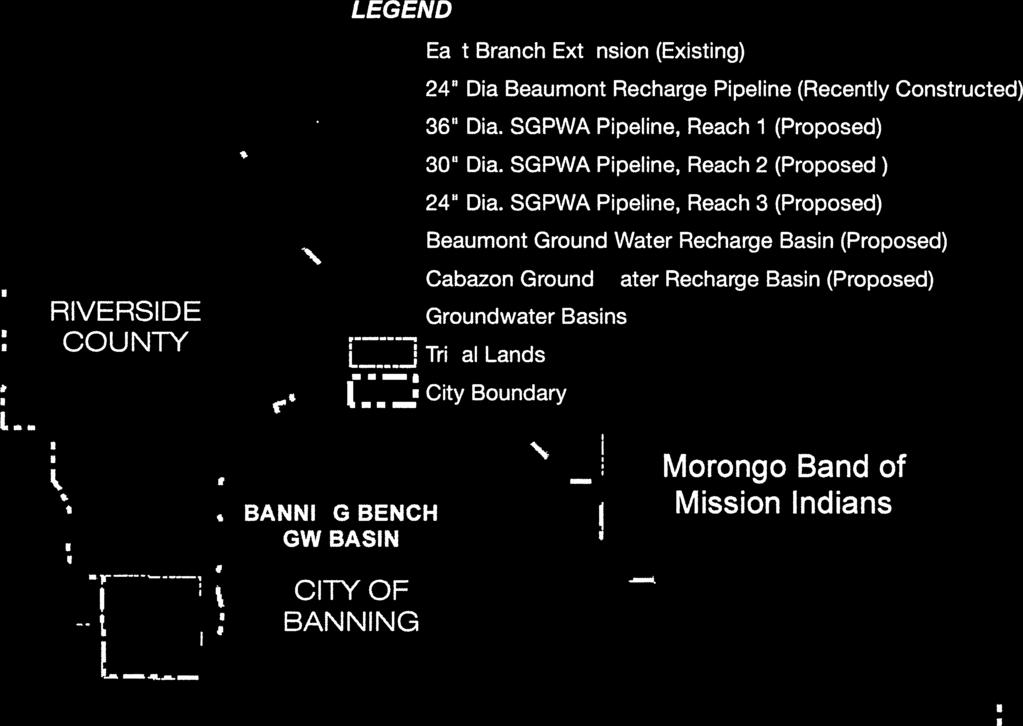


51
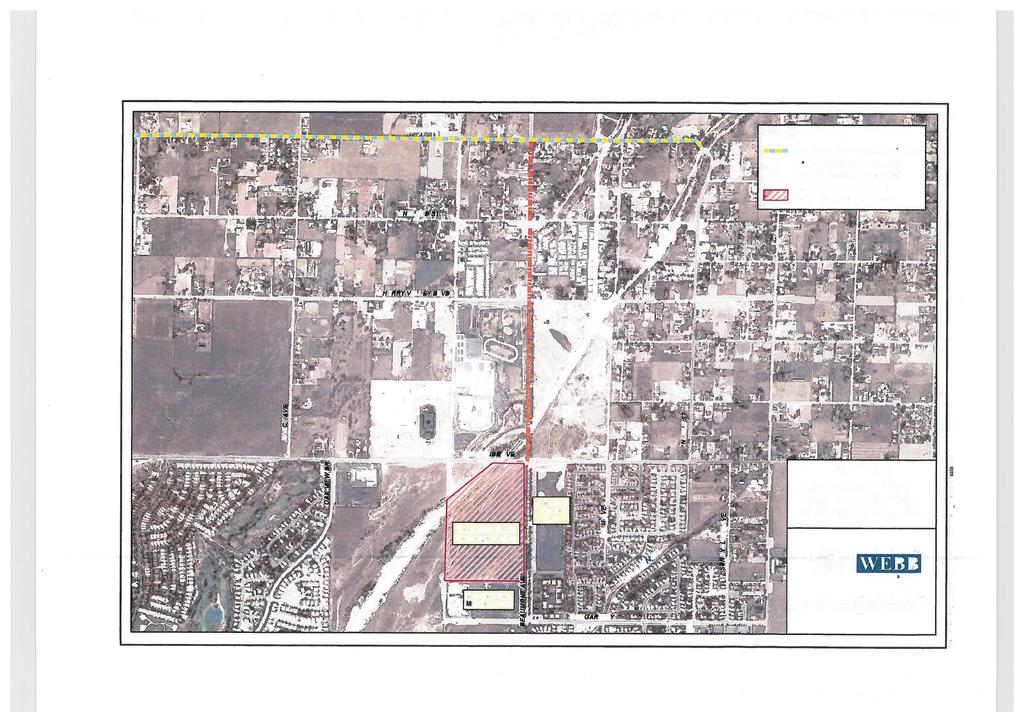

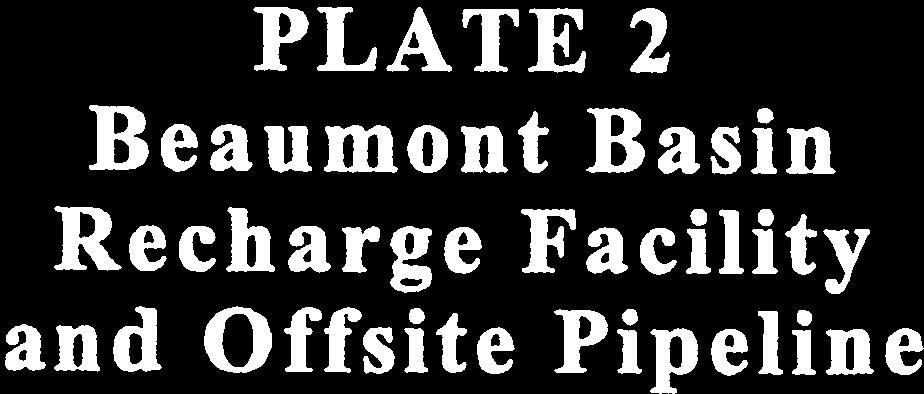


52
53 Appendix C Section 1 of Implementation Plan For Capacity Fee, Webb Associates, October 2010 San Gorgonio Pass Water Agency July 21, 2015 Capacity Fee Study Page C-1


54 Implementation Plan for Capacity Fee San Gorgonio Pass Water Agency Prepared for San Gorgonio Pass Water Agency October 2010
ANNOUNCEMENT REGARDING SPEAKER SLIPS
 City of Calimesa Regular Meeting of the City Council AGENDA Monday, May 2, 2016 6:00 p.m. Norton Younglove Multipurpose Senior Center 908 Park Avenue, Calimesa, CA 92320 Jeff Hewitt, Mayor Joyce McIntire,
SAN GORGONIO PASS WATER AGENCY SUPPLEMENTAL WATER SUPPLY PLANNING STUDY
 SAN GORGONIO PASS WATER AGENCY SUPPLEMENTAL WATER SUPPLY PLANNING STUDY Prepared By: ALBERT A. WEBB ASSOCIATES 3788 McCray Street Riverside, CA 92506 (951) 686-1070 Sam I. Gershon, R.C.E. R.C.E. No. C14489
Supplemental Water Supply Program and Fee Study. City of Coachella
 Supplemental Water Supply Program and Fee Study City of Coachella Prepared By: TKE Engineering, Inc. 2305 Chicago Avenue Riverside, CA 92507 (951) 680-0440 TABLE OF CONTENTS Section 1 Coachella Water Authority...
A Case Study: Imperial Valley, California
 University of Colorado Law School Colorado Law Scholarly Commons Western Water: Expanding Uses/Finite Supplies (Summer Conference, June 2-4) Getches-Wilkinson Center Conferences, Workshops, and Hot Topics
Water Supply Assessment
 RANCHO SAN GORGONIO SPECIFIC PLAN DRAFT EIR CITY OF BANNING Appendices Appendix J Water Supply Assessment June 2016 RANCHO SAN GORGONIO SPECIFIC PLAN DRAFT EIR CITY OF BANNING Appendices This page intentionally
CHAPTER 3 Water Supply
 CHAPTER 3 3.1 WATER SUPPLY OVERVIEW This chapter describes the sources of water available to the City and MID. The chapter includes a description of each water source, including limitations, water quality
Irvine Ranch Water District s Groundwater Banking Program
 Irvine Ranch Water District s Groundwater Banking Program National Water Research Institute Drought Response Workshop October 8, 2013 1 Today s Discussion Introduction to IRWD Drought Preparedness at IRWD:
Water Supply Planning for the Morongo Basin Area
 Water Supply Planning for the Morongo Basin Area Overview The Morongo Basin is located in California s High Desert, east of the San Bernardino Mountains. The study area includes the Town of Yucca Valley
CITY OF REDLANDS DEVELOPMENT IMPACT FEE JUSTIFICATION STUDY DAVID TAUSSIG & ASSOCIATES, INC. Public Finance Facilities Planning Urban Economics
 DAVID TAUSSIG & ASSOCIATES, INC. CITY OF REDLANDS DEVELOPMENT IMPACT FEE JUSTIFICATION STUDY January 9, 2017 Prepared for CITY OF REDLANDS 35 Cajon Street Redlands, CA 92373 Public Finance Facilities Planning
INDIAN WELLS VALLEY WATER DISTRICT 2010 URBAN WATER MANAGEMENT PLAN MAY Prepared by
 INDIAN WELLS VALLEY WATER DISTRICT (760) 375-5086 500 WEST RIDGECREST BOULEVARD POST OFFICE BOX 1329 RIDGECREST, CALIFORNIA 93556 RIDGECREST, CALIFORNIA 93556-1329 INDIAN WELLS VALLEY WATER DISTRICT 2010
Metropolitan Water District. July 25, 2013
 Metropolitan Water District July 25, 2013 The Mission of the Metropolitan Water District is to provide its service area with adequate and reliable supplies of high-quality water to meet present and future
Option 11. Divert Water from Miocene and Hendricks Canal to Supply the Ridge
 Integrated Water Resources Plan Option 11 Divert Water from Miocene and Hendricks Canal to Supply the Ridge This option would use water from the Miocene Canal and/or Hendricks Canal for municipal supplies
CHART EXAMPLES OF WATER RATES AND CHARGES OF MWD MEMBER AGENCIES AND THEIR SUBAGENCIES
 1 CHART EXAMPLES OF WATER RATES AND CHARGES OF MWD MEMBER AGENCIES AND THEIR SUBAGENCIES MWD Member Agencies shown: MWDOC, SDCWA, Calleguas, Las Virgenes, West Basin, LADWP, Eastern and Foothill Member
Notice of Public Hearing. Notice of Public Hearing
 2015 URBAN WATER MANAGEMENT PLAN Table 8-2: Notification to Cities and Counties Retail: Notification to Cities and Counties City Name 60 Day Notice Notice of Public Hearing Dana Point Mission Viejo County
California Drought Update. The 2016 CALAFCO Annual Conference Program. Water Status Update: Where Are We? Where Are We Going?
 California Drought Update The 2016 CALAFCO Annual Conference Program Water Status Update: Where Are We? Where Are We Going? October 26, 2016 David Inouye Water Management Branch Chief Department of Water
IMPACT ON FINANCIAL AND PERSONNEL RESOURCES:
 MEMORANDUM TO: FROM: CITY COUNCIL GEOFF ENGLISH, DIRECTOR OF PUBLIC WORKS SUBJECT: CONSIDERATION OF PLACING A MEASURE ON THE BALLOT AT THE NOVEMBER 8, 2016 ELECTION TO AUTHORIZE THE PURCHASE OF STATE WATER
The City and MID adopted this 2010 UWMP in Copies of the adoption resolutions are included in Appendix B. ES-1
 ES.1 INTRODUCTION This (UWMP) has been prepared for the City of Modesto (City) and the Modesto Irrigation District (MID) by West Yost Associates (West Yost) as a joint UWMP. This 2010 UWMP for the City
DESIGN & CONSTRUCTION AND FIVE YEAR CIP PROJECT SUMMARY - ZONE 5 FISCAL YEARS THROUGH
 RIVERSIDE COUNTY FLOOD CONTROL AND WATER CONSERVATION DISTRICT DESIGN & CONSTRUCTION AND FIVE YEAR CIP PROJECT SUMMARY - ZONE 5 FISCAL YEARS 2018-19 THROUGH 2022-23 Number Stg No. Title Total Remaining
CHAPTER 2 POPULATION, LAND USE & WATER USE TRENDS
 Population CHAPTER 2 POPULATION, LAND USE & WATER USE TRENDS 2.1 PAST POPULATION IEUA s service area experienced rapid growth over the past ten years (see Figure 2-1). In 2000, the population within the
Section V: Water Accounting and Water Supply Reliability
 Section V: Water Accounting and Water Reliability A. Quantifying the Water Supplier s Water Supplies 1. Agricultural Water Supplier Water Quantities Table 41 shows typical water diversions from the CA
1969 Western Judgment History and Application. January 7, 2011 Board of Public Utilities
 1969 Western Judgment History and Application January 7, 2011 Board of Public Utilities Presentation Overview Overview of the Judgment Safe Yield Summary RPU Water Rights by Basin Judgment Overview Complaint
2015 Urban Water Management Plan for Mojave Water Agency
 Courtesy: Google Earth FINAL 2015 Urban Water Management Plan for Mojave Water Agency Prepared by Kennedy/Jenks Consultants June 2016 300 North Lake Avenue, Suite 1020 Pasadena, California 91101 626-568-4300
4.21 WASTEWATER DISPOSAL
 4.21 WASTEWATER DISPOSAL 1. SUMMARY The proposed project includes a wastewater reclamation plant (WRP), which would be owned and operated by the City of Santa Clarita and recycle up to 395,411 gallons
Water and Power Policy Group
 Water and Power Policy Group Retrospective Analysis of Changed Central Valley Project and State Water Project Conditions Due to Changes in Delta Regulations January 213 Retrospective Analysis January 213
SACRAMENTO LOCAL AGENCY FORMATION COMMISSION 1112 I Street, Suite #100 Sacramento, California (916) August 3, 2005
 August 3, 2005") SACRAMENTO LOCAL AGENCY FORMATION COMMISSION 1112 I Street, Suite #100 Sacramento, California 95814 (916) 874-6458 August 3, 2005 TO: FROM: RE: Sacramento Local Agency Formation Commission Peter Brundage,
SACRAMENTO LOCAL AGENCY FORMATION COMMISSION 1112 I Street, Suite #100 Sacramento, California 95814 (916) 874-6458 August 3, 2005 TO: FROM: RE: Sacramento Local Agency Formation Commission Peter Brundage,
UWMP Checklist Arranged by Subject
 Checklist Arranged by CWC 10620(b) 10620(d)(2) Requirement Every person that becomes an urban water supplier shall adopt an urban water management plan within one year after it has become an urban water
CHAPTER 9 Supply and Demand Comparison
 CHAPTER 9 Water Code 10635,(c) Every urban water supplier shall include, as part of its urban water management plan, an assessment of the reliability of its water service to its customers during normal,
Section V: Water Accounting and Water Supply Reliability
 Section V: Accounting and Supply Reliability A. Quantifying the Supplier s Supplies 1. Agricultural Supplier Quantities Table 38 shows typical water diversions from the CA Aqueduct during the representative
AN ORDINANCE OF THE COUNTY OF SAN BERNARDINO, STATE OF CALIFORNIA, ADDING ARTICLE 5 TO CHAPTER 6 OF DIVISION
 ORDINANCE NO. AN ORDINANCE OF THE COUNTY OF SAN BERNARDINO, STATE OF CALIFORNIA, ADDING ARTICLE TO CHAPTER OF DIVISION OF TITLE OF THE SAN BERNARDINO COUNTY CODE RELATING TO GROUNDWATER MANAGEMENT IN THE
Supplying Southern California with Dependable Supplies of Water
 University of Colorado Law School Colorado Law Scholarly Commons Water Organizations in a Changing West (Summer Conference, June 14-16) Getches-Wilkinson Center Conferences, Workshops, and Hot Topics 6-14-1993
ENVIRONMENTAL IMPACT ANALYSIS WATER RESOURCES: WATER SUPPLY 1. ENVIRONMENTAL CONDITIONS. a. Physical Setting. (1) Water Supply
 Water Supply") IV. E.2. ENVIRONMENTAL IMPACT ANALYSIS WATER RESOURCES: WATER SUPPLY 1. ENVIRONMENTAL CONDITIONS a. Physical Setting (1) Water Supply The Los Angeles Department of Water and Power (LADWP) owns, operates,
IV. E.2. ENVIRONMENTAL IMPACT ANALYSIS WATER RESOURCES: WATER SUPPLY 1. ENVIRONMENTAL CONDITIONS a. Physical Setting (1) Water Supply The Los Angeles Department of Water and Power (LADWP) owns, operates,
IV.M.1 WATER SUPPLY 1. INTRODUCTION. 2. EXISTING CONDITIONS a. Water Supply i. Los Angeles Department of Water and Power (LADWP)
") IV.M.1 WATER SUPPLY 1. INTRODUCTION This section describes regional water supplies and existing water infrastructure serving the Project site, estimates the water demand associated with the Project, and
IV.M.1 WATER SUPPLY 1. INTRODUCTION This section describes regional water supplies and existing water infrastructure serving the Project site, estimates the water demand associated with the Project, and
Chapter 8 National Economic Development and Locally Preferred Alternative
 Chapter 8 National Economic Development and Locally Preferred Alternative Determination of Feasibility This chapter considers the feasibility of the NED Plan and the Locally Preferred Alternative. As indicated
CHAPTER 4 Water Demand
 CHAPTER 4 4.1 OVERVIEW OF WATER USE As described in Chapter 2, the City s water service area consists of one large contiguous service area and several outlying non-contiguous service areas. The City is
AGENDA DATE: November 14, 2018
 ALAMEDA COUNTY FLOOD CONTROL AND WATER CONSERVATION DISTRICT, ZONE 7 100 NORTH CANYONS PARKWAY, LIVERMORE, CA 94551 PHONE (925) 454-5000 FAX (925) 454-5727 ORIGINATING SECTION: INTEGRATED PLANNING CONTACT:
PUBLIC WORKS SERVICES DEPARTMENT MEMORANDUM WATER SUPPLY EXACTION FEE
 CITY OF BEVERLY HILLS PUBLIC WORKS SERVICES DEPARTMENT MEMORANDUM TO: FROM: PUBLIC WORKS COMMISSION Vince Damasse, Water Resources Manager Trish Rhay, Assistant Director of Public Works Services DATE:
3. PUBLIC FACILITIES ELEMENT
 3. PUBLIC FACILITIES ELEMENT A. Purpose This Element is intended to identify essential public facilities, buildings, and services and to describe policies and programs that will ensure that the existing
Beaumont Basin Watermaster
 Beaumont Basin Watermaster 2017 Consolidated Annual Report and Engineering Report FINAL 2017 Watermaster Board Art Vela, City of Banning George Jorritsma, South Mesa Water Company, Vice Chairman Eric Fraser,
6.13 Utilities and Service Systems
 6.13 6.13.1 Introduction This section describes impacts for utilities and service systems that would result from construction and operation of the CEQA Alternatives. 6.13.2 Regulatory Setting There are
CHAPTER I INTRODUCTION TO WYOMING WATER ADMINISTRATION
 INTRODUCTION TO WYOMING WATER ADMINISTRATION Section 1. Constitutional Framework. a. The water within the boundaries of Wyoming is declared to be the property of the state by Section 1, Article 8 of the
RIPON MUNICIPAL SERVICE REVIEW AND SPHERE OF INFLUENCE PLAN
 RIPON AND SPHERE OF INFLUENCE PLAN Prepared by the City of Ripon For San Joaquin LAFCO October 29, 2009 2009 PUBLIC REVIEW DRAFT SUBMITTED BY CITY OF RIPON OCTOBER 29, 2009 Table of Contents TABLE OF CONTENTS
TABLE OF CONTENTS 4.17 UTILITIES AND SERVICE SYSTEMS...
 TABLE OF CONTENTS 4.17 UTILITIES AND SERVICE SYSTEMS... 4.17-1 4.17.0 Introduction... 4.17-1 4.17.1 Methodology... 4.17-2 4.17.2 Existing Conditions... 4.17-2 4.17.3 Impacts... 4.17-4 4.17.4 Applicant-Proposed
City of Stockton California
 Report to: City of Stockton California Delta Water Supply Project (DWSP) Surface Water Supply Fee (SWSF) June 2009 Prepared by HDR, Inc. June 8, 2008 Ms. Melissa Price City of Stockton Municipal Utilities
5.11 UTILITIES WATER SUPPLY
 5.11 UTILITIES WATER SUPPLY 5.11.1 INTRODUCTION The purpose of the Water Supply section is to assess the proposed project s potential impact on available water supply and infrastructure. The analysis in
Service Provider Responses
 OAK GLEN CREEK SPECIFIC PLAN DRAFT EIR CITY OF YUCAIPA Appendices Appendix I Service Provider Responses December 2016 OAK GLEN CREEK SPECIFIC PLAN DRAFT EIR CITY OF YUCAIPA Appendices This page intentionally
Adjudication Background and the Watermaster. ABC s of Water Jeffrey Ruesch November 15, 2016
 Adjudication Background and the Watermaster ABC s of Water Jeffrey Ruesch November 15, 2016 The MWA Mission N MWA Boundary Manage the region s water resources for the common benefit to assure stability
Water Rate Study 2015
 Water Rate Study 2015 Final Report May 20, 2015 BART LE WELLS ASSOCIATES Independent Public Finance Consultants 1889 Alcatraz Avenue Berkeley, California 94703 www.bartlewells.com Tel: 510/653-3399 TABLE
Cadiz Inc. Corporate Presentation November 2017
 Cadiz Inc. Corporate Presentation November 2017 Cadiz Valley 1,300 square-mile watershed in Mojave Desert. Aquifer system holds approx. 20 million AF, like Lake Mead. Natural recharge 32,500 AF/year. Cadiz
Notice of Public Hearing
 Rancho Division Notice of Public Hearing Proposed Rate Changes for District Water, Recycled Water, and Wastewater Service Charges WHEN: WHERE: Thursday, June 14, 2018, 8:30 a.m. Rancho California Water
AGENDA REPORT. SUBJECT: Sustainable Groundwater Management Act of 2014
 AGENDA REPORT Meeting Date: September 29, 2015 Agenda Item # City Manager Approval: TO: FROM: Honorable Mayor and Members of the City Council Rick Crabtree, City Manager/Attorney SUBJECT: Sustainable Groundwater
DRAFT. Recycled Water Cost of Service and Rate Study Report. Napa Sanitation District
 DRAFT Recycled Water Cost of Service and Rate Study Report Napa Sanitation District December 2011 DRAFT Executive Summary Recycled Water Cost of Service and Rate Study Report 2 The Napa Sanitation District
CHAPTER 3 WATER DEMAND AND SUPPLY
 CHAPTER 3 WATER DEMAND AND SUPPLY The water used in IEUA s service area comes from both local and imported sources. Local sources include groundwater, surface water, desalinated water and recycled water.
Crestline-Lake Arrowhead Water Agency
 FINAL DRAFT Crestline-Lake Arrowhead Water Agency 2010 Urban Water Management Plan July 2011 Crestline-Lake Arrowhead Water Agency 2010 Urban Water Management Plan For Adoption By: Crestline-Lake Arrowhead
MUNICIPAL SERVICE REVIEW
 FINAL REPORT MUNICIPAL SERVICE REVIEW Prepared for: Local Agency Formation Commission for Los Angeles County 700 North Central Avenue, Suite 350 Glendale, CA 91203 Prepared by: Dudek and Associates, Inc.
Palmdale Water District Municipal Service Review
 Acknowledgements Palmdale Water District Municipal Service Review Prepared for: Local Agency Formation Commission for the County of Los Angeles 80 South Lake Avenue, Suite 870 Pasadena, CA 91101 Prepared
ENERGY FACILITY LICENSING PROCESS
 ENERGY FACILITY LICENSING PROCESS CALIFORNIA ENERGY COMMISSION Water Supply Information STAFF PAPER/DRAFT DECEMBER 2000 P700-00-017 STATE OF CALIFORNIA 1975 2000 ENERGY COMMISSION Gray Davis, Governor
The Privatization of the Kern Water Bank and the State Water Project AquAlliance Water Conference, Nov. 2012
 The Privatization of the Kern Water Bank and the State Water Project AquAlliance Water Conference, Nov. 2012 Adam Keats, Center for Biological Diversity Largest state-built water storage and conveyance
Report Documenting the Reasonableness of the Conjunctive Use Benefit of Surface Water and Recycled Water to Groundwater Customers
 Report Documenting the Reasonableness of the Conjunctive Use Benefit of Surface Water and Recycled Water to Groundwater Customers For the Santa Clara Valley Water District Final Report February 27, 2015
9/24/2013. PRESENTED BY: the Tule River Tribe; Tom Rodgers; the Native American Rights Fund; GEI; and NRCE
 PRESENTED BY: the Tule River Tribe; Tom Rodgers; the Native American Rights Fund; GEI; and NRCE 1848 California Indian History Treaty of Guadalupe Hidalgo, which recognized the California Indians aboriginal
SGMA Roadmap: February 2019 Where We've Been, and Where We're Headed Next
 SGMA Roadmap: February 2019 Where We've Been, and Where We're Headed Next Water Education Foundation Water 101 February 7, 2019 Kevin O'Brien Downey Brand LLP kobrien@downeybrand.com 916.520.5235 SGMA
City of Rio Vista Urban Water Management Plan 2010
 1. Plan Preparation: City of Rio Vista Urban Water Management Plan 2010 The City of Rio Vista (City), as defined in the California Waster Code section 10617, qualifies as an "Urban Water Supplier". The
Fillmore One to seven million acre-feet in storage depending on calculation assumption; surface area is 20,100 acres.
 Where does the City of Santa Paula obtain its water? Currently, the City of Santa Paula obtains its water supply from the court-adjudicated Santa Paula Groundwater Basin (Basin) and in lieu surface water
NOTICE OF PREPARATION. Notice of Preparation of an Environmental Impact Report for the Kern Water Bank Conservation and Storage Project
 NOTICE OF PREPARATION To: Responsible, Federal and Trustee Agencies (Agency) From: Kern Water Bank Authority 1620 Mill Rock Way, Suite 500 Bakersfield, California 93311 (Address) Subject: Notice of Preparation
Water Supply Study for the Lyons Canyon Project
 for the Lyons Canyon Project Prepared by: Science Applications International Corporation TABLE OF CONTENTS 1.0 INTRODUCTION... 1 1.1 Lyons Canyon Project... 1 1.2 Purpose of the Water Supply Study...
WASTEWATER INTRODUCTION ENVIRONMENTAL SETTING
 3.14.4 WASTEWATER INTRODUCTION This section of the Draft EIR describes the wastewater disposal conditions in the area surrounding the project site. The analysis focuses on potential impacts to wastewater
Technical Memorandum
 Specialists in Agricultural Water Management Serving Stewards of Western Water since 1993 To: From: Technical Memorandum Butte County Department of Water and Resource Conservation Davids Engineering Date:
President Chatigny Vice President Lash Director Ball Director Dopp Director Parks. 3. Adoption and Adjustment of Agenda (additions and/or deletions)
") BEAUMONT CHERRY VALLEY WATER DISTRICT AGENDA REGULAR MEETING OF THE BOARD OF DIRECTORS Wednesday, September 10, 2008 7:00 p.m. 560 Magnolia Avenue, Beaumont, CA 92223 Assistance for the Disabled: If you
BEAUMONT CHERRY VALLEY WATER DISTRICT AGENDA REGULAR MEETING OF THE BOARD OF DIRECTORS Wednesday, September 10, 2008 7:00 p.m. 560 Magnolia Avenue, Beaumont, CA 92223 Assistance for the Disabled: If you
SANTA ANA WATERSHED BASIN STUDY
 SANTA ANA WATERSHED BASIN STUDY INLAND EMPIRE INTERCEPTOR APPRAISAL ANALYSIS TECHNICAL MEMORANDUM NO. 2 SUMMARY OF BRINE & FLOW DATA AUGUST 2012 (FINAL DRAFT - APRIL 2013) prepared by: Thomas R. Nichols,
EL PASO COUNTY WATER REPORT
 EL PASO COUNTY WATER AUTHORITY EL PASO COUNTY WATER REPORT DRAFT Executive Summary The El Paso County Water Authority (EPCWA) has prepared this Water Report to assist in evaluating how water demands of
Appendix I Water Supply Assessment
 Appendix I Water Supply Assessment Water Supply Assessment (Senate Bill 610) TARGET SHOPPING CENTER PREPARED FOR: Vaughn Water Company PREPARED BY: Contact: Charlie Marr, P.E. March 19, 2009 Vaughn Water
3.3 GROUNDWATER ALLOCATION TRANSFERS FROM DEVELOPED PROPERTIES
 approximately 12 miles east of the City of San Buenaventura and approximately 9 miles west of the City of Fillmore. The City of Santa Paula is responsible for water supply and distribution within the City
Marina Coast Water District. Marina City Counsel and Planning Commission Special Joint Meeting and Study Session April 29, 2014
 Marina Coast Water District Marina City Counsel and Planning Commission Special Joint Meeting and Study Session April 29, 2014 1 MCWD Discussion Points Existing Wells Water Production and Consumption Future
West Bountiful City. Water System Capital Facilities Plan
 Water System Capital Facilities Plan August 2008 TABLE OF CONTENTS 1.0 Executive Summary... 1 2.0 Definition of Terms and Abbreviations... 2 3.0 Introduction... 3 3.1 Background...3 3.2 Scope of Investigation...3
SUMMARY OF METROPOLITAN S RESPONSES TO COMMENTS REGARDING METROPOLITAN S DRAFT 2015 URBAN WATER MANAGEMENT PLAN
 SUMMARY OF METROPOLITAN S RESPONSES TO COMMENTS REGARDING METROPOLITAN S DRAFT 2015 URBAN WATER MANAGEMENT PLAN The Metropolitan Water District of Southern California ( Metropolitan ) received comments
CHAPTER 2 Water Demands
 CHAPTER 2 Water Demands This chapter provides an overview of the City s water service area and describes the City s historical annual water use. Subsequent sections of this chapter examine projected water
Sierra Mountains. LA Aqueduct. Supplies Conservation
 Sierra Mountains LA Aqueduct Delta State Water Project Supplies Groundwater and Recycling Colorado River Aqueduct Supplies Conservation Groundwater Recovery CRA 21% SWP 29% Local Supplies & LA Aqueduct
CITY OF PRESCOTT WATER MANAGEMENT POLICY
 CITY OF PRESCOTT WATER MANAGEMENT POLICY 2005-2010 APPROVED BY PRESCOTT CITY COUNCIL OCTOBER 25, 2005 RESOLUTION #3712 AMENDMENT #1 MARCH 27, 2007 RESOLUTION #3807 INTRODUCTION AND BACKGROUND The City
CITY HALL. Tuesday, January 29, :00 P.M. AGENDA
 455 North Rexford Drive CITY HALL address the agenda listed below: meeting if you require captioning service so that reasonable arrangements can be made. please call the City Manager s Office at (310)
A7. Economic Analysis Water Supply Cost and Benefits
 A7. Economic Analysis Water Supply Cost and Benefits Attachment 7 identifies the costs and water supply benefits attributed to the seven projects proposed for implementation in the Santa Barbara County
RESOLUTION NO
 RESOLUTION NO. 2019-01 A RESOLUTION OF THE BOARD OF DIRECTORS OF THE SAN BENITO COUNTY WATER DISTRICT ESTABLISHING GROUNDWATER CHARGES IN ZONE 6 FOR THE 2019-2020, 2020-2021 and 2021-2022 WATER YEARS WHEREAS,
Appendix G Preliminary Hydrology Study
 Appendix G Preliminary Hydrology Study Preliminary Hydrology Study VESTING TTM 72608 Long Beach, CA Prepared for: The Long Beach Project, LLC 888 San Clemente, Suite 100 New Port Beach, CA May 28, 2014
SANTA CRUZ LOCAL AGENCY FORMATION COMMISSION SPHERES OF INFLUENCE POLICIES AND GUIDELINES
 SANTA CRUZ LOCAL AGENCY FORMATION COMMISSION SPHERES OF INFLUENCE POLICIES AND GUIDELINES I. Legislative Authority Amended by Resolution No. 2011-1; February 2, 2011 The Knox-Nisbet Act of 1963 (former
4.n. 07/12/2007. Wayne M. Fowler, Sr. Local Government Analyst
 4.n. 07/12/2007 TO: FROM: SUBJECT: Local Agency Formation Commission Wayne M. Fowler, Sr. Local Government Analyst LAFCO 2007-13-4 MINOR SPHERE OF INFLUENCE AMENDMENT (addition) TO THE CITY OF BLYTHE AND
CHAPTER 5 WASTEWATER FLOWS
 CHAPTER 5 WASTEWATER FLOWS 5.1 REGIONAL FACILITIES Regional Water Recycling Plants Figure 5-1 illustrates the service area boundaries for IEUA s four water recycling plants. The four Regional facilities
RPU WATER SUPPLY PLAN UPDATE October 7, 2011
 RPU WATER SUPPLY PLAN UPDATE October 7, 2011 Overview of Water Supply Planning Develop a safe, reliable, local, sustainable, and cost effective water supply to maintain Riverside s water independence for
Section 6 Supplemental Water Recharge Enhancement Opportunities
 Section 6 Supplemental Water Recharge Enhancement Opportunities 6.1 Introduction This section describes the existing supplemental water recharge conditions, challenges to meeting future replenishment obligations,
WATER AND WASTEWATER CAPACITY FEES REPORT PROPOSED
 WATER AND WASTEWATER CAPACITY FEES REPORT PROPOSED B&V PROJECT NO. 197551 Black & Veatch Holding Company 2015. All rights reserved. PREPARED FOR Town of Clayton, North Carolina 4 MAY 2018 Table of Contents
Section V: Water Accounting and Water Supply Reliability
 Section V: Accounting and Supply Reliability A. Quantifying the Supplier s Supplies 1. Agricultural Supplier Quantities Table 46 illustrate the District s water. The District routinely transfers and/or
ADDITIONAL GENERAL PLAN EDITS TO CONSIDER
 ADDITIONAL GENERAL PLAN EDITS TO CONSIDER OVERVIEW During the circulation period for the Draft Environmental Impact Report, additional changes, edits, and clarifications to the Draft General Plan have
Water Rates in Santa Barbara County: February 2019
 City/District or Company Billing interval Monthly, Bimthly Water Rates in Santa Barbara County: February 2019 Rate * structure, Block etc HCF Buellton Monthly Per Carpinteria Valley Water District Casmalia
Water Rates in Santa Barbara County: February 2018
 City/District or Company Billing interval Monthly, Bimthly Water Rates in Santa Barbara County: February 2018 Rate * structure, Block etc Single Family (SFR) Buellton Monthly Carpinteria Monthly Block
Warehousing Supply and Demand Task 5 Progress Report and Next steps
 Warehousing Supply and Demand Task 5 Progress Report and Next steps presented to Southern California Association of Governments presented by Cambridge Systematics, Inc. John Husing (Economics & Politics)
SECTION 2: PROJECT DESCRIPTION
 SECTION 2: PROJECT DESCRIPTION 2.1 - Project Location The proposed incorporation of the Arden Arcade Community (project or proposed incorporation) would result in the establishment of a new city. LAFCo
5.0 ALTERNATIVES 5.1 INTRODUCTION
 5.1 INTRODUCTION The California Environmental Quality Act (CEQA) Guidelines state that an EIR shall describe a range of reasonable alternatives to the Project, or to the location of the Project, which
Dry Creek Flood Control Improvement Project
 Dry Creek Flood Control Improvement Project The following is a brief overview of the planned IRWM Stormwater Flood Management Grant Application from the Fresno Metropolitan Flood Control District (FMFCD)
STATE OF THE HEMET/SAN JACINTO BASINS
 STATE OF THE HEMET/SAN JACINTO BASINS WHITE PAPER Submitted to the Eastern Municipal Water District Board of Directors, December 13, 2000 INTRODUCTION The following staff report recommends that Eastern
Section 5 Packages. 5.1 Package Development Problem Statements A 5-1
 5.1 Package Development Each of the options presented in Section 4 was conceived to serve one or more purposes. No single option, however, is capable of addressing all of the County s water management
Chapter 6 Population Forecast and Projections of Water Demand, Peak Day Requirements and Wastewater Flow
 Chapter 6 Population Forecast and Projections of Water Demand, Peak Day Requirements and Wastewater Flow Purpose and Scope This chapter uses the Washoe County Consensus Population Forecast (Washoe County,
EAST VALLEY WATER DISTRICT Wastewater Collection System Master Plan
 2 Population and Land Use Population and land use information was utilized to analyze existing wastewater flows and to estimate future flows. The population and land use data were obtained from the following:
HIGHLAND COMMONS TAX INCREMENT FINANCING PLAN PICAYUNE, MISSISSIPPI 2015
 HIGHLAND COMMONS TAX INCREMENT FINANCING PLAN PICAYUNE, MISSISSIPPI 2015 1 HIGHLAND COMMONS TAX INCREMENT FINANCING PLAN PICAYUNE, MISSISSIPPI 2015 ARTICLE I. PURPOSE AND INTENT Section 1.01 Preamble.