TOGETHER North Jersey Air Quality TABLE OF CONTENTS
|
|
|
- Cory Stevenson
- 6 years ago
- Views:
Transcription
1
2 TABLE OF CONTENTS 1 Introduction Organization of the Report Key Findings Introduction to Existing Regulatory Structure Criteria Pollutants State Implementation Plan Basics Transportation Conformity Basics Air Toxics Program Cumulative Impact Analysis Existing Conditions and Trends Types of Available Data Health Effects of Air Pollutants Baseline and Trends Ozone Fine Particulate Matter (PM2.5) Air Toxics Regional Haze Sources of Air Emissions Assessing Multiple Pollutants Cumulative Impact Analysis Neighborhood Level Planning, Policy and Implementation Context Federal, State and Regional Programs Already in Place State Implementation Plan Transportation Conformity Air Toxics Program Diesel Program Regional Programs Innovative New and Voluntary Programs Clean Diesel Programs Education and Outreach for Clean Driving Programs Cumulative Impact Assessment Green Infrastructure Opportunities and Challenges Supplemental Environmental Projects Sustainable Jersey Plans Raising the Bayonne Bridge Natural Gas Usage Desired Long Term Outcomes Measuring Progress Fewer Days with Poor Attainment of Standards Reduced Exposures in Overburdened Neighborhoods Meeting Health Benchmarks for Air Toxics in the Entire Region Page 2
3 5.1.5 Lower Emissions from Onroad Mobile Sources References Tables/Figures/Appendices Table 1: Air Monitoring Sites in the NJTPA Region Table 4: Trends in High Particle Days Table 5: Sample of Sources and Programs Addressed in SIPs Table 6: Desired Long Term Outcomes and Associated Indicators Figure 1: Trends in High Ozone Days: Weighted Average Based on the AQI Figure 2: Trends in High Particle Days: Weighted Average Based on the AQI Figure 3 a- g: New Jersey Emission Inventory Summaries by Source Category Figure 4 a- b: Estimated Diesel Particulate Risk in New Jersey from Mobile Sources Appendix A: Environmental Trends Report: Ozone Appendix B: Environmental Trends Report: PM Appendix C: Environmental Trends Report: Air Toxics Appendix D: NATA 2005 Cumulative Risk Maps from Google Earth (EPA 2013d) Appendix E: NJ Clean Freight: Moving Freight With the Speed of Green Acronyms ALA: American Lung Association COH: Coefficient of Haze DPM: Diesel Particulate Matter EPA: US Environmental Protection Agency GACT: Generally Achievable Control Technology HAPs: Hazardous Air Pollutants HUD: US Department of Housing and Urban Development MACT: Maximum Achievable Control Technology NAAQS: National Ambient Standards NATA: National- scale Air Toxics Assessment NEDC: Northeast Diesel Collaborative NJDEP: NJ Department of Environmental Protection NJTPA: North Jersey Transportation Planning Authority NOx: Oxides of Nitrogen OTC: Ozone Transport Commission PM2.5: Fine Particulate Matter ppm: parts per million SEP: Supplemental Environmental Project SIP: State Implementation Plan SO 2 : Sulfur Dioxide SOTA: State of the Art TCM: Transportation Control Measures TNJ: TOGETHER North Jersey ug/m 3 : micrograms per cubic meter US DOT: US Department of Transportation Page 3
4 VMT: vehicle miles traveled VOC: Volatile Organic Compounds 1 Introduction This report is one of a series of baseline reports that seek to characterize existing conditions, regional needs, patterns, trends, challenges and opportunities with respect to a particular issue in the thirteen- county northern New Jersey region. This particular report will provide an overview of air quality in the region and focus on ways that it can be improved through the TOGETHER North Jersey (TNJ) planning process. TNJ is expected to call for development patterns and transportation investments that change the way people and goods move through the region, reducing Vehicle Miles Travelled (VMT) and thus mobile source emissions. Since motor vehicles (cars, trucks, buses, etc) are a critical source of air pollution in the region, the overall result of implementing TNJ should be an improvement in regional air quality as a whole. Other strategies for improving air quality are also described in this report, such as clean diesel programs and green infrastructure techniques, that are good policies to pursue in development projects and that can supplement VMT reduction strategies. Care must also be taken to avoid reducing pollution in one part of the region at the expense of another part. To help avoid this scenario, this report will also identify specific locations that suffer from unhealthy air quality and, therefore, are limited in their ability to absorb new growth unless air quality is improved there. Some of the supplemental strategies mentioned above may help in this regard. In addition, tools for assessing cumulative impacts are summarized here. Other baseline reports in this series will address additional aspects of air quality such as reducing vehicle miles traveled (see Transportation), carbon emissions from mobile sources and the advantages of green buildings (see Energy and Climate), and air quality in low- and very- low income communities (see Healthy Communities). 1.1 Organization of the Report This report is presented in four sections. The first section is an introduction to existing regulatory structures, written for those who are not familiar with air quality management issues. The second section describes existing conditions and key trends with respect to four principle pollutants or groups of pollutants: ozone, fine particulate matter, air toxics, and diesel particulate matter. It provides an overview of the levels of these pollutants with respect to standards and benchmarks, and a brief discussion of the health effects of these pollutants of concern. A summary of the types of sources that emit these pollutants is provided. Finally, there is a discussion of the difficulties of assessing the impact of multiple pollutants; and several neighborhoods with especially high exposures to multiple pollutants are identified. Page 4
5 The third section focuses on the policy, planning and implementation context that surrounds these pollutants of concern. The section sketches out the federal, state and regional programs that are in place to move toward reduced exposure to air pollutants, and then identifies several new or voluntary initiatives that are being explored by various entities to further reduce emissions from mobile sources and/or further reduce exposure to the pollutants of concern. The final section identifies desirable outcomes that relate to improved air quality. It then proposes indicators that may be used going forward to determine how, and to what extent, those outcomes are actually occurring. I would like to thank Chris Sturm (NJ Future) for her guidance in preparing this report and helping to shape it into a useful tool for TNJ. I also received considerable help from Peg Hanna (NJDEP) in scoping out the issues related to diesel vehicle emissions and from Carrie Sargeant (The Trust for Public Land) in creating a framework for discussing green infrastructure strategies. Members of the NESCAUM Air Toxics and Public Health Committee provided a helpful forum for discussing ways to present the air toxics information provided here. I am also grateful to Chris Salmi, Tonalee Key, Olga Boyko and Paul Romano (all with NJDEP) for their final review and helpful comments. I hope that this report will be of value as TOGETHER North Jersey moves ahead with its planning and implementation efforts while constantly making the region a healthier place to live. 1.2 Key Findings This report is focused on four principle pollutants or groups of pollutants: ozone, fine particulate matter, air toxics (benzene, 1.3- butadiene, ethylbenzene and formaldehyde), and diesel particulate matter. Mobile sources (cars, trucks, buses, etc) are major contributors to the emission of these pollutants to the air in the region. Health Effects: These air pollutants can adversely affect every part of the respiratory system, from nose to lungs and everywhere in between. These pollutants can also cause damage beyond the respiratory system. In the form of gases or fine particulates, pollutants can move from the lungs into the bloodstream and then travel to other organs, such as the brain or liver. So the array of adverse effects from exposure to air pollutants is very broad, ranging from asthma to cancer to brain damage and birth defects. Of particular concern is a growing body of evidence linking asthma, low birth weight, and other adverse health effects to exposure to motor vehicle exhaust by those who live near heavily traveled roadways. Existing Conditions & Trends: Tremendous improvements in the last 20 years have led to comfortably attaining the standards (NAAQS) for four of the six criteria pollutants, and compliance with the NAAQS for PM2.5 should be officially approved soon. The state is still making progress toward meeting the NAAQS for ozone, with a goal of However, there is still work to be done. Although the state has met or may soon meet the NAAQS for PM2.5 and ozone, respectively, the safe thresholds for these pollutants have not yet been identified, and future tightening of these NAAQS should be expected. And, as global warming drives up summer temperatures in the region, ozone levels may increase causing potential setbacks in attainment. Page 5
6 Risks posed by air toxic emissions remain quite high in the NJTPA region. County- average cancer risk predictions are generally greater than the health benchmark (set at a one in a million cancer risk level) for air toxics commonly found in vehicle exhaust and as high as 45 times the health benchmark (or 45 in a million risk) for formaldehyde. Diesel emissions continue to pose a serious health risk in many urban areas even though the primary pollutant categories that they contribute to, such as fine particulate, appear to be meeting NAAQS. The NJDEP analysis of the NATA results for 2005 at the county level show extremely high cancer risk for diesel particulate matter, ranging from 62 to 925 times the health benchmark (or just short of one in a thousand cancer risk). Finally, there are a number of neighborhoods in the older urban core that suffer from elevated air toxics exposures compared to the rest of the region. Thirty census tracts in 12 municipalities are identified by NATA as having cancer risks greater than 100 in a million. In these overburdened neighborhoods, exposures are the result of multiple sources emitting a wide range of air toxics, including a significant proportion from onroad mobile sources. Existing regulatory structures: The New Jersey Management programs includes such fundamental components as the State Implementation Plan (SIP), Transportation Conformity, and an Air Toxics program. The SIP describes the strategies and control measures that will be adopted in order to meet the National Ambient Standards (NAAQS) for ozone and fine particulate matter. Transportation Conformity, the link between air quality and transportation planning, is the process that ensures transportation investments are consistent with air quality goals in areas where concentrations of pollutants exceed (or have exceeded) the NAAQS. The Air Toxics Program relies on a combination of risk assessment and control technology requirements to address the vast array of air pollutants that do not have any ambient air quality standards. Finally, the Mobile Source program has a suite of strategies in place to reduce emissions from diesel engines, including inspection and maintenance, idling restrictions, and retrofits. Challenges: The State Implementation Plan, Transportation Conformity Requirements and Air Toxics and Mobile Source Programs described above have resulted in steady improvements in air quality over the past four decades. But they fall short when it comes to addressing the cumulative impact of multiple sources on specific neighborhoods, or when trying to balance regional air quality or economic improvements that have simultaneous adverse impacts on overburdened communities. This report briefly describes two examples, one related to raising the Bayonne Bridge and the second related to switching from coal combustion to natural gas. Opportunities: Innovative programs that complement the existing regulatory structure are also discussed briefly in this report. They include approaches to assessing cumulative impacts; using green infrastructure to improve air quality in urban areas; a wide array of clean diesel programs; using supplemental environmental projects as conditions for settling enforcement actions; and tapping into plans being developed by local Green Teams as part of the Sustainable Jersey program. Indicators: Environmental indicators that can be used to track progress toward the four TNJ long- term outcomes related to air quality are identified. They use information routinely reported by NJDEP, EPA and the American Lung Association. These indicators will allow TNJ to track progress toward their goals Page 6
7 of fewer unhealthy days, attainment of the NAAQS, and meeting the health benchmarks for air toxics in the region. 2 Introduction to Existing Regulatory Structure The purpose of this section is to describe regulatory programs that are in place to guide state officials as they develop and implement strategies to improve air quality in New Jersey. It is written at a fairly rudimenary level for those who are not familiar with the Management Program that is in place in New Jersey. The Federal Clean Air Act (CAA) has established a regulatory framework for identifying air quality problems and addressing them. The focus of this law is ambient air which is considered to be outdoors in areas that are generally accessible to the public. The framework addresses air pollutants in two different ways. For a small number of pollutants, known as Criteria Pollutants, National Ambient Air Quality Standards (NAAQS) are set by the U.S. Environmental Protection Agency (EPA) and states are delegated the responsibility of assessing compliance with the standards (through air quality monitoring). States then define attainment and non- attainment areas, and for those areas that do not meet the standards (i.e. non- attainment areas) the states establish a State Implementation Plan (SIP), describing the strategies and control measures that will be adopted in order to meet the standards. The Clean Air Act also identifies a list of about 187 pollutants that are Hazardous Air Pollutants (HAPs). For this set of pollutants the Clean Air Act directs EPA to set technology and work practice standards for reducing air emissions and to delegate responsibility to states to enforce these standards. In addition, the State of New Jersey has regulations and permitting practices that help to minimize emissions of Toxic Air Contaminants (or Air Toxics), a category of pollutants that generally (but not completely) coincides with the national HAP list. 2.1 Criteria Pollutants The EPA has set NAAQS for 6 pollutants. They are: carbon monoxide, lead, nitrogen dioxide, ozone, particulate matter, and sulfur dioxide. For these six criteria pollutants there are federal processes and requirements that guide state, regional and local agencies to identify problem pollutants and solutions for addressing them. The most significant requirements are addressed in State Implementation Plans and Transportation Conformity Plans State Implementation Plan Basics Once a NAAQS has been adopted, air monitoring will be done by state agencies (for at least 3 years) to determine which parts of their jurisdiction meet the standards (known as Attainment Areas ) and which areas do not meet the standards (known as Non- Attainment Areas ). States must then develop State Implementation Plans (SIPs) that will eventually lead to meeting the relevant standard in the Non- Attainment Areas. The length of time allowed by the Clean Air Act for meeting the standard varies from pollutant to pollutant. A SIP can include a wide variety of strategies. The New Jersey SIP to meet the ozone standard, for example, includes programs to reduce emissions from traditional industrial sources, power plants, private automobiles, household cleaning products, and many other sources. Each strategy must be Page 7
8 adopted in regulations and the state agency must have the resources and authority to enforce the regulations. (EPA 2013e) Once a state attains (or meets) a standard it is required to include a Maintenance Plan in its SIP that will be followed in order to ensure that the former nonattainment area of the state continues to meet the NAAQS. This plan will include a continued commitment to air quality monitoring, plus stategies to ensure that any significant increases in emissions (for example, from a new factory or power plant or the increase in emissions due to growth) will not result in significant deterioration in the good air quality levels that have been reached. Estimates of current and future emissions are an important part of the SIP development process. Compilations of air emissions are generally known as emission inventories. Emission Inventories help to identify the most significant sources so that they can be targeted for controls; and inventories are used to ascertain whether a selected set of control strategies will be sufficient to finally meet the standard and to maintain attainment. Finally, it should be noted that the Clean Air Act requires EPA to re- evaluate each NAAQS at 5- year intervals. The NAAQS may be changed during this evaluation as a result of new health effects data that have been gathered. When this happens, states must submit revisions to their SIPs to demonstrate attainment and maintenance of those new or revised NAAQS and to meet other statutory requirements Transportation Conformity Basics Transportation Conformity is the link between air quality and transportation planning. It is the process, established by the US Department of Transportation (DOT) and EPA, that ensures transportation investments are consistent with air quality goals in areas where concentrations of pollutants exceed the NAAQS. Nonattainment areas must ensure that their transportation plans, programs, and projects conform to the SIP by showing that the mobile source emissions produced do not exceed transportation emission budgets. This means that transportation projects must not worsen air quality, or interfere with progress toward attaining the NAAQS. Transportation Conformity planning is also an important part of a maintenance plan for those pollutants that meet the standard and are directly or indirectly emitted by motor vehicles. (see Federal Highway Administration 2013) 2.2 Air Toxics Program To address the vast array of air pollutants that are not among the criteria pollutants, state and federal agencies have developed air toxics programs. Toxic Air Contaminants (or Air Toxics) is a general term that can be applied to all of the non- criteria pollutants. The federal program developed by EPA is focused on a list of about 187 Hazardous Air Pollutants (HAPs) that were designated by the Clean Air Act Amendments of For these pollutants the EPA has identified the source categories that account for the majority of the nation s HAP emissions, and for these source categories the EPA has established Maximum Achievable Control Technology (MACT) standards and Generally Available Control Technology (GACT) standards, which lay out ways to reduce the emission of HAPs using add- on controls and best management practices. (see EPA 2013a) NJDEP has accepted delegation for most of the federal HAP program. The NJDEP Permitting Program also has a control technology component to address both criteria pollutants and HAPs known as State of the Art (SOTA) controls. In addition, there is a risk Page 8
9 assessment/risk management process that considers the health impact of air toxic exposure to determine if the control techniques that are being proposed are adequate. (NJDEP 2013a) Missing from the federal HAPs list is diesel engine exhaust. Emissions from diesel engines are a complex mixture of dozens of chemicals, many of which are found among the criteria pollutants or on the list of HAPs. A large proportion of the individual pollutants found in diesel exhaust are known to cause adverse health effects. A subset of the components of diesel exhaust is diesel particulate matter (DPM). As a group, DPM has been found likely to pose a lung cancer hazard, as well as causing damage to both the circulatory and respiratory systems, especially the heart and lungs. (EPA 2002) NJDEP has an important component of its mobile source program focused on reducing diesel emissions in the state. It includes a wide array of regulatory and voluntary programs including motor vehicle inspections, idling restrictions, and retrofitting older diesel engines with emission control devices. (NJDEP 2013b) 2.3 Cumulative Impact Analysis The State Implementation Plan, Transportation Conformity Requirements and Air Toxics Programs described above are not sufficient to address the cumulative impact of multiple small sources on specific neighborhoods. In a 2009 report, the New Jersey Environmental Justice Advisory Council (EJAC 2009) described this shortcoming in detail, and looked at how other states and municipalities were addressing the problem. They also recommended actions to identify vulnerable and burdened communities, perform additional analysis in these neighborhoods, and reduce or eliminate excessive exposures. This issue is not yet being addressed by NJDEP in any comprehensive manner. 3 Existing Conditions and Trends This report describes existing conditions and trends in the region for the pollutants covered in the NAAQS and for air toxics and diesel particulate matter. The report explains why emissions from mobile sources can be a greater concern than emissions from stationary sources. The report also identifies locations within the region that suffer from elevated air pollution exposures where greater efforts to proactively improve air quality are needed, especially when those areas are forecast or planned for major development. 3.1 Types of Available Data When discussing baseline air quality, two groups of pollutants are generally considered. The first group are the six criteria pollutants: carbon monoxide, lead, nitrogen dioxide, ozone, particulate matter, and sulfur dioxide. For particulate matter, the size of the particle is a critical factor in determining health effects. EPA is conerned about particles that are 10 micrometers in diameter or smaller, because these particles are small enough to be inhaled. Smaller particles (less than 2.5 micrometers in diameter) can cause even more severe heatlh effects since they can travel deeper into the lungs. EPA has established two sets of NAAQS for particulate matter one for particles less than 10 micrometers in diamter (PM10) and one for particles less than 2.5 micrometers in diameter (fine particulate or PM2.5). Page 9
10 The second group of pollutants is much larger and is commonly referred to as Air Toxics or Hazardous Air Pollutants. The air toxics of particular concern in this report are those that are emitted by motor vehicles, especially: benzene, 1,3- butadiene, ethylbenzene, formaldehyde and diesel particulate matter (EPA 2013h). Monitoring Stations have been operated throught the State for over four decades in order to establish whether areas meet the NAAQS for the criteria pollutants. The sites for these monitoring stations are chosen to fulfill a number of different objectives including: 1) to measure maximum pollutant concentrations; 2) to assess general population exposure; 3) to determine the impact of major pollution sources; 4) to measure background levels; and 5) to determine the extent of regional pollutant transport. (NJDEP 2011) At present there are 21 monitoring sites in the NJTPA region that measure one or more of the pollutants of interest in this report (see Table 1). The PM2.5 monitor in Fort Lee, sited near the entrance to the George Washington Bridge, is an example of a monitor placed to characterize high exposure. Other sites, such as those measuring ozone in Bayonne and Leonia, are intended to represent the exposures to this pollutant that are common throughout the region (or county) in order to get a sense of what the general population is experiencing. There is also one background site in the region, which is located in Chester. This site is located away from populated areas and significant local sources in order to measure the baseline levels of air pollution that local sources would be adding to. For three of the criteria pollutants carbon monoxide, lead and nitrogen dioxide - - the monitoring network has been used to show that the state has been meeting the NAAQS for decades. This is also the case for sulfur dioxide, with the exception of a small area in western Warren County that is not meeting the sulfur dioxide standard due to emissions of a Pennsylvania power plant. For the other two pollutants ozone and fine particulate matter an ongoing effort is necessary to move closer to and ultimately meet the air quality standards. Air quality levels for the criteria pollutants can be expressed in a number of ways. The data collected from the air quality monitors are expressed as concentrations in units of either micrograms per cubic meter (ug/m 3 ) or parts per million (ppm). The concentrations measured at a given site are generally averaged over 1- hour, 8- hours, 24- hours or 1- year timeframes, and then the averaged concentrations are compared to the NAAQS. For example, the NAAQS for carbon monoxide has two concentration levels: a 1- hour average of 35 ppm and an 8- hour average of 9 ppm (EPA 2013c). If data from a monitor exceeds either of these concentration levels more than once in a year, then the area represented by the monitor may be considered to be out of attainment. The EPA has developed an Index (AQI) which is used by states to alert the public to potentially unhealthy levels of pollution (AQI 2011). It is also a convenient way to summarize the Air Quality status of an area. Instead of reporting a confusing array of concentrations in ug/m 3 and ppm over various averaging times and pollutants, the index characterizes the air quality as good, moderate, or unhealthy for sensitive groups, and unhealthy (for the general population) for each county on each day of the year. An AQI value of 100 generally corresponds to a concentration that is right at the standard (NAAQS), and a value of 50 is at half of the standard. When the AQI is 50 or less, the air quality is considered to be Good. When the AQI is between 51 and 100 (i.e. between 51% and 100% of the standard), the air quality is considered to be Moderate or generally acceptable. When the index value is between 101 and 150, the air quality is considered Unhealthy for Sensitive Groups. In this range the general public Page 10
11 is unlikely to be affected, but members of sensitive groups may experience adverse health effects. Children, older adults, and people with respiratory or heart conditions are likely to be in a sensitive group depending on the pollutant. An AQI greater than 151 is considered to by Unhealthy for the general population. For ozone, EPA describes sensitive groups in this way (EPA 2008): People with lung disease, such as asthma Children and older adults People who are active outdoors For PM2.5, sensitive groups include (EPA 2003a): People with heart or lung disease Children and older adults Air quality monitoring data for air toxics is scarce. There are four stations in the NJDEP network that routinely measure air toxics. Three are located in the NJTPA Region in Elizabeth, New Brunswick and Chester. These sites have been operating since All three sites have been measuring four of our toxics of concern: benzene, 1,3- butadiene, ethylbenzene and formaldehyde. Measuring DPM in ambient air is problematic, since it is difficult to distinguish the particulate from diesel engines from particulate emitted by other sources in the samples that are collected. Sometimes Elemental Carbon is used as an indicator or tracer for diesel emissions, but it is not possible to convert elemental carbon measurements into estimates of DPM unless other emission sources of elemental carbon in a given area are also known. (NJDEP 2013e, Schauer 2003) For this reason, no DPM concentrations are reported here. In the absence of extensive monitoring data, modeling techniques are often used to estimate exposure to air toxics. The National- scale Air Toxics Assessment (NATA) is a comprehensive modeling effort carried out by the EPA (EPA 2013d). Since a 1996 baseline analysis, EPA has been preparing this assessment for air toxic emissions from large and small stationary sources, and onroad and nonroad mobile sources at 3- year intervals. The purpose of the assessment is to better understand the risks posed by air toxics exposure across the country as a whole so that air pollution specialists can focus their limited resources on the areas at greatest risk and on the source types that are of greatest concern. The NATA modeling results will be used here to supplement the rather limited air toxics monitoring data. 3.2 Health Effects of Air Pollutants It is not surprising that air pollutants can adversely affect every part of the respiratory system. From nose to lungs and everywhere in between, when air pollutants come into contact with the tissues of the body they can cause damage. The type and severity of the damage will depend on the quantity of a pollutant that a person is exposed to (concentration) and how long the exposure persists. Short exposures to high concentrations are called acute, while long term (occuring over a year or more) exposures to typically lower concentrations are called chronic. Many air quality standards reflect this time difference by setting limits linked to a specific time frame. Air pollutants can also cause damage beyond the respiratory system. In the form of gases or fine particulates, pollutants can move from the lungs into the bloodstream and then travel to other organs, such as the brain or liver. So the array of adverse effects from exposure to air pollutants is very broad, Page 11
12 ranging from asthma to cancer to brain damage and birth defects. Table 2 summarizes the primary health endpoints for the air pollutants of greatest concern in this region ozone, particulate matter, benzene, 1,3- butadiene, ethylbenzene, formaldehyde, and diesel particulate matter. The information in this table is gathered from an extensive list of on- line sources that can be accessed for more details about what is known of the specific effects of each pollutant. There is a growing body of evidence linking asthma, low birth weight, and other adverse health effects to exposure to motor vehicle exhaust by those who live near heavily traveled roadways. One example recently appeared in Environmental Health Perspectives (Perez et al. 2012). Their study in Los Angeles reached the same conclusion found elsewhere in the country: that there are large public health consequences associated with exposure to air pollution in metropolitan areas with dense traffic corridors. 3.3 Baseline and Trends Ozone Ozone is a gas that occurs both in the Earth s upper atmosphere and at ground level. Ozone can be good or bad for people s health depending on its location in the atmosphere. Of course, it is the ground level that is of concern here because that is where breathing ozone can have adverse effects on health. Ozone is not usually emitted directly into the air, but is created by chemical reactions involving oxides of nitrogen (NOx) and volatile organic compounds (VOC) in the presence of sunlight. These compounds - NOx and VOCs - are commonly called precursors. NOx is primarily emitted by motor vehicles, power plants and other sources of combustion. VOCs are emitted from a wide array of sources including motor vehicles, industrial facilities, consumer and commercial products (such as paints and coatings), natural sources such as trees, and many many more. Ozone and its precursors can also be carried into New Jersey from upwind areas. As a result, controlling ozone pollution requires a broad range of measures to reduce sources of precursors both in New Jersey and in upwind regions. Ozone control efforts have involved discussions with more than 37 states covering most of the eastern half of the country. For more information about ozone, see the Environmental Trends Report prepared by NJDEP and reproduced in Appendix A (NJDEP 2013c). NAAQS for ozone have been in place since 1979, and have been updated several times. The most recent change came in March 2008, when the NAAQS was tightened to a maximum 8- hour average concentration of ppm. The Clean Air Act requires that the EPA revisit each NAAQS five years after adoption, so the ozone NAAQS is currently under review. The review is scheduled for completion at the end of At that time the EPA could decide to maintain the current standard of ppm or to lower the standard, making it more stringent. Because the safe threshold for ozone has not yet been identified, future tightening in 2013 or during a subsequent review should be expected. In the meantime, a new SIP for ozone is in preparation. It is expected show attainment of the current standard (set in 2008) by the year The entire state has been designated as not attaining the 8- hour ozone standard that was adopted in However, there has been significant progress toward reducing ozone concentrations over the decades. The analysis by NJDEP that is presented in Appendix A shows that the maximum concentrations of ozone (observed at any site in the state) have fallen dramatically since 1984, from a Page 12
13 high of about ppm (1- hour average) to less than ppm in recent years. Eight- hour averages, which NJDEP began reporting in 1998, are somewhat lower. Another way to assess progress toward meeting the standard, is to record site days above the standard. To calculate this metric, every site that exceeds the standard on a given day is counted as one ozone exceedance site day. Thus, if 10 sites exceed the standard on one day, the result is expressed as 10 site days. The total number of site days that the eight- hour ozone standard was exceeded in New Jersy has decreased significantly over the last decade (again, see Appendix A), from a high of about 375 sites days in 2002 to a value just over 100 site days in One can also assess air quality monitoring data by using the Index (AQI) to group days above the standard into an aggregate measure. The American Lung Association (ALA) prepares an annual report that characterizes air quality at the county level by focusing on the number of days when the AQI is high for ozone or particulate matter. They look at 3- year increments (to make variations in weather a less prominent factor) and develop a weighted average metric that makes it easier to look at local data rather than statewide statistics. The most recent report (ALA 2012) uses data through Table 3 compiles the AQI results for ozone in the 13 counties of the study region. It shows that, of the eight counties with complete data in the region, the number of days that were unhealthy for sensitive groups ranged from 8 to 31, and two counties Hudson and Ocean each had one day that was unhealthy for the general population during the period The weighted average shown in Table 3 is calculated by giving days that are unhealthy a weight of 1.5, and days that are unhealthy for sensitive groups a weight of 1.0. Using this method for the period , the counties in the study region had weighted averages from 2.7 to Unfortunately, there are no AQI statistics for 5 of the study region counties. Three have no ozone monitors (Somerset, Sussex and Union), one has incomplete data (Essex), and the other (Warren) has a monitoring site that is too new to be covered by this time period. The ALA summaries can also be used to assess trends. Figure 1, for example, presents the weighted averages for three adjacent 3- year periods in the seven counties that have ozone monitors Even with this 3- year smoothing, there is a lot of spiking in the recent data. This may be related to the adoption of a new standard in 2008, which resulted in a change in the concentration levels deemed unhealthy and unhealthy for sensitive groups. However, the sensitivity to new information about unhealthy levels of ozone will make this tool useful in tracking future ozone trends and assessing whether the region is approaching a goal of fewer unhealthy days Fine Particulate Matter (PM2.5) Particulate matter consists of both solid particles and liquid droplets. Particles are either directly emitted into the air or formed during atmospheric reactions between substances such as sulfur dioxide (SO 2 ) and oxides of nitrogen (NOx). Most forms of combustion emit all three of these pollutants (particulate matter, SO 2 and NOx). Ammonia and Volatile Organic Compounds (VOCs) are also important precursor pollutants for fine particulate matter (PM2.5). Large particles are produced by many types of manufacturing, grinding and processing operations; but the fine particulate matter that we are concerned about here is not generally associated with that type of activity. For more information about particulates, see the Environmental Trends Report prepared by NJDEP and reproduced in Appendix B (NJDEP 2013c). Page 13
14 NAAQS for particulate matter have been in place since 1971 when the focus was on Total Suspended Particulate (i.e. particles of all sizes). In 1987, a NAAQS was set for inhalable particulates (known as PM10) which applied to smaller particles with an aerodynamic diameter of 10 micrometers or less. In 1997, additional NAAQS were set for even smaller particles with an aerodynamic diameter of 2.5 micrometers (PM2.5). Revisions were made to the PM2.5 NAAQS in 2006 and The current levels are set at 35 ug/m 3 for 24- hours and 12.0 ug/m 3 for an annual average. At the end of 2012, NJDEP submitted an attainment demontration to EPA (NJDEP 2012) as one of the last steps toward declaring the entire state to be meeting the PM2.5 standards that were adopted in The Clean Air Act requires that the EPA revisit each NAAQS five years after adoption, and so it happened that about the same time that the SIP document was being submitted by NJDEP, a new more stringent NAAQS was set for PM2.5. It is expected that the state will be able to demonstrate attainment with this new NAAQS as well. However, because the safe threshold for fine particulate matter has not yet been identified, future tightening during a subsequent review should be expected. The change in the form of particulate that is covered by the NAAQS can make it difficult to look at long term trends, since different monitoring techniques are used to measure Total Suspended Particulate, inhalable particulate and fine particulate. One measurement that has been fairly constant over the decades, however, is the measurement of Smoke Shade. The NJDEP trends analysis in the 2011 Air Quality Report (NJDEP 2013e) includes a graph in the Particulate Summary section that is based on this parameter. Smoke Shade is measured in units known as coefficient of haze (COH) that indicate how much ight is transmitted through the air or, conversely, is blocked by particulate in the air. In 1967 the maximum smoke shade reading in the state exceeded 2.5 COH. Since the mid- 1990s, however, the levels have been consistently below 0.4 COH. This is evidence that overall particulate matter in the air has been declining, but it cannot be directly translated into progress toward lower levels of PM2.5. The NJDEP currently measures fine particulate matter at 14 sites in the project area using instruments that produce data that can be directly compared to the NAAQS. On December 26, 2012, the NJDEP submitted a redesignation request to EPA (NJDEP 2012) showing that concentrations at all of these monitors are meeting the NAAQS that was in place earlier in The monitors show that these areas also meet the new NAAQS that were established by EPA at the end of However, there does not appear to be a level below which there are no adverse health impacts from PM2.5, so the standard may be tightened even more in future years. Particulate samples to demonstrate compliance with the NAAQS are generally collected with filter- based monitors. The monitors run for 24- hours and then the samples are taken to a lab for analysis and an air concentration is calculated. This method does not lend itself to the timely reporting that is needed to determine the same- day Index. Therefore, NJDEP uses the smoke shade monitors to report if daily air quality is unhealthful or unhealthful for sensitive groups. However, American Lung Association annual reports that were described above as part of the ozone discussion (ALA 2012) are able to use actual particulate sample data since their reports are prepared after all the data are available. Table 4 compiles the AQI results for particulate matter in the 13 counties of the study region. It shows that of the nine counties in the region where monitors are located, the number of days that were unhealthy for sensitive groups ranged from 0 to 6, and none of the counties had any days that were unhealthy for the general population during the period Based on these results, the counties in the study region had weighted averages from 0 to 2.0. Unfortunately, there are no AQI statistics for four of the study region counties (Hunterdon, Monmouth, Somerset and Sussex) due to the lack of particulate Page 14
15 monitors. The ALA summaries can also be used to assess trends. Figure 2, for example, presents the weighted averages for three adjacent 3- year periods in the nine counties that have particulate monitors. Similar to ozone, data weighted averages show an uptick in poor air quality during the period. This way of evaluating the air monitoring data is sensitivite to new information about unhealthy levels of particulate matter (as may be reflected future changes to the NAAQS). It will be a useful tool in tracking particulate trends and assessing whether the region is approaching a goal of fewer days that are unhealthy for sensitive groups Air Toxics Air toxics are air pollutants that have the potential to cause adverse health effects, and that are not regulated through a NAAQS. There are hundreds of air toxics and they are emitted by a vast array of activities, usually divided into four categories: point sources, area (or nonpoint) sources, onroad mobile sources, and nonroad mobile sources (see Section 3.4 for more discussion of emission source categories). In the absence of air quality standards, health benchmarks are often employed as a way to evaluate whether the concentration of an air toxic is cause for concern. Health benchmarks rely on chemical evaluations carried out by EPA, the California Air Resources Board, and other government agencies. As illustrated in Table 2, the air toxics of concern in this report can cause cancer and many other illnesses. For noncancer effects, health agencies identify Reference Concentrations, or concentrations that a person could be exposed to without experiencing negative health effects. A noncancer health benchmark can then be set at the Reference Concentration to assess whether the observed or predicted level might cause any harm. For carcinogens, assessing the possibility of harm is more complex because for most carcinogens there is no known absolutely safe level. So for carcinogens, health agencies develop risk factors that can be applied to estimate the probability or risk of developing cancer as the result of a given exposure. These risk factors can be used to calculate the concentration that could result in a one in a million increase in the risk of getting cancer if a person inhaled that concentration over a whole lifetime. NJDEP generally sets the cancer health benchmark at this one in a million risk level. For a more complete description of how health benchmarks are set and used by the NJDEP Air Program see NJDEP 2013d. About 180 individual air toxics were included in the 2005 NATA assessment. Of these, only two- thirds have toxicity values that can be used to establish health benchmarks. Using these health benchmarks, NJDEP evaluated the NATA results for the state and identified 22 air toxics that had predicted NATA concentrations exceeding health benchmarks (NJDEP 2013f). Most of this set of 22 air toxics are emitted by stationary sources (both large and small) or are at high background levels throughout the entire country. Five of these air toxics, however, have significant contributions from mobile source emissions. This report will focus on that subset of air toxics since they are the most likely to be impacted by decisions made in TNJ development plans. These pollutants are Benzene, 1,3- Butadiene, Ethylbenzene, Formaldehyde and Diesel Particulate Matter. For more information about air toxics, including those from other source categories, see the Environmental Trends Report prepared by NJDEP and reproduced in Appendix C (NJDEP 2013c). Page 15
16 For those air toxics which are carcinogens but also have noncancer health risks, the cancer health benchmarks are generally much more stringent than the noncancer benchmarks. For example, the cancer health benchmark for benzene is 0.13 ug/m 3 and the noncancer health benchmark is 30 ug/m 3. Clearly if exposures are below the cancer benchmark for benzene, they are also far below the noncancer benchmark. This is the case for all of the air toxics that are being reviewed in this report, so the following discussion will focus only on cancer risk. Monitoring and modeling results can be compared to these benchmarks to ascertain whether any of these pollutants may be posing a health problem. The three air toxics monitoring sites in the state show that air toxics of concern here are likely well above their respective health benchmarks throughout the region. The modeling results from the NATA can be used to get a better estimate of how widespread the risks might be and also to try to ascertain what portion of the exposures might be associated with emissions from onroad mobile sources. Air monitoring results for 2011 from the three air toxics monitoring sites (in Chester, Elizabeth and New Brunswick) are reported below to establish baseline levels using the cancer health benchmarks for comparison. Air monitoring at these sites shows some improvement in observed concentrations for benzene, 1,3- butadiene, ethlybenzene and formaldehyde over the past decade, although the concentrations have mostly leveled off in the past few years (NJDEP 2013e). County average concentrations predicted by the NATA modeling effort for 2005 are also reported below NJDEP 2013f). Benzene: There is a 20- year record of benzene monitoring data in Camden, showing significant reductions in concentration over that time period. Reports from monitors in Chester, Elizabeth and New Brunswick also show improvements since they began operation in However, concentrations at Chester and New Brunswick appear to have leveled off since Monitored levels of benzene in 2011 were 4 to 8 times the health benchmark in the region. NATA 2005 predicts county average concentrations of benzene to be 5 to 18 times the benchmark, with the lowest levels in Sussex County and the highest in Hudson. 1,3- Butadiene: Measurements of 1,3- butadiene began in Chester, Elizabeth and New Brunswick in Concentrations in Elizabeth dropped dramatically in the first few years and then leveled off. Concentrations in New Brunswick also fell in the first years (although not as much as Elizabeth), but have been nearly flat since In Chester, concentrations showed some increases over the period. Monitored levels of 1,3- butadiene in 2011 were slightly below the health benchmark in Chester, but were 2 to 4 times above the benchmark in New Brunswick and Elizabeth, respectively. NATA 2005 predicts county average concentrations of 1,3- butadiene to be at the benchmark in Sussex County and 2 to 5 times higher in the other study area counties. Ethlybenzene: Concentrations of ethylbenzene measured at the three air toxics sites in the region are lower now than they were at the beginning of monitoring over a decade ago. However, year- to- year variations do not show a discernable trend in the past few years. Monitored levels of ethlybenzene in 2011 were slightly below the health benchmark in Chester, and slightly above the benchmark in New Brunswick and Elizabeth. NATA 2005 predicts county average Page 16
17 concentrations of ethlybenzene to be near or well below the benchmark in all counties except Hudson where it is almost 3 times higher than the benchmark. Formaldehyde: Formaldehyde concentrations have been decreasing at air toxics monitoring sites in Chester and New Brunswick since the sites were established. At the Elizabeth monitor there is no discernable trend. Monitored levels of formaldehyde in 2011 were 30 to 45 times the benchmark, with the highest concentrations being observed in Elizabeth. NATA 2005 predicts county average concentrations of formaldehyde to be 19 to 40 times higher than the benchmark. Although most of the formaldehyde concentrations in the NATA study are the result of atmospheric formation and transport and cannot be directly attributable to local vehicles, for six counties (Bergen, Essex, Hudson, Middlesex, Passaic and Union) it is estimated that 10-12% of the formaldehyde is directly emitted by onroad mobile sources. Diesel Particulate Matter: As discussed above, measuring DPM in ambient air is problematic, since it is difficult to distinguish the particulate from diesel engines from particulate emitted by other sources in the samples that are collected. So there are no monitoring data to examine for trends. NATA evaluations for years prior to 2005 used different means for estimating the geographic distribution of diesel engines, so comparisons to prior years can be misleading. Therefore, we must rely on modeling estimates to establish a baseline level of the risk from exposure to DPM and then look to future analysis for possible trends. NATA 2005 predicts county average concentrations of diesel particulate matter to be 62 to 925 times higher than the health benchmark. (Figure 4a provides a geographic representation of how the risk estimates vary by county.) This is by far the most serious cancer risk predicted for any of the pollutants included in NATA, with the highest levels expected to be in Hudson County. Onroad mobile sources are expected to contribute about half of the diesel emissions in most of the counties in the study region Regional Haze An additional reason to be concerned about the levels of PM2.5, NOx and other pollutants in Northern New Jersey is their effect on visibility. The Clean Air Act authorizes EPA to protect visibility in certain national parks and wilderness areas known as Class I areas. There is one Class I area in New Jersey the Brigantine Wilderness Area in the Edwin Forsythe National Wildlife Refuge, located just a few miles north of Atlantic City. NJDEP submitted a SIP to address visibility problems at Brigantine in The same pollutants that cause visibility problems at Brigantine can also obscure the New York City skyline when viewed from New Jersey. The pollutants scatter and absorb light, limiting the distance that one can see and also obscuring color and clarity. NJDEP operates a camera that takes real time pictures documenting visibility from Newark looking toward New York City. Landmarks between the camera and lower Manhattan are used to establish the limits to visibility at any given time. (NJDEP 2013j) 3.4 Sources of Air Emissions Air pollutants come from a wide variety of sources that can be generally classified into four categories: point sources, area (or nonpoint ) sources, onroad mobile and nonroad mobile. Page 17
18 Point Sources are stationary facilities or processes whose locations can easily be identified. Point sources include large facilities that emit a significant amount of air pollution during manufacturing, power generation, heating, incineration, or other such activity. Area (or Nonpoint) Sources are small stationary sources of air pollution that by themselves may not emit very much, but when their emissions are added together, they account for a significant portion of total air emissions. They are generally too small or too numerous to be listed individually. They include gas stations, residential heating, dry cleaners, and a multitude of other sources. Onroad mobile sources are vehicles found on roads and highways, including cars, trucks, buses, and motorcycles. Nonroad mobile sources include aircraft, trains, boats, lawnmowers, leaf blowers, and construction vehicles. NJDEP routinely updates the state emission inventories which compile information about the type and amount of pollutants discharged into the air in New Jersey within a specified time span, usually a calendar year. The information can be grouped into the source categories described above. This helps regulators to identify the most effective strategies for reducing critical emissions. A fifth category biogenic emissions is sometimes shown in the inventory. Biogenic emissions come from biological materials and other natural processes. A recent breakdown of emissions into these categories can be found in the PM2.5 SIP that was submitted to EPA in December 2012 (NJDEP 2012). The emission pie charts from that document can be found in Figures 3a to 3e. The signficance of emissions from onroad vehicles is clear from these figures. Onroad mobile sources are responsible for about 11% of direct emissions of PM2.5 and 6 to 58% of emissions of pollutants that lead to the formation of PM2.5 (i.e. sulfur dioxide, volatile organic compounds, ammonia and nitrogen oxides). For ozone, which is not directly emitted, the fraction of precursors from onroad mobile sources is 23% and 58% for VOCs and NOx, respectively. For Air Toxics, onroad mobile sources directly emit a substantial portion of four of the pollutants of concern in this report, with the contributions estimated to be about 30%, 40%, and 45% of total statewide emissions of benzene, 1.3- butadiene, and ethlybenzene, respectively (NJDEP 2013g). Diesel particulate matter is almost exclusively emitted from mobile sources, with about 47% coming from onroad vehicles and 53% from nonroad mobile sources on average statewide. The contribution of onroad mobile sources to formaldehyde concentrations in the state are harder to estimate, because so much of the formaldehyde that is present in the air is the result of secondary formation. Although only 9% of the formaldehyde in New Jersey s air is likely to be directly emitted by onroad mobile sources, about 82% of the ambient formaldehyde is the result of secondary formation from pollutants that may largely be coming from motor vehicles. Page 18
19 3.5 Assessing Multiple Pollutants Cumulative Impact Analysis Simply knowing if each individual pollutant in the air is below the NAAQS or below a health benchmark may not be enough to determine if air quality is healthy. For example, simply measuring particulate matter concentrations in the air does not account for the toxicity of individual components that are present in the mass of particulate matter. Assessing pollutants one by one also does not account for possible synergistic effects among pollutants. In addition, the existing programs described in Section 2 are primarily aimed at assessing large- scale air quality status at the municipal, county, or regional level and can easily miss local neighborhood hotspots. Another shortcoming of existing programs is that they are not comprehensive in their identification of air pollution sources. Many small sources are below the size threshold that would require air permits, so these sources are not documented on an individual source basis in the traditional air emissions inventories. When efforts are made to assess the impact of multiple sources in a focused area such as a neighborhood, information about these smaller sources is most often missing. Finally, planning and zoning decisions at the local level are generally not organized in such a way as to allow the consideration of the combined impact of multiple sources in the course of making land- use decisions. Municipal and county governments oversee significant land use and development plans, and their decisions can exacerbate cumulative impacts. The report on Cumulative Impacts prepared by the NJ Environmental Justice Advisory Council (EJAC 2009) suggests ways to improve this process Neighborhood Level There are locations within the NJTPA region that suffer from elevated air pollution exposures where greater efforts to proactively improve air quality are needed, especially when those areas are forecast or planned for major development. Some neighborhoods suffer from a multitude of environmental stressors from air pollution to water pollution, contaminated sites, odors and noise. EPA summarized the issues related to this type of multiple exposures a decade ago in the report Framework for Cumulative Risk Assessment (EPA 2003b). Efforts are underway at the federal, state and municipal level to develop tools to consider cumulative impacts in the most vulnerable neighborhoods. Some of these tools, including, EJView, C- FERST and a Cumulative Impact Model Ordinance, are described in Section Of particular interest in this report, are neighborhoods where multiple sources of air pollution - large and small, permitted and unregulated, from all the source categories (point, area, onroad and nonroad mobile) - are impacting the residents. Some researchers call these areas hotspots indicating that they have higher air concentrations of pollutants than the general population in New Jersey. NJDEP refers to these neighborhoods as overburdened (NJDEP 2013i), meaning that these areas may be suffering from environmental health problems due to multiple environmental stressors. NJDEP is developing a screening method to estimate cumulative environmental impacts (NJDEP 2013k) that can be used to identify these overburdened communities. When this tool is available, it may be possible to use it in conjunction with new tools coming from EPA to identify strategies tailored to the community for reducing those environmental burdens. Page 19
20 NATA results for 2005 (from a modeling analysis to estimate exposure to air toxics described in section 3.1) have been made available by EPA at the census tract level using Google Earth (EPA 2013i), making it possible to explore the cumulative air toxics impacts in the NJTPA region at a neighborhood level scale. Although the NATA analysis does not address all possible air pollutant exposures (it does not include the criteria pollutants, for example) and it may be subject to some data error (especially considering the enormity of the project), it still is a useful tool to identify neighborhoods that may be overburdened by air toxics exposures at the very least. A summary of the NATA results at the census tract level shows that noncancer risks are predicted to be low in the NJTPA region. Cumulative cancer risks (i.e. for all of the HAPs from all of the source categories) are generally in the range of 30 to 50 in a million (or 30 to 50 times higher than the health benchmark) in all 13 counties. In eight counties (Bergen, Essex, Hudson, Middlesex, Morris, Passaic, Somerset and Union) there are many census tracts with predicted risks in the 50 to 90 in a million range. And in five of these counties (Bergen, Essex, Hudson, Passaic and Union), there are several census tracts with predicted risks greater than 100 in a million. Screen shots from Google Maps showing the census tract level results from NATA can be found in Appendix D. The highest predicted risks appear as dark brown areas in those maps. Thirty census tracts in 12 municipalities are identified on these maps as having cancer risks greater than 100 in a million. The 12 municipalities with these high predicted cumulative cancer risks are listed below, with the number of high risk census tracts noted in parenthesis. Bergen County: Fort Lee (4) Palisades Park (1) Essex County: East Orange (2) Irvington (1) Newark (2) Hudson County: Bayonne (1) Jersey City (7) Hoboken (6) North Bergen (1) Union City (3) Passaic County: Paterson (1) Union County: Elizabeth (1) The highest predicted risk is 131 in a million in Fort Lee near the entrance to the George Washington Bridge. Note that these risk estimates do not include exposure to Diesel Particulate Matter, which was not handled as a carcinogen in the EPA analysis of the NATA predictions. If the analysis of the DPM exposures were available at the census tract level, these predicted risks would all be significantly higher. The contribution that each source category makes to the cumulative risk can be found by clicking on a census tract in the Google Earth maps. An examination of the maps shows that the contribution from all of the HAPs that are emitted by onroad mobile sources are substantial, ranging from 11 to 59% of the total predicted cancer risk in these 30 census tracts. The four air toxics that are the focus in this report account for most of this risk. 3.6 Summary Page 20
21 Tremendous improvements in the last 20 years have led to comfortably attaining the standards (NAAQS) for four of the six criteria pollutants, and compliance with the NAAQS for PM2.5 should be officially approved soon. The state is still making progress toward meeting the NAAQS for ozone, with a goal of However, there is still work to be done. Although the state has met or may soon meet the NAAQS for PM2.5 and ozone, respectively, the safe thresholds for these pollutants have not yet been identified, and future tightening of these NAAQS should be expected. And, as global warming drives up summer temperatures in the region, ozone levels may increase causing potential setbacks in attainment. Risks posed by air toxic emissions remain quite high in the NJTPA region. County- average cancer risk predictions are generally greater than the health benchmark (set at a one in a million cancer risk level) for air toxics commonly found in vehicle exhaust and as high as 45 times the health benchmark (or 45 in a million risk) for formaldehyde. Diesel emissions continue to pose a serious health risk in many urban areas even though the primary pollutant categories that they contribute to, such as fine particulate, appear to be meeting NAAQS. The NJDEP analysis of the NATA results for 2005 at the county level show extremely high cancer risk for diesel particulate matter, ranging from 62 to 925 times the health benchmark (or just short of one in a thousand cancer risk). Finally, there are within the region a number of neighborhoods in the older urban core that suffer from elevated air toxics exposures compared to the rest of the region. Thirty census tracts in 12 municipalities are identified by NATA as having cancer risks greater than 100 in a million. In these overburdened neighborhoods, exposures are the result of multiple sources emitting a wide range of air toxics, including a significant proportion from onroad mobile sources. 4 Planning, Policy and Implementation Context This section will review some of the programs and policies that are already in place to help the state of New Jersey to improve air quality and move toward the long- term goals of meeting all of the NAAQS for the criteria pollutants and health benchmarks for air toxics. In addition, several concepts and approaches are highlighted that may complement the current programs, especially in the context of development plans that affect housing and transit. This section is organized to flow from federal to state, local and voluntary programs, first addressing the criteria pollutants and then air toxics (including DPM). 4.1 Federal, State and Regional Programs Already in Place State Implementation Plan The State Implementation Plan (SIP), as described in Section 2.1.1, is a compilation of all the actions that the state is committed to take in order to move toward attainment of an air quality standard or in order to maintain compliance with the standard. The effort to meet the standards for ozone and fine particulate matter (PM2.5) has been ongoing for decades, with dozens of actions already in place. Still, more needs to be done. The latest SIPs (NJDEP 2007; NJDEP 2012) for these two pollutants have long lists of actions that address air pollution sources from every category - point, area, onroad and nonroad. Tables 5a and 5b provide a glimpse of the type of actions that are in place or being planned. Page 21
22 Nine counties in the NJTPA Region had been designated as not having attained the NAAQS for PM2.5. However, on December 26, 2012, the NJDEP submitted a redesignation request to EPA (NJDEP 2012). If it is accepted by EPA, then the area will be in attainment and the state will be in a maintenance program for both the 24- hour and annual PM2.5 NAAQS, which had been set at 35 ug/m 3 and 15 ug/m 3, respectively, at the time that the request was being prepared (EPA 2013c). It is expected that the measures in this SIP will also be sufficient to show attainment for the newest PM2.5 standard of 12 ug/m 3 (annual average) that was set on December 14, However, a new designation process will be necessary to demonstrate attainment with the 12 ug/m 3 NAAQS. The PM2.5 redesignation SIP package (NJDEP 2012) includes the following material: 1. air quality monitoring data that shows compliance with the NAAQS; 2. a summary of control measures that New Jersey has implemented to bring the State into attainment; 3. a maintenance plan that demonstrates a projected continuing downward trend in emissions through 2025; 4. a contingency plan that would be implemented should the air quality violate the NAAQS in the future; and 5. transportation conformity budgets; and other information that supports the request for redesignation. Among the strategies contained in the SIP are Transportation Control Measures (TCMs). These are specific programs designed to reduce emissions from transportation sources by reducing vehicle use or changing traffic flow or congestion. Examples include improving public transit and developing high occupancy vehicle (HOV) lanes. For PM2.5, completing these actions may be enough to maintain state and regional compliance with the NAAQS, but pockets of noncompliance may exist that will be difficult to identify with the limited network of air quality monitors. Additional reductions may be necessary to address these hotspots as well as to show compliance with future changes to the standards, which are to be reviewed every five years. NJDEP submitted an Ozone SIP to EPA in October This SIP was to show attainment of the 8- hour ozone NAAQS at the time (0.8 ppm) by June Since that time, the 8- hour ozone NAAQS has been tightened to ppm, and New Jersey s attainment date is In the case of ozone, ultimately meeting the NAAQS will depend a great deal on the success of programs taking place outside the state (see section 4.1.4, below), since ozone is a secondary pollutant formed by the reaction of other pollutants (VOCs and NOx) after traveling sometimes hundreds of miles. As with PM2.5, future changes to the standard may require still more actions. Going beyond the current plans may also be necessary to address the effects of increasing temperatures which could lead to greater conversion of precursor emissions into ozone Transportation Conformity Transportation Conformity, as described in Section 2.1.2, is the process established by US DOT and EPA to ensure that transportation investments will contribute to improving air quality in areas where concentrations of pollutants exceed NAAQS. Through inventory and modeling efforts, transportation Page 22
23 conformity confirms that traffic and transit projects are consistent with the transportation emission budgets set forth in the SIP, especially with respect to decreased emissions from onroad mobile sources. For the NJTPA region, Transportation Conformity applies to three criteria pollutants: ozone, carbon monoxide (CO) and fine particulate matter (PM2.5). Therefore, budgets for emissions from onroad vehicles are necessary for volatile organic compounds (ozone precursors), nitrogen oxides (ozone and PM2.5 precursors), CO and PM2.5. (Note that a maintenance program is still required for CO even though the state reached attainment of that NAAQS in 1995.) The budgets come from an analysis of state and federally funded projects and programs intended to rebuild, improve and maintain the State s roadway and transit systems. The projects are contained in Metropolitan Planning Organization Transportation Improvement Plans (TIPs). Transportation Improvement Plans The TIP for the NJTPA region is updated annually with a 4- year time horizon. The current TIP for FY became effective October 1, 2011 (NJTPA 2011). This TIP covers all the maintenance and repair of roads and bridges that are state and federally funded. It also includes many projects that have the potential to reduce VMT and/or emissions from onroad vehicles. These projects include walkways and bike paths, streetscape improvements, ferry service, variable message signage, circle elimination, and ramp improvements. The NJTPA Project Development Work Program is a way to feed projects into the TIP. At the conclusion of project level work, projects become candidates for inclusion in the TIP (NJTPA 2013) Air Toxics Program The New Jersey Air Toxics Program, described in Section 2.2, began officially in 1979 with the adoption of a state regulation Control and Prohibition of Air Pollution by Toxic Substances (N.J.A.C. 7:27-17). This rule required additional scrutiny of sources emitting any of 11 toxic substances. Over the years, the program expanded to include more air toxics and to use innovative screening tools to identify sources that needed additional controls or improved operations in order to reduce exposures in the neighboring areas. The New Jersey Air Toxics program is primarily implemented by the Permitting Program using its authority to require that both criteria pollutants and HAPs use State of the Art (SOTA) controls. In addition, there is a risk assessment/risk management process that considers the health impact of air toxic exposure to determine if the control techniques that are being proposed are adequate. (NJDEP 2013a) In 1990, the federal Clean Air Act was amended to include an extensive program to address air toxics nationally. The federal program is focused on a list of about 187 Hazardous Air Pollutants (HAPs). For these pollutants the EPA has identified the source categories that account for the majority of the nation s HAP emissions, and for these source categories the EPA has established Maximum Achievable Control Technology (MACT) standards and Generally Available Control Technology (GACT) standards, which lay out ways to reduce the emission of HAPs using add- on controls and best management practices. (see EPA 2013a) NJDEP has accepted delegation for most of the federal HAP program. Page 23
24 4.1.4 Diesel Program An important part of the Mobile Source Program in the NJDEP is the focusing on reducing emissions from diesel vehicles (especially diesel trucks and buses). The efforts include both regulatory and voluntary activities (NJDEP 2013b). The regulatory efforts are described here, and some of the innovative new and voluntary programs are described in Diesel Inspection and Maintenance Program: Inspections of heavy- duty diesel vehicles (trucks, school buses and commercial buses) are performed at licensed Diesel Private Inspection Centers and randomly at several roadside locations by teams comprised of State Police and Motor Vehicle Commission staff. The focus of the program is on reducing smoke emissions from these vehicles. In 2008, the smoke standards were tightened for heavy- duty diesel engines. Rules are being considered to incorporate lighter weight diesel vehicles (less than 8,500 pounds) into the emissions inspection program. Mandatory Retrofit Program: Since heavy- duty diesel engines have such a long service life, it takes an extraordinarily long time for new engine emission standards (such as those adopted at the federal level) to significantly lower emissions. To address the legacy fleets, the New Jersey Legislature adopted the Diesel Retrofit Law in The law requires that certain classes of diesel vehicles be retrofitted with tailpipe or engine controls to reduce particulate emissions, and a dedicated fund has been established to support the program. The first classes of vehicles to be targeted by this program are publicly owned solid waste vehicles, privately owned solid waste vehicles used in a public contract, and publicly and privately owned school buses. Idling Restrictions: Idling cars, trucks, school buses, public and private transportation buses, and off- road construction vehicles/equipment all contribute to the degradation of local air quality. NJDEP regulations limit engine idling for both diesel and gasoline vehicles to three minutes with limited exceptions. Working with County Health Departments, NJDEP has enforced these restrictions in critical locations. The Mobile Sources Program also offers for sale No- Idling Zone signs suitable for installing on buildings, parking lots or anywhere that idling is a problem, adding a compliance assistance component to the overall effort. Even with these efforts in place to lower emissions from diesel vehicles, the estimated diesel particulate risk in New Jersey is expected to remain high for the foreseeable future. Figure 4a compares the risk associated with emissions of onroad diesel vehicles as estimated by NATA 2005 to the expected risk in 2020 with significant fleet turnover in place and the use of cleaner diesel fuels that are mandated by the federal government. Even with these two major initiatives, the risk is projected to be well above the DPM health benchmarks throughout the NJTPA Region in 2020, and still over 100 in a million cancer risk in some parts of Bergen, Essex, Hudson, Middlesex, Passaic and Union counties (NJDEP 2013h). Even more significant are the risks from nonroad diesel engines, which are primarily construction equipment in this part of the state (see Figure 4b) Regional Programs Because ozone is formed in the atmosphere from pollutants that may have been emitted hundreds of miles away, it is essential that states work together on some aspects of their Ozone SIPs in order to address regional transport. The Ozone Transport Commission (OTC) has been established by the Clean Air Act for this purpose. The OTC is a multi- state organization that is responsible for advising EPA on Page 24
25 transport issues and for developing and implementing regional solutions to the ground- level ozone problem in the Northeast and Mid- Atlantic regions. New Jersey is an active member of the OTC. Two especially important aspects of their work are coordinated regional modeling and the development of model rules. For example, in 2012 the OTC prepared model rules addressing solvent degreasing, consumer products and idling by nonroad diesel engines. (OTC, 2013) Visibility is also an issue that warrants regional cooperation. As an offshoot of OTC, the Mid- Atlantic/Northeast Visibility Union (MANE- VU) was formed by the Mid- Atlantic and Northeastern states, tribes, and federal agencies to coordinate regional haze planning activities for the region. MANE- VU (2013) enables a coordinated approach to meeting the requirements of EPAs regional haze rules and reducing visibility impairment in major national parks and wilderness areas in the Northeast and Mid- Atlantic region, by providing technical assessments and assistance. These regional efforts will also help to improve visibility in Northern New Jersey where the same pollutants that cause visibility problems in wilderness areas can also obscure the New York City skyline when viewed from New Jersey. 4.2 Innovative New and Voluntary Programs In addition to the regulatory programs that are in place, there are several concepts and approaches that may complement the current programs, especially in the context of development plans that affect housing and transit. Some of these programs are discussed briefly below Clean Diesel Programs The NJDEP Mobile Sources Program provides guidance and technical assistance to many entities who undertake efforts to retrofit or otherwise reduce engine emissions above and beyond regulatory requirements. Reduce Vehicle Emissions from Construction Projects: As discussed above, there is a significant risk associated with the operation of offroad diesel engines (Figure 4b). In the NJTPA region these engines are mostly used in construction projects. A potentially powerful strategy for reducing exposure to DPM is to encourage the use of vehicles with newer engines or that are retrofitted with fine particulate controls at constructions sites for publically financed projects. An Executive Order signed by Governor Christie in 2011 (EO ) targets air pollution caused by diesel engines used on major transportation construction projects in New Jersey. It calls on NJDEP and NJDOT to create a diesel emission retrofit Pilot Program for construction equipment with the ultimate goal of improving air quality for those living near urban construction sites. This pilot program could be a good model for future activities in the NJTPA region. Restricting idling at construction sites can also be an effective tool. Specifications for operating cleaner diesel equipment have become more prevalent as states, local governments, public agencies, and private entities have begun to require that clean diesel construction technologies and strategies be used on their sites. The Northeast Diesel Collaborative (NEDC 2013) has developed equipment specifications and other best practices to minimize diesel emissions from construction. Clean diesel engines and a no idling commitment should be considered for construction of housing, businesses, schools, local roads, etc., especially those that are closest to existing residential areas and schools. Page 25
26 Goods Movement: With the presence of the Port of Newark and Elizabeth and many other intensive truck operations in the NJTPA region, there is the potential to greatly reduce DPM emissions by following the NJ Clean Freight Program recommendations when building or renewing facilities such as a warehouse or logistics center. (See flyer in Appendix D for details.) Recommendations include: Make Your Facility a No Idling Zone Provide Electric Plug- ins for Trucks and Containers Provide Essential Services for Drivers Encourage Truck Drivers to Follow Local Truck Routes Schedule Pickups and Dropoffs to Reduce Waiting Times Encourage the Use of Clean Trucks (2007 or Newer Engines) Maintain Communication with Neighboring Communities Encourage Shipping and Logistics Companies to join USEPA s Smartway Program Voluntary Retrofits: For the next several years, while the diesel engine fleet slowly turns over, voluntary retrofit programs will continue to be an important part of reducing DPM emissions. The NJDEP Diesel Program has managed voluntary demonstration projects with millions of dollars of federal grants, Congestion Mitigation and (CMAQ) funds, and enforcement settlement funds. Some of these projects have included retrofits of trucks and port equipment in Camden, Newark and Elizabeth Opportunities continue to become available, especially with assistance from NJDEP and from the NEDC (NJDEP 2013b) Education and Outreach for Clean Driving Programs No matter how successful the TNJ program is at reducing VMTs in the region, there will still be millions of cars on the road. Education and outreach efforts to encourage motorists to drive clean will help to move the region toward more healthy air quality. Promote the use of Clean Vehicles and Alternative Fuels: The New Jersey Clean Cities coalition works with vehicle fleets, fuel providers, community leaders, and other stakeholders to reduce petroleum use in transportation. Their programs focus on alternative fuel vehicles, idling reductions, fuel economy improvements, and much more (DOE 2013). The New Jersey Clean Vehicles Website (NJDEP 2013l) also offers information on how to purchase a clean vehicle and tips on how to maintain a vehicle so that it continues to be as clean as possible. No Idling Pledge: The NJDEP Mobile Source Program encourages emission reductions from all types of vehicles through their voluntary No Idling Pledge program. Their extensive public information (NJDEP 2013b) trumpets the message that only 10 seconds of idling uses more fuel than turning an engine off and on Cumulative Impact Assessment Overall reduction in exposure to air toxics will result from the decrease in VMTs throughout the region, but local areas with high impacts need to be addressed specifically, using tools that result in wise zoning and siting decisions, and tools that will identify effective risk reduction strategies. These decisions will be critical in the context of residential and transit development in the NJTPA region. Page 26
27 EJView: EPA has developed a tool that can map the locations of discharges or contaminated sites that are reported to EPA. The tool allows a specific area to be selected and specific types of sites to be chosen. The NATA cancer risk predictions can then be overlayed on the area. (EPA 2013g) The maps produced in this way can identify local sources and may help to identify risk reduction strategies. C- FERST: This Community- Focused Exposure and Risk Screening Tool is still in development by EPA. A beta version is being tested by Community Action for Renewed Environment (CARE) grant recipients. The goal is to develop a user- friendly tool that can be used by communities to generate maps of sources, concentrations, human exposures, and cumulative risks, with overlays about EJ factors or health outcomes, and also compare information across communities (Zartarian et al 2011). Reduce Near- Roadway Exposures: There is a growing body of evidence linking asthma, low birth weight, and other adverse health effects to exposure to motor vehicle exhaust by those who live near heavily traveled roadways. One example recently appeared in Environmental Health Perspectives (Perez et al. 2012). This study in Los Angeles reached the same conclusion found elsewhere in the country: that there are large public health consequences associated with exposure to air pollution in metropolitan areas with dense traffic corridors. The conclusions of Perez et al support compact urban development strategies coupled with policies to reduce near- roadway pollution exposure, such as ensuring that housing and schools are sufficiently separated from heavily traveled roads. Just how far away from a heavily traveled roadway is sufficient is still being debated, but a 75 to 100 meter minimum is often suggested. Cumulative Impact Model Ordinance: The NJ Environmental Justice Alliance has developed a model ordinance that could be adopted by municipalities seeking to consider the environmental impact of new developments or other projects in the context of all existing environmental exposures. The model ordinance (TESC 2013) would require the preparation of an Environmental Impact Statement that provides: a detailed statement and analysis of the environmental and public health impacts of the proposed development, in comparison to a baseline of such information describing current conditions of the site, and including: (1) both positive and negative impacts, and (2) any cumulative impacts which, when viewed in isolation, may be considered insignificant but when viewed in combination with prior or planned development and ongoing activities or reasonably foreseeable activities, may prove to be detrimental; (3) any adverse effects which cannot reasonably be avoided should the proposed application or project be approved as filed, taking into account practicable and feasible mitigation measures, including mitigation that may offset existing impacts through a net impact assessment The basic idea is to flag potentially harmful projects before they receive local siting approvals, and to ensure that their impacts are considered in the context of all existing environmental impacts in the same neighborhood. This model ordinance is currently being considered by the City of Newark Green Infrastructure While waiting for more complex emission reduction strategies to be put into place, green infrastructure projects can begin to improve air quality almost immediately. Green infrastructure includes a host of techniques which depend on the planting of trees, shrubs, vines and rain garden plants. Short- term reductions in exposure to air pollutants could be quickly gained from landscaping techniques such as tree planting, berms, and green walls. The types of projects described here have added benefits beyond direct air quality improvements. For example, trees and shrubs are well established as a means to Page 27
28 moderate the heat island effect observed in urban areas. Lower urban temperatures can attenuate the speed of formation of ozone in these areas. Trees have also been shown to have socioeconomic benefits (Kuo 2003, SCI 2013) and are a good return on investment over time. With respect to air quality, trees are first and foremost among green infrastructure techniques. Their ability to capture particulate matter from the air is well documented (Nowak et al 2006). Two other green landscaping techniques have the potential to be especially effective in overburdened communities: berms and green walls. Berms have been used to establish a buffer between industrial and residential areas. (Note that in overburdened areas, these two types of land use are typically intermingled.) In addition to interrupting air flow between use areas, the vegetation on a berm can be useful in capturing particulates. Berms also act as a wind break, reducing wind speeds. This is important in many overburdened communities where wind- blown fugitive dust can be a significant problem. Green walls have been established as an effective way to increase the surface area of green plants for pollutant removal. A green wall (usually a type of vine or climbing species such as wisteria, honeysuckle, etc.) provides vegetation on vertical surfaces to maximize plantings. Recent work by Pugh et al (2012) indicates that this type of green infrastructure may be much more effective than previously thought at removing pollutants from the air in urban areas, especially in street canyons. 4.3 Opportunities and Challenges This section explores a sample of opportunities for improving air quality that are present to those who are preparing and implementing the Regional Plan for Sustainable Development. Examples of some challenges are also given Supplemental Environmental Projects Funding to address a variety of environmental issues through pilot projects, infrastructure improvements, and other means may sometimes be available through Supplemental Environmental Projects (SEPs). A SEP is an environmentally beneficial project that a company voluntarily agrees to perform as a condition of settling an enforcement action. A SEP is an activity that the violator would not otherwise have been required to perform, and in which the public or the environment is the primary beneficiary (NJDEP 2013m). SEPs have been successfully used to fund diesel retrofit programs and to clean up a closed gas station so that it could be used for a pocket park Sustainable Jersey Plans Tapping into plans being developed by local Green Teams as part of the Sustainable Jersey program (Sustainable Jersey 2013), could provide opportunities to collaborate with local governments in their efforts to improve local air quality. Sustainable Jersey is a certification program for New Jersey municipalities wanting to foster choices that have a lower adverse impact on the environment. To date, 384 municipalities in the state have registered with the program. Many, such as Newark, are developing local municipal sustainability plans. The Newark plan includes a set of Priority Action Items to improve air quality (Sustainable Newark 2013). Some of these Actions Items are: Convene an air quality taskforce to identify, monitor and address health- harmful local sources of air pollution Page 28
29 Strengthen partnerships and advocacy work on major emission sources Phase out use of Number 6 and Number 4 heating oil in building boilers Raising the Bayonne Bridge The proposal to raise the Bayonne Bridge is an example of a project that makes sense from a certain economic perspective, but may have unintended adverse environmental impacts that must be addressed as part of the project, or that could ultimately outweigh the economic benefits. The Raise the Roadway project would raise the bridge 64 feet to make room for the new generation of supersized Panamax ships. Project proponents claim it will be a tremendous economic achievement. However, environmental organizations and local community groups have raised a number of concerns, especially with respect to the increased truck traffic that will result at the Port of Newark and Elizabeth. Neighborhoods adjacent to the Port are already overburdened communities, and can ill- afford exposure to additional diesel particulate matter. (Clean Water Action 2013) Natural Gas Usage Historically there has been a preference for natural gas combustion in New Jersey because of the stringent sulfur in fuel regulations that are in place in this state. In recent years new natural gas power plants have been recommended to replace existing coal and fuel oil plants. However, they are being proposed for areas that already have high cumulative air impacts. So, even though natural gas combustion to produce energy is cleaner than fuel oil or coal combustion, the suggested projects may still be a problem. Principles for identifying appropriate locations for new energy production may be a useful part of an overall development plan. 5 Desired Long Term Outcomes The HUD Partnership for Sustainable Communities has established six livability principles that act as a foundation for interagency coordination. Among these is a commitment to enhance the unique characteristics of all communities and invest in healthy, safe, and walkable neighborhoods (Livability Principle 6). This commitment to healthy neighborhoods makes it essential that jurisdictions adopt comprehensive integrated water, air and land use plans. Air quality impacts, therefore, must be considered as part of the TNJ development plan. Five outcomes that should be evident if TNJ is successful in improving and protecting air quality in the region are: Fewer Days with Poor : The region and its municipalities, neighborhoods and business districts enjoy healthy air quality with fewer days not meeting air quality standards and more areas meeting health benchmarks. Attainment of Standards: The region moves towards attainment of the National Ambient Standards and makes continued reductions in emissions even where the standards have already been met. Page 29
30 Reduced Exposures in Vulnerable Neighborhoods: Low- and very low- income communities enjoy cleaner air and reduced exposure to air pollutants. Meeting Health Benchmarks for Air Toxics in the Entire Region: All areas of the region are meeting the health benchmarks for diesel particulate matter and other air toxics. Lower Emissions from Onroad Mobile Sources: Continuous reduction of direct emissions and precursor emissions from onroad mobile sources. Also, ozone precursor emission reductions are adequate to overcome likely future increases caused by rising temperatures. The relationship between the fifth outcome and future increases in the rate of ozone formation that may result from rising temperatures due to global warming will be discussed in the Climate Change report. 5.1 Measuring Progress Indicators are tools to measure progress toward achieving long- term outcomes. Useful indicators are objective and easy to collect. The source of the data found in quantitative indicators should be consistent and likely to be available in future years. Environmental indicators that can be used to track progress toward the four direct outcomes listed above have been identified and are discussed in this section. While indicators related to health outcomes, such as asthma rates, would be of interest with respect to the overall goal of healthy communities, these health endpoints are affected by many factors beyond changes in air quality, making interpretation of health statistics difficult and often misleading if they are being evaluated as a measure of progress toward the goal of healthy communities. The New Jersey Environmental and Public Health Tracking system (NJDHSS 2013) is attempting to combine measures of air quality and disease prevalence in a meaningful way. In the future, that system may be able to provide more robust indicators that can measure progress toward the ultimate goal. For now, we are recommending the collection of the following group of indicators that rely only on existing environmental data to assess progress toward achieving long- term desired outcomes. These indicators are summarized in Table Fewer Days with Poor The region and its municipalities, neighborhoods and business districts enjoy healthy air quality with fewer days not meeting air quality standards. Number of days that are unhealthy or unhealthy for sensitive groups, measured by the Air Quality Index for the region as a whole and for the 11 counties with ozone and PM2.5 monitoring stations Attainment of Standards The region moves towards attainment of the National Ambient Standards and makes continued reductions in emissions even where the standards have already been met. Page 30
31 Current nonattainment & maintenance areas for NAAQS pollutants by type, by county, showing the portion of the region meeting the standards for ozone and PM2.5. This information is routinely available from NJDEP Reduced Exposures in Overburdened Neighborhoods Low- and very low- income communities enjoy cleaner air and reduced exposure to air pollutants. Decrease in the number of census tracts predicted to be above 100 in a million cumulative cancer risk as found in future NATA analyses Meeting Health Benchmarks for Air Toxics in the Entire Region All areas of the region are meeting the health benchmarks for diesel particulate matter and other air toxics. Decreased cancer risk posed by mobile source emissions in each of the 13 counties. Results should be available from future NATA analyses Lower Emissions from Onroad Mobile Sources Continuous reduction of direct emissions and precursor emissions from onroad mobile sources. Emission inventories prepared by NJDEP for criteria pollutants and by EPA for air toxics show reduced tonnage from the onroad mobile source category. 6 References ALA (2006). American Lung Association Publications: State of the Air Report Retrieved April 2, 2013 from: us/publications/ ALA (2009). American Lung Association Publications: State of the Air Report Retrieved April 2, 2013 from: us/publications/ ALA (2012). American Lung Association: State of the Air Report Retrieved April 2, 2013 from: AQI (2011). Index (AQI) - A Guide to and Your Health. Retrieved February 28, 2013 from: ATSDR (2013). Agency for Toxic Substances and Disease Registry: Toxic Substances Portal. Retrieved April 1, 2013 from: CARB (2013). California Air Resources Board: Consolidated Table of OEHHA / ARB Approved Risk Assessment Health Values. Retrieved April 1, 2013 from: Clean Water Action (2013). Raise the Roadway Bayonne Bridge Project. Retrieved May 2, 2013 from: roadway- bayonne- bridge- project Page 31
32 DOE (2013). US Department of Energy. NJ Clean Cities Coalition. Retrieved April 5, 2013 from: jersey EJAC (2009). Strategies for Addressing Cumulative Impacts in Environmental Justice Communities. Report to NJDEP, March EO60 (2011) Executive Order No. 60. Retrieved May 1, 2013 from: 60.pdf EPA (2002). Health Assessment Document for Diesel Engine Exhaust. EPA/600/8-90/057F. Report issued by the National Center for Environmental Assessment, Washington DC, May EPA (2003a). Guide for Particle Pollution. Retrieved April 1, 2013 from: EPA (2003b). Framework for Cumulative Risk Assessment. EPA/630/P- 02/001F. Report issued by the Risk Assessment Forum, Washington DC, May EPA (2008). Guide for Ozone. EPA- 456/F Report issued by Office of and Radiation, Washington DC, March EPA (2013a). About Air Toxics. Retrieved April 1, 2013, from: EPA (2013b). Integrated Risk Information System (IRIS). Retrieved April 1, 2013 from: EPA (2013c). National Ambient Standards (NAAQS). Retrieved April 1, 2013 from: EPA (2013d). National Air Toxics Assessments. Retrieved April 1, 2013 from: EPA (2013e). State Implementation Plan Status and Information. Retrieved April 5, 2013 from: EPA (2013f). Health Effects Notebook for Hazardous Air Pollutants. Retrieved April 1, 2013 from: EPA (2013g). EJView. Retrieved April 20, 2013 from: EPA (2013h). Mobile Source Air Toxics. Retrieved April 29, 2013 from: EPA (2013i). NATA Informational video October, 2011: Utilizing Interactive Maps. Retrieved April 30, 2013 from: Page 32
33 Federal Highway Administration (2013). Transformation Conformity. Retrieved April 1, 2013 from: m Kuo, F.E. (2003). The role of arboriculture in a healthy social ecology: Invited review article for a Special Section. Journal of Arboriculture 29: MANE- VU (2013). MANE- VU: Regional Planning for Improved Visibility. Retrieved May 1, 2013 from: NEDC (2013). Northeast Diesel Collaborative: Best Practices for Clean Diesel Construction. Retrieved April 5, 2013 from: NJDEP (2007). 8 Hour Ozone SIP. Retrieved April 5, 2013 from: NJDEP (2011). Ambient Air Monitoring Network Plan Retrieved March1, 2013 from: on February 28, NJDEP (2012). State Implementation Plan Revision for the Attainment and Maintenance of the Fine Particulate Matter (PM2.5) National Ambient Standards: Final Redesignation Request and Maintenance Plan for Annual 15 ug/m 3 and Daily 35 ug/m 3 PM2.5 National Ambient Standards. Retrieved February 28, 2013 from: NJDEP (2013a). Air Toxics In New Jersey. Retrieved April 1, 2013 from: NJDEP (2013b). Bureau of Mobile Sources. Retrieved April 1, 2013 from: NJDEP (2013c). Office of Science: Environmental Trends. Retrieved April 2, 2013 from: NJDEP (2013d). Air Toxics in New Jersey: How we estimate risk from air toxics. Retrieved April 4, 2013 from: NJDEP (2013e). Welcome to New Jersey s Air Monitoring Website: Publications: Annual Reports: 2011 Report. Retrieved April 4, 2013 from: NJDEP (2013f). Air Toxics in New Jersey: 2005 Risk Results for New Jersey. Retrieved, April 4, 2013 from: NJDEP (2013g). Air Toxics in New Jersey: 2005 Risk Results for New Jersey: County Risk Ratio Tables. Retrieved April 5, 2013 from: Page 33
34 NJDEP (2013h). Bureau of Mobile Sources: General Information: Maps of Estimated Diesel Particulate Risk (powerpoint presentation). Retrieved April 5, 2013 from: facts.htm NJDEP (2013i). The Next Generation of Environmental Management. Retrieved April 7, 2013 from: NJDEP (2013j). Camnet: Realtime Air Pollution and Visibility Monitoring. Retrieved April 8, 2013 from: NJDEP (2013k). A Preliminary Screening Method to Estimate Cumulative Environmental Impacts. Retrieved April 20, 2013 from: NJDEP (2013l). Clean Vehicles You can help reduce air pollution. Retrieved May 1, 2013 from: NJDEP (2013m). Supplemental Environmental Projects. Retrieved May 1, 2013 from: NJDHSS (2013). New Jersey Environmental Public Health Tracking. Retrieved May 2, 2013 from: NJTPA (2011). The Northern New Jersey Conformity Determination on the Amended Regional Transportation Plan and the FY Transportation Improvement Program, August 29, NJTPA (2013). Project Development Work Program. Retrieved April 5, 2013 from: Nowak, DJ, Crane, DE, and Stevens, JC (2006). Air pollution removal by urban trees and shrubs in the United States. Urban Forestry & Urban Greening, 4: OEHHA (2013). Office of Environmental Health Hazard Assessments: Air Toxicology and Epidemiology. Retrieved April 1, 2013 from: OTC (2013) Ozone Transport Commission. Retrieved March 25, 2013 at Perez, L., Lurmann, F., Wilson, J., Pastor, M., Brandt, S., Kunzli, N. and McConnell, R. (2012). Near- Roadway Pollution and Childhood Asthma: Implications for Developing Win Win Compact Urban Development and Clean Vehicle Strategies. Environmental Health Perspectives, 120: Pugh, TAM, MacKenzie, AR, Whyatt, JD and Hewitt, CN. (2012) Effectiveness of Green Infrastructure for Improvement of in Urban Street Canyons. Environmental Science and Technology, 46: SCI (2013). Sustainable Cities Institute: Benefits of Trees & the Urban Forest. Retrieved April 7, 2013 from: Page 34
35 est_trees Schauer, JJ (2003). Evaluation of elemental carbon as a marker for diesel particulate matter. Journal of Exposure Analysis and Environmental Epidemiology, 13: Sustainable Jersey (2013). Sustainable Jersey. Retrieved May 1, 2013 from: Sustainable Newark (2013). City of Newark Office of Sustainability. Retrieved May 1, 2013 from: TESC (2013). NJ Environmental Justice Alliance Model Cumulative Impact Ordinance. Retrieved April 5, 2013 from: Zartarian,VG, Schultz,BD, Barzyk,TM, Smuts,M, Hammond,DM, Medina- Vera,M, Geller,AM (2011). The EPA's Community- Focused Exposure and Risk Screening Tool (C- FERST) and Its Potential Use for Environmental Justice Efforts. American Journal of Public Health, 101 (S1): S286- S294. Page 35
36 Tables/Figures/Appendices Table 1: Air Monitoring Sites in the NJTPA Region Monitoring Sites in NJTPA Region County Ozone Monitors PM2.5 Monitors Air Toxics Monitors Bergen Leonia Fort Lee - - Essex Newark Newark - - Hudson Bayonne Jersey City & Union City - - Hunterdon Flemington Middlesex Rutgers Univ New Brunswick New Brunswick Monmouth Monmouth Univ Morris Chester Chester & Morristown Chester Ocean Colliers Mills Toms River - - Passaic Ramapo Paterson - - Somerset Sussex Elizabeth (2 sites) & Union - - Rahway Elizabeth Warren Columbia Columbia & Phillipsburg - - SOURCE: Ambient Air Monitoring Network Plan (NJDEP 2011) Page 36
37 Table 2: Health Effects from Inhalation of Air Pollutants Pollutant Acute Effects Chronic Noncancer Effects Ozone () Chest pain, cough, throat Lung damage irritation, congestion; aggravation of bronchitis, emphysema, asthma Fine Particulate Heart attack; Hospitalization and death (PM2.5) Asthma symptoms for cardiopulmonary diseases; lung damage Benzene 1,3- Butadiene Ethlybenzene Formaldehyde Diesel Particulate Matter (DPM) Irritation of skin, eyes & upper respiratory tract; drowsiness, dizziness, headaches Irritation of eyes, nose, throat and lungs Throat irritation and chest constriction Irritation of eyes, nose and throat. Irritation of eyes, nose, throat and lung; coughs, headaches, lightheadedness and nausea Information gathered from the following sources: Blood disorders; immune system damage Reproductive and developmental effects Developmental effects Respiratory Symptoms Lung inflammation Cancer Risk None None Known human carcinogen; causes leukemia Known human carcinogen Possible human carcinogen Probable human carcinogen; lung cancer Probable human carcinogen ATSDR (2013). Agency for Toxic Substances and Disease Registry: Toxic Substances Portal. Retrieved April 1, 2013 from: CARB (2013). California Air Resources Board: Consolidated Table of OEHHA / ARB Approved Risk Assessment Health Values. Retrieved April 1, 2013 from: EPA (2002). Health Assessment Document for Diesel Engine Exhaust. EPA/600/8-90/057F. Report issued by the National Center for Environmental Assessment, Washington DC, May EPA (2003a). Guide for Particle Pollution. Retrieved April 1, 2013 from: EPA (2008). Guide for Ozone. EPA- 456/F Report issued by Office of and Radiation, Washington DC, March EPA (2013b). Integrated Risk Information System (IRIS). Retrieved April 1, 2013 from: Page 37
38 EPA (2013f). Health Effects Notebook for Hazardous Air Pollutants. Retrieved April 1, 2013 from: OEHHA (2013). Office of Environmental Health Hazard Assessments: Air Toxicology and Epidemiology. Retrieved April 1, 2013 from: Page 38
39 Table 3: Trends in High Ozone Days High Ozone Days In Northern New Jersey Using the Index Unhealthy for Sensitive Groups Unhealthy Weighted Average County Bergen 22 INC 13 2 INC INC 4.3 Essex INC INC INC INC INC INC INC INC INC Hudson Hunterdon Middlesex Monmouth Morris Ocean Passaic Somerset DNC DNC DNC DNC DNC DNC DNC DNC DNC Sussex DNC DNC DNC DNC DNC DNC DNC DNC DNC Union DNC INC DNC DNC INC DNC DNC INC DNC Warren DNC DNC DNC DNC DNC DNC DNC DNC DNC INC: Incomplete monitoring data for the three year period DNC: Ozone data not collected in the county SOURCE: State of the Air 2006 (ALA 2006) for period State of the Air 2009 (ALA 2009) for period State of the Air 2012 (ALA 2012) for period Page 39
40 Table 4: Trends in High Particle Days High Particulate Days In Northern New Jersey Using the Index Unhealthy for Sensitive Groups Unhealthy Weighted Average County Bergen Essex Hudson Hunterdon DNC DNC DNC DNC DNC DNC DNC DNC DNC Middlesex Monmouth DNC DNC DNC DNC DNC DNC DNC DNC DNC Morris Ocean Passaic Somerset DNC DNC DNC DNC DNC DNC DNC DNC DNC Sussex DNC DNC DNC DNC DNC DNC DNC DNC DNC Union Warren DNC: Particulate data not collected in the county SOURCE: State of the Air 2006 (ALA 2006) for period State of the Air 2009 (ALA 2009) for period State of the Air 2012 (ALA 2012) for period Page 40
41 Table 5: Sample of Sources and Programs Addressed in SIPs Table 5a: Sample of Source Types Addressed by the Ozone and PM2.5 SIPs Adhesives and Sealants Architectural Coatings Asphalt Production and Paving Autobody Refinishing Consumer Products Diesel Vehicles Electrical Generation Gasoline Refueling Glass Manufacturing Industrial/Commercial/Institutional Boilers, Turbines and Engines Limits on Sulfur in Fuel Municipal Waste Combustion Petroleum Storage Tanks Portable Fuel Containers Refineries Sewage and Sludge Incineration Solvent Cleaning Table 5b: Sample of Programs Contained in the Ozone and PM2.5 SIPs that Address Mobile Sources Diesel Retrofit Programs Inspection and Maintenance Low Emission Vehicle Programs Smoke Regulations Vehicle Idling Limits SOURCE: Ozone State Implementation Plan (NJDEP 2007) PM2.5 State Implementation Plan (NJDEP 2012) Page 41
42 Table 6: Desired Long Term Outcomes and Associated Indicators DESIRED LONG TERM OUTCOMES: Measurable Outcomes Fewer days with poor air quality Fewer unhealthy days Fewer days unhealthy for sensitive groups Attainment of air quality standards Portion of region meeting the NAAQS for ozone Portion of region meeting the NAAQS for PM2.5 Reduced exposure in overburdened neighborhoods Exposure to mobile source emissions reduced, as measured by predicted cancer risk Indicator Index Attainment Status Cancer risk in census tracts Source NJDEP, ALA SIPS submitted by NJDEP and approved by EPA Scale at which Available Time Period for which Available Data Limitations County Annual reports Changes in NAAQS result in changes in definition of unhealthy days Control Regions Following schedules set by EPA Changes in NAAQS result in changes in definition of attainment Meeting health benchmarks for air toxics in the entire region Decreased risk from mobile source emissions in each of the 13 Counties Cancer risk for 5 mobile source air toxics : benzene, 1,3 butadiene, ethylbenzene, formaldehyde and diesel particulate matter Lower emissions from onroad mobile sources Direct emissions of PM2.5, ozone and Air Toxics Emissions of VOCs, NOx, SO 2 and Ammonia Reduction in tons/year of onroad mobile sources NATA NATA NJDEP, EPA County and Census Tract County averages Statewide and County Every 3 years Every 3 years Every 3 years Changes in modeling and inventory methods Changes in modeling and inventory methods Changes in inventory methods Page 42

43 Figure 1: Trends in High Ozone Days: Weighted Average Based on the AQI Page 43
44 Figure 2: Trends in High Particle Days: Weighted Average Based on the AQI Page 44


 2002")
 2002 SO 2 Emissions")
45 Figure 3 a- g: New Jersey Emission Inventory Summaries by Source Category Fig 3a) 2002 PM2.5 Emissions - 30,381 Tons/Year Fig 3b) 2002 VOC Emissions 470,689 Tons/Year Fig 3c) 2002 NOx Emissions 352,968 Tons/Year Fig 3d) 2002 SO 2 Emissions 94,672 Tons/Year Page 45


46 Fig 3e) 2002 Ammonia Emissions 25,514 Tons/Year Fig 3f) 2005 Air Toxic Emissions 67,370 Tons/Year Page 46


47 Figure 4 a- b: Estimated Diesel Particulate Risk in New Jersey from Mobile Sources Fig 4a: Onroad Mobile Sources Fig 4b: Nonroad Mobile Sources Page 47
48 Appendix A: Environmental Trends Report: Ozone Page 48
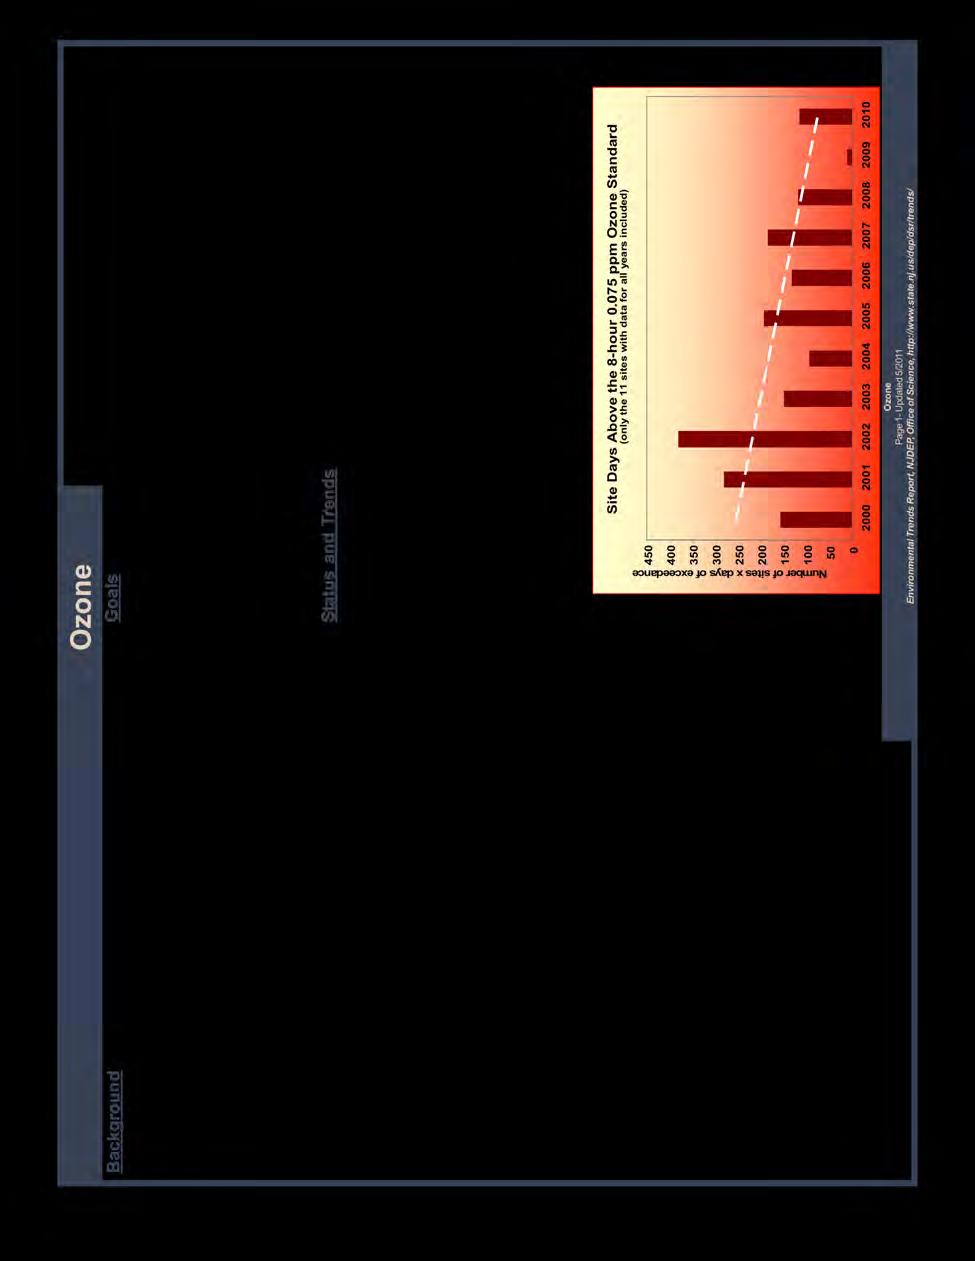
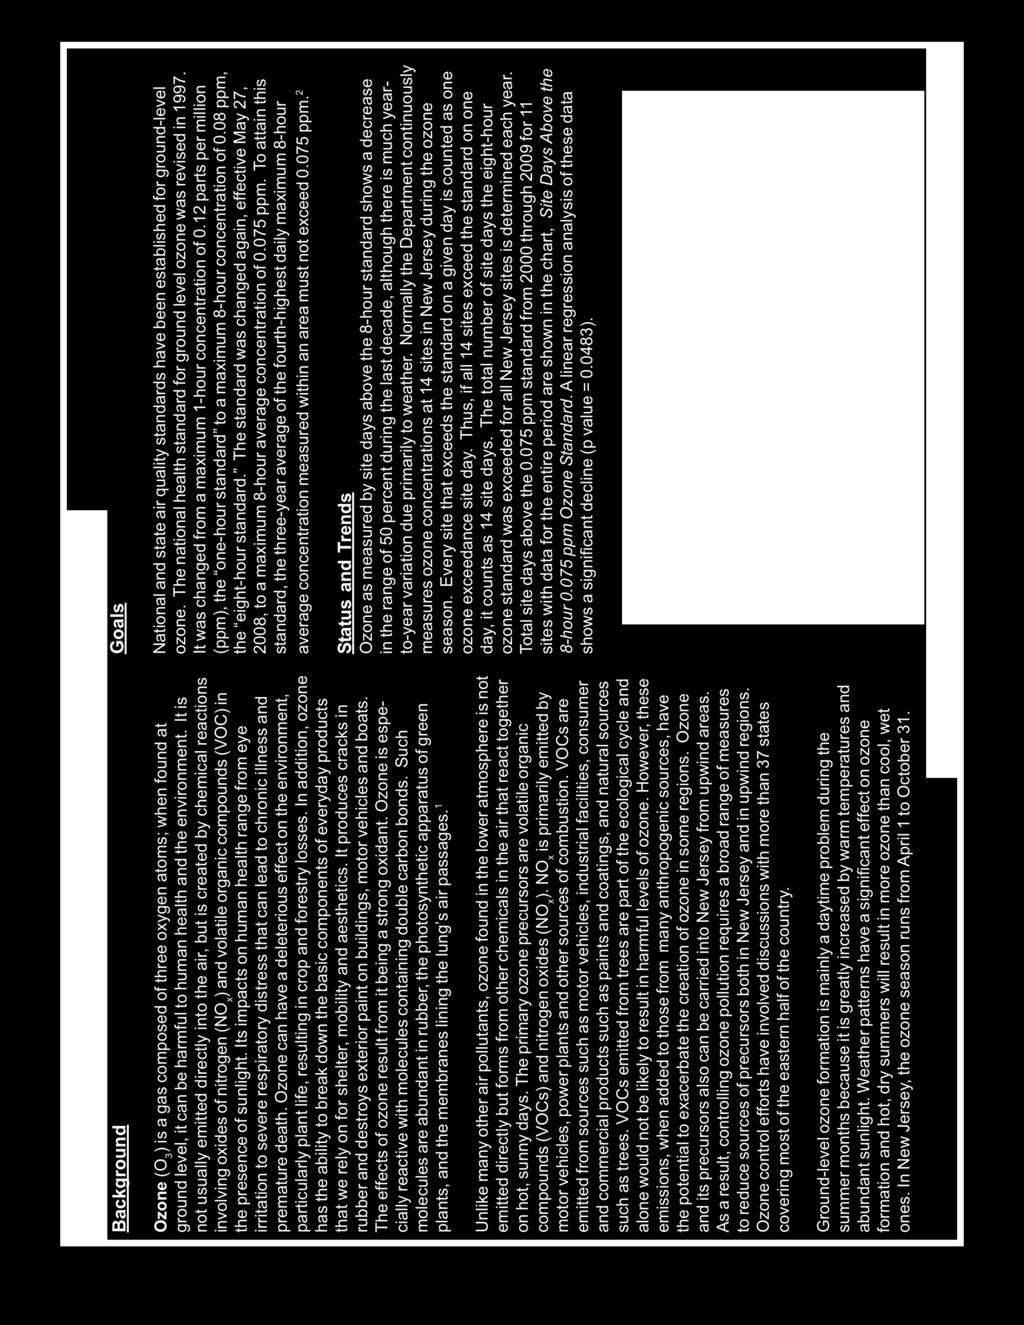
49 Page 49

50 Page 50
51 Appendix B: Environmental Trends Report: PM2.5 Page 51

52 Page 52
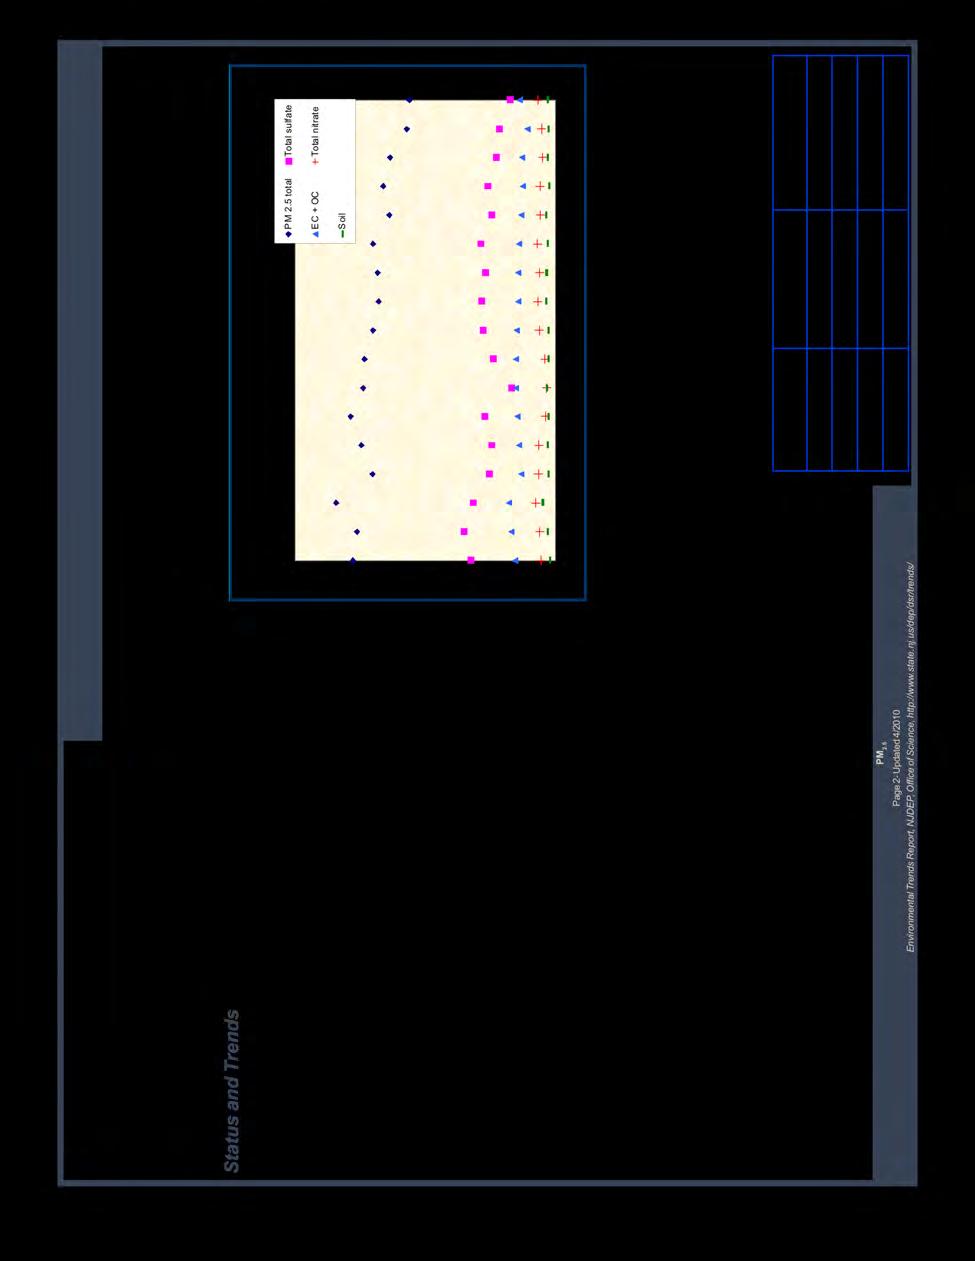
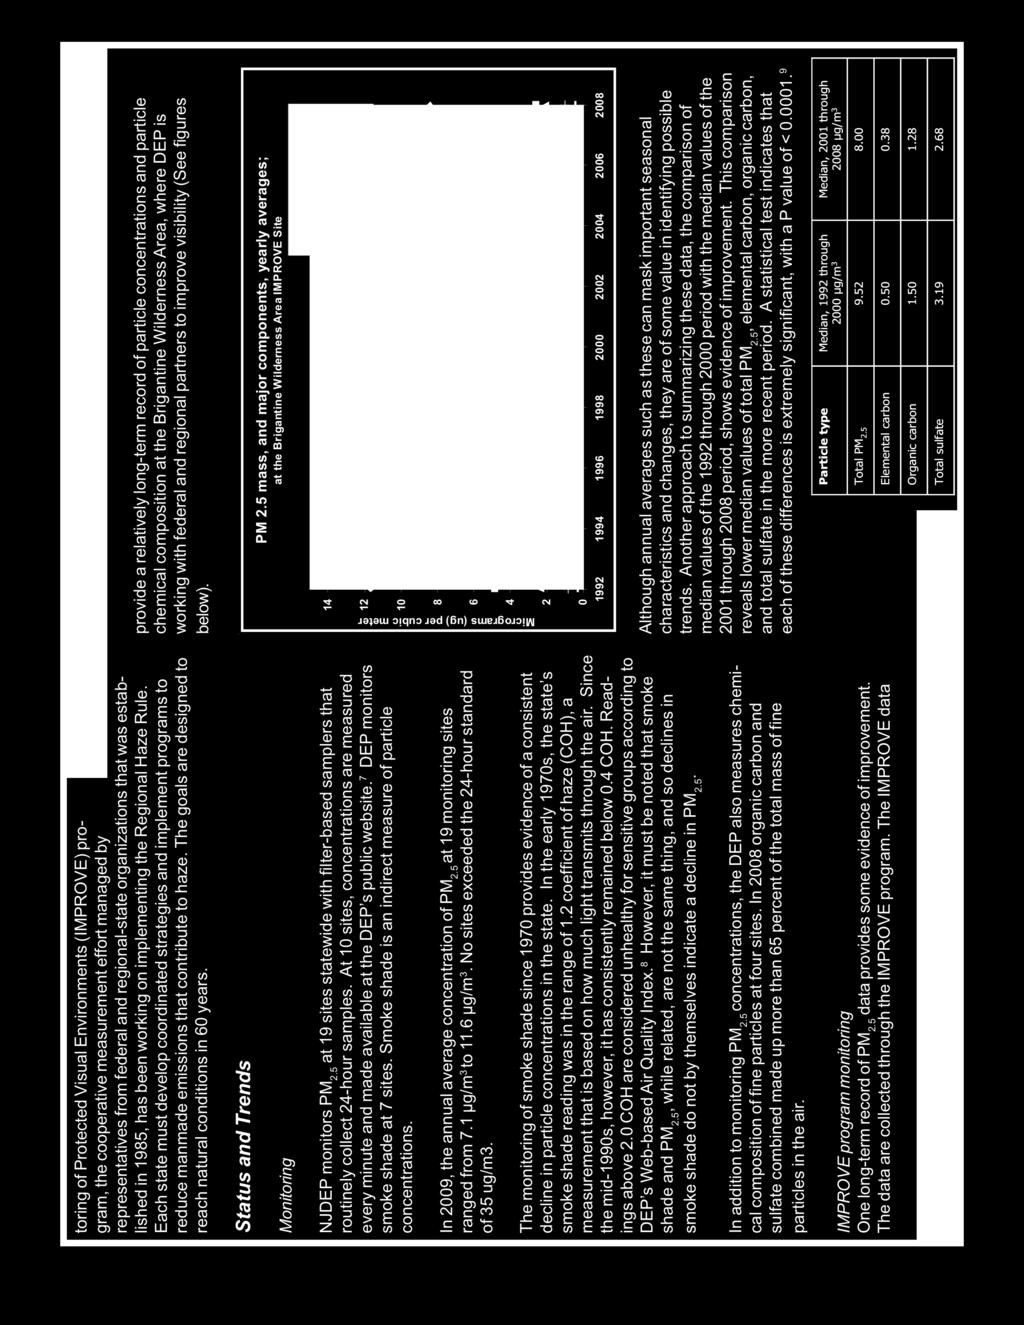
53 Page 53

54 Page 54
55 Appendix C: Environmental Trends Report: Air Toxics Page 55
56 Page 56
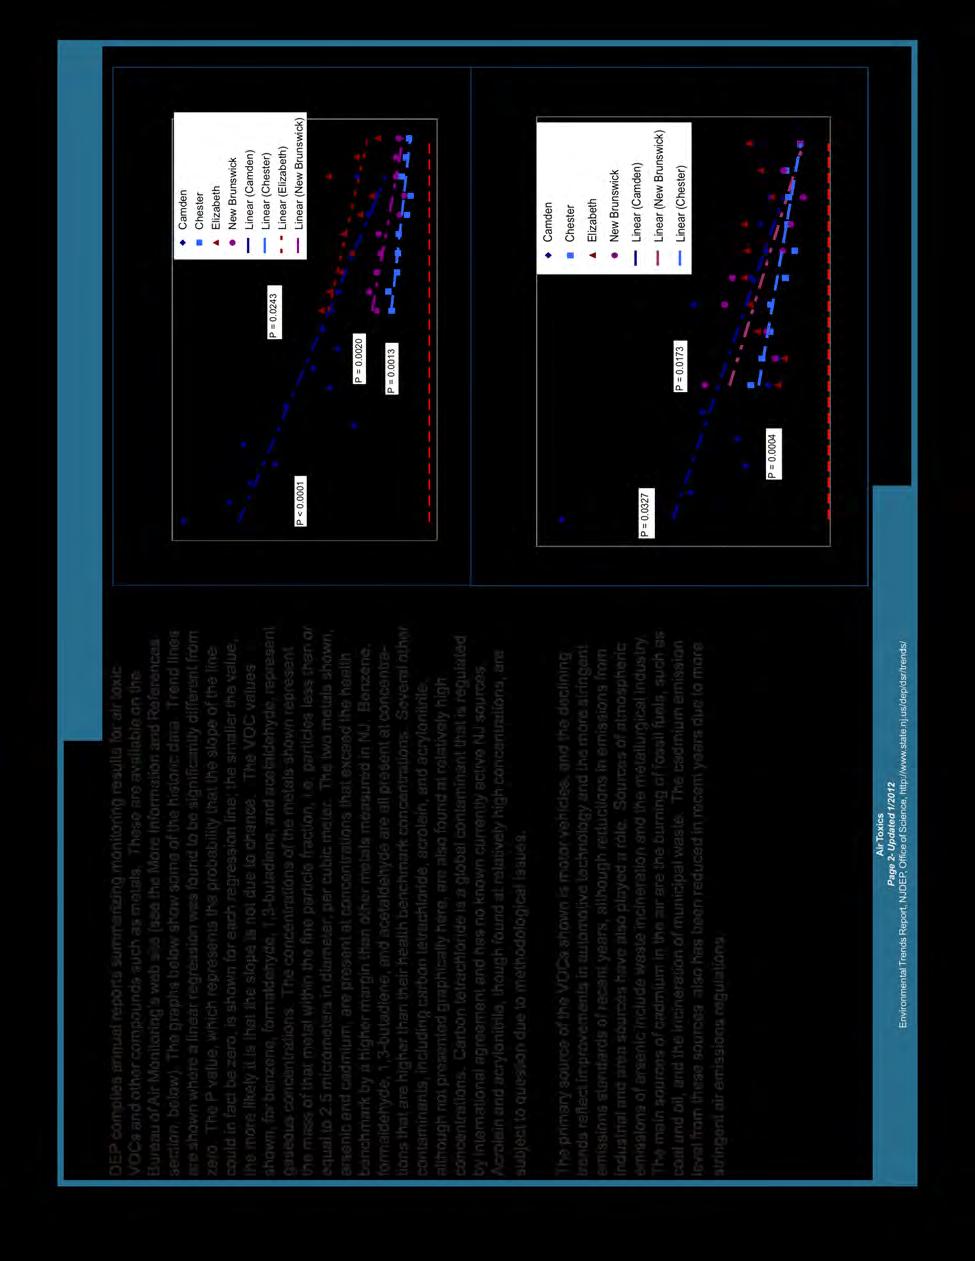
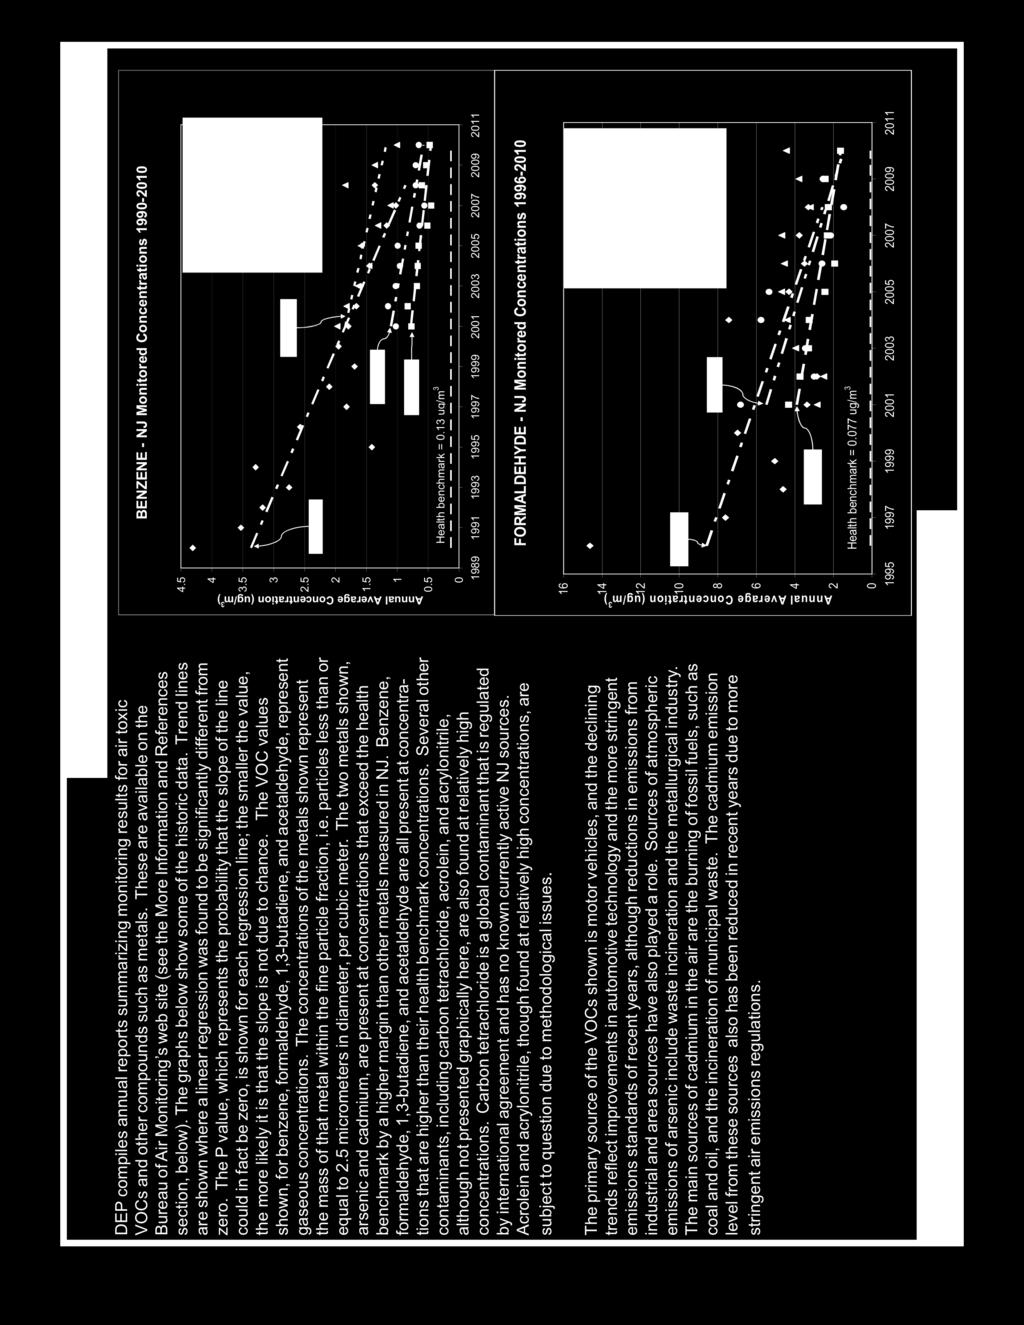
57 Page 57
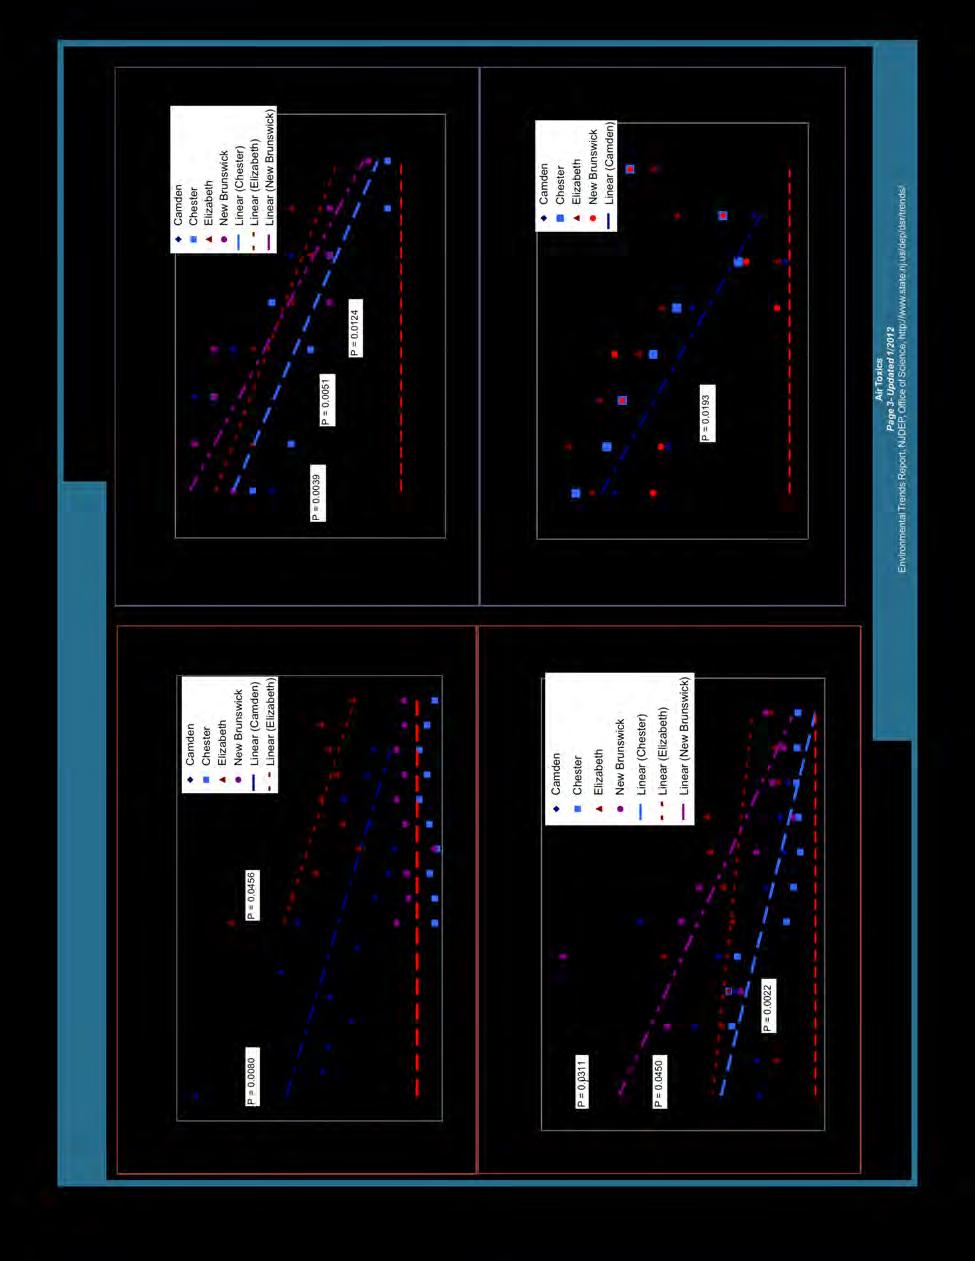
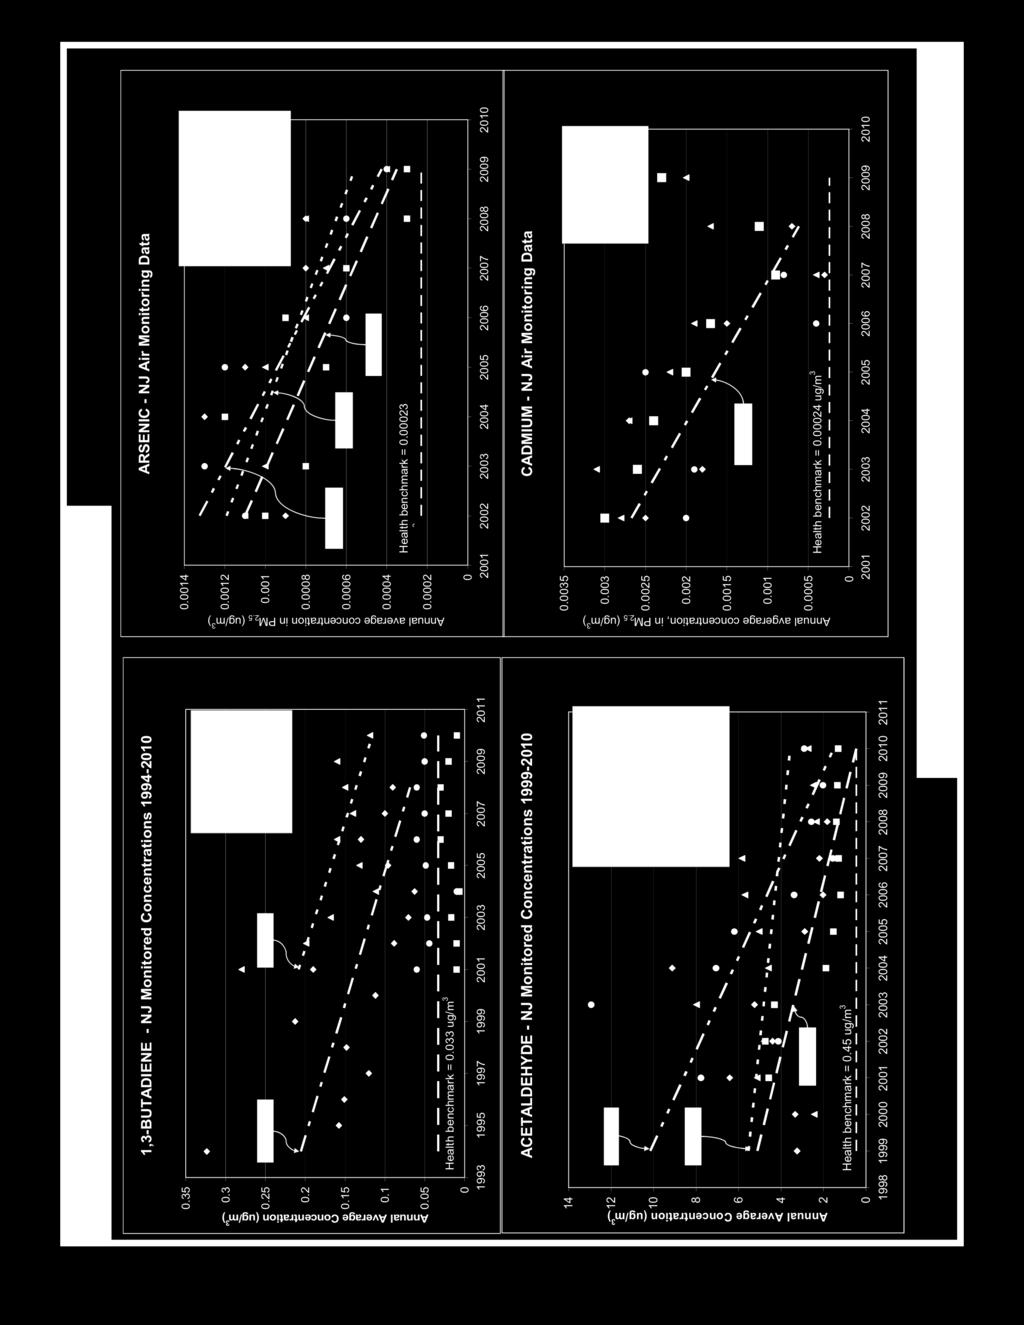
58 Page 58
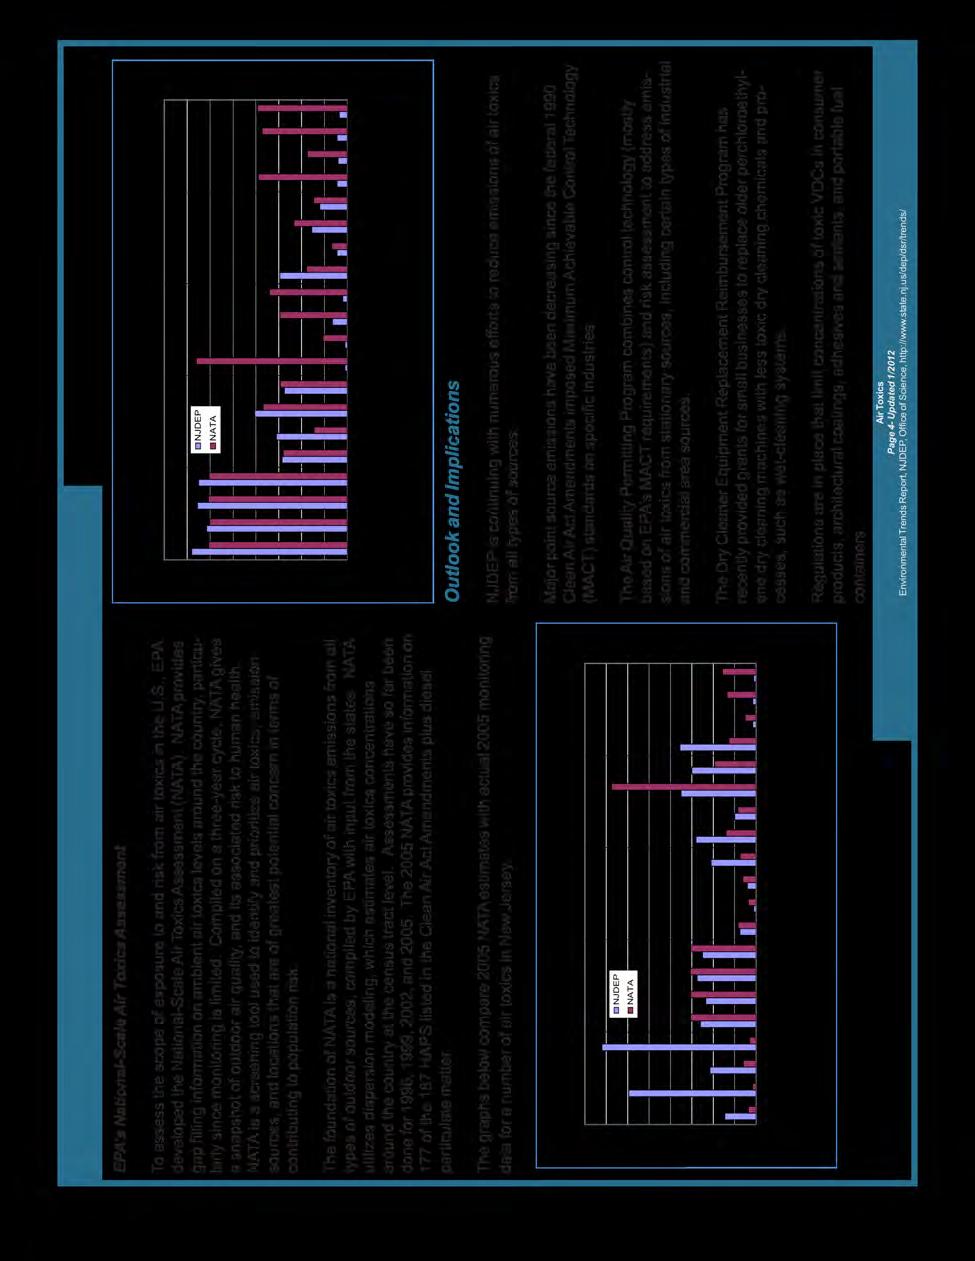

59 Page 59
60 Page 60
 Page")
61 Appendix D: NATA 2005 Cumulative Risk Maps from Google Earth (EPA 2013d) NATA 2005 Cumulative Risk Map: Bergen County (Google Earth 4/7/2013) Page 61
 Page")
62 NATA 2005 Cumulative Risk Map: Essex County (Google Earth 4/7/2013) Page 62
 Page")
63 NATA 2005 Cumulative Risk Map: Hudson County (Google Earth 4/7/2013) Page 63
 Page 64")
64 NATA 2005 Cumulative Risk Map: Passaic County (Google Earth 4/7/2013) Page 64
 Page")
65 NATA 2005 Cumulative Risk Map: Union County (Google Earth 4/7/2013) Page 65
66 Appendix E: NJ Clean Freight: Moving Freight With the Speed of Green Page 66
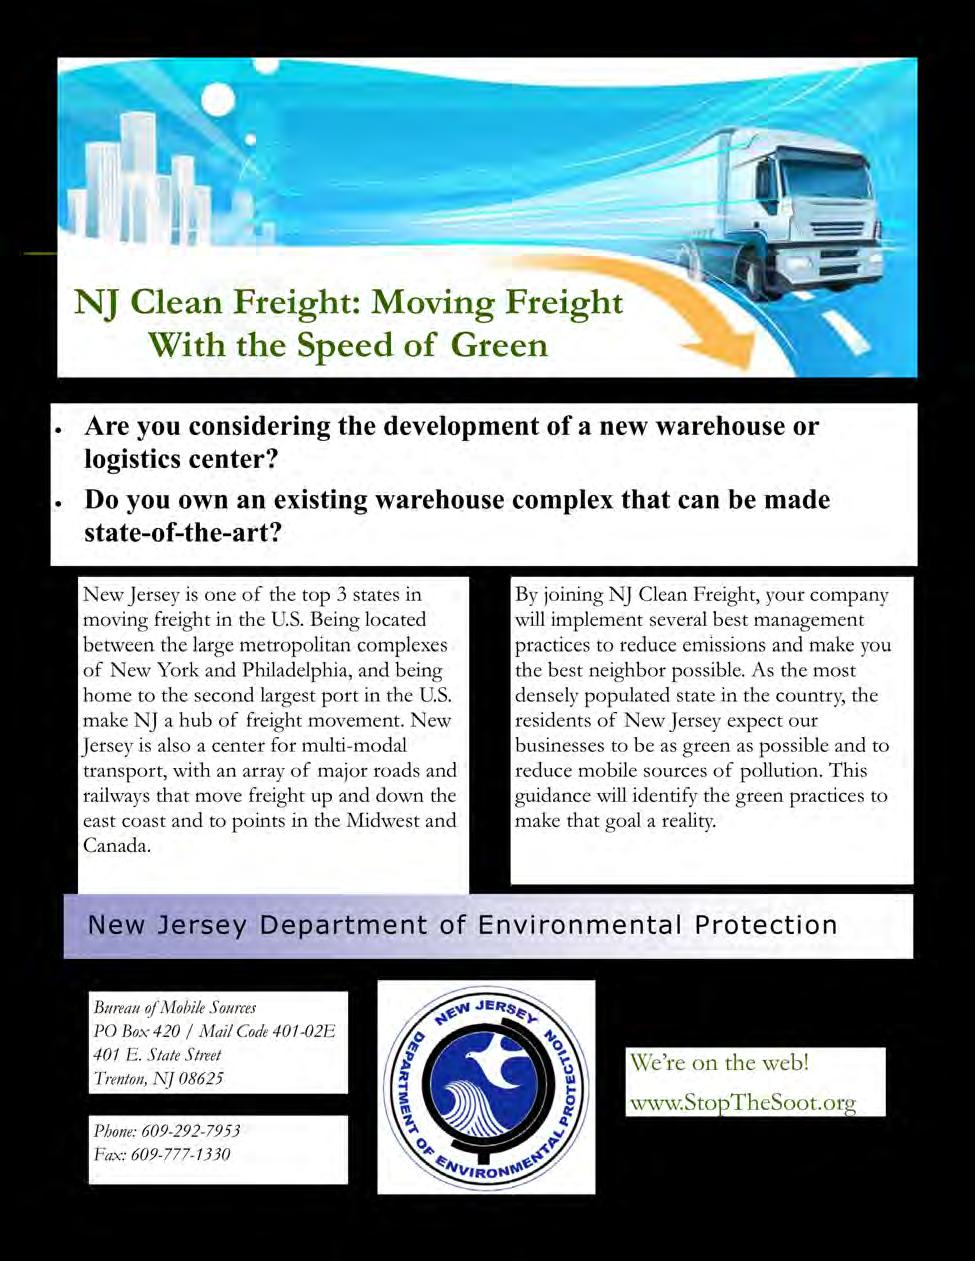
67 Page 67
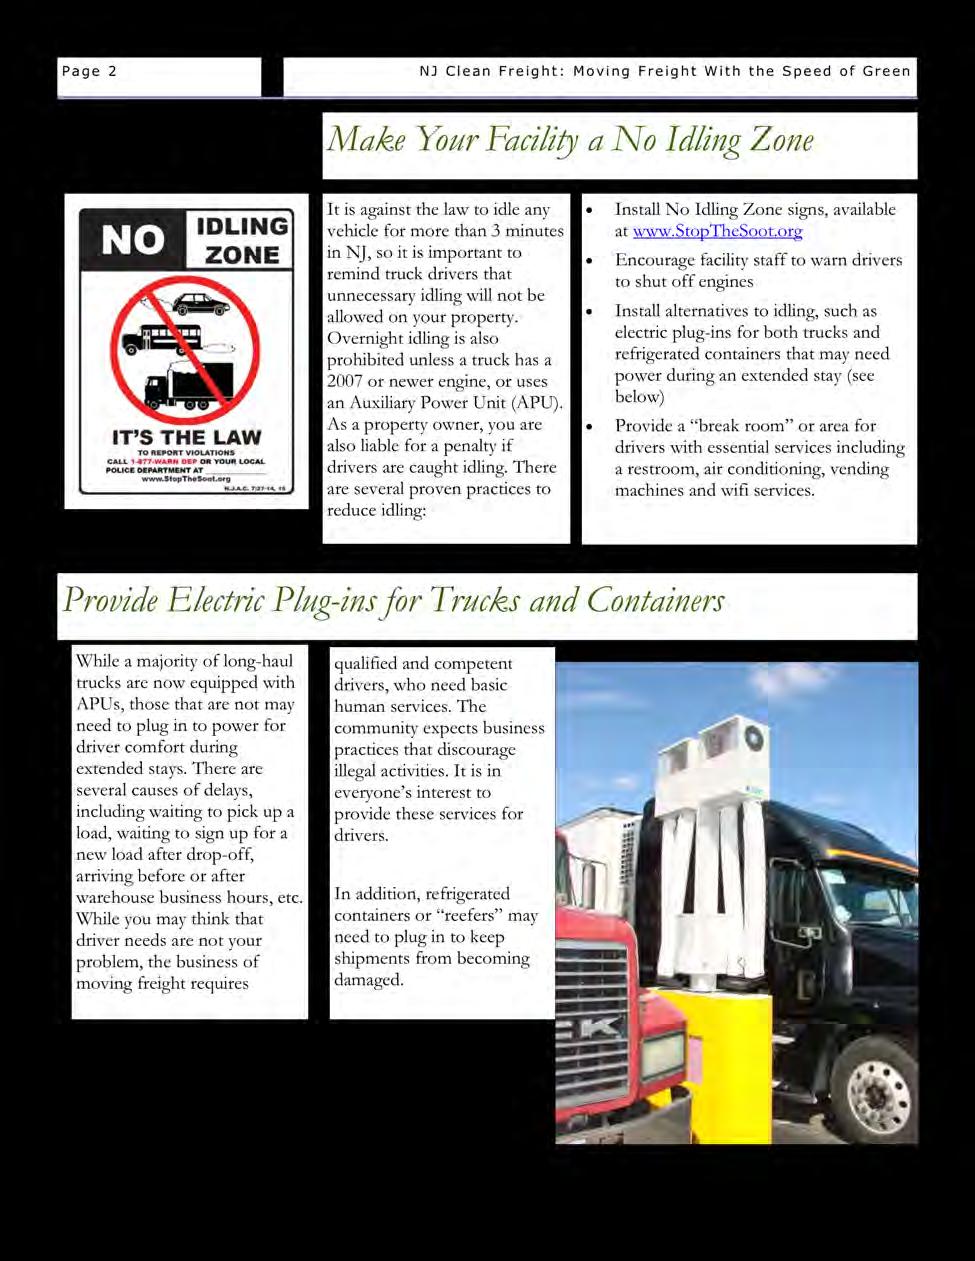

68 Page 68

69 Page 69
70 Page 70
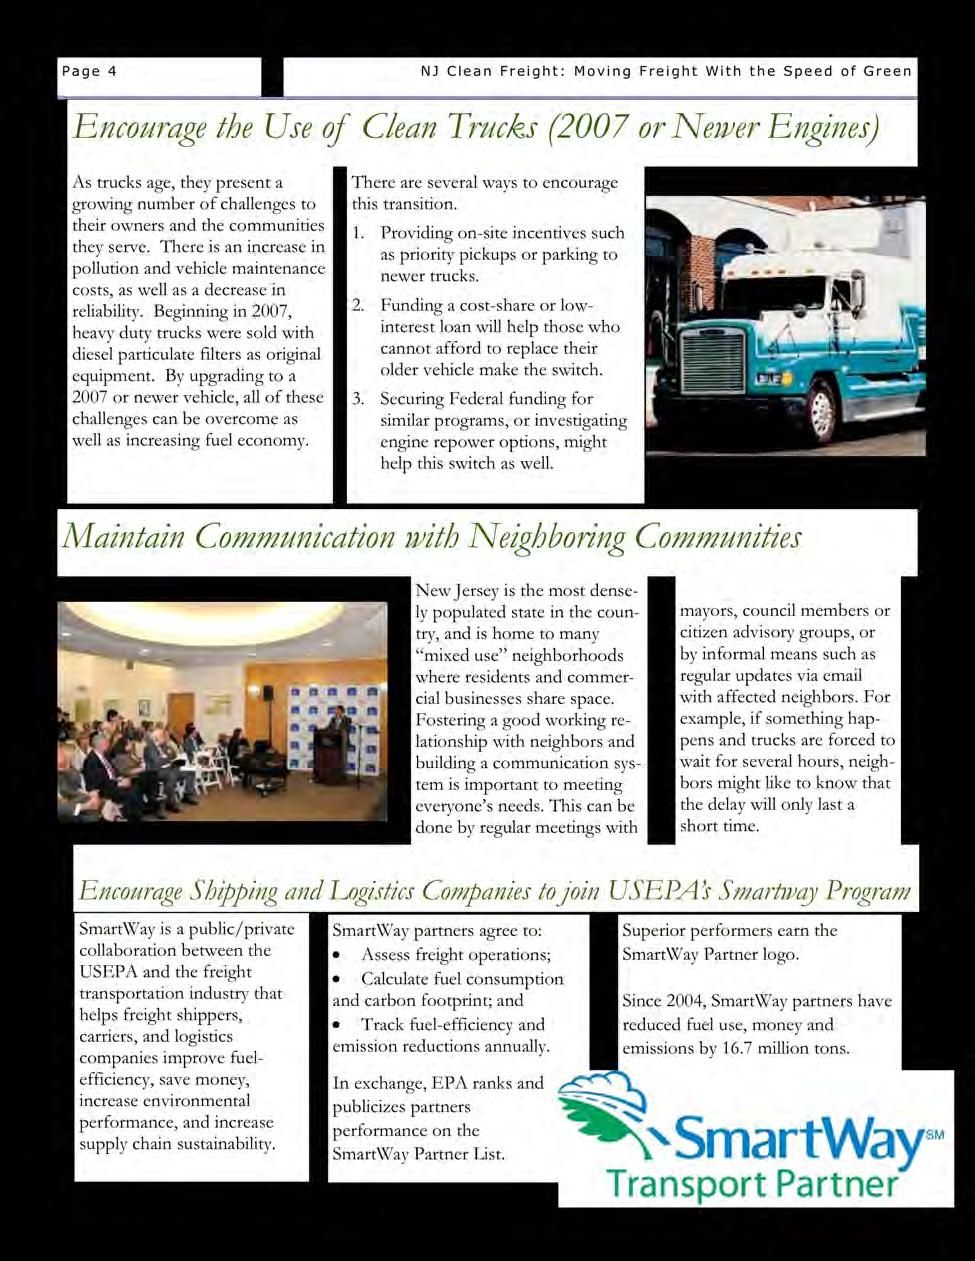
71 Page 71
2011 Particulate Summary
 2011 Particulate Summary New Jersey Department of Environmental Protection NATURE AND SOURCES Particulate air pollution is a complex mixture of organic and inorganic substances present in the atmosphere
2017 Ozone Summary SOURCES. New Jersey Department of Environmental Protection
 2017 Ozone Summary New Jersey Department of Environmental Protection SOURCES Ozone (O3) is a gas consisting of three oxygen atoms. It occurs naturally in the upper atmosphere (stratospheric ozone) where
2010 Ozone Summary NATURE AND SOURCES ENVIRONMENTAL EFFECTS. Figure 2. New Jersey Department of Environmental Protection.
 2010 Ozone Summary New Jersey Department of Environmental Protection NATURE AND SOURCES Ozone (O 3 ) is a gas consisting of three oxygen atoms. It occurs naturally in the upper atmosphere (stratospheric
Fine Particles in the Air
 Fine Particles in the Air Presentation for STAPPA Outreach Committee Rich Damberg, EPA Office of Air Quality Planning and Standards April 6, 2004 Particulate Matter: What is It? A complex mixture of extremely
Oregon. 800 NE Oregon St. #640 Portland, OR (971)
") Air Quality Frequently Asked Questions Oregon Environmental Public Health Tracking (EPHT) Oregon ENVIRONMENTAL PUBLIC HEALTH TRACKING 800 NE Oregon St. #640 Portland, OR 97232 www.oregon.gov/dhs/ph/epht
Air Quality Frequently Asked Questions Oregon Environmental Public Health Tracking (EPHT) Oregon ENVIRONMENTAL PUBLIC HEALTH TRACKING 800 NE Oregon St. #640 Portland, OR 97232 www.oregon.gov/dhs/ph/epht
2005 Ozone Summary. Since ground-level ozone needs sunlight to form, it is mainly a Ozone is bad down here Cars, trucks,
 2005 Ozone Summary New Jersey Department of Environmental Protection NATURE AND SOURCES Ozone (O 3 ) is a gas consisting of three oxygen atoms. It occurs naturally in the upper atmosphere (stratospheric
2015 Air Quality Index Summary
 2015 Air Quality Index Summary New Jersey Department of Environmental Protection WHAT IS THE AIR QUALITY INDEX (AQI)? The Air Quality Index (AQI) is a nationwide air quality rating system based on the
OUR NATION'S AIR STATUS AND TRENDS THROUGH 2015 WELCOME!
 Page 1 of 14 OUR NATION'S AIR STATUS AND TRENDS THROUGH 2015 WELCOME! The U.S. Environmental Protection Agency (EPA) is committed to protecting public health by improving air quality and reducing air pollution.
CHAPTER 2 - Air Quality Trends and Comparisons
 CHAPTER 2 - Air Quality Trends and Comparisons Particulate Sampling Total Suspended Particulate Matter With the monitoring for PM 2.5 particulate matter being labor intensive, DEP reduced the number of
2011 Ozone Summary NATURE AND SOURCES ENVIRONMENTAL EFFECTS. New Jersey Department of Environmental Protection
 2011 Ozone Summary New Jersey Department of Environmental Protection NATURE AND SOURCES Figure 1 Good and Bad Ozone Ozone (O3) is a gas consisting of three oxygen atoms. It occurs naturally in the upper
2014 Ozone Summary. Figure 1: Good and Bad Ozone. POLLUTION THAT FORMS GROUND-LEVEL OZONE, A PRIMARY COMPONENT OF SMOG.
 2014 Ozone Summary New Jersey Department of Environmental Protection NATURE AND SOURCES Ozone (O 3 ) is a gas consisting of three oxygen atoms. It occurs naturally in the upper atmosphere (stratospheric
2012 Nitrogen Dioxide Summary
 2012 Nitrogen Dioxide Summary New Jersey Department of Environmental Protection NATURE AND SOURCES Nitrogen Dioxide (NO 2 ) is a reddishbrown, highly reactive gas that is formed in the air through the
2009 Regional Haze & Visibility Summary
 2009 Regional Haze & Visibility Summary New Jersey Department of Environmental Protection THE BASICS OF HAZE Haze is caused when sunlight encounters tiny pollution particles in the air. Some light is absorbed
Criteria Pollutants. Sulfur Dioxide (SO 2 ) Nitrogen Oxides (NOx)
 Nitrogen Oxides (NOx)") 1) Sulfur dioxide 2) Nitrogen oxides 3) Carbon monoxide 4) Ozone 5) Particulates 6) Lead Criteria Pollutants Sulfur Dioxide (SO 2 ) SO 2 is a colorless gas that is formed from the combustion of sulfur-containing
1) Sulfur dioxide 2) Nitrogen oxides 3) Carbon monoxide 4) Ozone 5) Particulates 6) Lead Criteria Pollutants Sulfur Dioxide (SO 2 ) SO 2 is a colorless gas that is formed from the combustion of sulfur-containing
Estimated Impacts From Idling Locomotives in the Borough of Raritan, N.J. February 2008
 Jon S. Corzine Governor Department of Environmental Protection Environmental Regulation Diesel Risk Reduction Program Post Office Box 418 Trenton, New Jersey 08625-0418 Tel: (609) 292-7953, Fax: (609)
2010 Regional Haze & Visibility Summary
 2010 Regional Haze & Visibility Summary New Jersey Department of Environmental Protection THE BASICS OF HAZE Haze is a type of visibility impairment usually associated with air pollution, and to a lesser
Final Revisions to the Primary National Ambient Air Quality Standard for Nitrogen Dioxide (NO 2 )
") Final Revisions to the Primary National Ambient Air Quality Standard for Nitrogen Dioxide (NO 2 ) General Overview Office of Air and Radiation Office of Air Quality Planning and Standards January 2010
Final Revisions to the Primary National Ambient Air Quality Standard for Nitrogen Dioxide (NO 2 ) General Overview Office of Air and Radiation Office of Air Quality Planning and Standards January 2010
2012 Sulfur Dioxide Summary
 2012 Sulfur Dioxide Summary New Jersey Department of Environmental Protection NATURE AND SOURCES Sulfur dioxide (SO 2 ) is a heavy, colorless gas with a suffocating odor that easily dissolves in water
Clean Air Act 101 Air Toxics
 Clean Air Act 101 Air Toxics 2011 Environmental Justice Conference Detroit, Michigan Donnette Sturdivant U.S. EPA Region 4 August 23, 2011 10/3/2011 U.S. Environmental Protection Agency 1 Acid Rain Program
2016 Particulate Matter Summary
 216 Particulate Matter Summary New Jersey Department of Environmental Protection SOURCES Particulate air pollution is a complex mixture of organic and inorganic substances in the atmosphere, present as
Frumkin, 2e Part Three: Environmental Health on the Regional Scale. Chapter 12: Air Pollution
 Frumkin, 2e Part Three: Environmental Health on the Regional Scale Chapter 12: Air Pollution History of Air Pollution Since human beings discovered fire, they began to pollute the air. At first, air pollution
2016 Nitrogen Dioxide Summary
 2016 Nitrogen Dioxide Summary New Jersey Department of Environmental Protection SOURCES Nitrogen dioxide (NO2) is a reddish-brown highly reactive gas that is formed in the air through the oxidation of
Transportation Impacts on Air Quality
 TRANSPORTATION & AIR QUALITY WORKSHOP February 26 27, 2013 Annapolis, MD Transportation Impacts on Air Quality Chris Salmi February 26, 2013 Content The Challenge Mobile Sources Are Significant Emitters
Air Pollution Sources Overview. Amy Roberts, Division Manager January 24, 2019
 Air Pollution Sources Overview Amy Roberts, Division Manager January 24, 2019 Types of Air Pollutants Criteria Pollutants Particulate Matter Nitrogen Dioxide Ozone Carbon Monoxide Lead Sulfur Dioxide Air
A. INTRODUCTION B. POLLUTANTS FOR ANALYSIS
 Chapter 2, Section F: Air Quality A. INTRODUCTION This section examines the potential for air quality impacts due to the proposed operational and geometric changes in traffic conditions along Fulton Street
CHAPTER 11. Air Quality and the Transportation Plan
 Chapter 11. Air Quality and the Transportation Plan 159 CHAPTER 11. Air Quality and the Transportation Plan Background Air quality in Anchorage is subject to national ambient air quality standards established
Implementation of the National Ambient Air Quality Standards (NAAQS): Opportunities for Public Participation
: Opportunities for Public Participation") Implementation of the National Ambient Air Quality Standards (NAAQS): Opportunities for Public Participation EPA Environmental Justice Training Research Triangle Park, NC March 18, 2014 Rich Damberg U.S.
Implementation of the National Ambient Air Quality Standards (NAAQS): Opportunities for Public Participation EPA Environmental Justice Training Research Triangle Park, NC March 18, 2014 Rich Damberg U.S.
National Ambient Air Quality Standards, Implementation Plans and Public Participation. Laura McKelvey U.S. EPA
 National Ambient Air Quality Standards, Implementation Plans and Public Participation Laura McKelvey U.S. EPA mckelvey.laura @epa.gov Topics What are the NAAQS? Why are they important? What is the air
I. Overview. II. Background. Light-Duty Motor Vehicle Emissions Standards
 Summary of NESCAUM Analysis Evaluating the NOx, HC, and CO Emission Reduction Potential from Adoption of the California Low Emission Vehicle (LEV II) Standards June, 2005 I. Overview This summary provides
2016 Sulfur Dioxide Summary
 2016 Sulfur Dioxide Summary New Jersey Department of Environmental Protection SOURCES Figure 7-1 2017 New Jersey SO 2 Projected Emissions Sulfur dioxide (SO2) is a heavy, colorless gas with a suffocating
Dallas-Fort Worth Air Quality Training Manual
 Dallas-Fort Worth Air Quality Training Manual An air quality manual designed for those who operate, maintain, and manage local government fleet vehicles in the Dallas-Fort Worth nine-county ozone nonattainment
Air Pollution Poses Severe Health and Environmental Risks
 Testimony of the State and Territorial Air Pollution Program Administrators and the Association of Local Air Pollution Control Officials before the Senate Appropriations Subcommittee on VA, HUD, and Independent
ATTACHMENT-1 BACKGROUND:
 ATTACHMENT-1 A Comparison of s current N.J.A.C. 7:27-18 (Emission Offset Rule) with the 40 CFR 51.165, 52.24 and Appendix S to 40 CFR 51 (NSR reform rules) demonstrating that the existing Emission Offset
EPA s Draft Report on the Environment 2003 Technical Document
 EPA s Draft Report on the Environment 23 Technical Document 1.1 Outdoor Air Quality Among the pollutants affecting outdoor air quality are: Criteria pollutants ozone (O 3 ), particulate matter (PM), sulfur
2010 Sulfur Dioxide Summary
 2010 Sulfur Dioxide Summary New Jersey Department of Environmental Protection NATURE AND SOURCES Sulfur dioxide (SO 2 ) is a heavy, colorless gas with a suffocating odor that easily dissolves in water
2013 Network Summary
 R 2013 Network Summary New Jersey Department of Environmental Protection NETWORK DESCRIPTION In 2013, the New Jersey Department of Environmental Protection (NJDEP) operated 39 ambient air monitoring stations.
Air Quality & Health. Our Atmosphere. ENVIR 202: Lesson No. 14. Lesson 14: Air Quality February 6, ENVIR 202: Population & Health 1
 ENVIR 202: Lesson No. 14 Air Quality & Health February 6, 2006 Chuck Treser University of Washington Program on the Environment ENVIR 202: Lesson 14 1 Our Atmosphere Spaceship Earth Protects Us Loss of
2012 Carbon Monoxide Summary
 2012 Carbon Monoxide Summary New Jersey Department of Environmental Protection NATURE AND SOURCES Carbon monoxide (CO) is a colorless, odorless, poisonous gas formed when carbon in fuels is not burned
Vista Canyon Transit Center - Air Quality Technical Memorandum
 803 Camarillo Springs Road, Suite C Camarillo, California 93012 (805) 437-1900 FAX (805) 437 1901 www.impactsciences.com MEMORANDUM To: Kris Markarian, City of Santa Clarita Job No. 1046.003 From: Susan
6.1 INTRODUCTION 6.2 REGULATORY FRAMEWORK NATIONAL AMBIENT AIR QUALITY STANDARDS COMPLIANCE STATUS TRANSPORTATION CONFORMITY
 Chapter 6 Air Quality 6.1 INTRODUCTION This chapter presents a project-level analysis of the potential for air quality impacts that could result from mobile and stationary sources of air emissions generated
Final Updates to National Ambient Air Quality Standards (NAAQS) for Ozone. October 2015
 for Ozone. October 2015") Final Updates to National Ambient Air Quality Standards (NAAQS) for Ozone October 2015 What we ll cover 2015 Final 8-hour Ozone Standards Primary: 70 ppb Secondary: 70 ppb Areas will meet the standards
Final Updates to National Ambient Air Quality Standards (NAAQS) for Ozone October 2015 What we ll cover 2015 Final 8-hour Ozone Standards Primary: 70 ppb Secondary: 70 ppb Areas will meet the standards
GE 2211 Environmental Science and Engineering Unit III Air Pollution. M. Subramanian
 GE 2211 Environmental Science and Engineering Unit III Air Pollution M. Subramanian Assistant Professor Department of Chemical Engineering Sri Sivasubramaniya Nadar College of Engineering Kalavakkam 603
APPENDIX E EMISSIONS ESTIMATE FOR GENERAL CONFORMITY
 APPENDIX E EMISSIONS ESTIMATE FOR GENERAL CONFORMITY Environmental and Planning Consultants 440 Park Avenue South, 7th Floor New York, New York 10016 tel: 212-696-0670 fax: 212-213-3191 www.akrf.com Memorandum
Appendix C: GHG Emissions Model
 Appendix C: GHG Emissions Model 1 METHOD OVERVIEW The Maryland Statewide Transportation Model (MSTM) Emissions Model (EM) is a CUBE-based model that uses emission rates calculated by the MOVES2010 EPA
Lecture 4 Air Pollution: Particulates METR113/ENVS113 SPRING 2011 MARCH 15, 2011
 Lecture 4 Air Pollution: Particulates METR113/ENVS113 SPRING 2011 MARCH 15, 2011 Reading (Books on Course Reserve) Jacobson, Chapter 5, Chapter 8.1.9 Turco, Chapter 6.5, Chapter 9.4 Web links in following
2006 Sulfur Dioxide Summary
 2006 Sulfur Dioxide Summary New Jersey Department of Environmental Protection NATURE AND SOURCES Sulfur dioxide (SO 2 ) is a heavy, colorless gas with a suffocating odor that easily dissolves in water
Air pollution is caused by high concentrations of gases and particles emitted form combustion sources (vehicles, power plants, industries)
") AIR POLLUTION Clean Air Act & Criteria Pollutants 7.1-7.5 Motor Vehicle Emissions: 7.8 Indoor Air and Box Models: 7.12 Air Pollution Meteorology: 7.10 Gaussian Plume Modeling: 7.11 1 Air pollution is caused
AIR POLLUTION Clean Air Act & Criteria Pollutants 7.1-7.5 Motor Vehicle Emissions: 7.8 Indoor Air and Box Models: 7.12 Air Pollution Meteorology: 7.10 Gaussian Plume Modeling: 7.11 1 Air pollution is caused
Clean Air Act of 1970
 Clean Air Act of 1970 Set National Ambient Air Quality Standards (NAAQS), to protect public health and welfare Set New Source Performance Standards (NSPS), that strictly regulated emissions of a new source
Revisions to National Ambient Air Quality Standards for Particle Pollution. Webinar for States and Local Agencies December 19, 2012
 Revisions to National Ambient Air Quality Standards for Particle Pollution Webinar for States and Local Agencies December 19, 2012 1 Background on National Ambient Air Quality Standards The Clean Air Act
MPCA Citizens Board. Michael Sandusky Director Environment Analysis and Outcomes Division
 DEPARTMENT : POLLUTION CONTROL AGENCY DATE : September 17, 2010 SF-00006-05(4/86) STATE OF MINNESOTA Office Memorandum TO : FROM : MPCA Citizens Board Michael Sandusky Director Environment Analysis and
ECONOMIC IMPACTS ASSOCIATED WITH AIR QUALITY
 ECONOMIC IMPACTS ASSOCIATED WITH AIR QUALITY Regions As The Building Blocks of The Global Economy May 28, 2008 Chris Klaus Senior Program Manager North Central Texas Council of Governments ECONOMIC IMPACTS
Air Pollution in NJ: Past,Present and thoughts about the Future
 Air Pollution in NJ: Past,Present and thoughts about the Future By Paul J. Lioy Environmental and Occupational Health Sciences Institute Sponsored by UMDNJ Robert Wood Johnson Medical School And Rutgers
Americans make the equivalent of round
 AIR POLLUTION CE 326 Principles of Environmental Engineering Prof. Tim Ellis January 18, 2008 Air Pollution Factoids Americans make the equivalent of round trips to the moon each year in their automobiles.
Traffic Data Collection Programs for PM 2.5 Non-Attainment Areas
 Traffic Data Collection Programs for PM 2.5 Non-Attainment Areas Jack Stickel Alaska Department of Transportation and Public Facilities NATMEC 23 June, 2010 Traffic Data to Address Air Quality and Climate
4.2 Air Quality and Greenhouse Gas
 4.2 Air Quality and Greenhouse Gas Federal agencies are required under the Clean Air Act (CAA) to ensure that projects they fund (such as the Center City Connector) are in compliance with existing federal
Implementation Issues for the PM 2.5 National Ambient Air Quality Standards PM 2.5 NAAQS
 Implementation Issues for the PM 2.5 National Ambient Air Quality Standards Update for MARAMA CEMS Webinar October 6, 2011 Rich Damberg US EPA Office of Air Quality Planning and Standards 1 PM 2.5 NAAQS
Highlights from the 2012 FHWA EPA Northern Transportation and Air Quality Summit
 em summit highlights Highlights from the 2012 FHWA EPA Northern Transportation and Air Quality Summit by Kevin Black, Martin Kotsch, Michael Roberts, Greg Becoat, Melanie Zeman, Joseph Rich, Mark Glaze,
Spokane Regional Clean Air Agency Air Quality Report - August 2015
 Spokane Regional Clean Air Agency Air Quality Report - August 2015 Wildfire smoke pushed the Air Quality Index (AQI) for fine particulate matter (PM 2.5 ) well into the unhealthy (red) air quality range.
FABRICATION AND TESTING OF AUTOMOBILE POLLUTANTS ABSORBERS
 International Journal of Mechanical Engineering and Technology (IJMET) Volume 8, Issue 5, May 217, pp. 3 35, Article ID: IJMET_8_5_32 Available online at http://www.iaeme.com/ijmet/issues.asp?jtype=ijmet&vtype=8&itype=5
AIR QUALITY CONFORMITY DETERMINATION
 North Jersey Transportation Planning Authority, Inc. THE NORTHERN NEW JERSEY AIR QUALITY CONFORMITY DETERMINATION on the Regional Transportation Plan ( Plan 2040 ) and the FY 2016-2019 Transportation Improvement
Environmental Science 101 Air Resources. Fall Lecture Outline: Terms You Should Know: Learning Objectives: Reading Assignment:
 Environmental Science 101 Air Resources Fall 2012 1 Lecture Outline: 10. AIR POLLUTION A. The Atmosphere An Introduction B. Background Information About Air Pollution C. Six Principal Pollutants D. Air
2012 Air Quality Index Summary
 2012 Air Quality Index Summary New Jersey Department of Environmental Protection WHAT IS THE AIR QUALITY INDEX (AQI) The Air Quality Index (AQI) is a national air quality rating system based on the National
April 1, Dear Acting Regional Administrator Pavlou:
 DEPARTMENT OF ENVIRONMENTAL PROTECTION JON S. CORZINE P.O. BOX 402 MARK N. MAURIELLO Governor Trenton, NJ 08625-0402 Acting Commissioner Phone: (609) 292-2885 Fax: (609) 292-7695 April 1, 2009 The Honorable
Mobile Source Air Toxics Analysis for FHWA Projects
 Mobile Source Air Toxics Analysis for FHWA Projects Jeff Houk FHWA Resource Center March 29, 2007 Overview Background on mobile source air toxics How MSATs became an issue for highway projects FHWA MSAT
2015 Sulfur Dioxide Summary
 2015 Sulfur Dioxide Summary New Jersey Department of Environmental Protection SOURCES Sulfur dioxide (SO2) is a heavy, colorless gas with a suffocating odor that easily dissolves in water to form sulfuric
2016 New Jersey Air Quality Report
 2016 New Jersey Air Quality Report New Jersey Department of Environmental Protection December 7, 2017 New Jersey Department of Environmental Protection Bureau of Air Monitoring Mail Code: 401-02E P. O.
2017 New Jersey Air Quality Report
 2017 New Jersey Air Quality Report New Jersey Department of Environmental Protection October 30, 2018 New Jersey Department of Environmental Protection Bureau of Air Monitoring Mail Code: 401-02E P. O.
2017 New Jersey Air Quality Report
 2017 New Jersey Air Quality Report New Jersey Department of Environmental Protection October 30, 2018 New Jersey Department of Environmental Protection Bureau of Air Monitoring Mail Code: 401-02E P. O.
2016 New Jersey Air Quality Report
 2016 New Jersey Air Quality Report New Jersey Department of Environmental Protection December 7, 2017 New Jersey Department of Environmental Protection Bureau of Air Monitoring Mail Code: 401-02E P. O.
Earth s Atmosphere. Air Quality. 7. If no humans lived on Earth, there would be no air pollution.
 CHAPTER 4 LESSON 4 Earth s Atmosphere Air Quality Key Concepts How do humans impact air quality? Why do humans monitor air quality standards? What do you think? Read the two statements below and decide
The Air We Breathe. A report on Garfield County air quality monitoring results for
 The Air We Breathe A report on Garfield County air quality monitoring results for 2008-2014 Morgan Hill Environmental Health Specialist Garfield County Public Health mhill@garfield-county.com Cassie Archuleta
2011 Air Quality Index Summary
 2011 Air Quality Index Summary New Jersey Department of Environmental Protection WHAT IS THE AIR QUALITY INDEX (AQI) The Air Quality Index (AQI) is a national air quality rating system based on the National
Maryland Clean Air Progress Report
 Maryland Clean Air 217 Progress Report In 216, it was hot. Really hot. Maryland experienced the sixth-warmest summer ever recorded. Despite that type of weather -- which usually ushers in high levels of
Spokane Regional Clean Air Agency Air Quality Report - September 2011
 Spokane Regional Clean Air Agency Air Quality Report - September 211 An atmospheric high pressure ridge brought exceptionally warm, sunny and dry weather, light winds and marginal to poor ventilation to
9th Period Environmental Science Chapter 15: The Atmosphere
 Section 15.1: Earth s Atmosphere 9th Period Environmental Science Chapter 15: The Atmosphere Properties of the Atmosphere: nitrogen, oxygen, water vapor and 1% other gases. air pressure is higher at the
AIR QUALITY CONFORMITY DETERMINATION
 North Jersey Transportation Planning Authority, Inc. THE NORTHERN NEW JERSEY AIR QUALITY CONFORMITY DETERMINATION on the Regional Transportation Plan ( Plan 2040 ) and the FY 2014-2017 Transportation Improvement
Clean Air Act History
 Clean Air Act Compliance Clean Air Act Compliance Clean Air Act History 1940s serious smog in LA, CA and Donora, PA raised concerns about air quality. 1955, Air Pollution Control Act was the 1st national
The Road to a Cleaner Future
 The Road to a Cleaner Future Maintaining a strong Zero Emission Vehicle Program will save billions in health costs, reduce air pollution and help achieve the state s global warming goals. March 2008 A
Layers of the Atmosphere. Troposphere Stratosphere Mesosphere Thermosphere
 Air Pollution Layers of the Atmosphere Troposphere Stratosphere Mesosphere Thermosphere Troposphere Composition Sea level 17km Composition 78% Nitrogen 20% Oxygen Other 2%... Water vapor Argon gas Carbon
Health Effects of Air Pollution
 Health Effects of Air Pollution Environmental Justice Community Partnership Presented at: Coachella Valley Mosquito & Vector Control District (CVMVCD) Pedro Piqueras, Ph.D. Air Quality Specialist, Health
Dick Sch u t tt EPA Region June 25, 2008
 New Ozone NAAQS Dick Sch tt EPA Region 4 Dick Schutt EPA Region 4 June 25, 2008 Topics to Cover National Ambient Air Quality Standards (NAAQS) 2008 8-Hour Ozone Standard EAC Status Measures for reducing
Chapter Introduction. 1.2 Purpose. 1.3 Background. 1.4 Ozone Production and Health Effects. 1.5 Responsibilities of Agencies
 Chapter 1 1.1 Introduction 1.2 Purpose 1.3 Background 1.4 Ozone Production and Health Effects 1.5 Responsibilities of Agencies 1.1 INTRODUCTION On July 18, 1997, the United States Environmental Protection
Clean Air Interstate Rule (CAIR)
") Clean Air Interstate Rule (CAIR) Reducing Power Plant Emissions for Cleaner Air, Healthier People, and a Strong America Office of Air and Radiation March 2005 Benefits of the Clean Air Interstate Rule
Clean Air Interstate Rule (CAIR) Reducing Power Plant Emissions for Cleaner Air, Healthier People, and a Strong America Office of Air and Radiation March 2005 Benefits of the Clean Air Interstate Rule
Emerging Pollution Control Issues. In 2001, MPCA proposed environmental tax reform partly because it believed
 3 Emerging Pollution Control Issues SUMMARY Federal requirements for a new approach to water quality management will present new challenges for the Minnesota Pollution Control Agency (MPCA) particularly
1.0 OZONE SIP INTRODUCTION AND BACKGROUND. 1.1 Purpose
 1.0 OZONE SIP INTRODUCTION AND BACKGROUND 1.1 Purpose On June 15, 2004, the United States Environmental Protection Agency (USEPA) finalized attainment/nonattainment designations for the 8-hour ozone National
Health Effects Associated with Stack Chemical Emissions from NYS Natural Gas Compressor Stations:
 Health Effects Associated with Stack Chemical Emissions from NYS Natural Gas Compressor Stations: 2008-2014 A Technical Report Prepared for the Southwest Pennsylvania Environmental Health Project D.O.
QUARTERLY REPORT JAN-MAR
 QUARTERLY REPORT JAN-MAR 17 01 INTRODUCTION The Environment Agency - Abu Dhabi (EAD) publishes quarterly reports to present the status of air quality during three-month periods as it is monitored around
2013 Air Quality Index Summary
 2013 Air Quality Index Summary New Jersey Department of Environmental Protection WHAT IS THE AIR QUALITY INDEX (AQI) The Air Quality Index (AQI) is a national air quality rating system based on the National
GLOSSARY OF TERMS. Appendix B
 Appendix B GLOSSARY OF TERMS A C Acid rain Air pollution produced when acid chemicals are incorporated into rain, snow, fog or mist. The "acid" in acid rain comes from sulfur oxides and nitrogen oxides,
Regulatory and Voluntary Efforts in Addressing Particulate Matter and Black Carbon in the U.S UNECE/LRTAP/WGSR. Geneva. April 2013
 Regulatory and Voluntary Efforts in Addressing Particulate Matter and Black Carbon in the U.S UNECE/LRTAP/WGSR Geneva April 2013 Kimber Scavo EPA s Revisions to the Air Quality Standards for Particle Pollution
Twomile Ecological Restoration Project Air Quality Report Anna Payne, Mi-Wok District Fuels Specialists August 2011
 Twomile Ecological Restoration Project Air Quality Report Anna Payne, Mi-Wok District Fuels Specialists August 2011 The National Environmental Policy Act (NEPA), the Federal Clean Air Act, and California
Imperial County Air Quality. Felipe Solorzano. San Diego State University: Undergraduate. Project duration: March 2014-August 2014
 1 Imperial County Air Quality Felipe Solorzano San Diego State University: Undergraduate Project duration: March 2014-August 2014 Advised by: Cydean Gillespie United States Department of Agriculture Natural
Air Pollution Chapter 21. Atmosphere as a Resource
 Air Pollution Chapter 21 Atmosphere as a Resource Atmospheric Composition Nitrogen 78.08% Oxygen 20.95% Argon 0.93% Carbon dioxide 0.04% Ecosystem services Blocks UV radiation Moderates the climate Redistributes
Wildfires: Smoke Impacts and Public Health Protection
 Wildfires: Smoke Impacts and Public Health Protection Julie Hunter, Senior Air Quality Specialist Washoe County Health District, Air Quality Management Division Great Basin Climate Forum December 6, 2018
A. INTRODUCTION B. POLLUTANTS FOR ANALYSIS
 Chapter 18: Air Quality A. INTRODUCTION The potential for air quality impacts from the proposed project is examined in this chapter. Air quality impacts can be either direct or indirect. Direct impacts
What is the Transport Rule?
 What is the Transport Rule? The Transport Rule will limit pollution from power plants that are located in 31 eastern, southern, and midwestern states and DC The CAA requires each state to be a good neighbor
Air Quality Management in San Diego County
 Air Quality Management in San Diego County asdf San Diego Snapshot 4,255 square miles 65 miles N to S 86 miles E to W 3 million people 3.5 million by 2020 1.4 million jobs 1.7 million by 2020 2.5 million
CE 326 Principles of Environmental Engineering Prof. Tim Ellis
 AIR POLLUTION CE 326 Principles of Environmental Engineering Prof. Tim Ellis January 25, 2008 Seven Major Pollutants of Concern 1. P 2. S Oxides (SO X ) 3. O 4. N Oxides (NO X ) 5. Carbon M (CO and other
Spokane Regional Clean Air Agency Air Quality Report - September 2013
 Spokane Regional Clean Air Agency Air Quality Report - September 2013 September began with a high pressure ridge over the region and rising levels of fine particulate matter (PM 2.5 ) in Spokane. An approaching
2010 Air Toxics Summary
 2010 Air Toxics Summary New Jersey Department of Environmental Protection INTRODUCTION Air pollutants can be divided into two categories: the criteria pollutants (ozone, sulfur dioxide, carbon monoxide,