RIVER TRANSPORTATION IN MINNESOTA 2001 DEPARTMENT OF TRANSPORTATION PORTS & WATERWAYS SECTION
|
|
|
- Ariel Mathews
- 6 years ago
- Views:
Transcription

1 RIVER TRANSPORTATION IN MINNESOTA 2001 DEPARTMENT OF TRANSPORTATION PORTS & WATERWAYS SECTION
 has prepared this river transportation plan to aid Mn/DOT in its efforts to Support and promote the continued effectiveness and development of commercial river navigation as a vital")
2 Minnesota s River Transportation Plan Prepared by Ports & Waterways Section, Minnesota Department of Transportation The Ports and Waterways Section of the Minnesota Department of Transportation (Mn/DOT) has prepared this river transportation plan to aid Mn/DOT in its efforts to Support and promote the continued effectiveness and development of commercial river navigation as a vital component of the total transportation system. This plan includes an historical background of river transportation, a mode status report and issue identification for use by Mn/DOT and other interested agencies and individuals. Information included in this plan was obtained from towboat, passenger boat, barge owners, operators, terminal operators, fleet operators, port authorities as well as federal, state and municipal agencies. Summer 2001
3 0.0 Introduction Purpose Scope Minnesota Department of Transportation Authority Historical Background U.S. Inland and Coastal Waterway System Mississippi Waterway System Upper Mississippi River System The Existing Inland Waterways U.S. Shallow Draft Navigation System The Mississippi River Minnesota s Navigable River System Navigation Structures- Their Operations and Maintenance The River Transportation Industry Industry Organization Industry Operations Vessels Terminals Freight Movements on Minnesota s Rivers Historic Commodity Movement Commodity Forecasts Other River Uses Passenger Traffic Recreational Activities Commercial Enterprises Wildlife Management Other Non-Navigation River Users Institutional Systems Federal Agencies Minnesota Agencies Regional Agencies, Quasi-Governmental Associations, and Commissions Municipalities Major Legislation...47 Table of Contents 8.0 River Navigation Issues National Issues Local Issues Zebra Mussels Minnesota Legislation...57
4 Note Page
5 1.1 Purpose The plan is necessary to aid the Minnesota Department of Transportation (Mn/DOT) in its efforts to support and promote the continued effectiveness and development of commercial navigation as a vital component of the total transportation system. Mn/DOT does this by encouraging federal, state and local agencies to respond to the need for effective commerce on the Upper Mississippi navigation system. 1.2 Scope The plan provides historical background of the river commerce and the river transportation system, mode status report and issue identification for use by decision-makers within Mn/DOT and other agencies concerned for commercial navigation. 1.3 Minnesota Department of Transportation Authority The Minnesota Department of Transportation is empowered by Minnesota Statutes to participate in the development of policies, plans and programs for all modes of transportation including waterways. The department is the principal agency for development, implementation and administration of transportation policies including those related to the use of Minnesota s navigable rivers. 0.0 Introduction 1
6 Note Page
7 2.1 U.S. Inland and Coastal Waterway System Map 2.1 Commercially Navigable Waterways of the United States The U.S. Shallow draft waterway system, shown on map 2.1, provides low cost transportation of commodities for domestic and export commerce. Nearly 17% of U.S. Intercity freight tonnage is moved on water routes. These routes serve the Atlantic and Pacific coasts, the Gulf Coast and the industrial and agricultural heartland of the nation. The shallow draft system provides service to 38 states and nearly 95% of the nation s population. This navigation system was originally developed with both public finds and private investments. Since 1980 the Federal government has collected a user tax on fuel (currently 24.3 cents per gallon), called the Inland Waterway user fee. Twenty cents of this tax is placed in an escrow account to pay for _ or 50% of any major federal project to enhance the Inland Waterway Navigation System. An example would be the reconstruction of a lock and dam on the system. Government has traditionally encouraged development of the system through technical and financial support. In addition to system development and operation, government s growing role includes actions to regulate the river transportation system to promote safety and protect the environment. 2.0 Historical Background The Federal Environmental Management Program (EMP) is funded through the U.S. Army Corps of Engineers to improve fish and aquatic habitat and to lessen erosion in backwaters. This is a cooperative program with the U.S. Fish and Wildlife Agency and state DNRs on the Upper Mississippi River. Although the rivers on the continent had historically provided inter-regional transportation corridors, it was the channel improvement projects and canals constructed in the early days of settlement that helped open the frontier. Most of the early private investors built navigation projects with some help from the colonial administrations. An example of public action to promote navigation is the legislation 3

8 passed by the Virginia House of Burgesses in 1772 to finance channel improvements on the Potomac River from the tidewater to Fort Cumberland, Maryland. Although the colonial and later the state and federal governments planning efforts and land grants were major contributions to river development, early projects relied on private stock companies for funding. Early government capital investment in water projects included, besides the colonial funding of the Potomac project, the very profitable Erie Canal, that was built by the State of New York in the period 1817 to Those ventures encouraged expanded federal government involvement by demonstrating the economic benefits that can be realized from water transportation projects. Direct involvement by the U.S. government did not begin until 1824 when the U.S. Supreme Court upheld federal sovereignty over river and harbor improvements (based on the Commerce Clause of the U.S. Constitution). This landmark case, Gibbon vs. Ogden paved the way for further action by Congress and the President. Also in 1824, Congress passed two acts pertaining to commercial navigation. The General Survey Act of 1824 authorized the U.S. Army Corps of Engineers to do land surveys and design studies of waterway improvements. The Rivers and Harbors Act of 1824 provided funds for research, project design and channel clearing. It also authorized the federal government to provide land grants and technical assistance to state and local governments for harbor improvements. These early federal actions provided for the development of East Coast and Gulf Coast deep draft ports for commercial navigation and opened the full inland river system, including the Mississippi River for commercial uses. The transportation routes that were opened on the rivers were used to move agricultural products and raw materials from the hinterland to processing centers or to export ports. Inland farm areas and coal fields became more accessible as a result of river channel and canal improvements, providing food and fuel for the growing urban centers. In order to implement the programs provided for in the Acts of 1824, President Madison appointed the first Board of Engineers. The board, which was made up of senior Army Engineers, was charged with the plan review and prioritization of projects to be implemented by the Corps of Engineers. By 1850 the federal government, through the U. S. Army Corps of Engineers, had full responsibility for the construction, operations and maintenance of most of the national waterway system. Along with the growth in federal waterways responsibility there is a strong measure of local involvement in areas of shore land development, economic expansion and accommodation of all waterway user needs. 2.2 Mississippi Waterway System Navigation System The Mississippi River commercial navigation system extends from Minneapolis, Minnesota to the Gulf of Mexico (1811 miles), as shown on Map 2.2. Major navigable tributaries of the Mississippi River System include the Missouri, Ohio, Illinois, 4 Map 2.2
 to its confluence with the Ohio River at Cairo, Illinois (1366 miles).")
9 Tennessee and Arkansas. The Upper Mississippi River basin shown on Map2.3 includes Minnesota, Wisconsin, Iowa, Illinois and Missouri. It includes the reach of the Mississippi from the headwaters in Northern Minnesota (Lake Itasca) to its confluence with the Ohio River at Cairo, Illinois (1366 miles). Included in the Upper Mississippi River navigation system are the Mississippi s navigable tributaries: the Minnesota, St. Croix, Illinois, Kalkaska and Missouri Rivers as shown on Map 2.4. The total length of the Mississippi River from Lake Itasca to the Head of Passes is 2,320 miles. In 1663 French explorers Marquette and Joliet explored the Mississippi from its headwaters at Lake Itasca to its confluence with the Arkansas River. On their second expedition, in 1678, they went all the way downstream from the Arkansas to the Head of Passes, where the river meets the Gulf of Mexico. The first recorded commercial navigation movements on the Mississippi occurred in 1705 when some 15,000 fur pelts were shipped by raft from the Missouri River to the City of Biloxi. The economic value of transportation on the river grew from that beginning, with improvements in vessels and with the construction of channel and harbor projects. Map 2.4 Vessels Vessel improvements included the development of early flatboats and the Bullboat, which originally had a capacity of 3 tons of cargo. It was used mostly on short hauls and only down river. The keelboat was a major advancement in vessel design. It was built with a pointed bow to make upstream shipments easier and faster. When used with steamboats, it was Figure 2.1 Flatboat 5 Map 2.3 Upper Mississippi River Basin

10 tied to their sides. This use of the boat was the forerunner to the modern barge tow system used on the river. See attached drawing. The use of steamboats on the lower Mississippi began in 1812, expanding river commerce to include passenger travel. In the early days, steamboat operation was confined to the lower river because operators thought traveling north of the Ohio River was impossible due to rocks, sandbars and debris. In 1823 the steamboat Virginia made the first trip from St. Louis to St. Paul. Although the 660-mile trip took 20 days, it did prove that the upper river could be navigated. Figure 2.2 Keelboat Congress passed the Rivers and Harbors Act of 1824 to fund the construction of workboats and the cost of channel clearing operations such as rock, snag, and sandbar removal. However, these improvements did not address the problems of rapids on the upper river. Even though channel clearing helped navigation to a great degree, costly groundings still occurred on the river. In 1851, the U.S. Army Corps of Engineers responded to the need for safer navigation by initiating a major study of flood control and navigation on the Mississippi. The study provided the basis for the Rivers and Harbors Act of 1878, which authorized construction of a 4 foot navigation channel from St. Louis to St. Paul. That project included the construction of wing dams to help form a channel by confining and diverting the river current. It also included building closing dams to restrict flow to the backwaters and maximize the amount of water in the main channel. A more stable level of water facilitated steamboat movement. Cargoes carried by the early steamboats north of St. Louis consisted almost entirely of furs and military supplies. In the mid 1800 s when river population centers, such as St. Paul and Minneapolis began to grow, the list of cargoes expanded to include a wide variety of commodities as well as passengers. The steamboats that hauled freight and passengers were operated by individual entrepreneurs who were in strong competition with one another. Their operations were generally unorganized and had no scheduled arrival or departure times. That changed to a great extent in 1847 when the Minnesota Packet Company was created. It helped organize the industry by assigning steamboats to scheduled stops and timetables, especially on the passenger runs. Early river commerce on the upper river also included sizeable amounts of raw and finished lumber. White pine from Minnesota and Wisconsin was shipped to sawmills located on the river between St. Paul and St. Louis. Finished lumber from the mills went to the growing urban centers in the east and south. Rafts of logs and steamers loaded with finished lumber were a common sight on the river as late as River System Development Congress created the Mississippi River Commission in 1879 to oversee the management of the Mississippi River Valley resources. The Commission included seven presidential appointees, three from the U.S. Army Corps of Engineers and four civilians representing the midwestern states. The Commission s many recommendations included deepening the river channel and constructing of locks at river rapids to improve transportation on the Upper Mississippi River system. In 1907 action began on their recommendations when Congress authorized a 6-foot navigation channel from St. Louis to St. Paul, included the construction of 3 locks at the Des Moines River rapids, the Rock Island River rapids and the Minneapolis rapids. Work on the six-foot navigation channel created concern about natural resources in the river valley. In 1910, President Theodore Roosevelt responded to those concerns by appointing the Inland Waterways Commission, which was charged with preparing a plan for waterway development and conservation. 6
11 The Inland Waterways Commission s investigated the economics of the river transportation industry which had succumbed to intense competition from the railroads. When the railroads built tracks parallel to the river, they offered generally safer and faster service to the midwestern grain farmers. As a result, many small vessel operators were bought up by railroad companies, which eliminated most competition. The railroads were also acquiring ocean and Great Lakes shipping companies at this time. The Commission s investigation, which proved the need for effective modal competition, caused the Congress to pass the Panama Canal Act of The Act was directed toward the development of renewed competition between the railroads and the water transportation industry. Its main theme is the prohibition of ownership of water carrier companies by railroads, which would normally be in competition with them. Another product of the Inland Waterways Commission was the development of certain provisions, which were contained in the Transportation Act of That Act created the Inland and Coastwise Waterways Service to promote water transportation through research and public information programs. In 1924, this agency became the federally owned and operated Inland Waterway Corporation. Its mission was to revitalize the commercial navigation industry. The Corporation helped water carriers by designing and building towboats and barges to add cargo capacity and improve operating efficiencies. With these improvements the river transportation industry was able to compete for and capture a substantial share of the market for Midwest grain shipments. 2.3 Upper Mississippi River System When commerce began to expand again on the Upper Mississippi, the Inland Waterway Corporation helped river towns with financial and technical assistance for port and terminal development. By 1935, twelve cities on the Upper Mississippi had built cargo transfer facilities with help from the corporation. River transportation grew with the economy of the Upper Mississippi Valley. In 1930, in response to that growth, Congress authorized a 9-foot navigation project on the Mississippi River and parts of the Minnesota and St. Croix Rivers. The project included construction of 27 locks and dams as well as supplemental channel dredging. Building the locks and dams created river pools with stable water levels. The dams provide the ability to control river pool elevations to ensure adequate channel depth for vessels with 9 feet of draft. The locks allow the river vessels to traverse the 404-foot elevation change between St. Louis and Minneapolis. Levees and bank revetments to protect riverbanks and adjacent flatlands were another important part of the 9-foot navigation project. 7
12 Note Page
13 U.S. Shallow Draft Navigation System The national shallow draft navigation system has a total length of over 25,000 miles. There are nearly 22,000 miles of river channel and over 3,000 miles of coastal waterways in the system. Channel depths, which refer to the maximum vessel draft that can be safely accommodated, vary throughout the system from less than 5 feet in the Alaskan river network to over 45 feet in the New Orleans area. Depths for the channels in the central river system, which included the Mississippi and Ohio Rivers and their tributaries, are generally dredged to accommodate vessels with 9 feet of draft. The shallow draft waterway system currently carries nearly 17 % of the nation s total intercity freight movement. That percentage of the nation s freight traffic cost isf about 2% of the nation s freight movement bill. Figure 3.1 compares movement of commodities on the national shallow draft system with other waterway systems Other Waterways Mississippi River System Great Lakes System Figure 3.1 Ton-miles of U.S. Waterborne Freight (one ton/mile equals moving one ton of freight a distance of one mile) The shallow draft system provides water transportation service to 38 of the 50 states. Even those states, which are not directly on the navigation system, profit from its existence through low cost transportation of their material needs and products. Miles from the Twin Cities to: Chicago, IL 956 Cincinnati, OH 1341 Columbus, GA 2281 Houston, TX 1927 Knoxville, TN 1524 Nashville, TN 1081 New Orleans, LA 1686 Omaha, NE 1276 Pittsburgh, PA 1811 Tulsa, OK 1724 Sioux City, IA Omaha, NE Kansas City, MO Tulsa-Catoosa, OK 412 Little Rock, AR Camden, AR TWIN CITIES 393 St. Louis, MO Paducah, KY Memphis, TN Baton Rouge, LA Lake Charles, LA Houston, TX Galveston, TX Chicago, IL Florence, AL Celina, TN Clinton, TN 63 Knoxville, TN Nashville 80 Charleston, TN Mobile, AL New Orleans, LA Cincinnati, OH Huntington, W. VA. Louisville, KY Chattanooga, TN Guntersville, AL Birmingham, AL 180 Pittsburgh, PA Charleston, W.VA Columbus, GA St. Marks, FL The central river system connects 21 states in the industrial and agricultural heartland of the nation with each other and the seacoast ports. Figure 3.2 shows some of the distances between major cities on the Mississippi River system. 3.0 The Existing Inland Waterways Brownsville, TX Figure 3.2 9
14 3.2 The Mississippi River The Mississippi and its major tributaries serve the freight transportation needs of 14 states in the agricultural belt. With the Ohio River system added, the coverage expands to 21 states, which include most of industrial America. Table 3.1 shows the volumes of freight that move on the Mississippi River System. The Lower Mississippi, from Cairo downstream, is free flowing without locks and dams. Depths on the lower river are maintained at nine feet to Baton Rouge, Louisiana. From there downstream the channel is maintained at a depth of 45 feet, sufficient for ocean vessels. The Lower Mississippi has over 830 miles of navigable channel. The navigation portion of the Upper Mississippi River system includes the Mississippi River and all of its navigable tributaries from the mouth of the Ohio River at Cairo, Illinois, miles upstream to the Minneapolis Upper Harbor. The Upper Mississippi River has 29 locks and dams. The YEAR MISSISSIPPI UPPER RIVER SYSTEM* MISSISSIPPI** ,569,149 76,394, ,852,148 72,039, ,497,000 88,402, ,149,000 84,069, ,000,000 86,185, ,731,000 72,158,000*** ,673,000 79,421, ,421,000 84,394, ,711,000 80,372, ,876,000 77,838, ,741,000 79,628,000 *Includes Illinois, Ohio, Mississippi & Missouri Rivers to New Orleans. (No foreign freight) ** From Minneapolis, Minnesota to the Mouth of the Missouri River just above St. Louis. *** Major flood on the Upper Mississippi. Source: U.S. Army Corps of Engineers Table 3.1 Historic Traffic Volumes Total Cargo (Short Tons) locks lift or lower vessels and their tows a total of 404 feet from lock 27 at Granite City, Illinois to the Upper St. Anthony Falls Lock and Dam in Minneapolis. The lift at the Upper St. Anthony Falls lock is 49.2 feet, the greatest on the system. Figures 3.3 and 3.4 describe the locations, sizes and lefts of the Upper Mississippi River locks. Figure 3.3 Mississippi Stairway of Water 10
15 Locks and Dams St. Anthony Falls, upper lock St. Anthony Falls, lower lock & dam Lock and Dam 1 Lock and Dam 2 Lock and Dam 3 Lock and Dam 4 Lock and Dam 5 Lock and Dam 5a Lock and Dam 6 Lock and Dam 7 Lock and Dam 8 Lock and Dam 9 Lock and Dam 10 Lock and Dam 11 Lock and Dam 12 Lock and Dam 13 Lock and Dam 14 Le Claire Lock (Canal) Lock and Dam 15 Lock and Dam 16 Lock and Dam 17 Lock and Dam 18 Lock and Dam 19 Lock and Dam 20 Lock and Dam 21 Lock and Dam 22 Lock and Dam 24 Lock and Dam 25 Melvin Price Lock and Dam Locks 27 Figure 3.4 Miles Above Ohio River Location or Miles to Nearest Town Minneapolis, MN Minneapolis, MN Minneapolis-St.Paul, MN 1.3 above Hastings, MN 6.1 above Red Wing, MN Alma, WI Minneiska, MN 3.0 above Winona, MN Trempealeau, WI Dresbach, MN Genow, WI 3.3 below Lynxville, WI Guttenberg, IA 3.7 above Dubuque, IA Bellevue, IA 4.3 above Clinton, IA 3.7 below Le Claire, IA 3.9 below Le Claire, IA Foot of Arsenal Island, Rock Island, IL 1.8 above Muscatine, IA 4.2 above New Boston, IL 6.5 above Burlingtron, IA Keokuk, IA 0.9 above Canton, MO 2.1 above Quincy, IL 1.5 below Saverton, MO Clarksville, MO Cap Au Gris, MO Alton, IL Grantie City, IL Width of Chamber The shipping season on the Upper Mississippi River runs from mid-march through the last week of November from the Twin Cities downstream to Davenport, Iowa, but it runs year round below the confluence of the Illinois River. The U.S. Corps of Engineers has concluded studies to determine the feasibility of season extensions. They show that upstream of Davenport; Iowa there is little economic gain in a season extension. 3.3 Minnesota s Navigable River System Available Length for full Width Dimensions (Feet) Upper Upper Normal Pool Elevation (MSL) Year Opened Within Minnesota, there are miles of commercially navigable channel on the Mississippi River, 24.5 miles on the St. Croix River and 14.7 miles on the Minnesota River, for a total of 223 miles. All types of bulk freight are moved on the river system. Major movements to and from Minnesota include: coal, grain, liquid and dry fertilizers, potash, salt, raw steel, scrap, slag, anhydrous Ammonia, caustic soda, steel forms, pig iron, cement, sand and gravel, crude oil, petroleum products, newsprint and all types of heavy general cargo. Experiments in moving beer and automobiles were not economically effective. Of all the transportation modes, the river navigation system is the most environmentally friendly and economical way to move large quantities of bulk products. Commodity movements through Minnesota s river terminals have reached volumes exceeding 17 million tons in a single season. One half or more of the annual tonnage total is grain. Over , , , Lift Lower
16 60% of all grain rose for export in the state is shipped on the river system. Intrastate movement of petroleum products and sand and gravel accounts for about 10% of the total. Commodity movement figures show a steady growth trend with a few downward turns, which reflect national economic conditions or crop productions and export market losses. Table 3.2 shows historic commodity movements from Minnesota. YEAR COAL CHEMICAL MINERALS AG PRODS MISC TOTAL ,637 3, , , ,593 2,898 1,019 7, , ,486 2,867 1,685 11, , ,183 2, , , ,092 3, , , ,788 2,856 5,500 1,018 11, ,419 2,488 6, , ,985 2,396 8, , ,167 2,415 9, , ,932 2,787 8, , ,460 2,913 8, , ,996 3,365 10, , ,012 3,547 9, ,304 Table 3.2 Tonnage Through Minnesota s Port Terminals(In 1,000 s of tons) St. Croix River Coal was the major product moved on the St. Croix River to the Northern States Power plant at Bayport, Minnesota. With the change to low sulfur coal from the Powder River Basin in Montana and Wyoming and the 1986 construction of a direct rail siding to serve this Plant, coal movement on the St. Croix has stopped was also the last year that fertilizer moved on the St. Croix as the Stillwater terminal closed. No freight currently moves on the St. Croix. The Coast Guard still maintains navigation buoys, that aid recreational boaters. Minnesota River The majority of the cargo moved through the six operating terminals on the Minnesota River is grain. Fertilizer, salt, petroleum products and aggregates also move on the 14.7 miles of navigable river channel. Rail and highway transportation provide excellent access to the Minnesota River terminals from the southern and central Minnesota farm production areas as well as to grain producers in North and South Dakota. Each year, over 5 million tons of products move on the Minnesota River. Mississippi River Port Segments Most of the river terminals in Minnesota are on the Mississippi. There are a total of 38 active Mississippi River terminals in four port areas. Those areas are: the Upper Minneapolis river pool; pool two, which includes St. Paul and its neighboring communities (Map 3.1); Red Wing (Map 3.2); and Pool 6 Winona (Map 3.3). The heavy commercial river traffic generated by these Minnesota terminals joins Wisconsin traffic from Alma, LaCrosse, Genoa, Prairie du Chien and Cassville. These terminal areas generate similar kinds of freight, but not the high volume. 12


17 Map 3.2 Red Wing Map 3.1 Twin Cities 13


18 Map 3.3 City of Winona 3.4 Navigation Structures- Their Operations and Maintenance There are many structures on the nation s shallow draft navigation system, such as wing dams and closing dams, which provide aid to navigation by helping to maintain stable channels. The most important structures, however, are the 214 lock chambers on the nation s rivers and coastal waterways. These locks and dams provide a means for vessels to traverse the rivers elevation changes and the impounded pools of water, which help ensure adequate channel depth. In addition, the impoundments created by dams also provide huge fishery and recreation areas as well as water supplies for drinking, irrigation, electric power generation and industrial use. Figure 3.5 shows a typical lock and dam. Some of the locks, such as Figure 3.5 Lock 27 on the Mississippi, (which circumvents the Chain of Rocks rapids at St. Louis), are not constructed as part of a pool-impounding dam. The near lock chamber with a tow in it is 1,200 feet long by 110 feet wide. All of the locks on the Ohio River are this size. (= 1¼2 hour locking time) The upper right chamber is 600 feet long by 110 feet wide. Most of the locks on the Upper Mississippi River are this size. (= 2 hour locking time) There are a number of different types of locks on the river and coastal waterways. They operate in the same manner, (as shown in Figure 3.6), but their sizes vary. The U.S. Army Corps of Engineers, the agency with the responsibility to construct, maintain and operate the navigation channels, established the following standard lock dimension for the shallow draft system of the United States: 14

19 Figure 3.6 How Navigation Locks Operate These standard dimensions were established in Many locks built prior to that time or which were under construction at that time do not conform to the standards. The average lock is designed to accommodate the passage of vessels in a 20 to 30 minute operation. Single 15 barge tows, which are too large to pass through a 600-foot lock in a single operation, require double lockage. Breakup and reassembly of the tow together with two lockage operations generally takes about an hour and a half to two hours depending on the lock lifts and the efficiency of the boat and lock crews. Although dams are essential to maintain reasonable constant water depth of year-round navigation on most rivers, they do much more. They also provide municipal, industrial and agricultural water supplies. Some dams include facilities for electricity generation as one of their purposes. The pools created by dams afford ideal opportunities for pleasure boating and fishing and backwater habitat for wildlife. All of these related development assets enhance the value of lands adjacent to the waterways, creating an added source of economic and environmental enhancement. Other Structures Wing dams and closing dams were built during the construction of the early 4-1¼2 and 6 foot navigation project discussed in chapter 2. Their main function is to control the river s current so that the greatest amount of water possible stays in the navigation channel, which keeps the 15 1) Lock width of 56 feet with length of either 400 feet or 600 feet. 2) Lock width of 84 feet with length of 600 feet, 800 feet or 1,200 feet. 3) Lock width of 110 feet with length of 600 feet, 800 or 1,200 feet.
 downstream to Minneiska, Minnesota, 257 wing dams were built.")

20 main channel water velocity high enough to help keep the channel free of sediment build up. Hundreds of wing dams were constructed between 1866 and For example, in the twenty-mile stretch from Reads Landing (at the foot of Lake Pepin) downstream to Minneiska, Minnesota, 257 wing dams were built. The wing dams, usually built in pairs, extend at a slight angle into the current from each side of the river restricting the width of the channel and increasing currently velocity. Over the years sediment and sand have filled the spaces below some of the wing dams, which has altered habitat in the areas. Map 3.4, which are a reproduction of a U.S. Army Corps of Engineers navigation chart for a part of the Pine Bend channel, show the location of wing dams in that area. Figure 3.7 is a picture of the Pine Bend area prior to the construction of the 9-foot channel project. It shows the wing dams as they looked at low water. Figure 3.8 shows how the area looks today. Closing dams were built to close openings to side channels and backwaters. These structures helped increase the amount of water available for the main channel. In recent years, new closing dam and wing dam construction has Map 3.4 Pine Bend River Area Wing Dam Locations been studied as a possible means of reducing the need for dredging in the navigation channel. Other devices intended to help reduce dredging volumes include sediment traps, such as those built into the mouth of the Chippewa River near Reads Landing. Huge holes dug in the river bottom reduce water velocity. The result is sediment deposited before it gets to the navigation channel in the Mississippi. Although levees were built where needed for flood protection, rather than as a part of the navigation system, some were incorporated as part of the 9-foot project on the Mississippi. Existing levees are constantly being expanded to meet new needs. New levees are also under study. Figure 3.9 shows a typical levee structure. Figure 3.7 Pine Bend prior to 9-foot channel 16 Figure 3.8 Pine Bend Today


21 Dredging Figure 3.9 Typical levee structure Figure 3.10 Hydraulic Dredge In recent years, many of the beaches built from dredge material have begun to wash away during high water, rainstorms and heavy wave action. This has raised questions regarding former placement methods. These placement methods are under ongoing review by appropriate government agencies. The portion of the channel that has required dredging on the upper river is only about 20% of the total river. Less Figure 3.11 Mechanical Dredge than 5% requires annual dredging. However, 50% of that required dredging on the upper river occurs in the St. Paul District of the U.S. Army Corps of Engineers, mostly in Minnesota. Most dredging occurs below the confluence of fast moving tributary streams, such as the Chippewa River, and the main river. As the velocity of the tributary stream slows to match that of the main river, the sediment it has carried in suspension falls out creating shoaling. Since 1974 most dredge material has been placed in adjacent upland sites. Adherence to State and Federal dredging regulations often caused the U.S. Army Corps of Engineers to double handle dredge material. Mechanical dredging costs have been stable or have declined as contractors have become more efficient and increased the quantity moved by this method. 17 Dredging is the major activity in navigation channel maintenance. It is done to maintain channel depth and channel width. Dredging is done by the U.S. Army Corps of Engineers or private contractors with both hydraulic and mechanical equipment. The Corps administers all navigation channel dredging. Figures 3.10 and 3.11 show the two types of dredges used on the river. Figure 3.12 demonstrates the hydraulic dredging process. Prior to the mid-1970 s the Corps would deposit dredge material on the existing islands or river banks or put it in shallow areas. This method produced many excellent beach areas, upland wildlife habitat areas, and small islands suitable for many recreational uses. Figure 3.13 shows as island built from dredged material and figures 3.14 and 3.15 show typical dredge material beaches. That dredge material placement method has changed for a number of reasons. In response to growing concern for any potential adverse environmental impacts of such dredge material placement methods, Congress authorized formation of the Great River Environmental Action Team (GREAT) study through the 1976 Water Resources Development Act. Congress also passed the 1969 National Environmental Policy Act, the 1972 Federal Water Pollution Control Act and the Clean Water Act of These Congressional actions caused significant changes in dredged material placement practices.


22 Figure 3.12 Hydraulic Dredging Process Figure 3.13 Dredging Material Island Figure 3.14 Dredging Material Beach 18 Figure 3.15 Dredge Material Beach
23 Hydraulic dredging costs have increased dramatically when measured per cubic yard. That s because job size has decreased and equipment capability has increased. In recent years, when looked at from an average cost per cubic yard perspective, the cost of mechanical vs. hydraulic is comparable. (See table below). During the period , hydraulic methods with the Dredge Thompson averaged $ 5.00/CY and contract mechanical $5.30/CY. Because the Corps has an active program to reduce dredging requirements (dredge only where and when necessary), the cost per cubic yard generally will suffer. However, the overall cost for just the dredging part of channel maintenance has not changed that much. A good example is comparing the Thompson cost between 1998 and The overall cost was very similar because of the fixed costs associated with the plant, but the quantity dredged in 1999 was only a third of 98, so there is a big difference in the cost/cy. When we look at the overall cost of channel maintenance (meaning dredging, placement site excavation & maintenance, and channel modification work), costs have risen considerably. During the period , total channel maintenance averaged $6,100,000./ year (not adjusted for inflation). In recent years, it has averaged$10,000,000. Some of this cost is cyclic because it includes unloading placement sites, which will not be required every year. Dollars and Cubic Yards in 1000 s FY THOMPSON DUBUQUE HAUSER CT MECH CT HYD CY $ $/CY CY $ $/CY CY $ $/CY CY $ $/CY CY $ $/CY AVG/Y
24 Note Page
25 4.1 Industry Organization National Barge and Towing Industry 1998 Companies 435 Towboats & tugs 5,173 Total Fleet Horsepower 8,525,347 Dry Cargo Barges 20,196 Dry Cargo Capacity 28.2 million tons Liquid Cargo Barges 2,896 Liquid Cargo Capacity 7.8 million tons Employees Afloat & Shore side 176,200 The river transportation industry includes line haul and harbor service towing companies, barge owners, terminals, shipyards, support services such as barge cleaning facilities, fleeting providers, and fuel and food suppliers. Table 4.1 shows the nationwide size of the industry s components in Table 4.2 compares revenues between the towing industry and the nation s railroads. Table 4.1 Source: U.S. Corps of Engineers Sparks Companies, Inc. Rail-Water Revenue Comparisons 4.2 Industry Operations MODE REVENUE REVENUE/TON-MILES Barge $2,675 billion $.0086 Rail $26,350 Billion $.0287 Source: American Waterways Operators, Inc. Table 4.2 The line haul towing companies operate towboats that move barge tows from point to point on the river system. Their activities include providing towing power to move tows of barges, which they or other companies might own. Line haul companies are often affiliated with major shippers. Harbor service towing companies provide power for local Interpool and intrapool movements. Their major operations involve the moving of individual barges to or from full tows, which are generally made up of barges bound for different destinations. The harbor towboat operators take the single barges to their separate loading points and move the loaded barges back to the tow assembly areas. Tow assembly areas (called fleets or fleeting areas), are both privately and publicly owned. The publicly owned fleets are usually the property of the local municipal government, which administers them through a port authority or an industrial development agency. Terminal companies, harbor towing companies or line haul companies rent them. Privately owned fleeting areas are operated or leased by terminal operators by line haul or harbor towing companies. 4.0 The River Transportation Industry 21
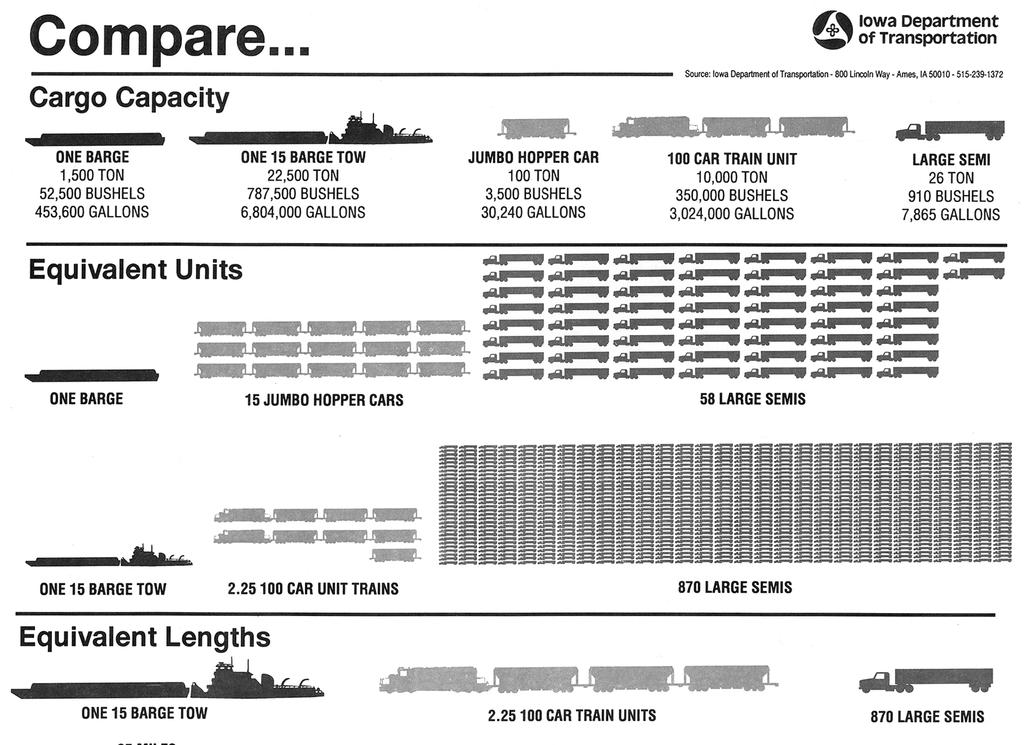
26 Shipyards provide not only construction service for new towboats and barges, but also repairs to damaged vessels. There are no shipyards involved in new vessel construction in Minnesota at present. There is, however, one vessel repair facility, which is part of the harbor service towing company operating in the Twin Cities. Twin City Shipyard, which manufactured river barges for a number of years, closed in Barge cleaning is another important support service. Barges, which have been used to carry commodities such as coal, fertilizer or cement upstream, are cleaned so that they can be loaded with grain for the downstream movement. Barge cleaning is also important for tank barges, that carry liquid cargoes, including petroleum, vegetable oils, anhydrous ammonia and caustic soda. Both fuel and food suppliers serve the towing industry in Minnesota s harbor areas. 4.3 Vessels Several types of barges carry a wide variety of commodities on the shallow draft system. These include hopper barges, deck barges, and tanker barges, all with varying capacities of up to 3,000 tons. Figure 4.1 shows the different types and sizes of river vessels. Hopper barges (either covered or open), carry dry bulk commodities. The jumbo hopper, which is used extensively in Minnesota for grain hauling, is 35 feet wide by 195 or 200 feet long. It has an operating loaded draft of 9 feet, an empty weight of 300 tons, and a maximum 1,500-ton cargo capacity. The jumbo hopper box barge has the same outside dimensions, but because both ends are boxed, the capacity of the barge at 9 feet of draft increased to 1,650 net tons. Approximately one half of the jumbo hopper barges now operating are of the box configuration. This has increased the average capacity of the jumbo hopper barge fleet to 1,575 tons at a nine-foot draft. Hopper barges used on other parts of the river system vary in size from 26 x 172 feet to 50 x 290 feet. Tanker barges carry a wide variety of liquid cargoes into the state. Their capacities can hold up to 3,000 net tons, about 907 thousand gallons, depending on the type of liquid cargo. Deck barges vary greatly in size throughout the river system. Most of those on the Minnesota portion of the river are the same size as jumbo hopper barges. They move sand, gravel and aggregates. There are two basic categories (and many sizes) of towboats used to push the barges on the river system. The categories are: 1) switch or harbor boats (shown in figure 4.2), and 2) line haul boats (shown in figure 4.3). The switch boats, function similar to switch engines on the railroads. Line haul boats make the long intercity runs. Towboats are generally expressed in engine sizes. Switch boats have 200 to 1,200 horsepower propulsion units while Upper Mississippi River line haul boats have up to 6,500 horsepower. On the portions of the river system, that have locks to negotiate, the line haul boats are generally 2,500 to 5,000 horsepower. These boats push tows of 15 barges with a total capacity of 23,625 tons. On the Lower Mississippi River below St. Louis, where there are no locks, towboats are larger, with engine systems up to 10,000 horsepower. They push tows of up to 45 barges with over 70,000 tons of capacity. Tables 4.3 and Figure 4.4 show how their cargo capacity compare to other freight transportation modes, and compare fuel efficiencies as well. 22

27 4.4 Terminals Freight movement on the river would be impossible without terminals to transfer cargo between land and water transportation systems. Most river terminals handle one type of cargo such as grain, fertilizers, aggregates, petroleum products, or coal. Other terminals handle commodities ranging from large bulk cargoes to smaller shipments of finished goods. All terminals have specialized equipment for transferring commodities. Most of them also provide specialized inside and outside storage facilities. 23 Figure 4.1 River Vessels


28 Minnesota has 38 active river terminals. River port areas and terminal locations in Minnesota are shown on Maps 3.1 through3.3 in Chapter 3. Tables 4.4 through 4.6 show the geographic distribution of cargoes handled by and capacities for Minnesota s river terminals. Grain Ten river terminals handle grain, which accounted for 58 percent of the state s river freight tonnage in Grains produced in Minnesota and the Dakotas make up most of the cargo shipped out of state on the river system each year. Most grain transfer activity in Minnesota occurs in St. Paul, Savage and Winona. River terminals also account for the greatest share of the total grain export movement from Minnesota. River terminals are important for moving grain and other farm products. Figure 4.2 Switch Boat Liquid Bulk Liquid bulk terminals handle a variety of products including petroleum, molasses, liquid fertilizers, anhydrous ammonia, and caustic soda. In 1999, Minnesota s river terminals handled about 352,000 tons of liquid products other than petroleum. All of this product movement took place in double-hulled tank barges in order to prevent any spillage. Ever since the Oil Pollution Act of 1990, petroleum movement by barge to and from Minnesota has reduced drastically. Shippers and carriers did not want to expose themselves to the increased liability limits described in the act. Prior to the act, petroleum movement by barge in Minnesota exceeded one million tons annually. The total river petroleum movement in 1999 was about 166,000 tons. Most of the petroleum produced by Minnesota s refineries is being moved by truck and pipeline. Non-Grain Dry Bulk Terminals Figure 4.3 Line Haul Towboat Comparative Fuel Efficiency Freight Hauling Modes Mode BTU s/ton Mile Ton-Miles/Gallon Barge Rail Truck 2, Table 4.4 Twenty-eight river terminals in Minnesota handle non-grain dry bulk product including fertilizers, salt, coal, clam shells, sand, gravel and cement. Fertilizer is a major dry bulk cargo handled by ten terminals. Fertilizer moves both upbound and downbound on Minnesota s rivers, and includes southern U.S. and Canadian products. Over half of the fertilizer used by Minnesota farmers comes into the state by barge. In 2000, over 1.3 million tons of fertilizer arrived by river barge. 24
29 Principal Commodities Shipped and Received in 1999 Minnesota s Active Terminal, River Locations by Commodities Commodity Mississippi Minnesota Total General Cargo Coal & Coke Aggregates, cement Petroleum Grain/ Ag Products Fertilizers Molasses/liquid bulk Salt Misc. Dry Table 4.5 Terminals Which Handle Only One Type of Commodity Terminal River Location Commodity Mississippi Minnesota Total Coal and Coke Grain Sand, Gravel, Cement Fertilizer Products Petroleum Products General Cargo Table 4.6 General Cargo Minnesota s River Terminal Capacity (Short Tons) Grain and other farm and food products 26,581,000 Ores, minerals, sand, gravel and cement 12,814,000 Coal 33,654,000 Crude Petroleum 3,481,000 Chemicals including fertilizer 16,052,000 Petroleum products 32,591,000 General cargo 4,745,000 Scrap 1,927,000 Total 131,845,000 Table 4.7 Five river terminals in Minnesota handle general cargo products such as scrap iron, slag, and manufactured steel products, twine, paper, rolled steel and newsprint. The Mid America Ports Study, conducted by the Maritime Administration and twenty-one states on the central river system, determined that Minnesota s river terminals have an annual cargo capacity of nearly 132 million tons. 25
30 26
31 5.1 Historic Commodity Movement Since the mid 1930 s, freight volumes on the nation s rivers have shown steady growth. (Ref. Table 3.1) Minnesota s growth pattern has been even stronger. There have been dips over the years due to national economic conditions, droughts, floods and even an embargo in In 1940, according to the U.S. Army Corps of Engineers statistics, 2,125,264 net tons of freight moved through Lock and Dam 26 at Alton, Illinois, which was the beginning of the Upper Mississippi locking river system at that time. In 1999, lock 26 handled 77,580,836 net tons. That s an average annual increase of over 1.2 million tons per year over 60 years. In 1940, River freight in Minnesota amounted to 975,000 net tons and grain shipments totaled 4,720 net tons. In 1999 Minnesota s river freight tonnage came to 17,734,166 net tons, and our grain tonnage 10,269,754 net tons. In 1940, Minnesota was a net importing state with coal and petroleum being the main imports. Very little was exported from the state. Today, Minnesota is a net exporting state via the river, and grain is the main commodity. In 1999, Minnesota received just less than 6 million tons of freight by river and exported just under 12 million tons of freight. Minnesota s record year for grain movement by river occurred in 1983, when about 12.8 million tons were shipped. A drought that year in Illinois and Iowa factored into the total. Grain movements demonstrate the large drawing area of the river. Although the river carries over 60% of the grain raised for export in Minnesota, that volume alone would not account for the State s total grain movement. The river draws grain shipments to Minnesota s terminals from both of the Dakotas, western Wisconsin and northern Iowa. Map 5.1 shows the upper river s agricultural production area. Map 5.2 shows the flow patterns of grain into the three major terminal areas and the split of rail and truck carriage to the terminals. In addition to the movement of grain, the river serves the Midwest Map 5.1 Agricultural Production AreaFor Minnesota s River Terminals agricultural area by carrying fertilizer, grain by-products and feed pellets. Although cargo levels in those commodities are not great, they, too, show steady growth over recent years Freight Movements on Minnesota s Rivers
32 A major element on Minnesota s river freight growth is grain. As is shown in Table 5.2, Minnesota s river terminals have accounted for an average of nearly 11% and as much as 15% of the total export grain volumes from all of the Gulf s Coast ports. Those numbers take on even more importance when the Gulf s share of the national grain export volume is considered. During the last 20 years, Gulf Coast export terminals have accounted for an average of nearly 65% of the national export grain movement. This means Minnesota s river grain shipments account for nearly 7% of the nation s total grain export. River Freight Tonnage (1,000 of tons)* Year Mississippi River* Minnesota** % of Mississippi ,569 13, ,852 14, ,497 19, ,149 15, ,440 18, ,731 11, ,673 13, ,421 14, ,711 16, ,876 15, ,741 16, , ,304 Source: U.S. Dept of Agriculture ** Source: Minnesota s River Terminals Table 5.1 Grain (000 s bushels) Year Minnesota s % Gulf Gulf Coast %National River Shipments Exports Exports* Exports , ,909, , ,249, , ,668, , ,696, , ,898, ,503* 6.1 2,669, , ,294, , ,952, , ,879, , ,491, , ,443, , ,940, , ,895, Source: U.S. Dept of Agriculture ** Source: Minnesota s River Terminals (Using 34.5 bushels of grain = 1 net ton *Flood year From 1990 forward, grain shipment data was received directly from River Elevator Terminals. Prior to 1990, grain figures were received from the Minneapolis Grain Exchange. Table 5.2 Grain Movements to Minnesota s River Ports (Via Truck and Rail) The purpose of this chart is to show changes in the percentage of grain moving to the river ports by truck versus rail. It appears that as rail consolidates to 50, 75 and 100 car unit trains for long distance hauling, trucks are delivering an increasing percentage of grain to the River. This will put more wear and tear on truck routes to the river. 28
33 (The figures are shown in bushels) Year Truck Railroad Total % By Truck ,252, ,509, ,710,000 64% ,348,000 99,761, ,109,000 71% ,348, ,496, ,022,000 65% ,506,000 95,806, ,312,000 65% ,633,000 54,111, ,744,000 73% ,727,000-5,068, ,659, % ,043,000 37,304, ,374,000 88% ,375,000 39,427, ,802,000 87% ,250,000 22,783, ,033,000 92% ,444,000 37,367, ,811,000 89% * The Minneapolis Grain Exchange generated these figures 5.2 Commodity Forecasts Over the last 25 years, a number of studies have been made which include forecasts of river freight tonnage. They included national, regional and local analysis ranging from major efforts like the National Waterways Study to individual port projections. Several have dealt with the entire Upper Mississippi River including the Mississippi Master Plan, the Mid America Ports Study, and National Waterway Study and the Corps of Engineers year round navigation study. Currently and since 1993, the Corps of Engineers has been studying the infrastructure needs of the Upper Mississippi and Illinois Rivers. This has been a $50 million plus project involving environmental issues as well as the needs of the lock and dam system on both rivers. The difficulty of the study is that it is attempting to project traffic levels over the next fifty years. As of this printing the Corps is expected to make a preliminary revised forecast by September This will be subject to public and federal government review before any legislative action is taken to fund any projects. Following are exhibits, 32 and 33, which are the revised forecasts that are presently being reviewed by the Corps of Engineers. These show all of the commodity groups. In much of the study, the Corps has contracted with outside consultants to make commodity forecasts. The next two pages (exhibit 38 and 39) show the original aggregate forecast range and the revised estimates due to the slow grain markets of the past several years. All four pages were taken directly from the Corps of Engineers revised freight flow forecasts. (The next four pages will show Corps of Engineers exhibits 32, and 39) 29
34 Exhibit 33 Waterway Traffic Forecasts: Illinois Waterway Prepared Iron Agricultural Animal Coal Industrial Petroleum Construction and Total Year Corn Soybeans Wheat Chemicals Feed and Coke Chemicals Products Materials Steel Other Forecast Thousands of Tons avg 11,960 3, ,620 1,939 7,800 3,990 5,526 2,134 2,233 2,882 44, ,092 4, ,379 1,951 7,000 4,167 6,008 2,234 2,582 3,335 45, ,172 4, ,377 2,057 6,900 4,514 6,293 2,371 2,709 3,571 50, ,073 4, ,372 2,138 7,000 4,854 6,481 2,506 2,853 3,768 53, ,506 4, ,371 2,236 7,000 5,181 6,597 2,615 3,018 3,940 56, ,677 5, ,370 2,331 7,100 5,494 6,698 2,712 3,188 4,112 58, ,668 5, ,368 2,423 7,200 5,807 6,791 2,810 3,363 4,289 60, ,525 5, ,367 2,512 7,400 6,273 6,842 3,019 3,503 4,497 63, ,282 5, ,366 2,599 7,500 6,739 6,865 3,241 3,647 4,706 65, ,959 5, ,366 2,683 7,700 7,205 6,864 3,481 3,793 4,928 67, ,571 5, ,363 2,765 7,900 7,672 6,838 3,740 3,942 5,151 69, ,130 6, ,363 2,845 8,000 8,138 6,789 4,018 4,092 5,363 71,730 Percent of Total Traffic avg 27.02% 8.79% 0.65% 3.66% 4.38% 17.62% 9.01% 12.48% 4.82% 5.04% 6.51% % % 10.05% 1.11% 3.01% 4.25% 15.26% 9.09% 13.10% 4.87% 5.63% 7.27% % % 9.49% 1.09% 2.74% 4.09% 13.72% 8.98% 12.52% 4.72% 5.39% 7.10% % % 8.83% 1.10% 2.57% 4.01% 13.12% 9.10% 12.15% 4.70% 5.35% 7.06% % % 8.86% 1.10% 2.45% 3.99% 12.49% 9.24% 11.77% 4.67% 5.38% 7.03% % % 8.87% 1.12% 2.34% 3.98% 12.13% 9.39% 11.44% 4.63% 5.45% 7.03% % % 8.86% 1.13% 2.25% 3.99% 11.84% 9.55% 11.17% 4.62% 5.53% 7.05% % % 8.79% 1.15% 2.16% 3.97% 11.70% 9.92% 10.82% 4.78% 5.54% 7.11% % % 8.74% 1.17% 2.09% 3.97% 11.46% 10.30% 10.49% 4.95% 5.57% 7.19% % % 8.66% 1.19% 2.02% 3.97% 11.38% 10.65% 10.15% 5.15% 5.61% 7.29% % % 8.58% 1.21% 1.95% 3.96% 11.32% 10.99% 9.80% 5.36% 5.65% 7.38% % % 8.52% 1.23% 1.90% 3.97% 11.15% 11.34% 9.47% 5.60% 5.70% 7.48% % Average Annual Percentage Change % 2.46% 7.37% -1.99% -0.47% -1.34% 0.55% 1.05% 0.57% 1.83% 1.84% 1.84% % 0.69% 1.54% -0.03% 1.01% -0.29% 1.61% 0.93% 1.20% 0.96% 1.38% 1.38% % -0.26% 1.21% -0.07% 0.75% 0.29% 1.46% 0.59% 1.11% 1.04% 1.08% 1.08% % 1.08% 1.16% -0.01% 0.87% 0.00% 1.31% 0.35% 0.86% 1.13% 0.90% 0.90% % 0.88% 1.10% -0.01% 0.80% 0.28% 1.18% 0.31% 0.73% 1.10% 0.86% 0.86% % 0.74% 1.07% -0.03% 0.74% 0.28% 1.11% 0.28% 0.71% 1.07% 0.85% 0.85% % 0.64% 1.05% -0.01% 0.70% 0.55% 1.56% 0.15% 1.45% 0.82% 0.95% 0.95% % 0.56% 1.03% -0.01% 0.66% 0.27% 1.44% 0.07% 1.43% 0.81% 0.91% 0.91% % 0.49% 1.00% 0.00% 0.62% 0.53% 1.35% -0.01% 1.44% 0.79% 0.92% 0.92% % 0.44% 0.96% -0.04% 0.58% 0.51% 1.26% -0.07% 1.45% 0.77% 0.89% 0.89% % 0.40% 0.91% 0.00% 0.55% 0.25% 1.19% -0.14% 1.44% 0.75% 0.81% 0.81% 30
35 Exhibit 33 Waterway Traffic Forecasts: Illinois Waterway Prepared Iron Agricultural Animal Coal Industrial Petroleum Construction and Total Year Corn Soybeans Wheat Chemicals Feed and Coke Chemicals Products Materials Steel Other Forecast Thousands of Tons avg 27,611 8,637 1,567 4,567 3,480 9,200 3,356 5,917 5,884 2,421 7,665 80, ,553 10,526 2,892 3,998 3,545 9,700 3,440 5,972 5,628 2,831 9,016 85, ,572 10,893 3,122 4,002 3,736 9,900 3,717 5,983 5,888 2,957 9,717 94, ,902 10,752 3,315 4,008 3,884 9,900 3,989 5,976 6,144 3,100 10, , ,168 11,345 3,512 4,014 4,063 9,600 4,252 5,952 6,350 3,265 10, , ,837 11,854 3,709 4,018 4,235 9,900 4,503 5,927 6,531 3,435 11, , ,093 12,300 3,911 4,021 4,402 10,100 4,754 5,902 6,719 3,610 11, , ,048 12,697 4,120 4,027 4,564 10,300 5,129 5,878 7,100 3,749 12, , ,772 13,054 4,337 4,031 4,721 10,600 5,504 5,826 7,507 3,892 12, , ,314 13,380 4,557 4,034 4,875 10,800 5,879 5,746 7,943 4,038 13, , ,709 13,678 4,780 4,039 5,024 11,100 6,254 5,637 8,409 4,187 14, , ,983 13,954 5,002 4,041 5,168 11,400 6,629 5,502 8,908 4,336 14, ,627 Percent of Total Traffic avg 34.38% 10.76% 1.95% 5.69% 4.33% 11.46% 4.18% 7.37% 7.33% 3.01% 9.55% % % 12.37% 3.40% 4.70% 4.17% 11.40% 4.04% 7.02% 6.61% 3.33% 10.59% % % 11.53% 3.30% 4.24% 3.95% 10.48% 3.93% 6.33% 6.23% 3.13% 10.28% % % 10.73% 3.31% 4.00% 3.88% 9.88% 3.98% 5.96% 6.13% 3.09% 10.22% % % 10.78% 3.34% 3.82% 3.86% 9.12% 4.04% 5.66% 6.04% 3.10% 10.16% % % 10.76% 3.37% 3.65% 3.85% 8.99% 4.09% 5.38% 5.93% 3.12% 10.15% % % 10.74% 3.42% 3.51% 3.85% 8.82% 4.15% 5.16% 5.87% 3.15% 10.20% % % 10.68% 3.47% 3.39% 3.84% 8.67% 4.32% 4.95% 5.97% 3.15% 10.30% % % 10.61% 3.52% 3.27% 3.84% 8.61% 4.47% 4.73% 6.10% 3.16% 10.43% % % 10.53% 3.59% 3.18% 3.84% 8.50% 4.63% 4.52% 6.25% 3.18% 10.59% % % 10.45% 3.65% 3.09% 3.84% 8.48% 4.78% 4.31% 6.42% 3.20% 10.76% % % 10.36% 3.72% 3.00% 3.84% 8.47% 4.92% 4.09% 6.62% 3.22% 10.92% % Average Annual Percentage Change % 2.87% 7.96% -1.65% -0.31% 0.66% 0.31% 0.12% -0.55% 1.97% 2.05% 2.05% % 0.69% 1.54% 0.02% 1.01% 0.41% 1.56% 0.04% 0.91% 0.87% 1.51% 1.51% % -0.26% 1.21% 0.03% 0.75% 0.00% 1.43% -0.02% 0.85% 0.95% 1.05% 1.05% % 1.08% 1.16% 0.03% 0.87% -0.61% 1.28% -0.08% 0.66% 1.04% 0.86% 0.86% % 0.88% 1.10% 0.02% 0.80% 0.62% 1.15% -0.09% 0.56% 1.02% 0.90% 0.90% % 0.74% 1.07% 0.01% 0.74% 0.40% 1.09% -0.08% 0.57% 1.00% 0.88% 0.88% % 0.64% 1.05% 0.03% 0.70% 0.39% 1.53% -0.08% 1.11% 0.76% 0.95% 0.95% % 0.56% 1.03% 0.02% 0.66% 0.58% 1.42% -0.18% 1.12% 0.75% 0.97% 0.97% % 0.49% 1.00% 0.01% 0.62% 0.37% 1.33% -0.28% 1.14% 0.74% 0.94% 0.94% % 0.44% 0.96% 0.02% 0.58% 0.55% 1.24% -0.38% 1.15% 0.73% 0.92% 0.92% % 0.40% 0.91% 0.01% 0.55% 0.53% 1.17% -0.49% 1.16% 0.70% 0.86% 0.86%
36 120, ,000 80,000 60,000 40,000 20,000 - Illinois River (Thousands of Tons) Original Low High Revised 32
37 180, , , , ,000 80,000 60,000 40,000 20,000 - Twin Cities to St. Louis (Thousands of Tons) Medium Low High 33
38 Note Page


39 6.1 Passenger Traffic In the middle of the 19th century, riverboats provided the fastest and most comfortable, if not the safest, means of travel in the rapidly growing Midwest. With the completion of the vast midwestern rail system, that situation changed dramatically. By 1910 passenger boats on the river system had become mostly providers of entertainment. Today the movement of passengers is increasing again as a vacation and entertainment function. In recent years, large cruise boats, such as the Delta Queen, have increased the number of visits they make to the City of St. Paul, In 2000, The Delta Queen, the Mississippi Queen and the American Queen made a combined total of ten visits to St. Paul. The city estimates that each visit generated an immediate economic benefit to the community of $500,000. Although such large cruise boats carry excursion passengers long distances, most of the upper river passenger activity is limited to day excursions. River excursion boats in Minnesota are based in Minneapolis, St. Paul, Red Wing, Lake City and Winona on the Mississippi and in Stillwater and Taylors Falls on the St. Croix. Some of Minnesota s larger inland lakes and the Duluth harbor also support excursion boats of various sizes. Interest on the Great Lakes is also increasing. Local river excursion boats carry nearly a quarter of a million passengers each season in Minnesota. The Padelford Packet Boat Company in St. Paul alone accounts for over 100,000 passengers annually. At least half of them come from outside the metropolitan area, which creates additional economic benefit to the community. Figure 6.1 Short Term Tour Boat The U.S. Coast Guard is responsible for the safety of passenger vessels on navigable waters of the United States. Ships for hire as passenger boats on those waters must pass rigid inspections. Others, which operate on inland lakes, are not required to get Coast Guard certification but must comply with similar Figure 6.2 Long Term Tour Boat state regulation. Others, which are hired as boats without crews and are manned by the renter, are not subject to Coast Guard registration. Fishing boats for rent fall into the latter category Other River Uses The U.S. Coast Guard Marine Safety Detachment in St. Paul has certified 29 vessels to carry passengers from Minnesota ports on the Mississippi and St. Croix Rivers. Those vessels provide accommodations for short trips as well as overnight movements. The majority of the trips are the short "scenic tour" half-day runs. Table 6.1 lists the vessels, which operate from Minnesota River port cities. In addition, there are 20 other forhire passenger boats operation out of Wisconsin and Iowa cities in the St. Paul Corps of Engineers District. Figures 6.1 and 6.2 show typical short and long-term tour boats.


40 A number of river passenger boats offer special entertainment packages such as dining and dancing as well as a river tour. One boat, the University of Minnesota Showboat, has served as a floating theater since 1958; it recently burned during remodeling, but is expected to be back on the river or replaced within the next two years. Passenger boat activity is expanding throughout the region. One relatively new feature is a day and dinner cruise boat operated by Treasure Island Casino near Red Wing, although gambling is not offered on the boat, as it is in Iowa, Illinois and other downriver states. Minnesota Based Passenger Vessels VESSEL CAPACITY HOME PORT & RIVER Mississippi Brass Belle 49 Rice, Mn/Mississippi Anson Northrop 350 Minneapolis/Mississippi Betsy Northrop 360 Minneapolis/Mississippi Jonathan Padelford 308 St. Paul/Mississippi Harriet Bishop 486 St. Paul/Mississippi Summer Breeze 25 St. Paul/Mississippi Magnolia Blossom 112 St. Paul/Mississippi Cruise Aweigh 49 St. Paul/Mississippi Taylors Falls Princess 250 Taylors Falls/St. Croix Taylors Falls Queen 150 Taylors Falls/St. Croix Andiamo 109 Stillwater/St. Croix Andiamo Showboat 150 Stillwater/St. Croix Empress Andiamo 500 Stillwater/St. Croix Jubilee 150 Stillwater/St. Croix Avalon 600 Stillwater/St. Croix Lady Chateau 125 Stillwater/St. Croix Afton Princess 150 Afton/St. Croix Sweet Afton 49 Afton/St. Croix Maggie 32 Red Wing/ Mississippi Spirit of the Water 150 Red Wing/ Mississippi * Information supplied by the U.S. Coast Guard, Marine Safety Detachment, St. Paul, Minn. Table Recreational Activities Recreational activity on Minnesota s rivers involves a great many people, many types of boats, a number of commercial activities and numerous public and private boat launching facilities. The season for recreational boating, except for that associated with fishing and hunting, runs generally from mid-april through the first part of October. A few hardy sailors venture out earlier and stay later but the majority of the activity occurs during the warmer weather. Types of recreational boats used on the river range from non-motorized canoes and fishing and hunting boats through sailboats, powered runabouts, houseboats and very large yachts. In addition, the river carries such unusual vessels as oar powered racing shells, high powered racing boats, jet skis and airboats. On any warm day all might be seen on parts of the river. Figures 6.3 and 6.4 show some of the types of recreational boats that use the river. Boaters, hunters and fishermen on Minnesota s commercially navigable rivers have access to many private and public launching sites, picnic 36 Figure 6.3 Recreational Boats Figure 6.4 Recreational Boats


41 and camping beaches, hunting areas and park facilities. Recreational use of the upper river amounts to over 12 million visitor-days per year and pumps $ 6.6 billion a year into the economy. Figure 6.5 Small Boat Launching Ramp There are 52 boat-launching ramps open to the public on the navigable portions of the Minnesota, St. Croix and Mississippi rivers within Minnesota. Twelve are operated by Minnesota DNR, 14 by local governments, five are managed cooperatively by local governments and DNR, 11 are operated by private enterprise, seven by the U.S. Fish and Wildlife Service, two by the Corps of Engineers and one by Minnesota DOT. There are and additional 59 boat launching ramps on the Wisconsin side of the St. Croix and Mississippi rivers. Boat launching ramps on the river range from simple sand access points with limited parking space to sophisticated concrete or bituminous ramps with sizeable parking facilities. Figure 6.5 shows one of the many kinds of public launching ramps in use on the river. Figure 6.6 Dredged Material Beach Figures 6.6 and 6.7 show typical unimproved beach sites and types and densities of use. Most of these sites are the product of Corps of Engineers dredged material disposal. Figure 6.8 shows a more improved launching ramp site used by boaters. Figure 6.7 Dredged Material Beach Although some of the larger recreational boats are moved around quite a bit and make use of the many launching ramps, most of them are kept in marinas. Marinas are an important recreational feature on rivers. There are 29 public and private marinas on Minnesota s portion of the navigable river system, along with another 16 on the Wisconsin side of the river. Marinas range in size from those with as few as 6 boat slips to facilities with as many as 600 slips. Services available to boaters also Figure 6.8 Improved Boat Launching Ramp 37 Other public recreational facilities used by boaters on Minnesota s navigable rivers include the many state, county and municipal park grounds and the wild river beaches. Boater and non-boaters use these parks for camping, picnicking, swimming, hunting and fishing, use these parks and beaches. Facilities available at the sites range from simple, unimproved beaches to very complete areas with docks, plumbing and lights.


42 cover a wide range from simple storage (both winter and summer) to fuel and food supply to large restaurants. Figures 6.9, 6.10 and 6.11 show some kinds of marinas found in Minnesota. Fishing and hunting are major recreational uses of the river. Along with canoeing, they are the more basic forms of recreational water activity. The Minnesota and Wisconsin DNRs and the U.S. Fish and Wildlife Service provide huge upland and backwater areas for all three activities in their refuge and park areas. The U. S. Corps of Engineers, through its pool maintenance activities, provides hundreds of thousands of fishable water acres. Figure 6.9 Marina Public and private river bottomlands provide over 185 thousand acres of hunting area, which give hunters opportunities to pursue upland birds, small game and deer. Hunters spend over 350 thousand person days each year in the river bottom forests. In addition, duck hunters spend over 275 thousand person days in the open water and backwater areas of the rivers. Much of the hunting activity involves small boats. Recreational fishing on the river continues to attract many local residents and non-residents alike. The fishery currently provides opportunities to catch and harvest numerous fish species including: bluegill, crappie, largemouth and small mouth bass, white bass, walleye, sauger, northern pike, channel and flathead catfish and sheep head. Markets for commercially harvested fish from the river, while much reduced since the 1960 s due to contamination concerns and an increase in large-scale aquaculture, are relatively stable and still provide a few anglers the opportunity to commercially harvest carp, buffalo, suckers, sheep head and catfish. Figure 6.10 Marina A relatively strong economy combined with an increasing population and a growing market for Figure 6.11 Marina large, fast boats has created user conflicts among and between anglers and recreational boating enthusiasts. Some of these larger crafts are also having a negative impact on ravine habitat and associated aquatic life. Reservoir aging and deterioration and loss of backwater habitat continue to concern resource management agencies. Efforts to restore large-scale hydrologic patterns, for which the health of this river system is dependent upon, are being planned and implemented. Small-scale backwater rehabilitation projects are also attempting to slow down the rate of habitat loss. Management agencies are increasingly being asked to focus more attention on developing stricter regulations concerning fish and wildlife harvest and recreational use. Exotic species of mussels, plants and fish, some of which have been introduced via commercial and recreational traffic, are threatening native populations and reducing biological diversity. Canoeists also have a variety of environments open to them on the Minnesota, St. Croix and Mississippi Rivers. They can follow the wide main channel or explore great backwater areas with treelined channels. Map 6.1 shows a portion of a canoe route map published by the Minnesota DNR. 38
43 Map 6.1 Lower Mississippi Canoe Routes Recreational boating on the commercially navigable rivers in Minnesota is one of the heaviest uses of this multi-use resource. All of the recreational craft, from the largest powerboat down to the smallest canoes, use the locks to move from pool to pool. As shown in Table 6.2, recreational lockage has outnumbered commercial lockage every year since In 1999 over 52% of the total (or 32,825 of 62,672) was non-commercial lockage in the St. Paul District (from Upper St. Anthony Falls Lock to Guttenberg, Iowa). Such heavy use has caused congestion on high use days. That has lead the Corps to set locking hours so that more small boats can use the locks without long waits. Another congestion reducing factor is the continuing increase in small boats per lockage. In 1999 the average number of small boats per lockage was 4. Table 6.3 shows the trend in that area since Figure 6.12 shows heavy weekend use of a lock by recreational boats and demonstrates the increasing density. All forecasts of recreational boat usage of the river system in Minnesota call for a continued increase in both their number and the time spent on the water. That, coupled with the forecasts for increased commercial tonnage has generated concern for potential problems in the future. Current programs such as set locking hours and increased numbers of boats per lockage might have to be expanded and other plans developed. Since 1985 there have been more recreational lockage in the St. Paul District than commercial lockage. The average number of recreational boats per lockage has also increased from 2.57 to 3.99 during the same period. 39
 30,626 (47%) 64,918 1985 27,645 (45%) 33,157 (55%) 60,802 1990 32,228 (47%) 36,841")
44 Lockage St. Paul District, Corps of Engineer Year Commercial Non Commercial Total & % Of total & % of total ,292 (53%) 30,626 (47%) 64, ,645 (45%) 33,157 (55%) 60, ,228 (47%) 36,841 (53%) 69, ,930 (45%) 35,827 (55%) 64, ,682 (47%) 34,105 (53% 64, ,188 (44%) 24,353 (56%) 43, ,631(36%) 39,597 (64%) 62, ,883 (41%) 36,549 (59%) 62, ,519 (45%) 33,490 (55%) 61, ,384 (44%) 32,102 (56%) 57, ,988 (45%) 34,652 (55%) 62, ,837 (48%) 32,835 (52%) 62, ,556 (43%) 35,065 (57%) 61,621 Figure 6.12 Recreational Boats in Lock * Flood year Table 6.2 Recreational Lockage Density St. Paul District Corps of Engineers 6.3 Commercial Enterprises Year Lockage Vessels Density ,445 69, ,105 80, , , , , , , ,652 61, , , , , , , , , , , , , , , * Flood Year There are a number of shore side businesses, which depend on the rivers Table 6.3 and river users. Some of them function as part of other river operations. For example, many of the bait sales-boat rental operations also have boat-launching ramps. Some of the larger marinas often have restaurants on the premises. That kind of operation and free standing boat and sporting goods shops, cafes and boat rental operations make up the retail portion of the river system s commercial enterprise population. Recreational boat building and repair is an important though small industry on the river. Much of the repair work and even some basic construction is done by the individual boat owner; but there are several commercial facilities, which provide those services. There are two seaplane facilities on Minnesota s portion of the river system and one on the Wisconsin side. Added to those public bases are many individual aircraft owners who base their planes on the river near their homes. An aircraft pontoon manufacturer also has a facility on the Mississippi River in the Twin Cities area. 40
Inland Waterway Navigation
 Inland Waterway Navigation Value of Inland Navigation As the sun rises over the Mississippi River a 15-barge tow slides slowly past the St. Louis Harbor and heads south to New Orleans where its cargo of
Waterways 1 Water Transportation History
 Waterways 1 Water Transportation History Water Transportation Propulsion History Human (oars, poles) - - 7,000-10,000 BC Wind (sails) - - 3,000 BC Steamboat invented - - 1787 AD First diesel-powered ship
Eric Thomas Benchmark River and Rail Terminals
 Eric Thomas Benchmark River and Rail Terminals CORBA s Mission The Central Ohio River Business Association (CORBA) is an alliance of businesses and industry engaged in river commerce on and along the Ohio
Bob Blocker Senior Vice President Sales and Customer Service American Commercial Lines
 Indiana Logistics Summit October 17, 2012 Bob Blocker Senior Vice President Sales and Customer Service American Commercial Lines 2 American Commercial Lines A Leading Inland Barge Transportation Company
total 2011 tonnage. The total value of Illinois domestic internal commodity movements was over $21.2 billion.
 Illinois The state of Illinois borders or contains over 1,000 miles of the inland waterway system. The state s western border is defined by 580 miles of the upper River. The Illinois Waterway flows for
to the Governors Ethanol Coalition Omaha, Nebraska July 17, 2002
 Remarks of Lynn M. Muench Vice President-Midcontinent Office of The American Waterways Operators 801 North Quincy Street, Suite 200 Arlington, VA 22203 (703) 841-9300 to the Governors Ethanol Coalition
INLAND WATERWAYS TRANSPORTATION: Our Competitive Advantage. Delbert R Wilkins Canal Barge Company Big River Moves Leadership Forum April 15, 2013
 INLAND WATERWAYS TRANSPORTATION: Our Competitive Advantage Delbert R Wilkins Canal Barge Company Big River Moves Leadership Forum April 15, 2013 INLAND WATERWAYS TRANSPORTATION: Our Competitive Advantage
America s Inland Waterways
 America s Inland Waterways Original prepared by Steve Little Crounse Corporation Modified by Chuck Knowles Kentucky Transportation Center America s Inland Waterways: An Inland Marine Highway for Freight
THE IMPORTANCE OF BARGE TRANSPORTATION FOR AMERICA'S AGRICULTURE. Jerry Fruin
 MN DEPT OF TRANSPORTATION 3 0314 00024 5042 Staff Paper Series Staff Paper P95-4 February 1995 THE IMPORTANCE OF BARGE TRANSPORTATION FOR AMERICA'S AGRICULTURE by Jerry Fruin CTS HE 595.F3 F78 1995 i Department
International Propeller Club
 International Propeller Club Merritt Lane Canal Barge Company President & CEO October 3, 2012 Agenda Brief description of Canal Barge Company Overview of industry issues Waterways story and advocacy for
Ingram Barge Company's test containers make dramatic arrival at America's Central Port
 Ingram Barge Company's test containers make dramatic arrival at America's Central Port by Dan Brannan, Content Director April 10 2015 10:00 AM Ingram Barge Company s test run of containers aboard a barge
U.S. Department of Transportation Maritime Administration
 U.S. Department of Transportation Maritime Administration Organization of American States Hemispheric Conference on Inland Ports, Waterways, and Dredging: Inland Transport as an Engine for Competitiveness
WATERWAYS: Working for America
 Robert J. Hu rt WATERWAYS: Working for America Andrew Riester Waterways Council, Inc. Global Greenship Conference September 18, 2009 Robert J. Hurt WATERWAYS: Working for America Waterways transportation
Economic Contribution of the US Tugboat,
 www.pwc.com/us/nes Economic Contribution of the US Tugboat, Towboat, and Barge Industry Economic Contribution of the US Tugboat, Towboat, and Barge Industry May 10, 2017 Prepared for the American Waterways
Infrastructure Framework
 Infrastructure Framework Infrastructure Impediment = Inefficiencies = Less Effective Transport Capacity = Higher Freight Rates = Lower Producer Returns = Lower Returns and Competitiveness = 2 Global Population
WATERWAYS: Vital to the Nation. The benefits provided by America s waterways spread far beyond commercial navigation.
 Who are the true beneficiaries of America s waterways? The Beneficiaries of America s Inland Waterways From recreational enjoyment to flood control, the pools and channels of our national inland waterways
AAPA PORT SECURITY SEMINAR & EXHIBITION July 16 18, 2008 HOUSTON, TX REGIONAL SECURITY INITIATIVES Mitch Smith Operations Director Port of South
 AAPA PORT SECURITY SEMINAR & EXHIBITION July 16 18, 2008 HOUSTON, TX REGIONAL SECURITY INITIATIVES Mitch Smith Operations Director Port of South Louisiana Table of Contents The Port of South Louisiana
WATERWAYS: Working for America
 Robert J. Hurt WATERWAYS: Working for America George G Leavell Wepfer Marine, Inc. Mississippi River Parkway Commission September 19, 2014 Robert J. Hurt WATERWAYS: Working for America Waterways transportation
PROJECTS. The KIPDA MPO s Central Location
 PROJECTS Freight The economy of the Louisville KY-IN) Metropolitan Planning Area MPA), similar to that of the United States as a whole, is largely dependent on the efficient, reliable, and safe movement
Review of Inland Navigation Needs: Shipper and Carrier Perspectives
 Transportation Research Board 2002 Annual Meeting Review of Inland Navigation Needs: Shipper and Carrier Perspectives Mark E. Stevens Ingram Barge Company United States Navigable Waterways System is an
AAPA Facilities Engineering Seminar & Expo
 AAPA Facilities Engineering Seminar & Expo Wade M. Battles New Orleans Nov 9, 2011 Opportunities for Port Growth Through Marine Highway Development ATKINS Who we are Global, full-service professional planning,
Ohio Maritime Study. Ohio Transportation Engineering Conference (OTEC) October 10, 2017 Columbus, OH
 October 10, 2017 Columbus, OH") Ohio Maritime Study Ohio Transportation Engineering Conference (OTEC) October 10, 2017 Columbus, OH Presentation Map Context the Great Lakes Region Ohio Maritime Transportation Study What Overview Comes
Ohio Maritime Study Ohio Transportation Engineering Conference (OTEC) October 10, 2017 Columbus, OH Presentation Map Context the Great Lakes Region Ohio Maritime Transportation Study What Overview Comes
TOPICS FOR TODAY S DISCUSSION
 1 TOPICS FOR TODAY S DISCUSSION 1 2 3 Why is the US transportation infrastructure so critical to local, state, and national economies? What is the maritime segment's contribution to local, state, and national
Central Minnesota. Regional Freight Profile
 Central Minnesota Regional Freight Profile Working DRAFT May 21 Minnesota Department of Transportation The purpose of the Central Regional Freight Profile is to document freight movement trends in the
vice ark Ser a#onal P N
 Na#onal Park Service Great lakes Fisheries Commission USGS Na#onal Great Rivers Research & Educa#on Center Species Maximum Size Food Source Fun Fact Bighead Silver Black Grass 110 lbs, 55 inches 100 lbs,
Ports and Waterways: Lifeline for U.S. Agriculture
 Ports and Waterways: Lifeline for U.S. Agriculture Ag Transportation Summit Steven L. Stockton, PE Director of Civil Works US Army Corps of Engineers 30 July 2013 US Army Corps of Engineers America s Future
WATERWAYS: Vital to the Nation. The benefits provided by America s waterways spread far beyond commercial navigation.
 WATERWAYS: Vital to the Nation The benefits provided by America s waterways spread far beyond commercial navigation. Who are the true beneficiaries of America s waterways? From recreational enjoyment to
Overview of the U.S. Inland Barge Industry
 Industry Overview Overview of the U.S. Inland Barge Industry The inland barge industry is a critical component of the U.S. supply chain Water transportation, which includes coastwise, inland, and lakewise
State Five Year Tonnage Trend. Shipping Tons Receving Tons Within Tons Total Tons
 U.S. ARMY CORPS OF ENGINEERS BUILDING STRONG 2015 State Quick Facts (Tons in Millions) Tons Shipped - 27.3 Tons Received - 6.7 Tons Shipped Within State - 4.9 Total Commerical Docks - 200 Total Value (billions)-
Testimony of. Steve Ebke, Chairman, Production & Stewardship Action Team National Corn Growers Association
 Testimony of Steve Ebke, Chairman, Production & Stewardship Action Team National Corn Growers Association The Economic Importance and Financial Challenges of Recapitalizing the Nation s Inland Waterways
GALVESTON DISTRICT DREDGING CONFERENCE
 GALVESTON DISTRICT DREDGING CONFERENCE October 24, 2012 TEXAS PORTS - VALUE TO THE NATION Col. Christopher W. Sallese Commander, Galveston District U.S. Army Corps of Engineers This briefing is USACE SNAPSHOT
U.S. Port and Inland Waterway Modernization Strategy: Options for the Future
 U.S. Port and Inland Waterway Modernization Strategy: Options for the Future Inland Waterways Users Board Meeting 66, Pittsburgh Jim Walker Navigation Branch HQ, USACE 6 June 2012 US Army Corps of Engineers
Transportation Consortium at the Center for Transportation February 14, 2014
 Transportation Consortium at the Center for Transportation February 14, 2014 Freight Planning for One Transportation System Marine Highways Kevin Schoeben Deputy Director Office of Planning and Programming
The Fertilizer Institute. Current Transportation Dynamics November 6, 2006 By Tom Williamson, Transportation Consultants Co.
 The Fertilizer Institute Current Transportation Dynamics November 6, 2006 By Tom Williamson, Transportation Consultants Co. Questions What will be the cost of fuel, insurance, taxes, and new transportation
Arkansas Transportation Report
 Arkansas Transportation Report January 2018 Arkansas River traffic up 3% in 2017 Despite a slow start in the spring, barge activity on the Arkansas River in 2017 reached its second-highest total in the
America s Central Port is the St. Louis region s only full-service, public intermodal port. The 1,200-acre mixed-use business campus offers
 America s Central Port is the St. Louis region s only full-service, public intermodal port. The 1,200-acre mixed-use business campus offers development-ready industrial sites, over 1.7 million square feet
Pacific Northwest Challenges and Opportunities
 Pacific Northwest Challenges and Opportunities Glenn Vanselow Pacific Northwest Waterways Association www.pnwa.net AAPA s Growth Opportunities for General Cargo and Shallow Draft Ports Seminar November
Arkansas Transportation Report
 Arkansas Transportation Report October 2017 Arkansas River traffic continues to make up ground Through the first eight months of 2017, barge activity on the Arkansas River continues to make up ground after
AGING AND FAILING INFRASTRUCTURE SYSTEMS: NAVIGATION LOCKS
 AGING AND FAILING INFRASTRUCTURE SYSTEMS: NAVIGATION LOCKS December 8, 2015; 1300 EST PREPARED BY: OPERATIONAL ANALYSIS DIVISION SCOPE The U.S. Department of Homeland Security/Office of Cyber and Infrastructure
Presentation to 2017 Annual Alabama Water Resources Conference. By: Larry Merrihew, Presdent Warrior-Tombigbee Waterway Association
 Presentation to 2017 Annual Alabama Water Resources Conference By: Larry Merrihew, Presdent Warrior-Tombigbee Waterway Association Alabama s Inland Navigable Waterways Alabama River Apalachicola Chattahoochee
American Patriot Holdings LLC & PPHTD Creating Inland Marine Innovation
 American Patriot Holdings LLC & PPHTD Creating Inland Marine Innovation November 10, 2017 Today s Agenda Discuss the planned Gateway container terminal in Plaquemines Parish Location advantages The key
Bayport, Texas August 27, 2012
 Panama Canal Stakeholder Working Group Bayport, Texas August 27, 2012 Texas Ports - VALUE TO THE NATION Col. Christopher W. Sallese Commander, Galveston District U.S. Army Corps of Engineers This briefing
Preparing for Post-Panamax Commodity Flows: Restructuring on Kentucky Waterways
 Preparing for Post-Panamax Commodity Flows: Restructuring on Kentucky Waterways Tim Brock Research Associate Kentucky Transportation Center Smart Rivers 2011 New Orleans, LA September 14, 2011 (Map Source:
Coal and the Waterways: The View from Washington
 Coal and the Waterways: The View from Washington Debra Calhoun, Senior Vice President/CEO, WCI September 19, 2017 National Coal Transportation Association 1 Waterways Council, Inc. s sole mission is to
Waterborne Commerce Statistics Center
 Waterborne Commerce Statistics Center Amy Tujague, Special Requests Project Manager Waterborne Commerce Statistics Center Navigation & Civil Works Decision Support Center USACE 30 March 2016 US Army Corps
The Impacts of Unscheduled Lock Outages
 The Impacts of Unscheduled Lock Outages Submitted to Prepared for: The National Waterways Foundation and The U.S. Maritime Administration Center for Transportation Research The University of Tennessee
Exploring Our Heritage
 Teacher Overview Ohio s natural water resources have played very important roles in the development of the state and nation. The Ohio River for example, has important significance to the development of
J.F. Brennan Co., Inc. FULL SERVICE MARINE CONTRACTOR Lock and Dam Construction Hydraulic Dredging & Dewatering Specialty Construction and Diving
 J.F. Brennan Co., Inc. FULL SERVICE MARINE CONTRACTOR Lock and Dam Construction Hydraulic Dredging & Dewatering Specialty Construction and Diving Brennan Marine Co., Inc. MARINE TRANSPORTATION SERVICES
RAIL COMMODITY FLOWS
 RAIL COMMODITY FLOWS. The major commodities handled by rail are bulk, with the exception of the automotive traffic. The following pages provide detailed information rail commodities in California, and
Appalachia s Coastal Port Partners, Gateways to Global Commerce
 Appalachia s Coastal Port Partners, Gateways to Global Commerce Jim Walker Director of Navigation Policy and Legislation American Association of Port Authorities November 13, 2013 American Association
SOUTHWEST LOUISIANA PORT NETWORK THE ENERGY CORRIDOR S PATH TO GROWTH & SUCCESS
 SOUTHWEST LOUISIANA PORT NETWORK THE ENERGY CORRIDOR S PATH TO GROWTH & SUCCESS BRIDGING THE DISTANCE The distance separating a buyer from a seller is sometimes minimal; other times, it s an ocean. The
PORT OF GREEN BAY Annual Report
 PORT OF GREEN BAY 2017 Annual Report 1 Message from the Director The Harbor Commission s 2015 strategic plan identifies strengths, weaknesses, opportunities and threats and assembles them into strategic
INLAND WATERWAYS INDUSTRY STUCTURE
 INLAND WATERWAYS INDUSTRY STUCTURE Kimberly Vachal,, Gene Griffin, and Jill Hough Upper Great Plains Transportation Institute North Dakota State University OVERVIEW Waterways in Multimodal Freight System
Economic Analysis. Appendix C: Lower Pool 2 Channel Management Study: Boulanger Bend to Lock and Dam No. 2
 Appendix C: Economic Analysis Lower Pool 2 Channel Management Study: Boulanger Bend to Lock and Dam No. 2 Pool 2: Boulanger Bend to Lock and Dam 2 C-1 Economic Analysis Introduction This analysis evaluates
Barkley L&D BUILDING STRONG
 U.S. ARMY CORPS OF ENGINEERS 2016 Quick Facts Barkley L&D BUILDING STRONG Commercial Lock Operations - 1,296 National Rank - 104 Short Tons (Thousands) - 7,248 National Rank - 84 Commodity Value (Millions)
Presentation to the Illinois Chamber of Commerce Infrastructure Committee on the Illinois Maritime Transportation System
 Presentation to the Illinois Chamber of Commerce Infrastructure Committee on the Illinois Maritime Transportation System Robert Ginsburg, Ph.D. Urban Transportation Center, UIC reginsb@uic.edu September
3.0 FREIGHT FLOW OVERVIEW
 3. FREIGHT FLOW OVERVIEW This analysis primarily uses IHS Global Insight s TRANSEARCH database and the Surface Transportation Board s Rail Waybill Sample. These datasets provide county-level data for freight
Position of the Upper Mississippi River Basin Association On Investment and Key Issues for Upper Mississippi River System Commercial Navigation
 Position of the Upper Mississippi River Basin Association On Investment and Key Issues for Upper Mississippi River System Commercial Navigation June 25, 2013 The Upper Mississippi River System (Upper Mississippi)
Gulf Intracoastal Waterway Value to the Nation
 Gulf Intracoastal Waterway Value to the Nation Jim Stark, GICA Executive Director jstark@gicaonline.com www.gicaonline.com GICA Mission..to ensure the Gulf Intracoastal Waterway is maintained, operated
US Navigation Program Overview
 US Navigation Program Overview For the ERDC and Dutch Ecoshape meeting Jim Walker Navigation Program Manager HQ, US Army Corps of Engineers 18 Jan 2011 US Army Corps of Engineers Recreation areas 376 M
7. FREIGHT TRANSPORTATION AND ECONOMIC CONDITIONS
 7. FREIGHT TRANSPORTATION AND ECONOMIC CONDITIONS Oklahoma s economy has become more diverse over the past few decades. Since the oil price collapse in the mid-1980s and the subsequent U.S. recessions,
Ohio Department of Transportation Ohio Statewide Freight Study/ Plan
 Ohio Statewide Freight Study/ Plan Ohio Planning Conference July, 2014 Statewide Freight Plan Purpose: To understand to the greatest detail possible, how Ohio s freight infrastructure is being utilized.
Arkansas Transportation Report
 Arkansas Transportation Report February 2017 Arkansas River traffic up nearly 16% in 2016 Despite continued declines reported in iron and steel shipments, food and farm products and petroleum products,
Failure to Act. Of current Investment Trends in. Airports, Inland Waterways, and Marine Ports. Infrastructure EXECUTIVE SUMMARY
 Failure to Act The economic impact Of current Investment Trends in Airports, Inland Waterways, and Marine Ports Infrastructure EXECUTIVE SUMMARY EXECUTIVE SUMMARY Air and waterborne transportation infrastructure
THE AMERICAN WATERWAYS OPERATORS ABOUT US
 THE AMERICAN WATERWAYS OPERATORS ABOUT US JOBS AND THE ECONOMY The American Waterways Operators is the national advocate for the U.S. tugboat, towboat and barge industry, which serves the nation as the
Harbor Maintenance Trust Fund
 Harbor Maintenance Trust Fund AAPA Harbors and Navigation Meeting Washington, DC Jeff McKee Navigation Branch HQ, USACE US Army Corps of Engineers August 27, 2012 Corps Navigation Mission Provide safe,
Chapter 3 Missouri Freight System
 Chapter 3 Missouri Freight System KEY POINTS One of the key products of this Missouri State Freight Plan is a defined Missouri freight network. This is the first time Missouri has had a defined freight
The Coal Institute Fall Education and Engineering Seminar
 INGRAM MARINE GROUP The Coal Institute Fall Education and Engineering Seminar OCTOBER 25, 2018 INGRAM MARINE GROUP OVERVIEW Ingram s Flagship M/V E. Bronson Ingram Nashville, TN What Makes Ingram Different
Louisiana Ports: The Industry that Drives all Others. Presented By: Paul G. Aucoin Executive Director, Port of South Louisiana
 Louisiana Ports: The Industry that Drives all Others Presented By: Paul G. Aucoin Executive Director, Port of South Louisiana Ports Impact Every Region of LA 1. Central Louisiana Regional Port 2. Avoyelles
US ARMY CORPS OF ENGINEERS ROCK ISLAND DISTRICT RIVER INFRASTRUCTURE
 US ARMY CORPS OF ENGINEERS ROCK ISLAND DISTRICT RIVER INFRASTRUCTURE Thomas Heinold Chief, Operations Division Rock Island District Clock Tower Building Rock Island, IL 61204 (309) 794-5401 15 FEB 2018
The Intermodal Connection to Rural America's Resources, Economic Development, and Sustainability
 The Intermodal Connection to Rural America's Resources, Economic Development, and Sustainability July 20, 2017 Libby Ogard Prime Focus LLC Freight Rail Overview Each American requires the movement of approximately
Barkley L&D U.S. ARMY CORPS OF BUILDING STRONG ENGINEERS
 Barkley L&D U.S. ARMY CORPS OF BUILDING STRONG ENGINEERS 2016 Quick Facts Commercial Lock Operations - 1,296 National Rank - 104 Short Tons (Thousands) - 7,248 National Rank - 84 Commodity Value (Millions)
A MODAL COMPARISON OF DOMESTIC FREIGHT TRANSPORTATION EFFECTS ON THE GENERAL PUBLIC EXECUTIVE SUMMARY. November 2007
 A MODAL COMPARISON OF DOMESTIC FREIGHT TRANSPORTATION EFFECTS ON THE GENERAL PUBLIC EXECUTIVE SUMMARY November 2007 Prepared by CENTER FOR PORTS AND WATERWAYS TEXAS TRANSPORTATION INSTITUTE 701 NORTH POST
U. S. Army Corps of Engineers Charleston District Overview
 U. S. Army Corps of Engineers Charleston District Overview Diane C. Perkins, AICP Charleston District Chief, Planning & Environmental Branch Diane.Perkins@usace.army.mil US Army Corps of Engineers General
U.S. ARMY CORPS OF ENGINEERS NAVIGATION MISSION: DREDGING OF CHANNELS AND WATERWAYS. Mark R. Pointon and Thomas M. Verna
 U.S. ARMY CORPS OF ENGINEERS NAVIGATION MISSION: DREDGING OF CHANNELS AND WATERWAYS Mark R. Pointon and Thomas M. Verna 1 OVERVIEW CIVIL WORKS PROGRAM NAVIGATION Mission Funding Assets / Infrastructure
The national public policy organization advocating a modern and well-maintained system of ports and inland waterways
 The national public policy organization advocating a modern and well-maintained system of ports and inland waterways America s Waterways - A Great Success Story - Attracts billions of dollars of investment
Transportation: Railroads B & O P & C PRR
 : Railroads B & O P & C PRR P & LE WM Choose one of the railroads. Use a variety of resources to find out as much as you can about the railroad and its relationship to the steelmaking industry: * identify
The Flood of 1993 resulted in catastrophic
 31 UNIVERSITIES COUNCIL ON WATER RESOURCES ISSUE 130, PAGES 31-35, MARCH 2005 The Upper Mississippi River Comprehensive Flood Damage Reduction Study: Taking a Fresh Look at an Old Problem on a Basin-Wide
St. Louis Regional Freightway Inland Marine Expo
 St. Louis Regional Freightway Inland Marine Expo Andrew Schimpf, P.E. Operations Manager, Rivers Project St. Louis District 23 May 2018 US Army Corps of Engineers US Army Corps of Engineers St. Louis District
Missouri Freight Transportation Economy on the Move. Waterway Freight. Missouri Economic Research and Information Center
 Missouri Freight Transportation Economy on the Move Waterway Freight Waterway Industry Missouri is home to 14 public Port Authorities and over 200 private ports operating on over 1,000 miles of waterways
Environmental Law and Railroads
 Environmental Law and Railroads September 12, 2007 Suzanne Echevarria Case Study in Non-Compliance Railroad worker was responsible for every detail of the safe and efficient maintenance and construction
UNDERSTANDING THE GLOBAL IMPACT OF INCREASED WATERWAY COMMERCE. Bruce Lambert Executive Director, Institute for Trade and Transportation Studies
 UNDERSTANDING THE GLOBAL IMPACT OF INCREASED WATERWAY COMMERCE Bruce Lambert Executive Director, Institute for Trade and Transportation Studies Does Waterway Commerce: Improve system efficiency Encourage
Other Beneficiaries of Inland Navigation Projects
 Other Beneficiaries of Inland Navigation Projects A presentation to the Inland Waterway Users Board December 15, 2009 New Orleans, Louisiana Larry G. Bray, Ph.D. Infrastructure and funding Number of facilities
State Five Year Tonnage Trend. Shipping Tons Receving Tons Within Tons Total Tons
 U.S. ARMY CORPS OF ENGINEERS BUILDING STRONG 2015 State Quick Facts (Tons in Millions) Tons Shipped - 234.4 Tons Received - 201.9 Tons Shipped Within State - 74.7 Total Commerical Docks - 430 Total Value
HUMAN GEOGRAPHY. By Brett Lucas
 HUMAN GEOGRAPHY By Brett Lucas TRANSPORTATION GEOGRAPHY Overview Transportation Modes Shipping/Maritime Railroads Highway Aviation Modeling Transportation Transportation Enables all other economic activity
USDA s Perspective on Agricultural Transportation Priorities
 Bruce Blanton Director, Transportation Services Division USDA s Perspective on Agricultural Transportation Priorities Ag Transportation Summit August 4, 2015 Rosemont, IL Why Are We At This Summit? Transportation
Analyst: Meilin C. Pierce Spring Recommendation: Hold Target Stock Price (12/31/2016): $120
: $120") Recommendation: Hold Target Stock Price (12/31/2016): $120 1. Reasons for the Recommendation My recommendation is to hold Union Pacific Corporation (UNP) because my forecast shows that the stock is currently
Recommendation: Hold Target Stock Price (12/31/2016): $120 1. Reasons for the Recommendation My recommendation is to hold Union Pacific Corporation (UNP) because my forecast shows that the stock is currently
Port Partnerships Strategic Opportunities for Gateway & Closer Market Ports to Work Together Presented by Rainer Lilienthal General Manager-Trade
 Port Partnerships Strategic Opportunities for Gateway & Closer Market Ports to Work Together Presented by Rainer Lilienthal General Manager-Trade Development Port of Houston Overview The Port of Houston
Enjoy your. You are traveling through the Houston Ship Channel, a 52-mile, man-made wonder that connects Houston to the Gulf of Mexico.
 Enjoy your SAME Welcome 2015 JETC 2 0 to one of the nation s busiest industrial seaports. Each year, an average of 7,700 ship calls are made at the 1 Port of Houston, carrying everything from petroleum
2.00 PURPOSE AND NEED FOR ACTION Project Area
 2.00 PURPOSE AND NEED FOR ACTION 2.01 Project Area The project area is located in Chatham County, Georgia, and Jasper County, South Carolina. These counties lie in the Coastal Plain physiographic province
Waterways Dredging and Operational Improvements
 Waterways Dredging and Operational Improvements Bruce Lambert Institute of Water Resources US Army Corps of Engineers Outline Role of Inland Navigation System in U.S. Overview of Dredging in U.S. Current
TRANSPORTATION COSTS OF FERTILIZER USED IN MINNESOTA. by Jerry E. Fruin and Richard Levins. Department of Agricultural and ~pplied Economics
 staffpapersseries Staff Paper P79-5 February 1979 TRANSPORTATION COSTS OF FERTILIZER USED IN MINNESOTA by Jerry E. Fruin and Richard Levins Department of Agricultural and ~pplied Economics (Jniwrsity O(
SUSTAINABLE SOLUTIONS FOR DREDGED MATERIAL MANAGEMENT IN OHIO
 SUSTAINABLE SOLUTIONS FOR DREDGED MATERIAL MANAGEMENT IN OHIO Western Dredge Association Midwest Chapter Omaha, Nebraska Friday, March 10, 2017 David Emerman, Ohio EPA/Ohio Lake Erie Commission James White,
Richard Teubner, Vice President INTRODUCTION TO SEACOR AMH
 Richard Teubner, Vice President INTRODUCTION TO SEACOR AMH OVERVIEW SEACOR AMH is part of SEACOR Holdings Inc. Inland River Services (SCF). SEACOR Holdings (NYSE:CKH) and its subsidiaries are in the business
Please Do Not Copy or Distribute. Visit: for all the latest updates!
 Please Do Not Copy or Distribute Visit: www.nears.org for all the latest updates! The Port of Baltimore The Maryland Port Administration NEARS North East Association of Rail Shippers April 2013 Over 300
APPENDIX B COMMODITY FLOWS NOVEMBER 2018 DRAFT
 APPENDIX B COMMODITY FLOWS NOVEMBER 2018 DRAFT 2 CURRENT COMMODITY FLOWS IN THE BIRMINGHAM REGION A commodity flow analysis for a region allows for an understanding of which commodities generate a significant
Protecting AMERICA S SHIP CHANNEL
 Port-wide Strategic Security Council Protecting AMERICA S SHIP CHANNEL Lower Mississippi River: Baton Rouge to the Gulf Edward (Ned) Peak, PE TRB Harbor Safety Committee, 5/14/08 Port-wide Strategic Security
SEDIMENT CHOREOGRAPHY
 Global Reach. Local Benefit. SEDIMENT CHOREOGRAPHY 4/15/2016 Maritime and the Regional Economy The Port of Cleveland spurs job creation and helps our region compete globally by connecting local businesses
Intermodalism -- Metropolitan Chicago's Built-In Economic Advantage
 May 1, 2015 Intermodalism -- Metropolitan Chicago's Built-In Economic Advantage CMAP's regional economic indicators microsite features key measures of metropolitan Chicago's economy and, where applicable,
Marine Transportation System Travel Time Atlas
 Marine Transportation System Travel Time Atlas Patricia DiJoseph, PhD Coastal & Hydraulics Lab U.S. Army Engineer Research and Development Center Harbors & Navigation Committee Meeting AAPA March 30-31,