MANUFACTURING GROWTH REBOUNDS
|
|
|
- Claude Johns
- 6 years ago
- Views:
Transcription


1 A. Gary Anderson Center for Economic Research For Release: Contact: Raymond Sfeir Professor of Economics and Research Fellow (714) MANUFACTURING GROWTH REBOUNDS ORANGE, CA According to a survey of purchasing managers, the California manufacturing economy is expected to grow at a faster pace in the second quarter of 2016 compared to the first quarter. The California Composite Index, measuring overall manufacturing activity, increased from 56.7 in the first quarter to 58.3 in the second quarter, indicating expansion but at a faster pace. This increase in the growth rate follows three consecutive quarterly slowdowns in the growth rate of the manufacturing sector. Production and new orders are expected to grow at a higher growth rate compared to the first quarter, while employment is expected to increase at a lower rate. Commodity prices are expected to reach the highest rate of increase since the fourth quarter of 2014.
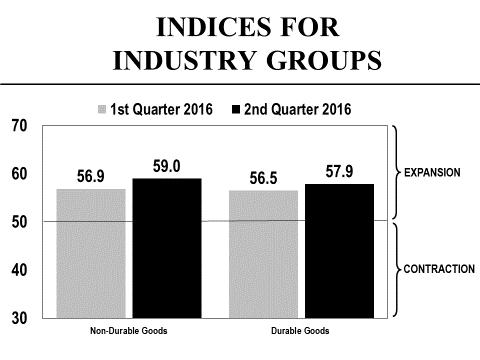
2 California Manufacturing at a Glance Composite Index 58.3 Growing at a higher rate Production 65.3 Growing at a higher rate Inventories of 53.7 Growing at a higher rate purchased materials Commodity prices 61.5 Growing at a higher rate Supplier deliveries 50.5 No change New orders 60.6 Growing at a higher rate Employment 53.2 Growing at a lower rate Performance by Industry Group The index for the non-durable goods industries registered 59.0 in the second quarter of 2016 compared to 56.9 in the first quarter, indicating a higher growth rate. Production, inventories of purchased materials and new orders are expected to grow at a higher rate, while employment is expected to grow at a lower rate. Commodity prices are expected to be higher. The index for the durable goods industries registered 57.9 in the second quarter of 2016 compared to 56.5 in the first quarter, indicating a higher growth rate. Production and inventories of purchased materials are expected to grow at a higher rate, but employment is expected to grow at a lower rate compared to the first quarter. Commodity prices are expected to be higher. Comments by the Purchasing Managers Spring usually sees increased activity in food service and retail for us, the second quarter is second busiest for us typically. (Food) Because of the social unrest we are seeing nationally we are experiencing a dramatic increase in the demand for our wooden nightsticks and riot batons on all levels, federal, state and local agencies. (Wood Products) Paper, which is our largest raw material, just had an increase of about 6%. That will impact overall pricing. Demand remains stable coming into what is seasonally typically a slower quarter. Expect demand to remain stable into June. (Paper) Ballot printing for the primaries result in higher numbers in all of the above mentioned areas (compared to last quarter). (Printing & Related Support Activities) Well we are very busy because our business growth is just double compared to last year. We are going to buy a lot of raw materials and packaging for the different customers. Our business is going really well at the international level; we are going to have new distributors in other countries like UAE, UK and Italy. Our Purchasing department will have double the work-load pretty soon. I hope everything will be good and smooth in the future. (Chemicals) Fairly static with anticipated seasonal increases in demand in the second quarter, with remnant raw materials to consume in the quarter. (Plastics & Rubber Products) 2
3 Expect more orders and greater volumes as winter fades. Demand remains strong in both new housing starts and expanding infrastructure projects in the greater San Francisco Bay Area. Enjoying increased efficiencies and market growth. (Nonmetallic Mineral Products) All areas of construction that we are involved in seem to be steady for the foreseeable future. (Primary Metals) After a declining December 2015 and January 2016 in business orders, things have really exploded in the Aerospace industry for both new and replacement parts for aircraft and missile systems. (Fabricated Metal Products) Oil downturn is going to put us out of business. (Machinery) Things are picking up considerably from the fourth quarter of Order volume will be at a record this month, March, with a heavy order backlog for the second quarter of (Computer & Electronic Products) New forecast shows lower sales for the next two quarters, too late to impact inventory much in the coming quarter, so inventory will increase. Had head count reduction last quarter in anticipation. Costs should be flat. (Electrical Equipment, Appliance & Components) Overseas pressure causing margin challenges affecting the corporation, which is creating pressure to control cost and headcount. (Transportation Equipment) Uncertainty over the global economy and upcoming elections are delaying purchase orders on some projects. (Furniture & Related Products) Economy seems to be slowing slightly as concerns over our national debt, many global security issues, the poor political climate of the 2016 election, increasing government regulations and increasing costs of goods purchased. This has our company on a cautious path where we are running very lean and spending money only where it's absolutely necessary... We are proceeding as if the economy will be trending downward for the 2nd-4th quarters, (Miscellaneous) Aerospace, Defense and Commercial industry for turbine engines is expected to return to growth in 2016 with total sector revenues estimated to grow at 3.0 percent. In turn we are ramping up our hiring in order to keep up with this expected growth. (Aerospace Products & Parts) 3
4 4

5 Background and methodology The Institute for Supply Management (ISM) conducts a monthly national survey of purchasing managers and publishes the survey results in its Report on Business. Such a survey is not available for the state of California. Given the size of our state, and the major role its manufacturing sector plays in the national economy, the A. Gary Anderson Center for Economic Research at Chapman University launched a quarterly survey of California purchasing managers starting in the third quarter of Similar to the ISM survey, our survey tracks changes in production, employment, new orders, inventories of purchased materials, commodity prices and supplier deliveries. Except for commodity prices and inventories of purchased materials, a seasonally adjusted index is computed for each variable. In order to have one single indicator for the performance of the state manufacturing sector, the Anderson Center has developed a Composite Index that is a weighted average of the underlying indices. A value of 50 for the Composite Index shows a general expansion of the manufacturing economy of the state and a value below 50 shows a decline. The industries are classified according to the North American Industry Classification System (NAICS). 5
6 Detailed Results of the Survey of California Purchasing Managers Expectations for the Second Quarter of 2016 In its attempt to present you with a better delivery of the survey results, the A. Gary Anderson Center for Economic Research has calculated an index for every variable in the survey. The "% Better," is added to half of the "% Same," after which a seasonal factor is used to get a seasonally adjusted index for each variable (except commodity prices). A value over 50 for an index indicates growth and a value below 50 indicates a decline. If for example the index increases from 55 to 59, we say that the growth rate is higher than the previous quarter because 59 is bigger than 55. If the index remains at 55, we say that the growth rate remains the same as the previous quarter. If the index decreases from 55 to 52, we say that we still have growth but that the growth rate is lower than the previous quarter because 52 is smaller than 55. Each industry in the manufacturing sector is represented in the survey based on its employment share of total manufacturing employment in the state. Production The seasonally adjusted index for production is expected to increase from 60.6 in the first quarter to 65.3 in the second quarter, indicating that production is expected to increase at a higher rate in the second quarter. This is the twenty eighth consecutive quarter that the production index has been above 50. Production is expected to increase most rapidly in the following industries: Food; Beverage & Tobacco; Textile Mill Products; Apparel; Paper; Printing & Related Support Activities; Chemicals; Plastics & Rubber Products; Wood Products; Nonmetallic Mineral Products; Primary Metals; Fabricated Metal Products; Machinery; Computer & Electronic Products; Transportation Equipment; and Miscellaneous. No industry reported an expected decrease in production. Production % Higher % Same % Lower Net Seasonally Adjusted Index 2 nd Quarter of st Quarter of th Quarter of rd Quarter of Inventories of Purchased Materials: The seasonally adjusted index for inventories of purchased materials is expected to increase from 50.4 in the first quarter to 53.7 in the second quarter, indicating that inventories are expected to increase at a higher rate in the second quarter. Inventories of purchased materials are expected to increase most rapidly in the following industries: Textile Mill Products; Chemicals; Plastics & Rubber Products; Wood Products; Nonmetallic Mineral Products; Primary Metals; Fabricated Metal Products; Computer & Electronic Products; Electrical Equipment, Appliance & Components; and Miscellaneous. The Beverage & Tobacco industry reported an expected decrease in inventories of purchased materials. Inventories of Purchased Materials % Higher % Same % Lower Net Seasonally Adjusted Index 2 nd Quarter of st Quarter of th Quarter of rd Quarter of
7 Commodity Prices: The seasonally unadjusted index for commodity prices is expected to increase from 57.5 in the first quarter to 61.5 in the second quarter, indicating that commodity prices are expected to rise at a higher rate in the second quarter. Commodity prices are expected to increase most rapidly in the following industries: Food; Textile Mill Products; Apparel; Paper; Printing & Related Support Activities; Chemicals; Plastics & Rubber Products; Wood Products; Nonmetallic Mineral Products; Primary Metals; Fabricated Metal Products; Computer & Electronic Products; Electrical Equipment, Appliance & Components; Transportation Equipment; and Miscellaneous. No industry reported an expected decrease in commodity prices. Commodity Prices % Higher % Same % Lower Net Index 2 nd Quarter of st Quarter of th Quarter of rd Quarter of Supplier Deliveries: For this variable, an index value over 50 indicates slower deliveries, and an index value under 50 indicates faster deliveries. The seasonally adjusted index for supplier deliveries is expected to decrease from 51.3 in the first quarter to 50.5 in the second quarter, indicating that supplier deliveries are expected to be at the same speed as in the first quarter. Supplier deliveries are expected to be slowest in the following industries: Printing & Related Support Activities; Nonmetallic Mineral Products; Electrical Equipment, Appliance & Components; and Transportation Equipment. The Plastics industry reported an expectation of faster supplier deliveries. Supplier Deliveries % Slower % Same % Faster Net Seasonally Adjusted Index 2 nd Quarter of st Quarter of th Quarter of rd Quarter of New Orders: The seasonally adjusted index for new orders is expected to increase from 59.2 in the first quarter to 60.6 in the second quarter, indicating that new orders are expected to increase at a higher rate in the second quarter. New orders are expected to increase most rapidly in the following industries: Food; Beverage & Tobacco; Textile Mill Products; Apparel; Paper; Printing & Related Support Activities; Chemicals; Plastics & Rubber Products; Wood Products; Nonmetallic Mineral Products; Primary Metals; Fabricated Metal Products; Machinery; Computer & Electronic Products; Transportation Equipment; and Miscellaneous. No industry reported an expected decrease in new orders. New Orders % Higher % Same % Lower Net Seasonally Adjusted Index 2 nd Quarter of st Quarter of th Quarter of rd Quarter of
8 Employment: The seasonally adjusted index for employment is expected to decrease from 55.4 in the first quarter to 53.2 in the second quarter, indicating that employment in manufacturing is expected to grow at a slower pace in the second quarter. Employment is expected to increase most rapidly in the following industries: Food; Apparel; Plastics & Rubber Products; Nonmetallic Mineral Products; Transportation Equipment; and Miscellaneous. No industry reported an expected decrease in employment. Employment % Higher % Same % Lower Net Seasonally Adjusted Index 2 nd Quarter of st Quarter of th Quarter of rd Quarter of High-Tech Industries: The high-tech industries include the following: Computer & Electronic Products, and Aerospace Products & Parts. The high-tech industries currently employ about 343,000 employees, amounting to 26.9% of total manufacturing employment in the state. The percent of purchasing managers in the Computer & Electronic Products industry reporting higher expected production increased from 31.1% in the first quarter of 2016 to 52.7% in the second quarter. Additionally the percent of purchasing managers reporting higher expected employment in these industries decreased from 26.0% in the first quarter to 19.3% in the second quarter. 8

9 Orange County s Manufacturing Survey The Orange County manufacturing sector s Composite Index increased from 55.0 in the first quarter of 2016 to 58.8 in the second quarter, indicating that the county s manufacturing economy is expected to grow at a higher rate in the second quarter. The Orange County s index is now slightly above California s index. The seasonally adjusted index for production increased from 59.5 in the first quarter to 64.0 in the second quarter, indicating that production is expected to grow at a higher rate in the second quarter. This is the twenty eighth consecutive quarter that the production index has been above 50. The seasonally adjusted index for new orders increased from 57.0 in the first quarter to 63.1 in the second quarter, indicating that new orders are expected to grow at a higher rate in the second quarter. Unlike California, the employment index also increased from 52.5 in the first quarter to 54.2 in the second quarter, indicating higher employment growth in the second quarter. The index for inventories of purchased materials increased from 48.5 in the first quarter to 52.6 in the second quarter indicating an increase in the level of inventories held by firms. The index for the non-durable goods industries increased from 54.5 in the first quarter to 60.5 in the second quarter, indicating that the growth rate in these industries is expected to be higher in the second quarter. The index for the durable goods industries also increased from 55.2 in the first quarter to 58.2 in the second quarter, indicating that the durable goods industries are expected to grow at a higher rate in the second quarter. Production, new orders and employment are all expected to grow at a higher rate in the second quarter for both the non-durable goods industries and the durable goods industries. 9
10 ABOUT THE ANDERSON CENTER FOR ECONOMIC RESEARCH The A. Gary Anderson Center for Economic Research (ACER) was established in 1979 to provide data, facilities and support in order to encourage the faculty and students at Chapman University to engage in economic and business research of high quality, and to disseminate the results of this research to the community. ANNUAL SCHEDULE OF CONFERENCES AND PRESS RELEASES JANUARY FEBRUARY MARCH APRIL MAY JUNE Economic Forecast Conferences for the Inland Empire California Purchasing Managers Survey California Leading Employment Indicator California Consumer Sentiment Survey California Purchasing Managers Survey California Leading Employment Indicator California Consumer Sentiment Survey Economic Forecast Update Conference for the U.S., California and Orange County JULY AUGUST SEPTEMBER OCTOBER NOVEMBER DECEMBER California Purchasing Managers Survey California Leading Employment Indicator California Consumer Sentiment Survey California Purchasing Managers Survey California Leading Employment Indicator Economic Forecast Conference for the U.S., California and Orange County California Consumer Sentiment Survey 10
Chapman University rargyros School of Business and Economics
 Chapman University rargyros School of Business and Economics A. Gary Anderson Center for Economic Research For Release: Contact: Raymond Sfeir Professor of Economics and Research Fellow (714) 997-6693
MODEST GROWTH RATE RETREAT IN THE MANUFACTURING SECTOR
 A. Gary Anderson Center for Economic Research For Release: Contact: Raymond Sfeir Professor of Economics and Research Fellow (714) 997-6693 MODEST GROWTH RATE RETREAT IN THE MANUFACTURING SECTOR ORANGE,
MANUFACTURING SECTOR CHURNS ALONG
 A. Gary Anderson Center for Economic Research For Release: Contact: Raymond Sfeir Professor of Economics and Research Fellow (714) 997-6693 MANUFACTURING SECTOR CHURNS ALONG ORANGE, CA According to a survey
MANUFACTURING SECTOR S GROWTH SLOWS
 A. Gary Anderson Center for Economic Research For Release: Contact: Raymond Sfeir Professor of Economics and Research Fellow (714) 997-6693 MANUFACTURING SECTOR S GROWTH SLOWS ORANGE, CA According to a
FASTER GROWTH IN MANUFACTURING
 A. Gary Anderson Center for Economic Research For Release: Contact: Raymond Sfeir Professor of Economics and Research Fellow (714) 997-6693 FASTER GROWTH IN MANUFACTURING ORANGE, CA According to a survey
STEADY GROWTH IN MANUFACTURING SECTOR
 A. Gary Anderson Center for Economic Research For Release: Contact: Raymond Sfeir Professor of Economics and Research Fellow (714) 997-6693 STEADY GROWTH IN MANUFACTURING SECTOR ORANGE, CA According to
Chapman University rargyros School of Business and Economics
 Chapman University rargyros School of Business and Economics A. Gary Anderson Center for Economic Research For Release: Contact: Raymond Sfeir Professor of Economics and Research Fellow (714) 997-6693
March 2014 Manufacturing ISM Report On Business
 FOR RELEASE: April 1, 2014 Contact: Kristina Cahill Report On Business Analyst ISM, ROB Media Relations Tempe, Arizona 800/888-6276, Ext. 3015 E-mail: kcahill@ism.ws March 2014 Manufacturing ISM Report
April 2015 Manufacturing ISM Report On Business
 FOR RELEASE: May 1, 2015 Contact: Kristina Cahill Report On Business Analyst ISM, ROB/Research Tempe, Arizona 800/888-6276, Ext. 3015 E-mail: kcahill@instituteforsupplymanagement.org April 2015 Manufacturing
March 2015 Manufacturing ISM Report On Business
 FOR RELEASE: April 1, 2015 Contact: Kristina Cahill Report On Business Analyst ISM, ROB/Research Tempe, Arizona 800/888-6276, Ext. 3015 E-mail: kcahill@ism.ws March 2015 Manufacturing ISM Report On Business
FEDERAL RESERVE statistical release
 FEDERAL RESERVE statistical release G.17 (419) For release at 9:15 a.m. (EDT) August 17, 2017 INDUSTRIAL PRODUCTION AND CAPACITY UTILIZATION Industrial production rose 0.2 percent in July following an
FEDERAL RESERVE statistical release
 FEDERAL RESERVE statistical release G.17 (419) For release at 9:15 a.m. (EST) January 18, 2019 INDUSTRIAL PRODUCTION AND CAPACITY UTILIZATION Industrial production increased 0.3 percent in December after
Business-Facts Summary - Construction and Manufacturing NAICS Summary
 - Construction and NAICS Summary Title Page Title Page Data Version: 2018 Feb (Internal) Report Generation Method: Single Analysis Area: 1789 STATE ST, SAN DIEGO, CA, 92101-2530 Reporting Detail: As Selected
Central Bank of Nigeria Purchasing Managers Index (PMI) Survey Report
 Survey Report") Central Bank of Nigeria Purchasing Managers Index (PMI) Survey Report Statistics Department June 2017 1.0 Introduction PURCHASING MANAGERS INDEX (PMI) JUNE 2017 REPORT The June 2017 PMI was conducted by
Central Bank of Nigeria Purchasing Managers Index (PMI) Survey Report Statistics Department June 2017 1.0 Introduction PURCHASING MANAGERS INDEX (PMI) JUNE 2017 REPORT The June 2017 PMI was conducted by
Economic Recovery: State of Manufacturing
 Economic Recovery: State of The Setup Getting the Euro to Work Chicago, IL July 2, 212 William Strauss Senior Economist and Economic Advisor output peaked in December 27 and fell 2.4% over the following
Assessing Manufacturing: Output and Labor
 Assessing : Output and Labor The Setup Making It In America Matters 212 NABE Industry Conference Cleveland, OH May 31, 212 William Strauss Senior Economist and Economic Advisor output peaked in December
Norbert J. Ore, CPSM, CPM, MA Chair, ISM Manufacturing Report on Business
 The ISM Reports on Business and the U.S. Economy Norbert J. Ore, CPSM, CPM, MA Chair, ISM Manufacturing Report on Business norjore@gmail.com we ll be talking about... The history and development of the
Rural Manufacturing at a Glance, 2017 Edition
 United States Department of Agriculture Economic Research Service, Economic Information Bulletin 177, August 17 Rural Manufacturing at a Glance, 17 Edition Overview Despite declining rural manufacturing
FOR RELEASE: February 1, 2019
 FOR RELEASE: February 1, 2019 Contact: Kristina Cahill Report On Business Analyst ISM, ROB/Research Manager Tempe, Arizona 480-752-6276, Ext. 3015 E-mail: kcahill@instituteforsupplymanagement.org This
PMI at 51.8% New Orders and Production Growing Employment and Inventories Contracting Supplier Deliveries Slower
 FOR RELEASE: 0:00 A.M. ET April, 206 Contact: Kristina Cahill Report On Business Analyst ISM, ROB/Research Manager Tempe, Arizona 800/888-6276, Ext. 305 E-mail: kcahill@instituteforsupplymanagement.org
Central Bank of Nigeria Purchasing Managers Index (PMI) Survey Report
 Survey Report") Central Bank Nigeria Purchasing Managers (PMI) Survey Report Statistics Department September 2017 1.0 Introduction PURCHASING MANAGERS INDEX (PMI) SEPTEMBER 2017 REPORT The September 2017 PMI was conducted
Central Bank Nigeria Purchasing Managers (PMI) Survey Report Statistics Department September 2017 1.0 Introduction PURCHASING MANAGERS INDEX (PMI) SEPTEMBER 2017 REPORT The September 2017 PMI was conducted
Central Bank of Nigeria Purchasing Managers Index (PMI) Survey Report
 Survey Report") Central Bank Nigeria Purchasing Managers (PMI) Survey Report Statistics Department October 2017 1.0 Introduction PURCHASING MANAGERS INDEX (PMI) OCTOBER 2017 REPORT The October 2017 PMI survey was conducted
Central Bank Nigeria Purchasing Managers (PMI) Survey Report Statistics Department October 2017 1.0 Introduction PURCHASING MANAGERS INDEX (PMI) OCTOBER 2017 REPORT The October 2017 PMI survey was conducted
Stability in Prices PRICES INDUSTRIAL PRICES IN CURRENT EXPANSION. January 1962
 Stability in Prices INDUSTRIAL COMMODITY MARKETS were more competitive in 1961 than in earlier postwar periods of business expansion. Prices of some commodities advanced, but prices of others declined
FOR RELEASE: April 2, 2018
 FOR RELEASE: April 2, 2018 Contact: Kristina Cahill Report On Business Analyst ISM, ROB/Research Manager Tempe, Arizona 480-752-6276, Ext. 3015 E-mail: kcahill@instituteforsupplymanagement.org March 2018
Industrial Land Analysis Executive Summary
 Industrial Land Analysis Executive Summary In early May, the Office of Economic Development and the Department of Community Planning and Development were jointly asked to examine a number of issues regarding
Results of Mt. Auburn Survey of Merrimack Valley Manufacturers
 Results of Mt. Auburn Survey of Merrimack Valley Manufacturers METHODOLOGY Survey Methodology 622 email addresses were collected through each of the WIBs. This accounted for about one third of total manufacturers
DECEMBER Big Jump in New Orders Drives Accelerated PMI; Business Activity Increase Fastest Since July 2004
 B U S I N E S S DECEMBER HIGH LIGHTS Big Jump in New Orders Drives Accelerated PMI; Business Activity Increase Fastest Since July Route to: Contents See the following pages for complete reports. Manufacturing
July 2016 Manufacturing ISM Report On Business
 FOR RELEASE: August 1, 2016 Contact: Kristina Cahill Report On Business Analyst ISM, ROB/Research Manager Tempe, Arizona 800/888-6276, Ext. 3015 E-mail: kcahill@instituteforsupplymanagement.org July 2016
Massachusetts Employment Projections Through 2014
 Massachusetts Employment Projections Through 2014 Massachusetts Department of Workforce Development Table of contents Overview 3 Job Growth by Major Industry Sector 6 Impact on workers 18 Impact on Education
This table has been produced by. The State & Regional Fiscal Studies Unit, University of Missouri-Columbia
 Table B-39 NAICS Component 1963 1964 1965 1966 1967 1968 1969 1970 1971 All industry total 607,008 650,513 704,697 767,075 811,782 887,569 962,902 1,012,299 1,097,173 Private industries 534,043 572,138
Maintenance Study. February 2014
 Maintenance Study February 2014 Introduction and methodology Objective Plant Engineering performed this research to better understand maintenance practices and strategies currently in place in North American
Regional Competitive Industry Analysis
 Regional Competitive Industry Analysis Jackson and Josephine Counties October 2016 Josephine Jackson Michael Meyers, Economist (503) 229-6179 michael.meyers@oregon.gov Jill Cuyler, Research Analyst (503)
This table has been produced by. The State & Regional Fiscal Studies Unit, University of Missouri-Columbia
 Table B-39 NAICS Component *1987 1988 1989 1990 1991 1992 All industry total 6,076,695 6,398,624 6,540,047 6,638,210 6,627,809 6,828,525 Private industries 5,195,468 5,492,391 5,612,260 5,690,087 5,677,736
MANUFACTURING IN IOWA
 MANUFACTURING IN IOWA NOVEMBER 2011 INSIDE: SECTOR SIZE 2 KEY INDUSTRIES EARNINGS 4 EXPORTS 5 JOB TRENDS 6 GDP TRENDS 7 COUNTY DEPENDENCE 3 8 OVERVIEW Iowa s competitive strengths in manufacturing emerged
September 2016 Manufacturing ISM Report On Business
 FOR RELEASE: October 3, 2016 Contact: Kristina Cahill Report On Business Analyst ISM, ROB/Research Manager Tempe, Arizona 800/888-6276, Ext. 3015 E-mail: kcahill@instituteforsupplymanagement.org September
HIGH LIGHTS. Non-Manufacturing Expanding at Faster Rate Than Manufacturing; New Orders Expanding in Both Sectors. Manufacturing.
 B U S I N E S S MARCH HIGH LIGHTS Expanding at Faster Rate Than Manufacturing; New Orders Expanding in Both Sectors Route to: Contents See the following pages for complete reports. Manufacturing report......
HIGH LIGHTS. Prices Continuing to Increase in Both Sectors, but at Slower Rates. Manufacturing. Non-Manufacturing APRIL 2005
 B U S I N E S S APRIL HIGH LIGHTS Prices Continuing to Increase in Both Sectors, but at Slower Rates Route to: Contents See the following pages for complete reports. Manufacturing report...... 2 report...................
A MAN UFACTURING COMEBACK 1. A Man ufacturing Comeback: Men s and Women s Employment Gains and Losses in March 2012
 A MAN UFACTURING COMEBACK 1 UNEMPLOYMENT A Man ufacturing Comeback: Men s and Women s Employment Gains and Losses in 2011 March 2012 In 2011 manufacturing employment increased for the first time in more
Slight downturn in business optimism in Q amid lukewarm economic growth - D&B Malaysia Business Optimism Index
 FOR IMMEDIATE RELEASE Contact: Eugene Z., Marcom & Product Development eugene.tan@dnb.com.sg +65 6439 6670 Slight downturn in business optimism in Q1 2015 amid lukewarm economic growth - D&B Malaysia Business
Manufacturing recovery slows again in March
 March 2019 Media Contact: Tony Melville, Australian Industry Group. 0419 190 347 Manufacturing recovery slows again in March The Australian Industry Group Australian Performance of Manufacturing Index
MONTHLY FULL REPORT ON MANUFACTURERS SHIPMENTS, INVENTORIES AND ORDERS SEPTEMBER 2018
 FOR RELEASE AT 10:00 AM EDT, FRIDAY, NOVEMBER 2, 2018 MONTHLY FULL REPORT ON MANUFACTURERS SHIPMENTS, INVENTORIES AND ORDERS SEPTEMBER 2018 Release Number: CB 18 166 M3 2 (18) 09 November 2, 2018 The U.S.
SMEs Business Optimism Survey Q1, 2015
 SMEs Business Optimism Survey Q1, 2015 The material in this publication is copyrighted. Copying and/or transmitting portions or all of this work without permission may be violation of applicable law. Dubai
International Seminar on Early Warning and Business Cycle Indicators. 14 to 16 December 2009 Scheveningen, The Netherlands
 ESA/STAT/AC.202/S4.5 International Seminar on Early Warning and Business Cycle Indicators 14 to 16 December 2009 Scheveningen, The Netherlands Tracking the Mexican business cycle Yuriko Yabuta Mexico 2
INDUSTRIAL PRODUCTION INDICES IN OCTOBER
 INDUSTRIAL PRODUCTION INDICES IN OCTOBER 2015 1 According to the preliminary data the Industrial Production Index 2, seasonally adjusted 3, increased by 0.1% in October 2015 as compared to September 2015.
Manufacturing conditions improve solidly in. December. Commonwealth Bank Manufacturing PMI Purchasing Managers Index TM Report.
 January 2019 Manufacturing conditions improve solidly in December. Key findings Australia s manufacturing sector rounded off 2018 on a solid note, with business conditions improving at a strong pace in
North Carolina Exports by Quarter (in constant 2Q 2013 dollars)
") P. 1/6 in Billions in Billions 1 North Carolina Trade Report 1, First Half of 2013 Exports from North Carolina play an increasingly important role in the state s economic recovery and job growth. That
P. 1/6 in Billions in Billions 1 North Carolina Trade Report 1, First Half of 2013 Exports from North Carolina play an increasingly important role in the state s economic recovery and job growth. That
SMEs Business Optimism Survey Q3, 2018
 SMEs Business Optimism Survey Q3, 2018 The material in this publication is copyrighted. Copying and/or transmitting portions or all of this work without permission may be violation of applicable law. Dubai
Industry snapshot for the Auckland region The Manufacturing Sector
 Industry snapshot for the Auckland region The Manufacturing Sector Industry Snapshot for the Auckland Region The Manufacturing Sector October 2009 Prepared by Penelope Tevita Tuatagaloa Economic and Social
February 2018 Economic Report
 February 218 Economic Report Table of Contents Economic Overview... 1 Terminology & Methodology.. 2 Business Cycle... 3 US Paper & Paper Products Production Index.... 4 US Pulp, Paper, & Board Mills Production
INDUSTRIAL PRODUCTION INDICES IN AUGUST Figure 1. Industrial Production Indices (2010=100)
") INDUSTRIAL PRODUCTION INDICES IN AUGUST 2013 1 The preliminary data showed that the Industrial Production Index 2, seasonally adjusted 3, has increased by 0.9% in August 2013 as compared to July 2013.
INDUSTRIAL PRODUCTION INDICES IN AUGUST 2013 1 The preliminary data showed that the Industrial Production Index 2, seasonally adjusted 3, has increased by 0.9% in August 2013 as compared to July 2013.
Business-Facts Summary - 3 Digit NAICS Summary
 - 3 Digit NAICS Summary Title Page Title Page Data Version: 2018 Feb (Internal) Report Generation Method: Single Analysis Area: 1789 STATE ST, SAN DIEGO, CA, 92101-2530 Reporting Detail: As Selected Include
2017: Q3. agriculture, forestry & fisheries
 agriculture, forestry & fisheries PREFACE The agro-processing industry is among the sectors identified by the Industrial Policy Action Plan (IPAP) and the National Development Plan for its potential to
Industrial production indices - global developments
 Industry, trade and services Author: Digna AMIL Statistics in focus 61/8 Industrial production indices - global developments A great deal has been written about the internationalisation of the world economy,
Business-Facts Summary Dublin city, CA ( )
") 3 Digit NAICS Top Ten Summary Healthcare and Social Assistance Ambulatory Health Care Retail Trade Professional, Scientific, and Technical Other (except Public Administration) Retail Trade Retail Trade
3 Digit NAICS Top Ten Summary Healthcare and Social Assistance Ambulatory Health Care Retail Trade Professional, Scientific, and Technical Other (except Public Administration) Retail Trade Retail Trade
Economic Outlook Update
 ECONOMIC OUTLOOK December 2015 Economic Outlook Update -February 2017- Table of Contents: 1. Global and Regional economy 2. Domestic Outlook 2.1 Primary Industries 2.2 Secondary Industries 2.3 Tertiary
THIS REPORT CONTAINS ASSESSMENTS OF COMMODITY AND TRADE ISSUES MADE BY USDA STAFF AND NOT NECESSARILY STATEMENTS OF OFFICIAL U.S.
 THIS REPORT CONTAINS ASSESSMENTS OF COMMODITY AND TRADE ISSUES MADE BY USDA STAFF AND NOT NECESSARILY STATEMENTS OF OFFICIAL U.S. GOVERNMENT POLICY Required Report - public distribution Date: GAIN Report
Food Manufacturing Research for Grand Erie
 Food Research for Grand Erie Research conducted by Paul Knafelc, Community Benchmarks Inc. on behalf of the Workforce Planning Board of Grand Erie, 2012 1 Brant County Table 1 Food (NAICS 311) Economic
1. Foreign Trade Figures in the Czech Republic in 2010
 1. Foreign Trade Figures in the Czech Republic in 2010 Foreign trade in the Czech Republic ended 2010 with a surplus of CZK 121.2 billion. Although this is CZK 28.4 billion less than in 2009, it is still
ECONOMIC DRIVERS FOR THE CHEMICAL INDUSTRY
 ECONOMIC DRIVERS FOR THE CHEMICAL INDUSTRY 3 October 2017 Pittsburgh Chemical Day Pittsburgh, PA Martha Gilchrist Moore Sr. Director Policy Analysis and Economics Outline Global Situation and Outlook U.S.
STATE OF HAWAI'I. No. of. Total Average Rep. Units Average Quarterly Quarterly Industry March Employment Wages Wages January February March
 STATE OF HAWAI'I TOTAL, including government 37,439 598,205 6,028,316,620 10,077 596,822 598,744 599,049 TOTAL GOVERNMENT 6 123,628 1,526,182,323 12,345 121,692 123,988 125,205 Federal 1 32,650 483,102,256
STATE OF HAWAI'I. No. of. Total Average Rep. Units Average Quarterly Quarterly Industry September Employment Wages Wages July August September
 STATE OF HAWAI'I TOTAL, including government 37,044 581,957 6,080,565,857 10,448 581,677 578,368 585,826 TOTAL GOVERNMENT 6 118,031 1,532,738,257 12,986 118,907 114,660 120,525 Federal 1 34,864 560,380,978
Highest Ranked Industries Top 10 Manufacturing Industries (3-Digit) in 8 South Carolina Counties
 in 8 South Carolina Counties") Highest Ranked Industries Top 10 Industries (3-Digit) in 8 South Carolina Counties Emsi Q4 Data Set February 2018 Upstate SC Alliance Emsi Q4 Data Set www.economicmodeling.com 1 Parameters Regions Code
Highest Ranked Industries Top 10 Industries (3-Digit) in 8 South Carolina Counties Emsi Q4 Data Set February 2018 Upstate SC Alliance Emsi Q4 Data Set www.economicmodeling.com 1 Parameters Regions Code
THE ECONOMIC IMPACT OF INFORMATION TECHNOLOGIES AFTER THE FINANCIAL CRISIS
 THE ECONOMIC IMPACT OF INFORMATION TECHNOLOGIES AFTER THE FINANCIAL CRISIS Dale W. Jorgenson, Harvard University http://economics.harvard.edu/faculty/jorgenson/ Keynote Lecture to the Annual Conference
Review of Industrial Economy & Industrial Distribution Trends. September 16, 2014 Joe Calvello & Matthew McCann
 Review of Industrial Economy & Industrial Distribution Trends September 16, 2014 Joe Calvello & Matthew McCann 1 Agenda Overview of Current Industrial Trends Key Industrial Macro Indicators Review of Recent
Economic Highlights. Consumer Price Index 1. Transportation Freight Trends 2 Rail Shipments 2. Industrial Production 3. Business Inventories 4
 January 20, 2010 Economic Highlights Prices Consumer Price Index 1 Transportation Transportation Freight Trends 2 Rail Shipments 2 Manufacturing Industrial Production 3 Business Inventories 4 Consumer
Kansas Advanced Manufacturing
 2008 Kansas Advanced Manufacturing Center for Economic Development and Business Research W. Frank Barton School of Business Wichita State University August 2008 1 Kansas Advanced Manufacturing Summary
INDUSTRIAL PRODUCTION INDICES IN JULY Figure 1. Industrial Production Indices (2010 = 100)
") INDUSTRIAL PRODUCTION INDICES IN JULY 2017 1 According to the preliminary data the Industrial Production Index 2, seasonally adjusted 3, increased by 0.2% in July 2017 as compared to June 2017. In July
INDUSTRIAL PRODUCTION INDICES IN JULY 2017 1 According to the preliminary data the Industrial Production Index 2, seasonally adjusted 3, increased by 0.2% in July 2017 as compared to June 2017. In July
Alberta s Manufacturing Industry is Recovering in 2017
 ECONOMIC COMMENTARY Alberta s Manufacturing Industry is Recovering in 2017 Highlights: Alberta s manufacturing industry was in recession in 2015 and 2016 as a result of the dramatic drop in crude oil prices.
1 of 7. Table 5.1 Factors affecting industry output and employment, NAICS coverage
 2007 ICS 210000 Mining 211000 Oil and gas extraction Output is used in petroleum refining and by gas utilities industries. Output is expected to drop very slowly from current levels over the next decade,
Maintenance Report. March Sponsored by
 Maintenance Report March 2018 Sponsored by Table of contents Section Pages Introduction and methodology 3 Summary of findings 4 Respondent profile 5-9 Facility maintenance 10-24 Additional resources 25
Exploring Opportunities for a Stronger Regional Economy. Module Six
 Exploring Opportunities for a Stronger Regional Economy Module Six Reflecting on the Previous Session What did you find most useful or valuable? What progress have you made since then? Any questions or
Manufacturing PMI climbs to four-month high.
 November 2018 Manufacturing PMI climbs to four-month high. Key findings Australia s manufacturing sector continued to expand solidly in October, with the pace of growth accelerating from September. While
WORLD KLEMS AND ASIA KLEMS
 WORLD KLEMS AND ASIA KLEMS By Dale W. Jorgenson Harvard University First Asia KLEMS Conference Asian Development Bank Institute Tokyo, Japan July 27, 2011 http://economics.harvard.edu/faculty/jorgenson/
INDUSTRIAL PRODUCTION INDICES IN OCTOBER
 INDUSTRIAL PRODUCTION INDICES IN OCTOBER 2017 1 According to the preliminary data the Industrial Production Index 2, seasonally adjusted 3, decreased by 0.6% in October 2017 as compared to September 2017.
Summary. Figure 1: Changes in Major Items (Year-on-Year Basis) (Establishments with 10 or more employees) Number of employees (-2.
 (Establishments with 10 or more employees) Number of employees (-2.") Summary 1. Trends in establishments with 10 or more employees The number of establishments decreased for the second consecutive year, and the number of employees decreased for the first time in three years.
Summary 1. Trends in establishments with 10 or more employees The number of establishments decreased for the second consecutive year, and the number of employees decreased for the first time in three years.
Carbon in US Energy Production
 Carbon in US Energy Production Peter Wilcoxen Departments of Economics and Public Administration The Maxwell School, Syracuse University SURE 2009 November 5, 2009 http://wilcoxen.maxwell.insightworks.com/pages/talks/
 http://e-asia.uoregon.edu THE ROLE OF SMALL & MEDIUM-SIZED ENTERPRISES IN EXPORTS TO CHINA: A STATISTICAL PROFILE Results from the 2003 Exporter Data Base International Trade Administration Manufacturing
San Diego Economy Drought-Resistant, With Exceptions KEY FINDINGS
 San Diego Economy Drought-Resistant, With Exceptions KEY FINDINGS On average, non-agricultural private sector businesses in San Diego County annually use 6,887 cubic feet (54,341 gallons) of water for
Current Inventory- Sales Relations
 BARRY BOSWORTH Harvard University Current Inventory- Sales Relations ips THE SUSTAINED ECONOMIC EXPANSION of the 1960s has coincided with a declining interest in the inventory-accelerator theory of the
Fashion Merchandising
 Fashion Merchandising February 2016 Needs Assessment Prepared by Danielle Pearson Date: February 10, 2016 Fashion Merchandising Fashion Merchandising Needs Assessment Page 1 Scope Data compiled in this
Economic Viability of Combined Heat and Power in ERCOT
 WADE Annual Meeting & DistribuGen Conference and NYSERDA CHP Expo October 14-17, 2014, Westchester, New York Economic Viability of Combined Heat and Power in ERCOT PRESENTED BY Yingxia Yang O c t 1 6 t
World Manufacturing Production
 World Manufacturing Production Statistics for Quarter IV, 2017 Report on world manufacturing production This report presents the observed growth rates and growth estimates of world manufacturing production
Economic Impacts. Refineries in Skagit County
 Economic Impacts of the Refineries in Skagit County February 13, 2015 Center for Economic and Business Research Prepared for the Economic Development Association of Skagit County Table of Contents Executive
Understanding the Scale of the Problem: US Energy Sources and CO2 Emissions
 Understanding the Scale of the Problem: US Energy Sources and CO2 Emissions Pete Wilcoxen Departments of Economics and Public Administration The Maxwell School, Syracuse University Focus the Nation April
PRESS RELEASE. Industrial Production Price Index
 ROMANIA Press Office 16 Libertăţii Avenue, Sector 5, Bucharest Tel/Fax: 318 18 69; Fax: 312 48 75 e-mail: romstat@insse.ro; biroupresa@insse.ro PRESS RELEASE No. 48 of March 4, 2013 Industrial Production
CEdMA Training Market Barometer 3 rd Quarter 2012 actual and forecast for 4 th Quarter 2012
 Introduction CEdMA Training Market Barometer 3 rd Quarter 2012 actual and forecast for 4 th Quarter 2012 This report is compiled by CEdMA for its members about their Education businesses. It is based around
The Plan Bay Area. Page Copyright 2012 Pearson Addison-Wesley. All rights reserved.
 The Plan Bay Area Page 1 20-1 What is the Plan Bay Area? Plan Bay Area 2040 is a state-mandated, integrated long-range transportation and land use plan. As required by Senate Bill 375 (2008), all metropolitan
Overview of the manufacturing sector
 Overview of the manufacturing sector Jane Turner, Economics Department This article examines recent trends in New Zealand s manufacturing sector. It finds that sales to the domestic market have been reasonably
Director, Center for Supply Chain Management Marquette University (414)
") J a n u a r y 2 0 1 7 - F i n a l R e l e a s e Contact: Dr. Douglas Fisher Director, Center for Supply Chain Management Marquette University (414) 288-3995 douglas.fisher@marquette.edu Released: February
J a n u a r y 2 0 1 7 - F i n a l R e l e a s e Contact: Dr. Douglas Fisher Director, Center for Supply Chain Management Marquette University (414) 288-3995 douglas.fisher@marquette.edu Released: February
Appendix A NAICS Codes and Titles
 Appendix A NAICS Codes and Titles The current analysis of the US economy uses a classification system that is based on the 6-digit North American Industry Classification System (NAICS) introduced in year
THE DURABLE HARD GOODS MARKET SEGMENT CONSUMER, COMMERCIAL, AND INDUSTRIAL
 THE DURABLE HARD GOODS MARKET SEGMENT CONSUMER, COMMERCIAL, AND INDUSTRIAL (Formerly Two Defined Segments: The Hardware, Plumbing, Automotive, Industrial, and Related Components and Parts Segment; and
INDUSTRIAL PRODUCTION INDICES IN JANUARY
 INDUSTRIAL PRODUCTION INDICES IN JANUARY 2018 1 In compliance with Regulation (EC) 1165/98 and amendment Regulation (EC) 1158/2005 since January 2018 the base year for Short-term business statistics has
Wholesale Distribution Economic Trends: Headwinds Slow Revenue Growth. in partnership with:
 2016 Wholesale Distribution Economic Trends: Headwinds Slow Revenue Growth from: in partnership with: Total revenues of wholesale distributors in 2015 fell by 4.3 percent to $5.3 trillion, reflecting a
CINCINNATI REPORT ON BUSINESS
 CINCINNATI REPORT ON BUSINESS ISM-CINCINNATI AFFILIATED WITH THE INSTITUTE FOR SUPPLY MANAGEMENT November 211 PRESS RELEASE Important: Do Not Release Until 12:1 a.m. Wednesday, November 3, 211 SUBJECT:
INDUSTRIAL PRODUCTION INDICES IN FEBRUARY
 INDUSTRIAL PRODUCTION INDICES IN FEBRUARY 2018 1 In compliance with Regulation (EC) 1165/98 and amendment Regulation (EC) 1158/2005 since January 2018 the base year for Short-term business statistics has
August 2017 Economic Report
 August 217 Economic Report Table of Contents Economic Overview... 1 Terminology & Methodology.. 2 Business Cycle... 3 US Paper & Paper Products Production Index.... 4 US Pulp, Paper, & Board Mills Production
Manufacturing sees slow but positive start to 2019
 January 2019 Media Contact: Tony Melville, Australian Industry Group. 0419 190 347 Manufacturing sees slow but positive start to 2019 The Australian Industry Group Australian Performance of Manufacturing
NORTHWEST GEORGIA HIGH DEMAND CAREER INITIATIVE SECTOR PARTNERSHIP
 NORTHWEST GEORGIA HIGH DEMAND CAREER INITIATIVE SECTOR PARTNERSHIP CANDICE MCKIE ENTERPRISE INNOVATION INSTITUTE GEORGIA TECH NOVEMBER 17, 2017 Project Recap HDCI Overview The High Demand Career Initiative
Camden Food Economy Strategy July 2013 Campbell Soup Company
 Camden Food Economy Strategy July 2013 Campbell Soup Company The Reinvestment Fund $1.2 billion in community investments $700 million in capital under management 800 individual & institutional investors
PHOTOS: SHUTTERSTOCK. Editor s note: The Arkansas Energy Report is Sponsored by MISO & Arkansas State Chamber of Commerce.
 PHOTOS: SHUTTERSTOCK Editor s note: The Arkansas Energy Report is Sponsored by MISO & Arkansas State Chamber of Commerce. Arkansas energy picture in recent months is one of low pump prices, a significant