Air po pse. Assessment Air Pollution
|
|
|
- Damon George
- 6 years ago
- Views:
Transcription


1 Air po caly pse Assessment of Air Pollution in Indian Cities
 3.13 Punjab 3.14 Rajasthan 3.15 Tamil Nadu 3.16 Telengana 3.17 3.18 akhand 4. Way Forward 5. Comparison of air pollution policies 6.")

2 Report 1. Introduction 2. Methodology and Data 3. Inferences and Discussion 3.1 Andhra 3.2 Bihar 3.3 Chandigarh 3.4 Chhattisgarh 3.5 Delhi 3.6 Gujarat 3.7 Haryana 3.8 Jharkhand 3.9 Karnataka 3.1 Madhya 3.11 Maharashtra 3.12 Odisha (Orissisha (Orissa) 3.13 Punjab 3.14 Rajasthan 3.15 Tamil Nadu 3.16 Telengana akhand 4. Way Forward 5. Comparison of air pollution policies 6. Appendix I 7. Appendix II Airpocalypse: Assessment of Air Pollution in Indian Cities Written by Sunil Dahiya, Greenpeace Lauri Myllyvirta, Greenpeace Nandikesh Sivalingam, Greenpeace Acknowledgements Harshit Sharma, Narendra Dubey and Ashish Fernandes Design Divya Kukreti, Studio Kuk Published by GPET, released in January 217 For more information, contact: sunil.dahiya@greenpeace.org Printed on 1% recycled paper A view of the smog-covered smoke stacks of the Indraprastha Power Generation Co. Ltd, a power plant in New Delhi. Image: Subrata Biswas/ Greenpeace
 or even to India s metros. It is a national problem that is killing 1.2 million Indians every year and costing the economy an estimated 3% of GDP.")
 standards, and most")
3 1.2 million Deaths every year due to outdoor air pollution in India GDP lost due to Air pollution Executive Summary This report shows that deadly air pollution is not a problem restricted to Delhi-NCR (National Capital Region) or even to India s metros. It is a national problem that is killing 1.2 million Indians every year and costing the economy an estimated 3% of GDP. If the country s development is important, fighting air pollution has to be a priority. Data gathered by Greenpeace India from state pollution control boards shows that there are virtually no places in India complying with WHO and National Ambient Air Quality (NAAQ) standards, and most cities are critically polluted. Except for a few places in Southern India which complied with NAAQ standards, the entire country is experiencing a public health crisis due to high air pollution levels. Due to the range of different sectors responsible for pollutant emissions, urgent and determined action is needed by a number of ministries in the states and central governments, industry and general public. Greenpeace is calling on the central and state governments to: 1. Institute robust monitoring of air quality across the country and make the data publicly available in real time. This should be coupled with a health advisory and red alerts for bad-air days, which would enable the public to take decisions to protect their health and the environment and automatically institute measures to protect citizens, such as shutting down schools, traffic reduction measures, shutting down power plants and industries etc. 2. Use the data as a basis to fine tune pollution reduction strategies that must, inter alia seek to improve public transport and reduce petrol/diesel vehicle use, strengthen enforcement to get polluting vehicles off the roads, introduce higher fuel standards (Bharat VI), enforce stricter emission regulations and improved efficiency for thermal power plants and industries, move from diesel generators to rooftop solar, increase use of clean renewable energy, offer incentives for electric vehicles, dust removal from roads, regulate construction activities and stop burning of biomass and waste. These strategies should be formalized as a time bound action plan which has targets and penalties. While some actions might need to be city or region-specific, there are a broad range of actions that will be universally applicable. Vocal public participation is critical in reducing air pollution. Our choices in terms of electricity, transportation and waste management can play a major role in managing pollution levels, as are our choices in terms of political leaders who support the goal of reducing air pollution. 1
 levels increased in a rapid manner overtaking even China In 216, severe air pollution has disrupted everyday life, especially during the winter. In 215 air pollution (PM 2.")

4 Introduction In 216, severe air pollution has disrupted everyday life, especially during the winter. In 215 air pollution (PM 2.5 ) levels increased in a rapid manner overtaking even China In 216, severe air pollution has disrupted everyday life, especially during the winter. In 215 air pollution (PM 2.5 ) levels increased in a rapid manner overtaking even China. Even though pollution levels are increasing across the country, the emphasis so far has been on Delhi. There has been a growing realization that the majority of Delhi s pollution is coming from outside its borders and that pollution levels in other states like Karnataka, Tamil Nadu and Maharashtra are also increasing. However, the country is yet to come to the full understanding that air pollution is a national problem and to win the fight against it, we need to act as a country and across city or even regional boundaries. India s air pollution has become a public health and economic crisis. There are increasing numbers of people who die prematurely every year with the increasing pollution levels. Deaths due to air pollution are only a fraction less than the number of deaths caused by tobacco usage. Global Burden of Disease (GBD), a comprehensive regional and global research program including 5 researchers representing over 3 institutions and 5 countries, has estimated that 3283 Indians died per day due to outdoor air pollution in India in 215, making the potential number of deaths due to outdoor air pollution in India in 215 to lakh. On the economic front, loss of productivity and the forced closures of schools and industries have already started impacting our economy. The World Bank estimates that India loses around 3% of its GDP due to air pollution. This makes air pollution one of the biggest issues to fight if we are to protect peoples lives, public health and our economy. Air pollution is a complex issue, requiring an array of solutions. There are many sources that contribute to pollution across the country. Depending on region and climatic conditions, the contribution of particular sources will also differ. However, what is very clear is that irrespective of where you live, burning of fossil fuels (coal & oil) contributes majorly to air pollution levels across regions. 1 curated/en/ / pdf/74v1eswpbox374379bpublic. pdf The purpose of this report is to show that air pollution is a national problem and it needs to be addressed equally across the country and not only in Delhi or the National Capital Region. The report also tries to identify major sources of pollution in parts of the country based on past research. As a way ahead for the country, our long term goals to solve the air pollution crisis can be universal, while short term solutions are to be decided based on the levels of pollution prevailing in the region. 2
, Nitrogen Dioxide (NO 2 ) and Particulate Matter size equal to or less than 1 micron ( ), have been identified for regular monitoring at all the locations.")
 application filed to SPCB (State Pollution Control")
5 Methodology and Data The Central Pollution Control Board has instituted the National Air Quality Monitoring Programme (NAMP). Under NAMP, three air pollutants viz., Sulphur Dioxide (SO 2 ), Nitrogen Dioxide (NO 2 ) and Particulate Matter size equal to or less than 1 micron ( ), have been identified for regular monitoring at all the locations. The NAMP network presently comprises 621 operating monitoring stations located in 262 cities/towns in 29 states and 5 union territories across the country. 2 Greenpeace tried to collect data on levels for these NAMP station across the country through various sources such as Right to Information (RTI) application filed to SPCB (State Pollution Control Boards) to gather data, SPCB s websites and annual reports of SPCBs etc. Simultaneously, a secondary literature review was carried out to understand the sources of pollution, to capture the most recent source apportionment studies carried out throughout the country. Sulphur Dioxide (SO 2 ), Nitrogen Dioxide (NO 2 ) and Particulate Matter Air pollutants that have been identified for regular monitoring at all the locations throughout the country Delhi has been recording dangerous levels of air pollution putting everyone, but especially children, elders and patients, at serious health risk. Image: Sudhanshu Malhotra / Greenpeace 2 Rep_June216.pdf 3

6 Inferences and Discussion Jammu Damtal Chandigarh Dera Baba nanak The map plotted from the annual average concentrations across the country suggests that there are no places or cities in northern India complying with WHO and NAAQS standards, and most of the cities are critically polluted. Except for a few places in Southern India which complied with NAAQ standards, the entire country is experiencing a public health crisis due to high air pollution levels. A detailed description of the cities across all states in India is provided in the following sections. Mandi Gobindgarh Haldwani rohtak Meerut Lucknow alwar Sibsagar Jodhpur agra Jaipur gwalior kota Unnao Gorakhpur jhansi varanasi Nalbari Byrnihat Kohima udaipur Patna silchar gandhi nagar ujjain jamnagar rajkot indore surat bhavnagar akela nashik jalna sagar singrauli bhopal korba kusunda ranchi siltara rourkela raipur amravati talcher chaderpur sindri Jharia Kolkatta balasore cuttak mumbai Navi mumbai pune latur bidar karim nagar warangal berhampur solapur hyderabad visakhapatnam belgaum karwar hubli davanagere guntur nellore chitradurga hassan tumku kolar chennai cuddalore cities and PM1 levels across India chamrajnagar tuticorin Note: Map not to scale WHO Guideline NAAQS Guideline times NAAQS times NAAQS 2-3 times NAAQS 3-4 times NAAQS > 4 times NAAQS Indian state boundary 4
7 The assessment of Air Pollution levels for cities in Andhra highlighted that concentrations in three cities where the data was available from the pollution control board were higher than the annual average of 6 µg/m 3 as prescribed under NAAQS. concentrations in Anantpuram, Guntur and Visakhapatnam were respectively 84, 1 and 61 µg/m 3 for year 215. Andhra concentrations across cities in Andhra during ( µg/m 3 ) Anantpuram Guntur Vishakapatnam three cities In Andhra recorded Annual average naaqs (annual) PM Further analysis of the monthly variations in the data during 215 suggests 1 levels higher than that the levels in all three cities were constantly higher than the the annual average of 6 µg/m 3 as annual average prescribed by CPCB throughout the year. From concentrations from January to May were relatively high as compared to other time of the year worsening the situation to even dangerous levels. prescribed under NAAQS concentrations across cities in Andhra during ( µg/m 3 ) 1 5 Jan Feb mar apr may jun jul aug sep oct nov dec Anantpuram Guntur Vishakapatnam Naaqs (Annual) 5
8 Bihar The assessment of Air Pollution levels for cities in Bihar highlighted that concentrations in Patna and Muzzafarpur were respectively at 2 µg/ m 3 and 164 µg/m 3 for year 215, which were at around 3 times the NAAQS annual limit set by CPCB and 8 to 1 times the annual limit set by WHO for. The data is not just an indicator of hazardous levels of pollution but a continuously ringing alarm for years indicating the health emergency faced by the people inhabiting the area. concentrations across cities in Bihar during ( µg/m 3 ) Patna Muzzafarpur Patna and Muzzafarpur In Bihar recorded levels 3 times the NAAQS annual limit set by CPCB Annual average naaqs (annual) Detailed observation of the data suggests that the levels has been hazardous and very high all around the year for 215 for both Patna and Muzzafarpur with November to March being the severely polluted months when the concentrations even reached above 3 µg/m 3. Guttikunda and Jawahar 214 3, conducted a study to understand pollution contribution within city of Patna for base year 212. They found that overall contribution to the pollution load within the city varied from source to source. They found that the transport, road dust, domestic sources, generator sets, open waste burning, manufacturing industry, brick kilns and construction activities respectively contributed approximately 13-22%, 14-19%, 12-16%, 5-6%, 9-11%, 5-1%, 11-29% and 8-13% to the total emission load in the city. It is important to note that emissions within the city are different from contributions to ambient levels, as a large part of the pollution in ambient air comes from outside the city. The same paper also mentioned that the Greater Patna area has 26 premature deaths, 2,, asthma attacks and 11 cardiac admissions due to exposure to ambient air pollution levels in Patna in 212. concentrations across cities in Bihar during Guttikunda, S.K. and P. Jawahar, 214. Characterizing Patna s Ambient Air Quality and Assessing Opportunities for Policy Intervention, UrbanEmissions.Info (Ed.), New Delhi, India, shaktifoundation.in/wpcontent/uploads/214/2/ AQM-in-Patna Final-Report.pdf Jan Feb mar apr may jun jul aug sep oct nov dec Patna Muzzafarpur Naaqs (Annual) 6
9 The assessment of Air Pollution levels for Chandigarh highlighted that concentrations are 85 µg/m 3 for year 215, which were at higher than the NAAQS annual limit set by CPCB and about 4 times the annual limit set by WHO for. Detailed observation of the data suggests that the levels has been very high all around the year for 215 for Chandigarh with October to February being the severely polluted months when the concentrations even reached above 1 µg/m 3. Chandigarh concentrations in Chandigarh during Jan Feb mar apr may jun jul aug sep oct nov dec Chandigarh Naaqs (Annual) Chandigarh recorded levels 4 times the annual limit set by WHO Chaudhary et al., 24 4 carried out source apportionment study for Chandigarh in 21, which attributed 24% of total primary PM 2.5 pollution levels from fossil fuel combustion (coal, diesel, and gasoline) and 9 % to the biomass combustion in Chandigarh. The same study also highlighted that during the summer time secondary particulate formation and oil (Diesel & Petrol) consumption were the biggest contributors to the overall particulate matter concentrations. Others 1% Diesel 7% Secondary Ammonium 6% secondary nitrate 2% Petrol 17% Secondary Sulphate 16% Biomass Burning 9% Road Dust 33% 4 Chowdhury, Zohir; Zheng, Mei and Russell, Armistead, 24, Source Apportionment and Characterization of Ambient Fine Particles in Delhi, Mumbai, Kolkata, and Chandigarh Georgia Institute of Technology, Atlanta Georgia, gatech.edu/bitstream/ handle/1853/1872/e- 2-H76_ pdf 7
10 Chhattisgarh The assessment of Air Pollution levels for cities in Chhattisgarh highlighted that concentrations in four cities where the data was available from pollution control board were higher than the annual average of 6 µg/m 3 as prescribed under NAAQS. concentrations in Bhilai, Korba, Raipur and Siltara were respectively 19, 66, 138 and 145 µg/m 3 for year concentrations across cities in Chhattisgarh during April March ( µg/m 3 ) Bhilai Korba Raipur Siltara Annual average naaqs (annual) Detailed observation of the data suggests that the levels has been hazardous and very high all around the year for for Most cities Detailed observation of the data suggests that the levels has been hazardous and very high all around the year for for all the cities except Korba which shows PM1 levels close to NAAQS throughout the year. Korba has been declared 5th in the list of the 24 most critically polluted areas in the country 5 by CPCB. The same report also highlighted Coal Based Power Plants and Smelter Plants as major sources of air pollution along with fugitive emissions from coal mines in the area. Deshmukh et al., highlighted vehicular growth, coal burning in steel industry and thermal power plants, other industrial activities, biomass burning, brick kilns and domestic fuel use as the major factors contributing to air pollution in Raipur, although the contribution to total pollution from respective sources has not been attributed. concentrations across cities in Chhattisgarh during April March apr may jun jul aug sep oct nov dec Jan Feb mar Bhilai Korba Raipur Siltara Naaqs (Annual) 5 divisionsofheadoffice/ess/ Korba.pdf 6 sci-hub.cc/article/1.17/ s
11 The assessment of Air Pollution levels for Delhi highlighted that concentrations are 268 µg/m 3 for year 215, which were at 4.5 times higher than the NAAQS annual limit set by CPCB and about 13 times the annual limit set by WHO for. Detailed observation of the data suggests that the levels has been very high all around the year for 215 for Delhi with October to February being the severely polluted months when the concentrations even touched 5 µg/m 3. Delhi Air Pollution levels for Delhi highlighted that concentrations are 268 µg/m 3 for year 215, which were at 4.5 times higher than the NAAQS annual limit set by CPCB and about 13 times the annual limit set by WHO It has been long established as the pollution capital of the world by WHO, and most of the debate on air pollution in India are still centered around Delhi. Various studies have been done to understand the source contribution to Delhi s Air pollution, the most recent being the study by IIT Kanpur 8. According to the study, The total emission load in the city is estimated to be 143 t/d (based on average annual activity data). The top four contributors to emissions are road dust (56%), concrete batching (1%), industrial point sources (1%) and vehicles (9%); these are based on annual emissions. According to the study control measures applied at the power plants within 3 KM radius of Delhi will effectively reduce and PM 2.5 concentration by about 62 µg/m 3 and 35 µg/m 3 respectively. Similarly 9% reduction in NO x can reduce the nitrates by 45%. This will effectively reduce and PM 2.5 concentration by about 37 µg/m 3 and 23 µg/m 3 respectively. It implies that control of SO 2 and NO x from power plants can reduce concentration approximately by 99 µg/m 3 and for PM 2.5 the reduction could be about 57 µg/m 3. Furthermore, the study highlighted that, The contribution of the biomass burning in winter is quite high at 17% (for ) [and] 26% (for PM 2.5 ). Biomass burning is prohibited in Delhi and it is not a common practice at a large scale. The enhanced concentration of PM in October-November is possibly due to the effect of post-monsoon crop residue burning (CRB). It can be seen that the biomass contribution in in the month of November could be as high as 14 µg/m 3 and about 12 µg/m 3 for PM 2.5 (mean of contribution in entire winter season: 97 µg/m 3 and 86 µg/m 3 respectively). In all likelihood, the PM from biomass burning is contributed from CRB [crop residue burning] prevalent in Punjab and Haryana in winter. concentrations in Delhi during August 214- July aug sep oct nov dec Jan Feb mar apr may jun jul Delhi Naaqs (Annual) 7 health_topics/outdoorair/ databases/cities-214/en/ 8 Environment/PDFs/Final_ Report.pdf 9
12 Gujarat The assessment of Air Pollution levels for cities in Gujarat highlighted that concentrations in five cities where the data was available from pollution control board were higher than the annual average of 6 µg/m 3 as prescribed under NAAQS. concentrations in Bhavnagar, Gandhi Nagar, Jamnagar, Rajkot and Vadodara were respectively 91, 82, 88, 86 and 86 µg/ m 3 for financial year concentrations across cities in Gujarat during April March Bhavnagar Gandhi Nagar Jamnagar Rajkot Vadodhara Detailed concentrations in Bhavnagar, Gandhi Nagar, Jamnagar, Rajkot and Vadodhra were respectively 91, 82, 88, 86 and 86µµg/ m 3 for year Detailed observation of the data suggests that the levels have been very high all around the year for for all the cities in Gujarat. Guttikunda and Jawahar, estimated that power plants contribute to 39% of pollution load in Ahmedabad and 31% to PM 2.5, with transportation contributing to 16% and 27% to and PM 2.5 respectively. In Surat and Rajkot the contribution of transportation to overall were 3% & 26% and PM 2.5 concentration were 42% & 4% respectively. Contribution from industrial sector to levels of 12 % and 25% and PM 2.5 levels of 2% and 36% in Surat and Rajkot respectively. Annual average naaqs (annual) concentrations across cities in Gujarat during April 214- March apr may jun jul aug sep oct nov dec Jan Feb mar Bhavnagar Gandhi Nagar Jamnagar Rajkot Vadodhara Naaqs (Annual) 9 Guttikunda and Jawahar, 211, Simple Interactive Models for Better Air Quality, Urban Air Pollution Analysis in India, UrbanEmissions.Info, New Delhi, India, wp-content/uploads/docs/ SIM pdf 1
13 Contribution of major sources to emissions inventory Contribution of major sources to PM 2.5 emissions inventory Ahmedabad Ahmedabad BK 7% IND 2% CON 2% WB 4% RD 22% GS 5% BK 11% IND 4% CON 1% WB 5% GS 3% DOM 9% RD 7% DOM 5% TR 16% TR 27% PP 31% PP 39% Surat Surat IND 12% GS 3% BK 7% CON 2% DOM 1% BK 1% GS 3% WB 5% DOM 7% IND 2% TR 3% RD 34% TR 42% CON 1% WB 6% RD 8% rajkot rajkot GS 1% IND 25% QR 11% DOM 3% IND 25% GS 1% CON 1% WB 3% DOM 3% TR 26% RD 3% TR 26% WB 3% QR 11% CON 1% RD 3% TR- Transport BK- Brick Kilns; GS- Generator Sets; DOM- Domestic Fuel Combustion; CMQ- Construction Material rocessingat quarries; RD- Road Dust; WB- Open Waste burning; PP: Power Plant 11
14 Haryana The assessment of Air Pollution levels for cities in Haryana highlighted that concentrations in four cities where the data was available from pollution control board were higher than the annual average of 6 µg/m 3 as prescribed under NAAQS. concentrations in Faridabad, Gurgaon, Panchkula and Rohtak were respectively 24, 129, 92 and 92 µg/m 3 for year 215. concentrations across cities in Haryana during Faridabad Gurgaon Panchkula Rohtak Annual average naaqs (annual) levels has been hazardous all around the year for 215 with Faridabad and Gurgaon showing severe pollution levels Detailed observation of the data suggests that the levels have been hazardous and very high all around the year for 215 for all the cities wherever data is available Faridabad and Gurgaon being the places which are severely polluted along with all other places having higher concentrations reaching above NAAQS. concentrations across cities in Haryana during Jan Feb mar apr may jun jul aug sep oct nov dec Bhilai Gurgaon Panchkula Rohtak Naaqs (Annual) 12
15 The assessment of Air Pollution levels for cities in Jharkhand highlighted that concentrations in all 1 locations where the data was available from pollution control board were higher than the annual average of 6 µg/ m 3 as prescribed under NAAQS. concentrations in Jharia, Ranchi, Kusunda and Bastacola were respectively 228, 216, 214 and 211 µg/m 3 for year 215. Jharkhand concentrations across cities in Jharkhand during Bastacola Dhanbad Girdih Annual average Hazaribagh Jamshedpur Jharia Kusunda naaqs (annual) Ranchi Sindri West Singhbhumi Ranchi, Kusunda, Jharia and Bastacola are the places which are severely polluted with levels being above 2 µg/ m 3 all year long Detailed observation of the data suggests that the levels has been hazardous and very high all around the year for 215 for all the cities wherever data is available. Ranchi, Kusunda, Jharia and Bastacola are the places which are severely polluted with levels being above 2 µg/m 3 all the time during the year along with all other places having higher concentrations reaching above NAAQS. Pandey et al., highlighted that the major causes of air pollution in area near Jharia including Bastacola, Dhansar, Ena, CIMFR are coal mining, mine fires, vehicular pollution, windblown dust through unpaved roads and over burdens in the area. concentrations across cities in Jharkhand during Jan Feb mar apr may jun jul aug sep oct nov dec Bastacola dhanbad girdih hazaribagh jamshedpur jharia kusunda ranchi sindri west singhbhumi Naaqs (Annual) 1 Pandey et al., 214, Assessment of air pollution around coal mining area: Emphasizing on spatial distributions, seasonal variations and heavy metals, using cluster and principal component analysis, Atmospheric Pollution Research, 5, 79-86, com/science/article/pii/ S
16 karnataka The assessment of Air Pollution levels for cities in Karnataka highlighted that concentrations in 9 towns and cities out of the 21 where data was available from pollution control board were higher than the annual average of 6 µg/m 3 as prescribed under NAAQS. concentrations in Davanagere, Bangalore, Tumkur, Raichur and Hubli were respectively 19, 119, 118, 87 and 8 µg/m 3 for year concentrations across cities in Karnataka during April March concentrations in 9 towns/cities out of 21 were higher than the annual average of 6 µg/m 3 as prescribed under NAAQS Annual average bangalore kolar tumkur mandya mysore chamrajnagar hassan mangalore karwar chitradurga bhadravathi ranebennur davanagere dharwad hubli belguam gulbarga naaqs (annual) TERI estimated emission load and source contribution to pollution for Bangalore and estimated that, At the city level, the major sources of emissions are transport (42%), road dust resuspension (2%), construction (14%), industry (14%), DG set (7%) and domestic (3%). Likewise, at the city level, major sources of NO x are transport (68%), DG set (23%), industry (8%) and domestic (1%). In case of SO 2, at the city level, industry (56%, DG set (23%) and transport (16%) are the major sources. The same report through source apportionment also highlighted: Share of transportation increases from 19% in to 5% in PM 2.5, depicting dominance of finer particles in the vehicular exhaust. Share of anthropogenic sources has been eclipsed by dust contribution, in case of. However, PM 2.5 clearly shows significant contribution of anthropogenic sources. DG sets have emerged out as an important source of air pollution. Their contribution is 13% & 25% in and PM 2.5, respectively. Contribution of industries to the particulate matter is low in Bangalore, primarily due to absence of any large scale air polluting unit. However, their contribution in the industrial zone (Peenya) is high. Share of secondary particulates is higher in PM 2.5 than, depicting their finer size. raichur bellary bidar 11 Air quality assessment, emission inventory and source apportionment study for Bangalore city: Final report, New Delhi: The Energy Resources Institute, 186 pp. [Project Report No. 24EE28], nic.in/bangalore.pdf 14
17 Figure: Percentage share of different sources in total and NOx emission loads no x Hotel % Hotel % construction 14% Industrial 14% Transport 42.% DG set 7.% Industrial 14% DG set 7.% Domestic 3% Transport 42.% Domestic 3% road dust 2% Figure: Comparison of and PM 2.5 source contribution in Bangalore city (average of 3 seasons) PM 2.5 secondary 8.7% Transport 19.% Paved road & Soil dust 3.5% secondary 12.7% Domestic 5.8% DG set 13.% Industrial 3.5% Transport 49.9% Paved road & Soil dust 5.6% Domestic 4.2% Industrial 4.5% DG set 24.7% 15
18 Madhya The assessment of Air Pollution levels for cities in Madhya highlighted that concentrations in all 4 cities where the data was available from pollution control board were higher than the annual average of 6 µg/m 3 as prescribed under NAAQS. concentrations in Bhopal, Satna, Singrauli and Gawalior were respectively 158, 88, 93 and 128 µg/m 3 for 215. concentrations across cities in Madhya during bhopal satna singrauli gawalior Annual average naaqs (annual) vehicular emissions, air born dust and industrial emissions are major emission load contributors to in Indore The data suggests that the levels have been hazardous and very high all around the year for 215 for all the cities, with January to May being the most severely polluted months. Highest recorded monthly average concentration exceeded 2 µg/m 3 for Gwalior, in April. The average levels in Indore between September 29 and June 21 were 195 µg/m 3 according to a study by MPPCB that also mentioned vehicular emissions, airborne dust, and industrial emissions as major emission load contributors to in Indore by MPPCB 12, in Comprehensive Environment Pollution Abatement action Plan for Critically Polluted area Indore. concentrations across cities in Madhya during Jan Feb mar apr may jun jul aug sep oct nov dec bhopal gawalior satna singrauli Naaqs (Annual) 12 Madhya Pollution Control Board, Comprehensive Environment Pollution Abatment action Plan for Critically Polluted area Indore, divisionsofheadoffice/ess/f- Indore.pdf 16
19 The assessment of Air Pollution levels for cities in Maharashtra highlighted that concentrations in every single one of the 25 cities where the data was available from pollution control board were higher than the annual average of 6 µg/m 3 as prescribed under NAAQS. concentrations in Nanded, Taloja, Akola, Jalna, Thane, Mumbai and Chandrapur were respectively 162, 126, 128, 118, 118, 17 and 13 µg/m 3 for year 215. Maharashtra concentrations across cities in Maharashtra during In Mumbai, the main contributors for PM, like power plant, open burning, commercial food sector, and road transport akola ambernath amravati aurangabad badlapur bhiwandi chandrapur dombivalli Annual average jalgaon jalna naaqs (annual) Detailed observation of the data suggests that the levels were hazardous and very high all around the year for 215 for all the cities except for the monsoon months. October to January were the most severely polluted months, with average concentrations even exceeding 15 µg/m 3. kalyan kolhapur latur mumbai nagpur nanded nashik navi mumbai panvel pune sangli solapur taloja thane ullasnagar 13 Maji, et al., 216, Human health risk assessment due to air pollution in 1 urban cities in Maharashtra, India, Cogent Environmental Science, 2(1), , / pdf 14 CPCB. (21). Air quality assessment, emissions inventory and source apportionment studies: Mumbai [online]. Central Pollution Control Board. Retrieved November 23, 214, from Mumbai-report.pdf 15 MPCB. (21). Action plane for industrial cluster: Chandrapur. Maharashtra Pollution Control Board. Retrieved February 14, 215, from in/divisionsofheadoffice/ ess/ Action%2plan%2CEPI- Chandrapur.pdf 16 ARAI. (21). Air quality monitoring and emission source apportionment study for city of Pune [online]. Pune: The Automotive Research Association of India, [ARAI/ IOCLAQM/R-12/29-1]. Retrieved March 21, 215, from nic.in/pune.pdf Maji et al., mentioned, In Mumbai, different combustion processes are the main contributors for PM, like power plant, open burning, commercial food sector, and road transport, and they contribute 37, 24, 18, and 1%, respectively. A study by National Environmental Engineering Research Institute (NEERI) found that open burning and landfill fires of municipal solid waste (MSW) were a major source of air pollution in Mumbai (CPCB, ). The survey results show that about 2% of total generated MSW is burnt on the streets and slum areas, 1% of the total generated MSW is burnt in landfills by management authorities or due to accidental landfill fires, thereby emitting large amounts of CO, PM, carcinogenic HC, and NO x. In Chandrapur, primary sources of high critical pollutant concentration (i.e. SPM,, SO 2, and NO 2 ) are open coal mining, lime stone mining, fluoride mining, cement industry, thermal power plant, road dust, natural burning of coal, and domestic coal burning by local people for cooking (MPCB, ). Within the city of Pune, highest shares of emissions of come from road dust (61%), vehicular sources (18%), industry (1.25%), vegetative burning, and solid fuels burning. For NO 2 emissions, major contributions are from vehicles (95%), industries (2%), and domestic and commercial fuel burning (3%) (ARAI, ), due to absence of major industrial emitters within the city boundaries. Vehicles and industries contribute to high SO 2 emission loads due to fuel burning. Main cause of air pollution in Nashik city is due to plastic industry, food 17

20 Maharashtra (cont) processing factories, and domestic waste burning. Till December 213, there are 1.13 million registered vehicles in the city, constituting a major source of pollution (TI, ). Similarly, Kothai et al., carried out a source apportionment study for Navi Mumbai and estimated that percentage contribution of soil, twostroke emission with fugitive dust, industrial emission, motor vehicles and sea salt to the average fine mass concentration was 3%, 18%, 23%, 29% and 9%, respectively concentrations across cities in Maharashtra during Jan Feb mar apr may jun jul aug sep oct nov dec akola ambernath amravati aurangabad badlapur bhiwandi chanderpur Dombivalli jalgaon jalna kalyan kolhapur latur mumbai nagpur nanded nashik navi mumbai panvel pune sangli solapur taloja thane ullasnagar Naaqs (Annual) 17 TI. (214). Vehicles in Nashik region rise by nearly 1% [online]. The Times of India. Retrieved January 23, 215, from indiatimes.com/city/ nashik/vehicles-in-nashikregion-rise-by-nearly-1/ articleshow/ cms Tominz, R., Mazzoleni, B., & Daris, F. 18 Kothai, et al., 28, Source Apportionment of Coarse and Fine Particulate Matter at Navi Mumbai, India, Aerosol and Air Quality Research, Vol. 8, No. 4, pp , December28/5_AAQR-8-7-OA-27_ pdf 18
21 The assessment of Air Pollution levels for cities in Odisha highlighted that concentrations in Keonjhar and Rourkela were higher than the annual average of 6 µg/m 3 as prescribed under NAAQS. concentrations in Berhampur were found to be below the NAAQS for year 215. odisha (orissa) concentrations across cities in Odisha during berhampur Annual average keonjhar rourkela naaqs (annual) SPCB Orissa, 21 carried out a study to understand the emission loading and pollution contribution in Angul- Talcher area and found out that the average levels were between Detailed observation of the data suggests that the levels have been very high all around the year for 215 at Rourkela whereas for Keonjhar and Berhampur the pollution levels were higher in months of September to January. SPCB Odisha, carried out a study to understand the emission loading and pollution contribution in Angul-Talcher area and found out that the average levels were between and, The major industries contributing to air pollution are thermal power plants of NALCO and NTPC and Smelter of NALCO besides sponge iron plants like BRG Iron & Steel and Bhusan Steel Ltd. Apart from the above sources the fugitive emissions from the burning of wood and coal as domestic fuel, transportation of vehicles and emissions from the mines also contribute to air pollution in the area. concentrations across cities in Orissa during Jan Feb mar apr may jun jul aug sep oct nov dec berhampur keonjhar rourkela Naaqs (Annual) 19 SPCB Orissa, 21, Action plan for abatement of pollution in critically polluted industrial clusters (Angul- Talcher area), in/divisionsofheadoffice/ess/ Action%2Plan%2Angul- Talcher.pdf 19
22 Punjab The assessment of Air Pollution levels for cities in Punjab highlighted that concentrations in all 14 cities where the data was available from pollution control board were higher than the annual average of 6 µg/m 3 as prescribed under NAAQS. concentrations in Amritsar, Jalandhar, Ludhiana, Mandi Gobindgarh, Khanna and Bhatinda were respectively 184, 151, 139, 13, 122 and 111 µg/m 3 for year 215. concentrations across cities in Punjab during ( µg/m 3 ) 1 5 Industrial combustion contributes 47% of the emissions followed by brick and open burning amritsar bhatinda dera baba nanak dera bassi faridkot Annual average jalandhar naaqs (annual) Detailed observation of the data suggests that the levels were hazardous and very high all around the year for 215 for all the cities with October to January being the severely polluted months. Highest monthly average levels, exceeding 2 µg/m 3 were recorded in Jalandhar in December and in Amritsar in April-May. khanna ludhiana mandi gobindgarh naya nagal patiala rasulpur sangrur sbs nagar emissions Kt/yr State wise emission assessment study (TERI, ) shows sector-wise emissions for the Punjab state (Figure). Industrial combustion contributes 47% of the emissions followed by brick-making and open burning. Almost 56 % of NO x emissions are contributed by transport sector in Punjab including both road transport and mode of transportation used during agricultural activities. concentrations across cities in Punjab during SOx nox PM 2.5 Figure: Sector-wise emissions for criteria pollutants from different sources in Punjab in Jan Feb mar apr may jun jul aug sep oct nov dec Agricuture Transport Open Burning Brick ind_comb residential Non-road transport amritsar jalandhar patiala bhatinda khanna rasulpur dera baba nanak ludhiana sangrur dera bassi mandi gobindgarh sbs nagar cement ind_proc road transport power faridkot naya nagal Naaqs (Annual) 2 TERI, 215. Air pollution in Punjab, New Delhi: The Energy and Resources Institute. 16 pp., 2
23 The assessment of Air Pollution levels for cities in Rajasthan highlighted that concentrations in 4 cities where the data was available from pollution control board were higher than the annual average of 6 µg/m 3 as prescribed under NAAQS. concentrations in Alwar, Jaipur, Kota and Udaipur were respectively 227, 171, 134 and 156 µg/m 3 for year 215. Rajasthan concentrations across cities in Rajasthan during 215 ( µg/m 3 ) alwar jaipur kota udaipur Annual average naaqs (annual) concentrations in Alwar, Jaipur, Kota and Udaipur were respectively 227, 29, 134 and 156 µg/m 3 for year 215 Detailed observation of the data suggests that the levels were hazardous and very high all around the year for 215 for all the cities, with the pollution moderating somewhat in most cities in the summer months. October to January were the most severely polluted months, with concentrations reaching above2 µg/m 3. concentrations across cities in Rajasthan during Jan Feb mar apr may jun jul aug sep oct nov dec alwar jaipur kota udaipur Naaqs (Annual) 21
24 Tamil Nadu The assessment of Air Pollution levels for cities in Tamilnadu highlighted that concentrations in Chennai were higher than the annual average of 6 µg/m 3 as prescribed under NAAQS. Detailed observation of the data suggests that the levels has been high all around the year for 215 for Chennai. concentrations across cities in Tamil nadu during 215 ( µg/m 3 ) chennai cuddalore Annual average naaqs (annual) Industrial combustion contributes 47% of the emissions followed by brick and open burning No source apportionment studies were available for Tamil Nadu. Within the city of Chennai, CPCB, highlighted that the share of vehicular exhaust emissions was 14%, industrial sector 2%, DG sets less than 1%, construction activities approx. 9% of total emission load with nearly 72% contribution from fugitive dust emissions. concentrations across cities in Tamil Nadu during Jan Feb mar apr may jun jul aug sep oct nov dec chennai Naaqs (Annual) EMISSION INVENTORY CHENNAi RESTAURANTS/ BAKERIES STREET VENDORS.8, 1% Others.11, 1% INDUSTRY POINT.22, 2.% CONSTRUCTION.98, 8.89% DOMESTIC COMBUSTION.3,.27% VEHICLE EXHAUST 1.59, 14% 21 CPCB, 211, Air quality monitoring, emission inventory and source apportionment study for Indian cities: National Summary Report, public-information/rpt-airmonitoring pdf PAVED & UNPAVED ROAD / DUST 8.1, 72.69% 22
25 The assessment of Air Pollution levels for cities in Telangana highlighted that concentrations in 4 cities where the data was available from pollution control board were higher than the annual average of 6 µg/ m 3 as prescribed under NAAQS. concentrations in Mahboobnagar, Hyderabad, Karim Nagar and Khammam were respectively 18, 99, 65 and 6 µg/m 3 for year 215. Telangana cconcentrations across cities in Telangana during ( µg/m 3 ) Results of CMB Model showed that major source throughout the study period were resuspended dust (4%) for and 31% for PM 2.5 mehboobnagar hyderabad Annual average warangal karim nagar naaqs (annual) khammam Gummeneni, et al., conducted a source apportionment study for Hyderabad and concluded as, Results of CMB Model showed that major source throughout the study period were re-suspended dust (4%) for and 31% for PM 2.5. Vehicles has also contributed significant influence on particulate matter levels at the site for both (22%) and PM 2.5 (31%). Other major identified sources of particulate matter were industrial emissions, combustion and refuse burning. Figure: Source contribution to and PM 2.5 PM 2.5 Others 9% Others 21% Refuse 9% Resuspended dust 26% Industrial 9% Resuspended dust 4% Refuse 6% Combustion 12% Vehicles 22% Industrial 7% Combustion 9% Vehicles 31% 22 Gummeneni, S., et al., Source apportionment of particulate matter in the ambient air of Hyderabad city, India, Atmos. Res. (211), doi:1.116/j. atmosres
26 The assessment of Air Pollution levels for cities in highlighted that concentrations in all 2 cities 23 where the data was available from pollution control board were higher than the annual average of 6 µg/m 3 as prescribed under NAAQS. concentrations in Gaziabad, Braeli, Allahabad, Kanpur, Agra, Lucknow, Varanasi 24 (Average of levels from October 215 to September 216 is 228 µg/m 3 for Varanasi) and Sonebhadra were respectively 258, 24, 25, 21, 186, 169, 145 and 132 µg/m 3 for year 215. concentrations across cities in during In Kanpur For NO x emissions nearly 5% of emissions are attributed to vehicles that occur at ground level FUNERAL WOOD / CREMATION.5,.58% GARBAGE BURNING.47, 5.9% DG SETS.8,.87% MEDICAL WASTE INCINERATOR.2,.2% AGRICULTURAL WASTE BURNING.35, 3.84% DOMESTIC COMBUSTION 1.76, 18.64% ( µg/m 3 ) varanasi agra allahabad baraeli firozabad gajrola gaziabad Annual average gorakhpur jhansi naaqs (annual) Detailed observation of the data suggests that the levels has been hazardous and very high all around the year for from October 215 to September 216 for all the cities, with October to February being the severely polluted months when the concentrations even reached near to 4 µg/m 3. Sharma, carried out a source apportionment study for Kanpur and concluded as, There are several important sources of in the city including industrial point sources (26%), industry area source (7 %), vehicles (21%), domestic fuel burning (19%) paved and unpaved road (15%), garbage burning (5%) and rest others. For NO x emissions nearly 5% of emissions are attributed to vehicles that occur at ground level, probably making it the most important pollutant. Vehicle sources are followed by industrial point and area sources (42%), DG sets (5%) and domestic sources and rest others (3%). kanpur khurja lucknow mathura meerut mooradabad noida raebareli saharanpur sonebhadra unnao INDUSTRY AREA.64, 6.94% concentrations across cities in during October September 216 INDUSTRY POINT 2.39, 25.59% HOTEL / RESTAURANT.3, 3.26% VEHICLE EXHAUST 1.91, 2.5% PAVED & UNPAVED ROAD / DUST 1.35, 14.46% oct nov dec Jan Feb mar apr may jun jul aug sep CONSTRUCTION.3,.3% agra allahabad baraeli firozabad gajrola gaziabad gorakhpur jhansi kanpur khurja lucknow mathura meerut mooradabad noida 23, 24, 25 Footnotes on page 25 raebareli Naaqs (Annual) saharanpur sonebhadra unnao varanasi 24
27 The assessment of Air Pollution levels for cities in akhand highlighted that concentrations in all 6 cities where the data was available from pollution control board were higher than the annual average of 6 µg/m 3 as prescribed under NAAQS. concentrations in Deharadun, Haldwani, Haridwar, Kashipur, Rishikesh and Rudrapur were respectively 186, 139, 123, 17, 121 and 124 µg/m 3 for year 215. akhand concentrations across cities in akhand during ( µg/m 3 ) 1 5 dehradun haldwani haridwar kashipur rishikesh rudrapur for all the cities with October to February being the severely polluted months when the concentrations reached near to 2 µg/m 3 Annual average naaqs (annual) Detailed observation of the data suggests that the levels has been hazardous and very high all around the year for from October 215 to September 216 for all the cities with October to February being the severely polluted months when the concentrations even reached near to 2 µg/m 3. concentrations across cities in Uttrakhand during Jan Feb mar apr may jun jul aug sep oct nov dec dehradun haldwani haridwar kashipur rishikesh rudrapur Naaqs (Annual) Page 24 footnotes 23 Data for Firozabad is from August 214 to July Average concentration from October 215 to September 216 is 228 µg/ m 3, whereas for 215 calendar year it was shown to be 145 µg/m 3 by the UPPCB data collected through RTI. 25 Sharma, 21, Air Quality Assessment, Emissions Inventory and Source Apportionment Studies for Kanpur City, IIt Kanpur, Submitted to CPCB, cpcb.nic.in/kanpur.pdf 25
28 Way forward Government initiative It requires a system approach to understand pollution levels regularly and take action. The first step in the direction is having a robust monitoring of air quality across the country to know information in real time and using the data to arrive at strategies that would protect public health and reduce pollution levels. The strategies to reduce pollution should become an action plan which is time bound and has targets and penalties. Action Plan Governments of India should adopt time-bound national and regional action plans, which have clear targets for regions and penalties for non-compliance. This should include providing transparent data to the public on air quality, short term and long term measures to reduce air pollution. Transparent data Short term measures Long term measures Improving NAQI monitoring systems and providing access to data to the public on a real time basis for the whole country. This should be coupled with a health advisory which would enable the public to take decisions to protect their health and the environment. Issuing red alert and health advisories during bad air-days, shutting down schools, taking polluting vehicles (odd/ even) off the roads, shutting down power plants and industries etc. Improving public transport, limiting the number of polluting vehicles on the road, Introducing less polluting fuel (Bharat VI), Strict emission regulations and improved efficiency for thermal power plants and industries, moving from diesel generators to rooftop solar, increased use of clean renewable energy, Electric vehicles, Removing dust from roads, regulating construction activities, stopping biomass burning etc. People initiative Public participation is critical in reducing air pollution. Our choices for electricity and transportation could play a major role in managing pollution levels in many parts of the country. Efforts should be made in key areas such as: 1 Moving towards roof top solar 2 Increased usage of public transport, cycling and walking 3 Using energy efficient appliances and reducing household energy usage 4 Waste minimization, segregation and recycling, which will reduce burning of waste in streets as well as at the landfills along with energy reductions in transporting huge quantities of waste 26
29 Comparison of facts on air pollution in the world s four major economies26 China India U.S. EU Change in satellite-based PM 2.5 levels from 21 to % +13% -15% -2% (from 25 to 213) PM 2.5 trend PM 2.5 in capital city, annual (µg/m 3 ) PM 2.5 air quality standard, annual (µg/m 3 ) Deaths per day from air pollution in 213 Online PM 2.5 monitoring Falling since 211; 215 was the best on record Increasing steadily for past 1 years; 215 was the worst year on record Falling since measurements started Falling since measurements started (from 22, 2) 2,7 1, ,5 stations in 9 cities & towns 39 stations in 23 cities (as of Feb 216) 77 stations in 54 cities & towns 1, stations in 4 cities & towns Share of thermal power plants with basic pollution controls (desulphurization, particle controls) 95% 1% 6% 75% Deadline for meeting national air quality standards Consequences for missing targets Coverage of government measures 23; most key cities have an interim target for 217 Promotion of province governors depends on meeting targets National, regional and city-level action plans with measurable 5-year targets National emission standards for power plants, industrial sectors and vehicles None None Mainly action in individual cities with no measurable targets Recently introduced India-wide emission standards for thermal power plants; Introduction of Bharat VI vehicle emission norms is proposed by April ; violating areas are currently implementing new plans States must adopt emission reduction measures into law that are demonstrated to enable meeting targets; must account for pollution transport into downwind states; periodic review National air quality targets; implementation plans approved on federal level and executed on state level National emission standards for power plants, industrial sectors and vehicles 25 by by 22 Cities & countries face legal action for not meeting standards Clean Air For Europe action plan Europe-wide emission standards for power plants, industry and cars Most countries and key cities have own plans
30 Appendix-I Levels across India (Annual Average ) City State Annual Average NAAQS (Annual) Time Frame Reference Source 28 Delhi Delhi Gaziabad Allahabad Braeli Faridabad Haryana Jharia Jharkhand Alwar Rajasthan Ranchi Jharkhand Kusunda Jharkhand Bastacola Jharkhand Kanpur Patna Bihar Firozabad Agra Deharadun Uttrakhand Amritsar Punjab Gajrola Jaipur Rajasthan Lucknow Dhanbad Jharkhand Mooradabad Saharanpur Khurja Muzzafarpur Bihar Nanded Maharashtra Gorakhpur For few Cities where annual averages for 215 were not easily available, lates data as well as for Gwalior data from is included 28 Provided on after the current table 28
31 City State Annual Average NAAQS (Annual) Time Frame Reference Source 28 Mathura Bhopal Raebareli Madhya Udaipur Rajasthan Jodhpur Rajasthan Jalandhar Punjab Noida Meerut Siltara Chhattisgarh Varanasi April March Ludhiana Punjab Haldwani Uttrakhand Raipur Chhattisgarh April March Nagaon Assam Panvel Maharashtra Anpara Talcher Odisha Jamshedpur Jharkhand Kota Rajasthan Sonbhadar Mandi Gobindgarh Punjab Gurgaon Haryana Akola Maharashtra Gawalior Madhya August July Taloja Maharashtra Jammu Jammu & Kashmir
32 Appendix-I Levels across India (Annual Average ) City State Annual Average NAAQS (Annual) Time Frame Reference Source 28 Navi Mumbai Maharashtra Rudrapur Uttrakhand Haridwar Uttrakhand Girdih Jharkhand Byrnihat Meghalaya Dimapur Nagaland Khanna Punjab Rishikesh Uttrakhand Nalbari Assam Bangalore Karnataka Jhansi Kala Amb Himachal Tumku Karnataka April March 216 Jalna Maharashtra Thane Maharashtra Unnao Ponta Sahib Himachal Hazaribagh Jharkhand Bhatinda Punjab Vijaywada Andhra Patiala Punjab West Singhbhumi Jharkhand Bhilai Chhattisgarh Davanagere Karnataka Amravati Maharashtra Jalgaon Maharashtra Mahboobnagar Telangana Mumbai Maharashtra
33 City State Annual Average NAAQS (Annual) Time Frame Reference Source 28 Ullasnagar Maharashtra Kashipur Uttrakhand Damtal Himachal Badlapur Maharashtra Kolkata West Bengal Sagar Madhya Domdivali Maharashtra Chandrapur Maharashtra Angul Odisha Baddi Himachal Ambernath Maharashtra Rourkela Odisha Guntur Andhra Sangrur Punjab Guwahati Assam Indore Madhya Kolhapur Maharashtra Dera Bassi Punjab Gulbarga Karnataka Ujjain Madhya Kohima Nagaland Hyderabad Telangana Singrauli Madhya Panchkula Haryana Rohtak Haryana Tuticorin Tamil Nadu Bhavnagar Gujarat 91 6 April March
34 Appendix-I Levels across India (Annual Average ) City State Annual Average NAAQS (Annual) Time Frame Reference Source 28 Dewas Madhya Nagpur Maharashtra Faridkot Punjab Surat Gujarat Nalagarh Himachal Jamnagar Gujarat 88 6 April March Satna Madhya Raichur Karnataka 87 6 April March 216 Vadodhra Gujarat 86 6 April March 215 Rajkot Gujarat 86 6 April March Patencheru Telangana Chandigarh Chandigarh Keonjhar Odisha Anantpuram Sunder Nagar Andhra Himachal Aurangabad Maharashtra Naya Nangal Punjab Kurnool Andhra Sangli Maharashtra Balasore Odisha Gandhi Nagar Gujarat 82 6 April March Bhubneshwar Odisha Cuttak Odisha Chennai Tamil Nadu Hubli Karnataka 8 6 April March
35 City State Annual Average NAAQS (Annual) Time Frame Reference Source 28 Latur Maharashtra Nashik Maharashtra Pune Maharashtra Dera Baba Nanak Punjab Nalgonda Telangana Sindri Jharkhand Solapur Maharashtra SBS Nagar Punjab Bhiwandi Maharashtra Silchar Assam Kalyan Maharashtra Sibsagar Assam Rasulpur Punjab Dharwad Karnataka 69 6 April March Nellore Andhra Korba Chhattisgarh 66 6 April March Karim Nagar Telangana Belguam Karnataka 64 6 April March 216 Kolar Karnataka 63 6 April March Visakhapatnam Parwanoo Andhra Himachal Khammam Telangana Bellary Karnataka 57 6 April March 216 Bidar Karnataka 57 6 April March 216 Chamrajnagar Karnataka 57 6 April March
36 Appendix-I Levels across India (Annual Average ) City State Annual Average NAAQS (Annual) Time Frame Reference Source 28 Warangal Telangana Cuddalore Tamil Nadu Berhampur Odisha Chitradurga Karnataka 46 6 April March 216 Mysore Karnataka 46 6 April March 216 Ranebennur Karnataka 46 6 April March 216 Karwar Karnataka 4 6 April March 216 Mandya Karnataka 4 6 April March 216 Bhadravathi Karnataka 38 6 April March 216 Mangalore Karnataka 35 6 April March 216 Hassan Karnataka 25 6 April March
37 Appendix-II reference source Reference SourcE Reference 1 nonattainment.pdf (2).pdf RTI Data 35
38

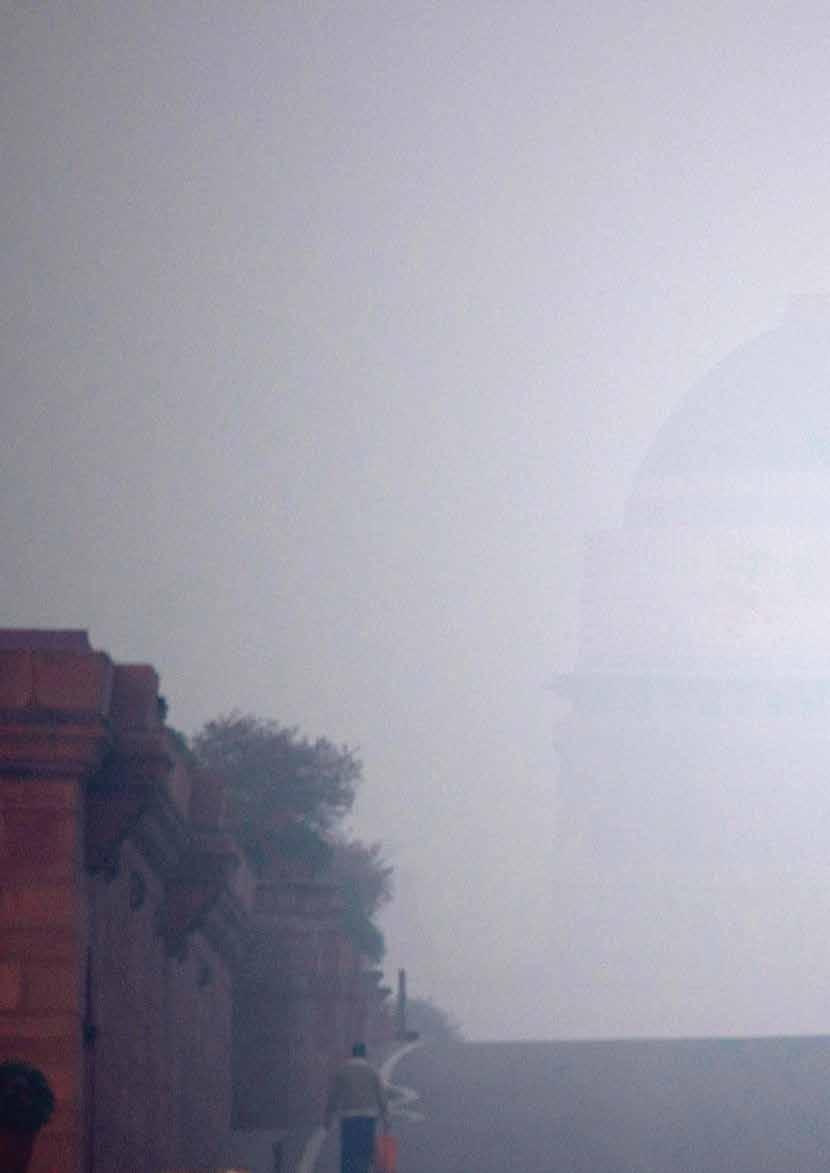
39 A ghostly ceremonial boulevard in New Delhi Image: Subrata Biswas/ Greenpeace


40 Greenpeace is a global organisation that uses non-violent direct action to tackle the most crucial threats to our planet s biodiversity and environment. Greenpeace is a non-profit organisation, present in 4 countries across Europe, The Americas, Asia and the Pacific. It speaks for 2.8 million supporters worldwide, and inspires many millions more to take action every day. To maintain its independence, Greenpeace does not accept donations from governments or corporations but relies on contributions from individual supporters and foundation grants. Greenpeace has been campaigning against environmental degradation since 1971 when a small boat of volunteers and journalists sailed into Amchitka, an area north of Alaska, where the US Government was conducting underground nuclear tests.this tradition of bearing witness in a non-violent manner continues today, and ships are an important part of all its campaign work. Greenpeace Environment Trust Old No 21, New No 6 1st Floor, Rajaram Mehta Avenue Nelson Manickam Road Chennai 629 Phone: Head Office No.338, 8th Cross Wilson Garden Bangalore Supporter Services: / Regional Office 161-J, Internal Road Gautam Nagar, opp 161/B/1 New Delhi Phone: Fax: Supporter Services: / Toll Free No.: supporter.services.in@greenpeace.org Reach us across our five offices in Mumbai, Pune, Hyderabad, Patna and Delhi Disclaimer: Map of India on Cover page of the report should not be used for navigation or legal purposes. It is intended as graphical element to the design layout and does not warrant the Map or its features to be either spatially or temporally accurate or fit for a particular use. Greenpeace do not claim the correctness or authenticity of the same. 38
AIR QUALITY LIFE INDEX UPDATE JANUARY 2019 The Potential Benefits of India s War Against Pollution : Longer Lives
 Index AIR QUALITY LIFE INDEX UPDATE JANUARY 2019 The Potential Benefits of India s War Against Pollution : Longer Lives By Michael Greenstone and Qing (Claire) Fan SUMMARY In 2019, India declared a war
Defeating the Airpocalypse: 13 solutions for clean air assessed
 Defeating the Airpocalypse: 13 solutions for clean air assessed -May 2018, Greenpeace India With at least 550 million Indians, including 50 million children under 5, living in areas where air pollution
Model Ambient Air Quality Monitoring Station at ITO (BSZ Marg), New Delhi:
, New Delhi:") MANUAL AMBIENT AIR QUALITY MONITORING STATION IN DELHI Air Quality Monitoring is an important part of the air quality management. The Manual Ambient Air Quality Monitoring Station in Delhi has been established
MANUAL AMBIENT AIR QUALITY MONITORING STATION IN DELHI Air Quality Monitoring is an important part of the air quality management. The Manual Ambient Air Quality Monitoring Station in Delhi has been established
The Air Pollution Knowledge Assessment (APnA) City Program
 City Program") The Air Pollution Knowledge Assessment (APnA) City Program 1 APnA Cities (2017) Agra, Amritsar, Bengaluru, Bhopal, Bhubaneswar, Chandigarh, Chennai, Coimbatore, Dehradun, Indore, Jaipur, Kanpur, Kochi,
The Air Pollution Knowledge Assessment (APnA) City Program 1 APnA Cities (2017) Agra, Amritsar, Bengaluru, Bhopal, Bhubaneswar, Chandigarh, Chennai, Coimbatore, Dehradun, Indore, Jaipur, Kanpur, Kochi,
Burden of Disease Air pollution among top killers. Air pollution and Our Health: Setting the agenda
 Burden of Disease Air pollution among top killers Air pollution and Our Health: Setting the agenda Centre for Science and Environment New Delhi, February 13, 2013 Why it has become necessary to talk about
The Hazy View A survey of public awareness, perceptions and attitudes on air quality in urban India
 The Hazy View A survey of public awareness, perceptions and attitudes on air quality in urban India Shakti Sustainable Energy Foundation and Edelman India October, 2017 Successful interventions to improve
The Institute of Cost Accountants of India (Statutory body under an Act of Parliament) 12, Sudder Street, Kolkata Website: icmai.
 12, Sudder Street, Kolkata Website: icmai.") NOTICE INVITING APPLICATIONS FOR EMPANELMENT OF REPUTED AND LEADING COURIER AGENCIES The Institute of Cost Accountants of India intends to engage/empanel experienced, reputed and leading Courier Agencies
NOTICE INVITING APPLICATIONS FOR EMPANELMENT OF REPUTED AND LEADING COURIER AGENCIES The Institute of Cost Accountants of India intends to engage/empanel experienced, reputed and leading Courier Agencies
HPCL-Mittal Energy Limited
 Ref. : HMEL/Marketing/PP/2013-14/10 To : All Customers, DCA & CS Subject : Polysure PP Prices w.e.f. 1 st September, 2013-00:00 hrs A. BASIC PRICE : Grade wise Basic Ex-Bathinda plant, Ex-Company Warehouse
HPCL-Mittal Energy Limited
 Ref. To Subject : HMEL/Marketing/PP/2014-15/20 : All Customers, DCA & CS : Polysure PP Prices w.e.f. 1 st February, 2015-00:00 hrs A. BASIC PRICE : Grade wise Basic Ex-Bathinda plant, Ex-Company Warehouse
Impact of Climate Change on Land Degradation over India
 National Climate Centre Research Report No. 1 / 2011 Impact of Climate Change on Land Degradation over India P.G. Gore, B.A. Roy and H.R. Hatwar National Climate Centre India Meteorological Department
Urban Nexus In Practice, What Can Work and What May Not? Dr Prashant Kumar
 Urban Nexus In Practice, What Can Work and What May Not? by Dr Prashant Kumar Department of Civil & Environmental Engineering UN ESCAP Expert Group Meeting, 10-11 Nov 2016, Bangkok Outline Background Global
BEFORE THE NATIONAL GREEN TRIBUNAL PRINCIPAL BENCH, NEW DELHI. Original Application No. 681 of 2018
 BEFORE THE NATIONAL GREEN TRIBUNAL PRINCIPAL BENCH, NEW DELHI IN THE MATTER OF: Original Application No. 681 of 2018 News Item Published In The Times of India Authored by Shri. Vishwa Mohan Titled NCAP
Building Capacity to Model Co benefits and Integrating the Results into Decision Making Process
 Building Capacity to Model Co benefits and Integrating the Results into Decision Making Process Dr. Sarath Guttikunda Founder @ UrbanEmissions.Info, New Delhi, India Affiliate Associate Research Professor,
AADHAAR BASED FINGER PRINT VERIFICATION OF CANDIDATES APPEARING IN JEE (ADVANCED) 2017
 2017") TENDER DOCUMENT FOR AADHAAR BASED FINGER PRINT VERIFICATION OF CANDIDATES APPEARING IN JEE (ADVANCED) 2017 INDIAN INSTITUTES OF TECHNOLOGY Bombay, Delhi, Guwahati, Kanpur, Kharagpur, Madras and Roorkee
TENDER DOCUMENT FOR AADHAAR BASED FINGER PRINT VERIFICATION OF CANDIDATES APPEARING IN JEE (ADVANCED) 2017 INDIAN INSTITUTES OF TECHNOLOGY Bombay, Delhi, Guwahati, Kanpur, Kharagpur, Madras and Roorkee
Challenges of Retailing in India (A Short Note)
") World Bank From the SelectedWorks of Mohammad Amin February, 2010 Challenges of Retailing in India (A Short Note) Mohammad Amin Available at: https://works.bepress.com/mohammad_amin/23/ Challenges of Retailing
World Bank From the SelectedWorks of Mohammad Amin February, 2010 Challenges of Retailing in India (A Short Note) Mohammad Amin Available at: https://works.bepress.com/mohammad_amin/23/ Challenges of Retailing
Analysis of Ambient Air Pollution and Determination of Air Quality Status of Udaipur, Rajasthan, India
 International Research Journal of Environment Sciences ISSN 2319 1414 Analysis of Ambient Air Pollution and Determination of Air Quality Status of Udaipur, Rajasthan, India Nair Neelima, Bamniya B.R, Mahecha
Air Pollution Trends in India Past 10 Years
 ISSN: 2454-132X Impact factor: 4.295 (Volume 3, Issue 6) Available online at www.ijariit.com Air Pollution Trends in India Past 10 Years Ganti Naga Sai Sarat Student University of Petroleum and Energy
Eighth Regional 3R Forum in Asia and the Pacific 9-12 April 2018, Indore, Madhya Pradesh, India
 Status of Air Pollution in India & Mitigation Strategies By Prof A.L.Aggarwal Emeritus Professor Amity Institute of Environmental Sciences Noida, UP, India Eighth Regional 3R Forum in Asia and the Pacific
Register Here :
 Register Here : JOIN US AT 2019 100 women Faces 2019 Womennovator is a platform to recognize inspirational women with substance with the ultimate aim to encourage women in work field. Through various models
Vehicular Pollution in Indian Cities: What can the Central Budget do?
 Union Budget 2017-18: Outlook Vehicular Pollution in Indian Cities: What can the Central Budget do? Sudakshina Gupta Professor Department of Economics University of Calcutta Email:sudakshinagupta@yahoo.co.in
Note: Any suggestions/feedback would be taken into consideration post discussion with the Steering Committee and applicability of Common Norms.
 Dear Stakeholders We have created the 1 st draft of the guidelines for Pradhan Mantri Kaushal Vikas Yojana 2016 2020. Request you to kindly go through the guidelines and provide your valuable inputs (if
2.1 India s Next 100 Retail Markets
 How many cities is Shoppers Stop present in? Where are Big Bazaar stores present? Or, what about Titan? This research study by Bangalore based retail spaces consultant Asipac, does an in-depth analysis
NCAP NATIONAL CLEAN AIR PROGRAMME
 NCAP NATIONAL CLEAN AIR PROGRAMME Ministry of Environment, Forest & Climate Change Government of India NCAP NATIONAL CLEAN AIR PROGRAMME Ministry of Environment, Forest & Climate Change Government of India
Waste to Energy and Waste Management Market in India
 Waste to Energy and Waste Management Market in India - 2018 Examining Opportunities, Economics, Technologies, Market Trends, Challenges & Outlook E-REP Business & Market Research Series May 2018 Waste
Quality of Water and Water Related Diseases in Urban Areas
 5.1.2 Incidence of water borne diseases in states of India The water borne diseases in India are occurring over the years despite various water quality management plans by the Government of India. Regardless
Urban Groundwater Monitoring and Management
 Urban Groundwater Monitoring and Management 377 million live in urban areas Sushil Gupta Chairman, CGWB But what is happening underground? Urbanization- Indian Context 31.16 % of the total population lives
BIOTECH INDUSTRIAL TRAINING PROGRAMME (BITP) Detailed Information and Important Timelines for Students
 Detailed Information and Important Timelines for Students") BIOTECH INDUSTRIAL TRAINING PROGRAMME (BITP) 2014-15 Detailed Information and Important Timelines for Students 1. Eligibility: B.E./B.Tech/M.Sc/M.Tech/M.V.Sc in Biotechnology, Molecular & Human Genetics,
BIOTECH INDUSTRIAL TRAINING PROGRAMME (BITP) 2014-15 Detailed Information and Important Timelines for Students 1. Eligibility: B.E./B.Tech/M.Sc/M.Tech/M.V.Sc in Biotechnology, Molecular & Human Genetics,
Simple Interactive Models for Better Air Quality
 Simple Interactive Models for Better Air Quality An Analysis of Health and Carbon Benefits Using Integrated Air Pollution Modeling for Pune, India Sarath Guttikunda and Puja Jawahar ** SIM Series No.37
EXPERIENCE OF SOURCE APPORTIONMENT STUDY IN INDIA
 INTERNATIONAL WORKSHOP ON VEHICULAR AIR POLLUTION AND ITS IMPACT ON HUMAN HEALTH: NEW DELHI, SEPTEMBER 01 02, 2011 EXPERIENCE OF SOURCE APPORTIONMENT STUDY IN INDIA Dr. Prashant Gargava Senior Environmental
Integrated Transport Systems for Cities. Ashwin Prabhu Associate, EMBARQ India Feb 11, 2013
 Integrated Transport Systems for Cities Ashwin Prabhu Associate, EMBARQ India Feb 11, 2013 Structure Session 1 Theory and Analytical Framework Session 2 Case Studies Structure Session 1: Theory and Analytical
India tops world in bad air quality: Kanpur, Delhi among 15 worst cities, Mumbai 4th most polluted megacity
 Printed from India tops world in bad air quality: Kanpur, Delhi among 15 worst cities, Mumbai 4th most polluted megacity TIMESOFINDIA.COM May 2, 2018, 01.00 PM IST NEW DELHI: According to the World Health
India s hot climate requires greater attention to evaporative emissions. Dr. Michael Tschantz
 India s hot climate requires greater attention to evaporative emissions Dr. Michael Tschantz Canister capacity and purge rate are key to minimizing in-use evaporative emissions - Control technology package
Achievements and Progress
 4.1 Solar energy and technologies for energy recovery from municipal, industrial and commercial wastes have been promoted by the Ministry for meeting certain niche energy demands of urban, industrial and
An Overview of Rooftop Solar Energy Program of SECI
 An Overview of Rooftop Solar Energy Program of SECI Chariot Wheel Konark Sun Temple, Odisha Konark Sun Temple is a 13 th Century Sun Temple 200 kwp Rooftop Grid Connected SPV Power Plant Nirman Bhawan,
SADMS DROUGHT BULLETIN
 SADMS DROUGHT BULLETIN Agriculture drought condition for South Asia 28 Sep 2018 ISSUE 10 Current Rainfall condition in reference to historical rainfall 14 Sep - 21 Sep, 2018 South Asia Drought Monitoring
2. Status of Proposals
 Ministry of New and Renewable Energy (Grid Connected SPV Rooftop, Solar Cities & Green Buildings Division) **** Development of Programme Status Note on Solar Cities (As on 15.09.2015) 1. Background The
Status, Quality and Management of Groundwater in India
 International Journal of Information and Computation Technology. ISSN 0974-2239 Volume 3, Number 7 (2013), pp. 717-722 International Research Publications House http://www. irphouse.com /ijict.htm Status,
Conserving Now, Preserving Future
 Objective of the study Identification of source/sinks of greenhouse gases (GHGs) (CO 2, CH 4, N 2 O and tco 2 e); Development of GIS-based gridded emission inventory of GHGs (2 km 2 km resolution) from
Air Pollution & it s Effects. Presentation by: Dr. Gazala Habib Room 303, Block IV Department of Civil Engineering IIT Delhi
 Air Pollution & it s Effects Presentation by: Dr. Gazala Habib Room 303, Block IV Department of Civil Engineering IIT Delhi Air Pollution Definition: Air pollution is the introduction of chemicals, particulate
Retailing in India: Assessing the Investment Climate
 World Bank From the SelectedWorks of Mohammad Amin September, 2008 Retailing in India: Assessing the Investment Climate Mohammad Amin Available at: https://works.bepress.com/mohammad_amin/4/ Retailing
Waste Mapping and Forecasting for Alternate Fuel Usage in Cement Plants
 Promoting Alternate Fuel and Raw material (AFR) utilisation in Indian Cement Industry Waste Mapping and Forecasting for Alternate Fuel Usage in Cement Plants Confederation of Indian Industry CII Godrej
QUOTATION FOR PRINTING Diary & Wall Calendars for 2017
 QUOTATION FOR PRINTING Diary & Wall Calendars for 2017 RHFL invites applications from well established, resourceful and experienced Printers for printing and Supply of Diary/ Desk & Wall Calendars for
Emission scenarios in India
 Emission scenarios in India TF HTAP / TFIAM Workshop on Global Emissions Scenarios to 2050 Sumit Sharma TERI 12th Feb 2015 Key questions How the CLE scenario compares to your expectations for the region/sector
Receptor model-based source apportionment of particulate pollution in Hyderabad, India
 DOI 10.1007/s10661-012-2969-2 Receptor model-based source apportionment of particulate pollution in Hyderabad, India Sarath K. Guttikunda & Ramani V. Kopakka & Prasad Dasari & Alan W. Gertler Received:
Air Pollution Management and Modeling - Indian Perspective
 Air Pollution Management and Modeling - Indian Perspective GUFRAN BEIG Indian Institute of Tropical Meteorology, Pune - 411 008 (e-mail: beig@tropmet.res.in) 1 Contents Air Quality Concerns Current Statust
Waterview Operational Air Quality Monitoring Report January 2018
 Waterview Operational Air Quality Monitoring Report January 2018 Document No: [Subject] Waterview Tunnel Joint Operation nzta.govt.nz/waterviewconnection 1399 Great North Road, Waterview, Auckland 1026
Role of thermal power plants in particulate matter emission # A case study of NTPC Dadri plant Using DMAIC approach
 Role of thermal power plants in particulate matter emission # A case study of NTPC Dadri plant Using DMAIC approach Himanshu Kumar*, Aditya Agrawal# * Manager (P&S Deptt.) - NTPC Dadri, # Senior system
January 2014 BASE YEAR UPDATION OF CONSUMER PRICE INDEX NUMBERS FOR INDUSTRIAL WORKERS (CPI-IW)OF SERIES 2001=100 TO 2015=100
OF SERIES 2001=100 TO 2015=100") January 2014 BASE YEAR UPDATION OF CONSUMER PRICE INDEX NUMBERS FOR INDUSTRIAL WORKERS (CPI-IW)OF SERIES 2001=100 TO 2015=100 Background of CPI-IW series: The CPI-IW series on scientific lines was first
January 2014 BASE YEAR UPDATION OF CONSUMER PRICE INDEX NUMBERS FOR INDUSTRIAL WORKERS (CPI-IW)OF SERIES 2001=100 TO 2015=100 Background of CPI-IW series: The CPI-IW series on scientific lines was first
Respirable Particulate Matter Pollution Characteristics and their Correlation with Meteorological parameters in Kota city
 Respirable Particulate Matter Pollution Characteristics and their Correlation with Meteorological parameters in Kota city Shikha Saxena 1*, Anil K Mathur 2, A.K Dwivedi 3 Department of Civil Engineering
Road Transport in India
 Simple Interactive Models for Better Air Quality Road Transport in India 2010-30 Emissions, Pollution & Health Impacts Dr. Sarath Guttikunda Ms. Puja Jawahar November, 2012 Synopsis Report Road Transport
National Air Quality Monitoring Programme (NAMP)
") AIR QUALITY ASSESSMENT National Air Quality Monitoring Programme (NAMP) Central Pollution Control Board has been executing a nation-wide National Air Quality Monitoring Programme (NAMP) programme of ambient
AIR QUALITY ASSESSMENT National Air Quality Monitoring Programme (NAMP) Central Pollution Control Board has been executing a nation-wide National Air Quality Monitoring Programme (NAMP) programme of ambient
Growth and Inclusion: Theoretical and Applied Perspectives
 THE WORLD BANK WORKSHOP Growth and Inclusion: Theoretical and Applied Perspectives Session I Food Inflation: Drivers and Policy Implications Subir Gokarn Reserve Bank of India January 12, 212 The Claridges
Potential Gains from Regional Cooperation and Trade of Electricity in South Asia
 Potential Gains from Regional Cooperation and Trade of Electricity in South Asia Govinda R. Timilsina and Mike Toman The World Bank, Washington, DC 5 th Asian Conference of IAEE University of Western Australia
Waterview Operational Air Quality Monitoring Report November 2017
 Waterview Operational Air Quality Monitoring Report November 2017 Document No: [Subject] Waterview Tunnel Joint Operation nzta.govt.nz/waterviewconnection 1399 Great North Road, Waterview, Auckland 1026
Ambient Air Quality of Varanasi during Monsoon months
 Ambient Air Quality of Varanasi during Monsoon months SEPTEMBER 2016 CENTRE FOR ENVIRONMENT AND ENERGY DEVELOPMENT (CEED) Copyright to CEED Analysis and errors are sole responsibility of author INTRODUCTION
INDUSTRIAL CITY DEVELOPMENT LIMITED
 The making of Dholera India s Largest Greenfield Smart City INDUSTRIAL CITY DEVELOPMENT LIMITED May 9, 2016 Jagdish Salgaonkar Senior Vice President & Programme Director What is a Smart City Our simplistic
International Journal on Emerging Technologies 8(1): (2017) ISSN No. (Print) : ISSN No. (Online) :
: (2017) ISSN No. (Print) : ISSN No. (Online) :") e t International Journal on Emerging Technologies 8(1): 647-651(2017) ISSN No. (Print) : 0975-8364 ISSN No. (Online) : 2249-3255 A Review on Present Practices, Issues and Challenges of Municipal Solid
e t International Journal on Emerging Technologies 8(1): 647-651(2017) ISSN No. (Print) : 0975-8364 ISSN No. (Online) : 2249-3255 A Review on Present Practices, Issues and Challenges of Municipal Solid
Directions issued by Hon ble vide order dated PBMC submitted Action Plan and Bye laws, 2016 which covers the action points.
 Sl. No. States/UTs 1 Andaman & Nicobar Island (Port Blair MC) Action Taken Report on Directions issued by Hon ble vide order dated 13.02. PBMC submitted Action Plan and Bye laws, 2016 which covers the
Abdus Salam Department of Chemistry University of Dhaka Dhaka 1000, Bangladesh
 Influence of Asian Monsoon on the Trend, Chemical Composition, and Emission Sources of PM 2.5 in Bangladesh Abdus Salam Department of Chemistry University of Dhaka Dhaka 1000, Bangladesh Overview of the
How safe is Beijing s Air Quality for Human Health? Naresh Kumar Θ
 How safe is Beijing s Air Quality for Human Health? Naresh Kumar Θ Abstract: The success of the 2008 Olympics will be largely impacted by the level of air pollution in Beijing. The World Health Organization
Draft Policy Document. Development of Multimodal Logistics Parks
 Draft Policy Document Development of Multimodal Logistics Parks 1 1. Introduction Freight movement in India has doubled to ~2,300 Bn Ton Km in FY15, from ~ 1,200 Bn from FY 08. Freight movement in the
Soil Health Management in India
 Soil Health Management in India Soil Health Management in India Soil Health Management In order to improve the soil health of the Indian soils, gov- The nature and extent of deficiencies of nutrients in
Foundation for MSME Clusters (FMC) (ISO 9001:2008 certified Organisation) SMEs & Informal Sector Green Strategy
 (ISO 9001:2008 certified Organisation) SMEs & Informal Sector Green Strategy") SMEs & Informal Sector Green Strategy Mukesh Gulati Foundation for MSME Clusters New Delhi MSMEs in India Contribute Significantly towards Exports Increased Pollution Output Employment The Hind Side: MSMEs
SMEs & Informal Sector Green Strategy Mukesh Gulati Foundation for MSME Clusters New Delhi MSMEs in India Contribute Significantly towards Exports Increased Pollution Output Employment The Hind Side: MSMEs
GUIDELINES FOR THE PROJECTS ON BASIC SERVICES TO THE URBAN POOR (BSUP), TO BE TAKEN UP UNDER JAWAHAR LAL NEHRU NATIONAL URBAN RENEWAL MISSION (JNNURM)
, TO BE TAKEN UP UNDER JAWAHAR LAL NEHRU NATIONAL URBAN RENEWAL MISSION (JNNURM)") GUIDELINES FOR THE PROJECTS ON BASIC SERVICES TO THE URBAN POOR (BSUP), TO BE TAKEN UP UNDER JAWAHAR LAL NEHRU NATIONAL URBAN RENEWAL MISSION (JNNURM) 1. Need for Sub-Mission on Basic Services to the Urban
GUIDELINES FOR THE PROJECTS ON BASIC SERVICES TO THE URBAN POOR (BSUP), TO BE TAKEN UP UNDER JAWAHAR LAL NEHRU NATIONAL URBAN RENEWAL MISSION (JNNURM) 1. Need for Sub-Mission on Basic Services to the Urban
Agenda. Background PM2.5 Attainment Plan Public Workshop
 2012 PM2.5 Attainment Plan Public Workshop webcast@valleyair.org April 30, 2012 Agenda Overview of 2012 PM2.5 Plan PM2.5 in the San Joaquin Valley Air Quality Trends Emissions Inventory Modeling Analysis
ANALYSIS OF PARTICULATE POLLUTANT (PM 2.5 ) AND GASEOUS POLLUTANT (CO) AT JABALPUR, MP
 AND GASEOUS POLLUTANT (CO) AT JABALPUR, MP") International Journal of Science, Environment and Technology, Vol. 4, No 5, 2015, 1344 1350 ISSN 2278-3687 (O) 2277-663X (P) ANALYSIS OF PARTICULATE POLLUTANT (PM 2.5 ) AND GASEOUS POLLUTANT (CO) AT JABALPUR,
International Journal of Science, Environment and Technology, Vol. 4, No 5, 2015, 1344 1350 ISSN 2278-3687 (O) 2277-663X (P) ANALYSIS OF PARTICULATE POLLUTANT (PM 2.5 ) AND GASEOUS POLLUTANT (CO) AT JABALPUR,
AN ANALYSIS OF AIR POLLUTION IN KERALA
 Jr. of Industrial Pollution Control 34(1)(218) pp 1917-1921 www.icontrol.com Research Article AN ANALYSIS OF AIR POLLUTION IN KERALA AMOGH P. KUMAR 1, MOHANDAS K 2, KSHAMA AV 1 *, PAUL LAZARUS T 3, SALMA
Section 2: Inter se priorities among key objectives, success indicators and targets
 Section 2: Inter se priorities among key objectives, success indicators and targets Format of the Results Framework Document (RFD) [ Completion Schedule of Studies undertaken by Tariff Commission during
Hazardous Waste. Supreme Court Directives
 Hazardous Waste Supreme Court Directives Writ Petition (Civil) No. 657 of 1995: Research Foundation for Science, Technology and Natural Resource Policy Vs Union of India and others: The Hon'ble Supreme
SCENARIO OF GOAT SECTOR: MAHARASHTRA STATE (INDIA)
") SCENARIO OF GOAT SECTOR: MAHARASHTRA STATE (INDIA) Goat keeping is spread over all parts of the state. On goat rearing approximately 48 lakhs families are engaged. Goat rearing is highly preferred occupation
SCENARIO OF GOAT SECTOR: MAHARASHTRA STATE (INDIA) Goat keeping is spread over all parts of the state. On goat rearing approximately 48 lakhs families are engaged. Goat rearing is highly preferred occupation
Guidelines ( )
") Guidelines (2016-2020) Shri Narendra Modi Honorable Prime Minister Let s make India the Skill Capital of the World Introduction The Union Cabinet had approved India s largest Skill Certification Scheme,
Guidelines (2016-2020) Shri Narendra Modi Honorable Prime Minister Let s make India the Skill Capital of the World Introduction The Union Cabinet had approved India s largest Skill Certification Scheme,
GE 2211 Environmental Science and Engineering Unit III Air Pollution. M. Subramanian
 GE 2211 Environmental Science and Engineering Unit III Air Pollution M. Subramanian Assistant Professor Department of Chemical Engineering Sri Sivasubramaniya Nadar College of Engineering Kalavakkam 603
DISSEMINATION OF AIR QUALITY STATUS IN SMART CITIES- A CASE STUDY
 DISSEMINATION OF AIR QUALITY STATUS IN SMART CITIES- A CASE STUDY Dr M V S RAJU Professor, Department of Civil Engineering V R Siddhartha Engineering College Vijayawada G SIVA SANKAR Assistant professor
Air Quality Management in Delhi, India:
 Simple Interactive Models for Better Air Quality Air Quality Management in Delhi, India: Then, Now, and Next Dr. Sarath Guttikunda May, 29 Mail Today, March 1 st, 29 SIM-air Working Paper Series: 22-29
National Ambient Air Quality Standards, Implementation Plans and Public Participation. Laura McKelvey U.S. EPA
 National Ambient Air Quality Standards, Implementation Plans and Public Participation Laura McKelvey U.S. EPA mckelvey.laura @epa.gov Topics What are the NAAQS? Why are they important? What is the air
ACTION PLAN FOR CONTROL OF AIR POLLUTION IN NON-ATTAINMENT CITY OF BIHAR (PATNA)
") ACTION PLAN FOR CONTROL OF AIR POLLUTION IN NON-ATTAINMENT CITY OF BIHAR (PATNA) BY BIHAR STATE POLLUTION CONTROL BOARD Parivesh Bhawan, Patliputra Industrial Area, P.O.-Sadakat Ashram, Patna 800 010 Action
ACTION PLAN FOR CONTROL OF AIR POLLUTION IN NON-ATTAINMENT CITY OF BIHAR (PATNA) BY BIHAR STATE POLLUTION CONTROL BOARD Parivesh Bhawan, Patliputra Industrial Area, P.O.-Sadakat Ashram, Patna 800 010 Action
TheStudyEstimatesandAssessesGreenhouseGasEmissionsandRemovalsfrom thefollowingsectors: N O CH 4. Methane
 September17 Analysis of Greenhouse Gas Emission Trends from 5 to 13 TrendAnalysisof GHGEmissionsinIndia GHG Platform India is a collective civil society initiative providing an independent estimation and
CHAPTER 7 CONCLUSIONS AND SUGGESTIONS
 116 CHAPTER 7 CONCLUSIONS AND SUGGESTIONS 7.1 General The gaseous pollutants present in the atmosphere are very significant in urban areas due to their adverse impact on human health and properties. One
2016 Nitrogen Dioxide Summary
 2016 Nitrogen Dioxide Summary New Jersey Department of Environmental Protection SOURCES Nitrogen dioxide (NO2) is a reddish-brown highly reactive gas that is formed in the air through the oxidation of
Wage employment, mobility and development
 Wage employment, mobility and development IDE-JETRO, World Bank, Asashi Shimbun Joint Symposium Evolving Sources of Value-added: Good-jobs, Bad-jobs? United Nations University Tokyo, March 19, 2015 Martin
Sir/Madam, Regards, S K Samad DGM (HR-ES)
") From: Corporate HR Employee Services Group (न गम त व स स ध -क म) Sent: 04 December 2018 16:22 To: GAIL - HR HODs/Incharges; Zonal HR Incharges; Payroll Users Cc: A K Shrivastava (ए क श र व स तव); Neeta
From: Corporate HR Employee Services Group (न गम त व स स ध -क म) Sent: 04 December 2018 16:22 To: GAIL - HR HODs/Incharges; Zonal HR Incharges; Payroll Users Cc: A K Shrivastava (ए क श र व स तव); Neeta
INVENTORY OF GREEN HOUSE GASES AND OTHER POLLUTANTS FROM THE TRANSPORT SECTOR: DELHI
 Iran. J. Environ. Health. Sci. Eng., 28, Vol. 5, No. 2, pp. 117-124 INVENTORY OF GREEN HOUSE GASES AND OTHER POLLUTANTS FROM THE TRANSPORT SECTOR: DELHI 1 C. Sharma, *1,2 R. Pundir 1 Radio and Atmospheric
Ambient Air Quality Assessment using Air Quality Index of Delhi
 Kalpa Publications in Civil Engineering Volume 1, 217, Pages 124 131 ICRISET217. International Conference on Research and Innovations in Science, Engineering &Technology. Selected papers in Civil Engineering
CANADA-WIDE STANDARDS FOR PM & OZONE STATUS OF JURISDICTIONAL IMPLEMENTATION ACTIVITIES MANITOBA
 CANADA-WIDE STANDARDS FOR PM & OZONE STATUS OF JURISDICTIONAL IMPLEMENTATION ACTIVITIES MANITOBA I. INTRODUCTION Manitoba has only one Census Metropolitan Area (CMA) (i.e., Winnipeg with 6% of Manitoba
Our Businesses Compressed Air...
 Compressor Technique Bengt Kvarnbäck September 19, 2002 Our Businesses Compressed Air... Machines Solutions Services 2 Our Businesses and a bit of Gas Compressors Generators Specialty Rental 3 1 Our Customers
A study of urbanization in Nagpur district
 A study of urbanization in Nagpur district Abstract Maharashtra has the highest level of urbanization in India and has one of the highest per capita incomes in the country. Urbanization is an indicator
Ministry of Urban Development
 Ministry of Urban Development Swachh Bharat Mission in urban areas of the country Minister of Urban Development Shri M.Venkaiah Naidu and Co-Chair of Bill & Melinda Gates Foundation Shri Bill Gates today
Relative Environment Economics Of Natural Gas and Other Fossil Fuels for Power Generation and Policy Options for India
 Relative Environment Economics Of Natural Gas and Other Fossil Fuels for Power Generation and Policy Options for India A Petroleum Federation Of India Study The Energy and Resources Institute (Knowledge
ESHITA GUPTA (Work in progress ) 6 Nov 2011
 6 Nov 2011") Global warming and local cooling: Impact of Climate Change on electricity demand of India ESHITA GUPTA (Work in progress ) 6 Nov 2011 Goal To investigate link between rising global temperature and electricity
Global warming and local cooling: Impact of Climate Change on electricity demand of India ESHITA GUPTA (Work in progress ) 6 Nov 2011 Goal To investigate link between rising global temperature and electricity
1.0 CONSUMPTION : The growth (%) in consumption of petroleum products, category-wise, for the month of April, 2015 is given in Table-1.
 in consumption of petroleum products, category-wise, for the month of April, 2015 is given in Table-1.") 1 P a g e This report analyses the trend of consumption of petroleum products in the country during the month of April, 2015.Data on product-wise monthly consumption of petroleum products for April, 2015
1 P a g e This report analyses the trend of consumption of petroleum products in the country during the month of April, 2015.Data on product-wise monthly consumption of petroleum products for April, 2015
Delhi Environment Program, Indicus Foundation
 Delhi Environment Program, Indicus Foundation Why is there so much conflicting evidence? What prevents the government from taking the right action? How should we respond as organizations, RWAs and the
Interdisciplinary methods in Energy & Resources Modelling
 Interdisciplinary methods in Energy & Resources Modelling Session 4C: Interdisciplinary modelling of the Whole Energy System Dr. Ritu Mathur, TERI (Presented by Ms. Garima Vats) Energy Systems Modelling
Assessment of Ambient Air Quality in the Vicinity of Cement Industries
 INTERNATIONAL JOURNAL OF APPLIED RESEARCH AND TECHNOLOGY Research ARTICLE Assessment of Ambient Air Quality in the Vicinity of Cement Industries Sadhana Chaurasia 1 and Ashok Tiwari 2 1 Head, Dept. of
Supply Chain Model Changing Landscape
 Supply Chain Model Changing Landscape Section Contents Page A B End-to-End Supply Chain Management Factors Influencing the Supply Chain Models 3 6 C GST and Impact 5 D E F Snapshot of Supply Chain Opportunities
ASSESSMENT OF AMBIENT AIR QUALITY INDEX (AQI) IN BHUBANESWAR, THE CAPITAL CITY OF ODISHA
 IN BHUBANESWAR, THE CAPITAL CITY OF ODISHA") ASSESSMENT OF AMBIENT AIR QUALITY INDEX (AQI) IN BHUBANESWAR, THE CAPITAL CITY OF ODISHA K. Mohapatra 1, S. K. Biswal 2 1 Asst. Professor, Department of Chemistry, GITA, Bhubaneswar (India) 2 Professor,
ASSESSMENT OF AMBIENT AIR QUALITY INDEX (AQI) IN BHUBANESWAR, THE CAPITAL CITY OF ODISHA K. Mohapatra 1, S. K. Biswal 2 1 Asst. Professor, Department of Chemistry, GITA, Bhubaneswar (India) 2 Professor,
Analysis of place of supply
 Analysis of place of supply Analysis 3. Supply of goods and services? Ans: Supplier Supply Whether inter-state / intra-state Haryana Bihar Inter State (IGST) Dadra Nagar Haveli Dadra Nagar Haveli Intra-State
A. Forest (Conservation) Act related functions:
 Act related functions:") (To be published in Part-I Section-I of Gazette of India) No. 4-7/2012-ROHQ Government of India Ministry of Environment and Forests... Dated: 08/01/2014 RESOLUTION Subject:- Strengthening and expansion
(To be published in Part-I Section-I of Gazette of India) No. 4-7/2012-ROHQ Government of India Ministry of Environment and Forests... Dated: 08/01/2014 RESOLUTION Subject:- Strengthening and expansion
EXPRESSION OF INTEREST
 EXPRESSION OF INTEREST Selection of Retail Pharmacy Chain (s) for supply of medicines to employees/ beneficiaries of BHEL Retired Employees Contributory Health Scheme DISCLAIMER All information contained
Assessment of Heavy Metals in Respirable Suspended Particulate Matter at Residential Colonies of Gajuwaka Industrial Hub in Visakhapatnam
 International Journal of Geology, Agriculture and Environmental Sciences Volume 3 Issue 5 October 2015 Website: www.woarjournals.org/ijgaes ISSN: 2348-0254 Assessment of Heavy Metals in Respirable Suspended
Croatia Air Quality Policy Matrix Goals Status Current Policies & Programmes GENERAL OVERVIEW
 Croatia Air Quality Policies This document is based on research that UNEP conducted in 2015, in response to Resolution 7 of the UNEA 1. It describes country-level policies that impact air quality. Triple