BIODIVERSITY INDICATORS & THE 2010 BIODIVERSITY TARGET: Outputs, experiences and lessons learnt from the 2010 Biodiversity Indicators Partnership
|
|
|
- Miles Mathews
- 6 years ago
- Views:
Transcription


1 Secretariat of the Convention on Biological Diversity CBD Technical Series No. 53 BIODIVERSITY INDICATORS & THE 2010 BIODIVERSITY TARGET: Outputs, experiences and lessons learnt from the 2010 Biodiversity Indicators Partnership


2 CBD Technical Series No. 53 BIODIVERSITY INDICATORS & THE 2010 BIODIVERSITY TARGET Outputs, experiences and lessons learnt from the 2010 Biodiversity Indicators Partnership
3 The designations employed and the presentation of material in this publication do not imply the expression of any opinion whatsoever on the part of the copyright holders concerning the legal status of any country, territory, city or area or of its authorities, or concerning the delimitation of its frontiers or boundaries. This publication may be reproduced for educational or non-profi t purposes without special permission, provided acknowledgement of the source is made. The Secretariat of the Convention would appreciate receiving a copy of any publications that use this document as a source. Reuse of the fi gures is subject to permission from the original rights holders. Published by the Secretariat of the Convention on Biological Diversity. ISBN (print version); ISBN (web version) Copyright 2010, Secretariat of the Convention on Biological Diversity Citation: 2010 Biodiversity Indicators Partnership Biodiversity indicators and the 2010 Target: Experiences and lessons learnt from the 2010 Biodiversity Indicators Partnership. Secretariat of the Convention on Biological Diversity, Montréal, Canada. Technical Series No. 53, 196 pages. For further information, contact: Secretariat of the Convention on Biological Diversity World Trade Centre 413 Rue St. Jacques, Suite 800 Montreal, Quebec, Canada H2Y 1N9 Tel: +1 (514) Fax: +1 (514) secretariat@cbd.int Website: Photo Credits: Rainbow lorikeet Sarah Williams; Lone fi sherman Fadil Basymeleh; Spices Gret@Lorenz; Tropical rainforest Henning Mühlinghaus; Macaw Luc Viatour; Yellow leaves YugoQ; Vietnamese market Taylor Miles; Grand Canyon Logan Brumm; Penguins, Snow Hill Island, Antarctica Martha de Jong-Lantin; Boy at Chittagong fi sh market Rune Steiness; Lake Hume Tim Keegan; Hornbill WS Goh; Genebank International Rice Research Institute; Rainforest, Queensland Nosha; Meandering river Carmelo Aquilina; Man with sailfi sh Markus Spring. Typesetting: Ralph Percival 2 BIODIVERSITY INDICATORS & THE 2010 BIODIVERSITY TARGET
4 THIS DOCUMENT WAS PREPARED BY: Lead Authors Tristan Tyrrell, Anna Chenery, Philip Bubb, Damon Stanwell-Smith and Matt Walpole (United Nations Environment Programme World Conservation Monitoring Centre, UK) Contributing Authors Clarissa Arida, Rod Fuentes (ASEAN Centre for Biodiversity); Ehsan Dulloo, Toby Hodgkin (Bioversity International); Stuart Butchart, Melanie Heath, Alison Stattersfield (BirdLife International); Melodie McGeogh (Cape Research Centre, South African National Parks); Dian Spear (Centre of Excellence for Invasion Biology, Stellenbosch University); Alex De Sherbinin, Marc Levy (CIESIN, Columbia University); Robert Höft (CBD Secretariat); Robert Bolješič, David Morgan, Marceil Yeater (CITES Secretariat); Liza Drius, Hans Friedrich, Sebastian Winkler (Countdown 2010); Albert Bleeker (Energy Research Centre of the Netherlands); Sophie Condé (European Thematic Centre Biodiversity); Mike Gill, Risa Smith, Michael Svoboda (Environment Canada); Katarzyna Biala, Gordon McInnes, Frederik Schutyser (European Environment Agency); Jackie Alder, Dirk Zeller (Fisheries Centre, University of British Columbia); Nora Berrahmouni, Barbara Burlingame, Linda Collette, Jorge Csirke, Stefano Diulgheroff, Hubert George, Mette Løyche Wilkie, Livia Peiser, Dafydd Pilling, Beate Scherf, Yimin Ye (FAO); Maurizio Farhan Ferrari (Forest Peoples Programme); Mark Zimsky (GEF Secretariat); William Coleman, Alessandro Galli, Steve Goldfinger, Audrey Peller, Mathis Wackernagel (Global Footprint Network); Sarah Simons (Global Invasive Species Programme); Mike Wallace (Global Reporting Initiative); Teresita Borges (Government of Cuba); Spencer Thomas (Government of Grenada); Rawson Yonazi (Government of Tanzania); Nabil Hamada (Government of Tunisia); Carsten Neßhöver (Helmholtz Centre for Environmental Research); Rob Ewers (Imperial College, London); Anne-Celine Thuillet (L Institut de Recherche pour le Développement); Jonathan Baillie, Ben Collen, Noelle Kumpel, Louise McRae (Institute of Zoology, Zoological Society of London); Nakul Chettri, Eklabya Sharma (ICIMOD); Danna Leaman (IUCN SSC Medicinal Plant Specialist Group); Gregor Levin, Bo Normander (National Environmental Research Institute of Denmark); Michael Jennings, Carmen Revenga, James Robertson, Marc Spalding (The Nature Conservancy); Paul Matiku (Nature Kenya); Philip Bagnoli, Remy Paris (OECD); Nick Davidson (Ramsar Convention Secretariat); Neil Brummitt (Royal Botanical Gardens, Kew); Richard Gregory (RSPB); Monique Dubé (Saskatchewan Research Council); Suyapa De Meyer (SIAM); Joji Cariño (Tebtebba Foundation); Laurent Chazee, Thomas Galewski (Tour du Valat); Gemma Goodman, Teresa Mulliken, Thomasina Oldfield (TRAFFIC International); Lorena Jaramillo (UNCTAD); Tessa Goverse, Stephen Twomlow (UNEP DGEF); Sabrina Barker, Genevieve Carr, Carrie Rickwood, Richard Robarts (UNEP GEMS/Water); Tiina Kurvits (UNEP GRID/Arendal); Rosamunde Almond, Nicola Barnard, Charles Besançon, Bastian Bomhard, Claire Brown, Lauren Coad, Zoe Cokeliss, Asghar Fazel, Lucy Fish, Maxwell Gomera, Jerry Harrison, Peter Herkenrath, Monica Hernandez Morcillo, Jon Hutton, Val Kapos, Helena Pavese, Judith Schleicher, Megan Tierney, Kaveh Zahedi, Christoph Zockler (UNEP-WCMC); Simon Ellis, Maria Miñana, Anahit Minasyan, Rieks Smeets (UNESCO); Zafar Adeel (United Nations University Institute for Water, Environment & Health); Tim Sparks (University of Cambridge); Fiona Leverington, Marc Hockings (University of Queensland); Jim Galloway (University of Virginia); Derk Kuiper (Water Footprint Network); Ward Hagemeijer, Szabolcs Nagy (Wetlands International); Diarmid Campbell-Lendrum (World Health Organization); Jonathan Loh (WWF). The 2010 BIP Secretariat would also like to acknowledge the efforts and support of the following in the development and implementation of the Partnership: Nizar Issa (Biodiversity Conservation through Ecotourism); Peter Alexander (Biodiversity Project); Leon Bennun (BirdLife International); Nicolas Lucas (Casa Tierra); Marc Steininger (Conservation International); Marco Barbieri (CMS Secretariat); Gergely Petranyi (Corvinus University, Budapest); Alfred Oteng-Yeboah (Council for Scientific and Industrial Research, Ghana); Anne Larigauderie, Bruno Walther (Diversitas); Stefan Leiner, Anne Teller (European Commission); Leonard Berry (Florida Center for Environmental Studies); Samy Gaiji, Nick King, Beatriz Torres (GBIF); Finn Katerås, Peter Schei (Government of Norway); Benoit Limoges (Government of Quebec, Canada); Christine Copley (ICMM); Pamela Chasek, Lynn Wagner (IISD); Georgina Mace (Imperial College London); John Fellowes (independent consultant); Karlheinz Erb, Helmut Haberl (Institute of Social Ecology, Vienna); Oscar Natale (Instituto Nacional del Agua, Argentina); Jon Paul Rodriguez (Instituto Venezolano de Investigaciones Científicas); Mark Winslow (International Crops Research Institute for the Semi-Arid Tropics); Babajide Alo (International Development Research Centre); Christopher Wunderlich (INFASA); Ramanatha Rao (International Plant Genetic Resources Institute); Neville Ash, Sonia Peña-Moreno, Susanna Söderström, Jane Smart, Jean-Christophe Vié (IUCN); Holly Dublin, Simon Stuart (IUCN SSC); Sam Andanje (KWS); Saujanendra Swain (M.S. Swaminathan Research Foundation); Zamir Dedej (Ministry of Environment, Albania); Jeff Wise (National Environment Trust); Thingnganing Longvah (National Institute of Nutrition); Ben ten Brink (Netherlands Environmental Assessment Agency); Chaweewan Hutacharern (Royal Forestry Department, Thailand); Steven de Bie (Shell); Jessica Conradie, Kirsten Grobler, Selwyn Willoughby (SANBI); Hakan Berg, Maria Berlekom, Maria Schultz (SwedBio); Luisa Maffi (Terralingua); Elysabeth David, Hakan Marstorp, Angela Stercken, Anja Thust (UNCCD Secretariat); Matt Billot, Monika MacDevette, Carlos Martin-Novella, Martin Okun, Balakrishna Pisupati (UNEP); Alex Gee, Darrell Taylor (UNEP-WCMC); Nigel Maxted (University of Birmingham); Herman Batibo (University of Botswana); Andrew Balmford, Rhys Green (University of Cambridge); Delia Rodriguez Amaya (University of Campinas); Annette Cowie (University of New England, Australia); Ana Torres (University of Valencia); Bas Verschuuren (Wageningen UR); Linda Krueger (Wildlife Conservation Society); Sudipto Chatterjee (WWF India). The 2010 Biodiversity Indicators Partnership was made possible through the financial support of the Global Environment Facility and the European Commission, as well as the generous cash and in-kind support provided by the 2010 BIP Partners, their funders and their collaborating agencies. For further information, visit the website of the 2010 Biodiversity Indicators Partnership OUTPUTS, EXPERIENCES AND LESSONS LEARNT FROM THE 2010 BIODIVERSITY INDICATORS PARTNERSHIP 3


5 CONTENTS Foreword Executive summary 执行摘要 Résumé Краткий обзор о проделанной работе Resumen ejecutivo エグゼクティブサマリー يذيفنتلا صخلملا 1. Introduction Purpose and structure of this report Background to the 2010 BIP Purpose and Organisation of the 2010 BIP The Indicators Scope and coverage of the indicators Review of the indicator framework and indicator development The way forward: biodiversity indicators beyond Indicator input to other Multilateral Environmental Agreements and environmental governance processes Support to MEAs beyond CBD: UNCCD, CMS, Ramsar, CITES Support to other processes Support to the private sector Indicator interpretation and communication BIP communication activities Challenges in communicating the indicators Communicating biodiversity stories using linked indicators The way forward: indicator communication beyond Support to national indicator development Development and implementation of indicator capacity strengthening Applicability of global indicators for national use The way forward: national indicator development beyond Conclusions and the way forward Experiences and lessons learnt from the 2010 BIP The way forward: The Partnership beyond References List of Acronyms and Abbreviations Used BIODIVERSITY INDICATORS & THE 2010 BIODIVERSITY TARGET
6 Annex 1. Indicator Synopses, Metadata and Methodologies Extent of forests and forest types Extent of marine habitats Living Planet Index Global Wild Bird Index Coverage of protected areas Protected Area overlays with biodiversity Management effectiveness of protected areas IUCN Red List Index Ex-situ crop collections Genetic diversity of terrestrial domesticated animals Area of forest under sustainable management: certification Area of forest under sustainable management: degradation and deforestation Area of agricultural ecosystems under sustainable management Status of species in trade Wild Commodities Index Ecological Footprint Nitrogen deposition Trends in Invasive Alien Species Marine Trophic Index Water Quality Index for Biodiversity Forest fragmentation River fragmentation and flow regulation Health and well-being of communities directly dependant on ecosystem goods and services Nutritional Status of Biodiversity Biodiversity for food and medicine Status and trends of linguistic diversity and numbers of speakers of indigenous languages Official development assistance provided in support of the Convention References Annex 2. Partner profi les Annex 3. Development of guidance materials for National implementation Annex 4. Participation at major international meetings OUTPUTS, EXPERIENCES AND LESSONS LEARNT FROM THE 2010 BIODIVERSITY INDICATORS PARTNERSHIP 5


7 FOREWORD The 2010 Biodiversity Indicators Partnership, established with major support from the Global Environment Facility, has brought together a diverse range of organizations and individuals to develop and deliver a suite of indicators with which to track progress towards the 2010 Biodiversity Target. The important contribution of the 2010 Biodiversity Indicators Partnership to the preparation of the Global Biodiversity Outlook and the analyses underlying to the Convention s revised Strategic Plan have been recognized in several decisions of the Conference of the Parties. Parties also recognize that the Partnership will have an important role to play in monitoring progress towards the achievement of biodiversity targets in the coming decade. This technical compendium of the products delivered by the 2010 Biodiversity Indicators Partnership provides details on the methodology and underlying data for each of the indicators used in the third edition of Global Biodiversity Outlook (GBO-3). Yet, the document is more than a technical summary of the work of each responsible agency for the indicator under their responsibility. It is also proof that this Partnership is more than the sum of its parts. By linking sets of indicators within a logical framework, the Partnership has enabled us to develop a clearer understanding of relationships between policy actions, anthropogenic threats, the status of biodiversity and the benefits and services that we derive from it. Such analyses have enabled a compelling conclusion in GBO-3: despite increased efforts of the global community to reduce the loss of the world s biodiversity and despite selected success stories here and there, the negative trends have continued because pressures on biodiversity have remained or even increased in intensity and because we have not been able to sufficiently influence the underlying drivers of biodiversity loss. As we enter a new decade - one which may be declared the United Nations Decade on Biodiversity - the Convention is reacting to this analysis by developing its new Strategic Plan around five strategic goals including one on the underlying causes of biodiversity loss and one on the means to support implementation of the Convention. These areas, with new targets and associated indicators, will need to be analysed, assessed and monitored in order to provide the scientific basis for decision-making to the world s governments. This calls for a continuation and an expansion of the Partnership. Furthermore, as Parties to the Convention commit to national biodiversity targets and develop or refine appropriate monitoring programmes at national level the Partnership may also become a valuable resource for technical support, responding to national needs. This compendium provides governments at all levels, scientists and other stakeholders as well as indigenous and local communities the most up-to-date information on how status and trends in biodiversity is being monitored and how monitoring information can be communicated. We hope that it is an inspiration for pragmatic and practical monitoring in support of policy development in the coming years. Ahmed Djoghlaf Executive Secretary, Convention on Biological Diversity Monique Barbut CEO and Chairperson, Global Environment Facility Jon Hutton Director, UNEP World Conservation Monitoring Centre 6 BIODIVERSITY INDICATORS & THE 2010 BIODIVERSITY TARGET
8 EXECUTIVE SUMMARY This report summarises the experiences and lessons learnt from the 2010 Biodiversity Indicators Partnership (2010 BIP), as well as providing details of 27 global indicators developed in support of the Convention on Biological Diversity (CBD) s 2010 Biodiversity Target. The Partnership was formed in 2007 with substantial funding from the Global Environment Facility and has worked together over the last three years to develop, strengthen, implement and communicate a suite of complementary indicators, that were agreed by the parties to the CBD at COP 8 (decision VIII/15) in These include indicators to measure status and trends of biodiversity, sustainable use, threats to biodiversity, ecosystem integrity and ecosystem goods and services, status of knowledge, innovations and practice, and status of resource transfers. The objective of the 2010 BIP is to ensure that decisions made by governments and other stakeholders are better informed to improve the conservation status of biodiversity at the global level. This is being achieved through the delivery of three outcomes: 1. A 2010 Biodiversity Indicators Partnership generating information useful to decision-makers; 2. Improved global indicators implemented and available; 3. National governments and regional organizations using and contributing to the improved delivery of global indicators. Over 40 organizations worldwide have been working to enhance indicator development in the run-up to the International Year of Biodiversity to ensure that the most comprehensive, accurate and up-to-date information on biodiversity trends is available to decision-makers, particularly at CBD COP 10 in Nagoya. This has resulted in a significantly enhanced and more comprehensive evidence base for the third Global Biodiversity Outlook, released in 2010, compared with earlier volumes. Moreover, the 2010 BIP has directly engaged 45 countries worldwide in support of indicator development and use, and many more indirectly through the information and tools available through its websites and The 2010 BIP has achieved its goals in relation to the 2010 Biodiversity Target, and has demonstrated the value of a global multi-stakeholder Partnership. It has also identified important lessons for any post-2010 indicator development. The key messages emerging from the 2010 BIP are explored in this report. OUTPUTS, EXPERIENCES AND LESSONS LEARNT FROM THE 2010 BIODIVERSITY INDICATORS PARTNERSHIP 7
9 THE PARTNERSHIP The 2010 BIP has provided an integrated assessment of global indicator trends, which has formed the basis for the CBD report on progress towards the 2010 Biodiversity Target. The 2010 BIP was principally established to enable improved reporting and decision-making at the global scale on the CBD s 2010 Biodiversity Target. The primary global audience therefore has been the Parties and Secretariat of the CBD, as well as other multilateral environmental agreements. The first major opportunity for the 2010 BIP to communicate its results to the CBD process has been through the CBD Secretariat s Global Biodiversity Outlook 3 (GBO-3) report, which was launched at the SBSTTA 14 meeting in May The first section of the report is an assessment of progress towards the 2010 Biodiversity Target based on data and analyses produced by the 2010 BIP. This collaboration between the 2010 BIP and the CBD Secretariat was a very effective way to make technical information from the indicators accessible to a largely non-technical audience. The 2010 BIP has enhanced awareness amongst scientists and policy-makers of indicator development and future needs. The Partners and Secretariat of the 2010 BIP played a central role in the International Expert Workshop on the 2010 Biodiversity Indicators and Post-2010 Indicator Development, convened by UNEP- WCMC in cooperation with the Secretariat of the CBD in July The workshop brought together over 70 participants including government nominated experts and representatives of biodiversity-related conventions, UN agencies, academic and research institutions and other relevant international, intergovernmental and non-governmental organizations to review the use and effectiveness of the 2010 biodiversity indicators and to consider the implications for the development of post targets and indicators. The 2010 BIP Partners also published assessments of the state of indicator development in the run-up to 2010, and a synthesis of global indicator trends, in the journal Science. Building on these activities, both Partners and Secretariat are well-placed to provide significant input to the proposed CBD Ad Hoc Technical Expert Group (AHTEG) in 2011 to develop further advice on future monitoring of biodiversity under the Convention and the use of global indicators, as recommended by SBSTTA 14. The 2010 BIP has made a significant contribution to national indicator development. The capacity building efforts of the Partnership, supporting the development, implementation, communication and effective advocacy of national scale biodiversity indicators in Africa, Asia, Latin America and the Caribbean, has been very well received. There is a growing worldwide demand for further national level indicator development, both for biodiversity and ecosystem services. The Partnership has developed an integrated suite of resources to complement the workshop activities, which include guidance documents on indicator development, specific indicator scaling and a multilingual web-portal to disseminate the information widely. THE INDICATORS The development and use of biodiversity indicators for tracking progress against national and international plans and targets is work in progress. The 2010 BIP has made major contributions to the development of the 2010 biodiversity indicators, as well as their analysis, communication, uptake and use. As the Parties to the CBD consider a revised, post-2010 Strategic Plan, with a new set of targets and indicators, we envisage the experience and lessons from the 2010 BIP will provide a valuable insight and resource. Post-2010 indicators should be linked to the targets and build on existing indicators. The choice of indicators for the post-2010 period will depend on the target adopted by the CBD. However in order for progress to be tracked these targets must be measurable, which in turn depends on scientific capability to develop and deliver appropriate indicators. Thus, the development of targets and indicators is best undertaken in tandem through an iterative process, and building upon existing baselines. An ongoing Partnership to support continued development and use of indicators is necessary. Whatever framework of indicators is agreed, the experience of the 2010 BIP suggests that an ongoing Partnership of data providers, incorporating both existing and new Partners, will be fundamental to their development and delivery. Thus, as concluded at the 2009 workshop, a flexible and inclusive process/partnership for post-2010 indicator development should be maintained and adequately resourced in order to increase collaboration in the development, quality control, implementation and communication of indicators at all levels, including the sharing of experience and the building of capacity. 8 BIODIVERSITY INDICATORS & THE 2010 BIODIVERSITY TARGET
10 INDICATOR COMMUNICATION Only well-developed indicators can provide clear messages for communication. It is only possible to communicate developed indicators which produce results and storylines. Emphasis therefore needs to be placed on delivering the existing indicators and ensuring future additional indicators can produce results quickly. A welldeveloped set of indicators will provide a range of results which can be interpreted to generate clear messages specific to different target audiences. Logically linking indicators will aid communication by providing coherent stories and clear messages for a range of audiences. Modifying and simplifying the current indicator framework to explain much more clearly the relationships between indicators from different focal areas will be extremely valuable. The approach of integrating indicator results to tell coherent stories can also be applied to different themes or topics. Key messages can be communicated which give a more coherent picture of the status of biodiversity. Biodiversity indicators are easier to understand and communicate when linked together in a set which connects policies to outcomes. Enhanced Partnership links with other MEAs and sectors would increase indicator uptake. Greater efforts are needed to demonstrate the value of the 2010 BIP and the indicators it has helped to develop to other MEAs and sectors. Clearer, established links would help to widen the audience for Partnership products and outputs, whilst creating synergies and efficiencies in indicator efforts between MEAs. At CITES COP 15 a decision was made to continue engagement with and support for the 2010 BIP, and such official decisions are important for maintaining links. The production of specific tailored outputs for individual MEAs and different sectors could be a key element in increasing the relevance of the indicators to multiple audiences. Greater emphasis on indicator communication post-2010 is required. The main objectives of the Partnership when originally conceived focused on indicator development and delivery, with less focus on communication. It has become clear from the positive uptake of 2010 BIP products that indicator communication should become one of the main pillars of a post-2010 Partnership. As well as communication led by the 2010 BIP Secretariat, wider use of Partners communications machinery would be jointly beneficial. INDICATOR CAPACITY DEVELOPMENT National biodiversity indicators are vital for effective conservation, sustainable use and equitable sharing of biodiversity resources. Their role includes raising understanding of how biodiversity is part of addressing priority development issues such as poverty reduction and climate change. Biodiversity indicators need to be developed to address national biodiversity and development priorities, including NBSAPs. There is often very little awareness or use of biodiversity indicators at all levels (technical, scientific, and policy). The lack of awareness of biodiversity indicators is often partly due to limited understanding of the topic of biodiversity amongst many sectors of society, and can also be due to a limited use of science-based information in decision-making. Whilst reporting on progress towards international targets and agreements is important, the long-term investment in the production of biodiversity indicators can only be sustained if they are seen to be useful to meet national priorities. Countries benefi t from an effective national institution to coordinate their national biodiversity indicators. In many developing countries in particular, the gathering and communication of biodiversity information is on an ad hoc and fragmented basis, such as for periodic reporting requirements. The capacity to have biodiversity indicators and other information available for effective decisionmaking requires the existence of a responsible institution. Networking and collaboration by government institutions, NGOs and other stakeholders within countries and regions signifi cantly strengthens progress in national indicator development and use. The organisation of regional workshops and multi-stakeholder collaborations has been a very effective means of capacity building and a stimulation of results within countries. The use of a common framework to guide the design of indicator development and learning has greatly aided progress. Developing countries need fi nancial and technical support to develop and use biodiversity indicators. Without additional financial and technical support it is likely that a lack of biodiversity indicators in decision-making by government and the rest of society in developing countries will persist. OUTPUTS, EXPERIENCES AND LESSONS LEARNT FROM THE 2010 BIODIVERSITY INDICATORS PARTNERSHIP 9
11 The Partners in the 2010 BIP will continue to seek ways to support the development and use of national and regional biodiversity indicators in conjunction with global indicator development. It is intended that one of the mechanisms to achieve this will be the further development of the National Biodiversity Indicators Portal (www. bipnational.net). This will share the Partnership s extensive knowledge and experience in regional and national indicator development and be the online resource for countries and regions looking to develop and use biodiversity indicators. As well as providing online guidance materials the portal will allow nations to share their experiences and lessons learnt from indicator development. CONCLUSION There is a recognized need for an ongoing Biodiversity Indicators Partnership. SBSTTA 14 also recommended that COP 10 recognizes the need to continue strengthening our ability to monitor biodiversity at all levels including through, inter alia, (i) building on and continuing the work of the 2010 BIP in delivering global indicators for the post period... and (iv) supporting national and regional efforts to establish or strengthen biodiversity monitoring and reporting systems to enable Parties to... assess progress towards biodiversity targets established at national and/ or regional level. These recommendations reflect recognition that tracking global biodiversity change and its implications requires the combined effort of multiple stakeholders, building from local/national foundations to create a global picture, and facilitating the sharing of information and experiences among and between scales. An ongoing Partnership will expand its membership, and its efforts to support indicator capacity development, in order to meet the needs of the new CBD Strategic Plan. It is clear that an indicators Partnership, building on the 2010 BIP and continuing beyond 2010, to ensure the coordination and further development of a coherent set of relevant, timely and robust indictors from multiple sources and for multiple purposes would be broadly welcomed. In particular, this renewed Partnership will ensure a significantly increased level of national indicator development and indicator-based progress reporting, with improved breadth and coverage of global indicators available and communicated. 10 BIODIVERSITY INDICATORS & THE 2010 BIODIVERSITY TARGET
12 执行摘要 这个报告总结了从 2010 生物多样性指标合作伙伴关系 (2010 BIP) 中学到的经验教训, 并且还提供了为支持生物多样性公约 2010 年生物多样性目标而发展的 27 个全球指标 在全球环境基金大量资金支持下合作伙伴关系于 2007 年初步成形, 并且在过去的三年里一直同全球环境基金共同致力于发展, 加强, 实施和交流一整套的补充指标, 这些指标是经过生物多样性公约缔约方在 2006 年举办的 COP 8( 决策 VIII/15) 中达成共识的 这些包括用来测量生物多样性状态和趋势 可持续利用 生物多样性所受威胁 生态系统完整性以及生态系统货物和服务 知识状态 创新以及资源迁移的实践和状态 2010 BIP 的目标是确保在全球范围内, 由政府及其他利益相关者制定的决策可以更好地提高生物多样性的保护状态 这个目标将通过实现以下三项成果达成 : 1. 一个为决策制定者提供有用信息的 2010 生物多样性指标合作伙伴关系 ; 2. 已经得到实施的并且可获取的经过改良的全球指标 ; 3. 使用并且对提高全球指标的传递做出贡献的国家政府和地区组织 在世界范围内, 趁国际生物多样性年来临之际, 已经有超过 40 个组织机构正在致力于加强生物多样性指标的发展, 以确保决策制定者们可以获取最为全面, 准确且最新的有关生物多样性趋势的信息 ( 尤其是在名古屋举行的生物多样性公约 COP 10 中体现 ) 这是为在 2010 年出版的第三期全球生物多样性展望提供了一个相对于前几期展望大幅度加强的且更全面的证据基础 并且, 在世界范围的 45 个国家已经直接参与到 2010 BIP 支持指标发展和使用方面的工作, 或者通过从网站 和 获取的信息和工具的方式间接参与 2010 BIP 已经完成了同 2010 生物多样性目标相关联的目标, 并且已经证明了其具有全球多方利益相关者合作伙伴关系的价值 它也为任何 后 2010 指标 的发展得出了重要的经验教训 本报告将对 2010 BIP 的主要信息进行深入探讨 OUTPUTS, EXPERIENCES AND LESSONS LEARNT FROM THE 2010 BIODIVERSITY INDICATORS PARTNERSHIP 11
13 合作伙伴关系 2010 BIP 已经提供了一个与国际接轨的指标趋势的综合评估方法, 这个综合评估已经作为了有关达成 2010 生物多样性目标的生物多样性公约报告的基础 2010 BIP 原则上是为了使全球有关生物多样性公约 2010 生物多样性目标的改进报告和决策制定成为可能而建立的 因此, 主要的全球客户就是生物多样性公约的缔约方和秘书处, 以及其它的多边环境协定 作为 2010 BIP 第一个主要的同生物多样性公约流程交流的平台, 生物多样性公约秘书处全球生物多样性展望 3(GBO-3) 报告在 2010 年 5 月举行的 SBSTTA 14 会议中被启动 报告的第一个部分是一个达成 2010 生物多样性目标的进度评估, 该评估是基于 2010 BIP 生产的数据进行分析的结果 2010 BIP 和生物多样性公约秘书处之间的合作是一个从可由多数非技术群体获取的指标中产生技术信息的有效途径 2010 BIP 已经加强了科学工作者及决策制定者们对于指标发展和未来需要的认知 2010 BIP 的合作伙伴及秘书处在 有关 2010 生物多样性指标和 后 2010 指标发展的国际专家讲习班 中扮演了一个重要的角色, 该讲习班由联合国环境署 -WCMC 同生物多样性公约秘书处于 2009 年 7 月联合举办 讲习班将超过 70 位的与会者聚集到了一起, 这些与会者们包括政府提名 专家和生物多样性相关的公约 联合国机构 学术和研究机构以及其它相关的国际, 政府间和非政府组织的代表们组成, 与会者们回顾了 2010 生物多样性指标的使用情况和有效性, 并且考虑了 后 2010 目标和指标发展的影响 2010 BIP 合作伙伴们在 Science 中发布了若干 2010 年来临之际指标发展状态的评估结果, 以及一个全球指标趋势的模拟 在这些活动之上, 合作伙伴们和秘书处能很好地合作以为提议 2011 年生物多样性公约而特设的技术专家组 (AHTEG) 提供重要的投入 这为发展有关在公约下生物多样性未来模拟的建议, 以及由 SBSTTA 14 推荐的全球指标的应用起到了重要的作用 2010 BIP 已经为国家指标发展做出了一个巨大的贡献 合作伙伴关系的能力建设支持在非洲, 亚洲, 拉丁美洲及加勒比海地区和国家的生物多样性指标的发展 实施 交流和有效宣传 该能力建设几乎得到了普遍好评 对于生物多样性和生态系统服务的更进一步的国家尺度指标发展的需求正在增长 合作伙伴关系已经发展了一套综合的资源来补充讲习班活动, 这包括关于指标发展, 特定指标尺度以及一个多语种门户网站的指导文献, 以进行广泛地传播信息 指标 生物多样性指标的发展和使用在跟踪达成国家和国际计划及目标的进展中是 正在进展 2010 BIP 已经为 2010 生物多样性指标发展做出了主要贡献, 同时还通过进一步的分析 交流 摄取和使用提升了它的重要价值 因为生物多样性公约缔约方在考虑改善 后 2010 战略计划, 以及一套新的目标和指标, 所以我们获取从 2010 BIP 得来的经验教训, 并提供一个有价值的观点和资源 后 2010 指标应该同根本目标链接起来并且建立于目前已经存在的指标之上 后 2010 期间, 目标的选择将取决于生物多样性公约采用的目标, 并在其之上 然而, 为了使得进展可以被跟踪, 这些目标必须是可量测的, 而这个反过来就取决于发展和传递适当指标 的科学能力 因此, 目标和指标的发展通过一个循环的过程以得到最好的实施方案, 并且建立在已现成目标底线之上 一个正在持续的支持指标的发展和使用的合作伙伴关系是非常必要的 不管确定何种指标框架, 根据 2010 BIP 的经验, 建立一个持续的数据提供者的合作伙伴关系, 融入已存在的和新的伙伴共同合作, 将对指标体系的发展和传输发挥必要的作用 因此, 正如在 2009 年 Reading 讲习班总结的那样, 后 2010 指标发展的一个灵活的和包容的流程 / 合作伙伴关系, 应该得到维护和充分的分享资源, 从而在发展, 质量控制, 实施以及各个水平的指标交流方面增加合作, 包括经验共享和能力建设 12 BIODIVERSITY INDICATORS & THE 2010 BIODIVERSITY TARGET
14 指标交流 只有得到充分发展的指标才能为交流提供清晰的信息 只有根据提供结果和故事链的发展进行完善的指标才能进行良好地交流 因此, 应该强调充分认识已存在的指标并且保障未来其它的指标可以快速得到结果 一个完好发展的指标集将提供一系列的结果, 这些结果可以被综合起来为不同的目标群体提供清晰的信息 通过为不同群体提供容易理解的故事和清晰的信息, 有逻辑关联的指标将会辅助交流 改善和对目前指标框架进行简化更加清晰地解释来自不同聚焦地区的指标间的关系将会变得非常的有价值 综合指标结果, 以告诉易懂的故事的方式可以被实施到不同的主题或话题 因此, 关键的信息可以得到交流, 这为生物多样性状态提供了一个更加容易理解的画面 当生物多样性指标体系与政策和产出进行对接的时候, 它们是很容易理解并且交流的 增强合作伙伴关系同其它多边环境协定和部门的联系, 这将增加指标的摄取能力 然而, 这需要付出更加大的努力来向其它多边环境协定和部门指出 2010 BIP 及它所帮助进行发展的指标的价值 显然, 已经建立的联系将帮助扩展合作伙伴关系产品的客户, 同时在多边环境协定间的指标努力中产生协同作用和效率 在 CITES COP 15 中, 一个决策被指定来继续参与和支持 2010 BIP, 这样的官方决策对于维护多部门关系来说也是重要的 多边环境协定个体及特定部门而定制的产出可能是增加指标对于多种客户的关联性的一个关键要素 对于指标交流 后 2010 的进一步强调是必需的 最初决定的时候合作伙伴关系的主要目标是关注指标的发展和传输, 较少关注交流 在 2010 BIP 产品的积极摄取中, 指标交流应该变为一个后 2010 合作伙伴关系的主要支柱之一 的目标已经变得清晰 除了由 2010 BIP 秘书处领导的交流, 合作伙伴们的交流机制的更广泛应用也将带来益处 指标能力发展 国家生物多样性指标对有效保护, 可持续利用和生物多样性资源平等共享具有至关重要的作用 它们的角色包括提升及理解生物多样性如何成为优先发展问题的一部分, 例如减少贫穷和环境变化 生物多样性指标需要进一步发展以强调国家生物多样性和发展优先权, 包括 NBSAPs 在技术, 科学, 和政策层面上, 生物多样性指标的认知或使用都比较匮乏 生物多样性指标认知度的匮乏常常是由于一方面对于社会部门对于生物多样性话题理解的匮乏, 另一方面在决策制定过程中科学信息使用的匮乏 对于达成国际目标和协议的进度进行报告是重要的, 但是对构建生物多样性指标的长期投资, 仅在它们被认为对于满足国家优先权有用的时候, 才可能实现持续发展 国家从一个有效的国家机构受益来统筹它们的国家生物多样性指标 尤其在很多发展中国家, 生物多样性信息的收集和交流是基于一个特设而零散的基础, 例如, 周期性报告的需求 提升具有对于有效决策制定可获取的生物多样性指标和其它信息的能力需要有一个负责机构的存在 国家和地区内的政府机构, 非政府组织和其它利益相关者所进行的关系网络建设及合作大幅度提升了国家指标发展和使用的进程 地区讲习班和多方利益相关者合作的组织已经成为一个非常高效的能力建设的途径及国家内的结果模拟 一个共同框架的使用, 以此指导指标发展和学习的设计, 已经大幅度地促进了这个进程 发展中国家需要财务的和技术的支持来发展和使用生物多样性指标 如果没有额外的财务和技术支持, 那么在发展中国家的政府和社会其余部分的决策制定中, 生物多样性指标匮乏很有可能仍然是其中的一个原因 2010 BIP 的合作伙伴将继续寻找合理途径来支持国家和地区生物多样性指标的发展和使用以及全球性指标的发展 达成此目的的其中一个机制将是通过进一步发展国家生物多样性指标门户网站 net) 这个网络平台可以分享合作伙伴关系在地区和国家指标发展的扩展知识和经验, 并且可以作为国家和地区寻求发展和使用生物多样性指标的在线资源 该门户网站不仅仅提供在线的指导材料, 而且将允许国家共享它们从指标发展中获得的经验教训 OUTPUTS, EXPERIENCES AND LESSONS LEARNT FROM THE 2010 BIODIVERSITY INDICATORS PARTNERSHIP 13
15 结论 对建立可持续的生物多样性指标合作伙伴关系的需求已经得到广泛认同 SBSTTA 14 也推荐 COP 10 确认需要继续加强各级监测生物多样性的能力, 特别包括通过以下方式 :(i) 在实现 2010 年后全球指标时依靠 2010 年生物多样性指标伙伴关系并就继续开展工作 ; 及 (iv) 支持国家和区域努力建立或加强生物多样性的监测和报告制度, 以使各缔约方能够确定本国的目标和评估实现国家和 / 或区域一级确定的生物多样性目标方面取得的进展 这些建议反映了跟踪全球生物多样性变化和它的影响需要多方利益相关者的综合努力, 以及在测量尺度中及尺度间方便信息和经验共享的认知 一个不断发展的合作伙伴关系将扩展它的成员, 以及为支持指标能力发展而付出努力, 这些是为了满足新的生物多样性公约战略计划的需求 显然, 一个建立于 2010 BIP 之上, 且 2010 年之后会继续发展的指标合作伙伴关系将会受到广泛欢迎 因为, 这能确保一个相关的, 紧凑而稳定的来自多种资源的具有多种目标的指标的协调一致和进一步的发展 尤其是这个更新的合作伙伴关系, 将会确保一个国家指标的发展和基于指标而编写的进度报告的大幅度增长, 这就使得改善了广度和全球指标覆盖面积后的指标体系可以被获取并进行交流 14 BIODIVERSITY INDICATORS & THE 2010 BIODIVERSITY TARGET
16 RÉSUMÉ Le présent rapport résume les expériences et les enseignements tirés du Partenariat relatif aux indicateurs de biodiversité pour 2010 (2010 BIP), et fournit également des informations sur les 27 indicateurs mondiaux élaborés en soutien à la réalisation de l objectif de 2010 relatif à la diversité biologique de la Convention sur la diversité biologique (CDB). Le partenariat, formé en 2007 grâce à l apport d un financement substantiel par le Fonds pour l environnement mondial, a travaillé ces trois dernières années à l élaboration, au renforcement, à la mise en œuvre et à la communication d un jeu d indicateurs complémentaires convenu par les Parties à la CDB lors de la COP 8 (décision VIII/15), en Celui-ci comprend des indicateurs permettant d évaluer l état et les tendances d évolution de la biodiversité, l utilisation durable des ressources, les menaces pèsant sur la biodiversité, l intégrité des écosystèmes et les biens et services qu ils rendent, l état des connaissances, les innovations et les pratiques, ainsi que la situation relative aux transferts de ressources. Le 2010 BIP vise à assurer que les décisions prises par les gouvernements et d autres parties prenantes reposent sur des informations mieux appropriées, afin d améliorer l état de conservation de la biodiversité au niveau mondial. Cet objectif est réalisé grâce à la mise en œuvre de trois résultats: 1. Un Partenariat relatif aux indicateurs de biodiversité pour 2010 fournissant des informations utiles aux décideurs; 2. La mise en œuvre et à disposition d indicateurs mondiaux améliorés; 3. L utilisation d indicateurs mondiaux par les gouvernements nationaux et les organisations régionales et la contribution de ces derniers à leur amélioration. Plus de 40 organisations du monde entier ont travaillé à l amélioration de l élaboration des indicateurs à l approche de l Année internationale de la diversité biologique, afin de s assurer que les décideurs, et notamment les participants à la COP 10 de la CDB à Nagoya, disposent des informations les plus exhaustives, les plus exactes et les plus récentes sur les tendances d évolution de la biodiversité. Ainsi, la troisième édition des Perspectives mondiales de la diversité biologique, publiée en 2010, a pu être établie à partir d un ensemble de données considérablement amélioré et plus complet que celui utilisé pour les volumes précédents. En outre, grâce aux efforts déployés par le 2010 BIP, 45 pays du monde ont activement apporté leur soutien à l élaboration et à l utilisation des indicateurs et un bien plus grand nombre y a participé indirectement en faisant usage des informations et des outils disponibles sur les sites du partenariat: et Le 2010 BIP a atteint son but par rapport à l Objectif de 2010 relatif à la diversité biologique et a prouvé l utilité d un partenariat mondial pluripartite. Il a également identifié des enseignements importants pour toute élaboration éventuelle d indicateurs post Les principaux messages qui ressortent des travaux du 2010 BIP sont examinés dans le présent rapport. OUTPUTS, EXPERIENCES AND LESSONS LEARNT FROM THE 2010 BIODIVERSITY INDICATORS PARTNERSHIP 15
17 LE PARTENARIAT Le 2010 BIP a fourni une évaluation intégrée des tendances révélées par les indicateurs mondiaux, laquelle a servi de base au rapport de la CDB sur les progrès accomplis pour la réalisation de l Objectif de 2010 relatif à la diversité biologique. Le 2010 BIP a été créé principalement pour permettre l amélioration de la diffusion d informations et de la prise de décisions au niveau mondial par rapport à l Objectif de 2010 relatif à la diversité biologique de la CDB. Le premier public intéressé a donc été les Parties et le Secrétariat de la CDB, ainsi que d autres accords multilatéraux sur l environnement. La première grande occasion pour le 2010 BIP de communiquer ses résultats au processus de la CDB a été la publication de la troisième édition du rapport du Secrétariat de la CDB sur les Perspectives mondiales de la diversité biologique (GBO-3) présenté officiellement lors de la 14e réunion du SBSTTA en mai La première section du rapport présente une évaluation des progrès accomplis vers la réalisation de l Objectif de 2010 relatif à la diversité biologique d après les données et les analyses fournies par le 2010 BIP. Cette collaboration entre le 2010 BIP et le Secrétariat de la CDB s est révélée un moyen très efficace de mettre des informations techniques obtenues des indicateurs, à la disposition d un public en grande partie non averti. Le 2010 BIP a permis de mieux sensibiliser les scientifi ques et les décideurs à l élaboration d indicateurs et aux besoins futurs. Les Partenaires et le Secrétariat du 2010 BIP ont joué un rôle capital lors de l «Atelier d experts international sur les indicateurs de biodiversité pour 2010 et l élaboration d indicateurs post-2010», organisé par le PNUE-WCMC en collaboration avec le Secrétariat de la CDB en juillet Cet atelier a rassemblé plus de 70 participants, dont des experts désignés par les gouvernements et des représentants de conventions liées à la biodiversité, des agences des Nations Unies, des instituts d enseignement et de recherche ainsi que d autres organisations internationales, intergouvernementales et non gouvernementales concernées, dans le but d examiner l utilisation et l efficacité des indicateurs de biodiversité pour 2010 et d envisager les conclusions à en tirer pour l élaboration d objectifs et d indicateurs post Les partenaires du 2010 BIP ont également publié dans la revue Science des évaluations de l état d élaboration des indicateurs à l approche de 2010, ainsi qu une synthèse des tendances révélées par les indicateurs mondiaux. S appuyant sur ces activités, les partenaires, de même que le Secrétariat, sont bien placés pour apporter en 2011 une contribution significative au Groupe spécial d experts techniques de la CDB (AHTEG) proposé en vue de l élaboration d orientations complémentaires sur la surveillance future de la biodiversité au titre de la Convention et l utilisation des indicateurs mondiaux conformément aux recommandations de la 14e réunion du SBSTTA. Le 2010 BIP a apporté une contribution significative à l élaboration d indicateurs nationaux. Les efforts de renforcement des capacités déployés par le partenariat en soutien à l élaboration, à la mise en œuvre, à la communication et à la promotion efficace d indicateurs nationaux de biodiversité en Afrique, en Asie, en Amérique latine et aux Caraïbes, ont été presque universellement salués. On ressent au niveau mondial une demande de plus en plus importante d élaboration complémentaire d indicateurs nationaux, tant en matière de biodiversité que de services rendus par les écosystèmes. Le partenariat a élaboré une panoplie intégrée de ressources qui complète les activités organisées dans le cadre des ateliers et comprend des documents d orientation sur l élaboration d indicateurs, une mise à l échelle des indicateurs spécifiques, et un portail web multilingue permettant une large diffusion des informations. LES INDICATEURS L élaboration et l utilisation d indicateurs de biodiversité en vue du suivi des progrès accomplis par rapport aux plans et objectifs nationaux et internationaux sont une «tâche en cours». Le 2010 BIP a contribué de manière considérable à l élaboration des indicateurs de biodiversité pour 2010, ainsi qu à leur analyse, leur communication, leur adoption et leur utilisation. Comme les Parties à la CDB envisagent un plan stratégique révisé post-2010, avec une nouvelle série d objectifs et d indicateurs, nous prévoyons que l expérience du 2010 BIP et les enseignements qu il a tirés de ses travaux, fourniront un aperçu et des informations utiles. Les indicateurs post-2010 devront être liés aux objectifs et s appuyer sur les indicateurs existants. Le choix d indicateurs pour la période d après 2010 dépend de ou des objectifs de la CDB. Toutefois, si l on veut pouvoir suivre les progrès accomplis, ces objectifs devront être mesurables, ce qui dépend à son tour des capacités scientifiques à élaborer et à mettre en œuvre des indicateurs appropriés. Ainsi, il est préférable d élaborer les objectifs et les indicateurs parallèlement en s appuyant sur un processus itératif et des bases de référence existantes. Le maintien d un partenariat est nécessaire afi n de faciliter la poursuite de l élaboration et de l utilisation d indicateurs. D après l expérience du 2010 BIP, quel que soit le cadre d indicateurs adopté, le maintien d un partenariat de fournisseurs de données, comprenant à la fois des partenaires actuels et de nouveaux partenaires, sera essentiel pour l élaboration et la mise en œuvre de ces indicateurs. Ainsi, comme en a conclu l atelier tenu 16 BIODIVERSITY INDICATORS & THE 2010 BIODIVERSITY TARGET
18 à Reading en 2009, «on doit maintenir un processus/ partenariat souple et participatif pour l élaboration d indicateurs post-2010 et le doter des ressources nécessaires afin d accroître la collaboration à l élaboration, au contrôle de la qualité, à la mise en œuvre et à la communication des indicateurs à tous les niveaux, y compris le partage d expériences et le renforcement des capacités». LA COMMUNICATION DES INDICATEURS Seuls des indicateurs correctement élaborés peuvent fournir des messages clairs à diffuser. Il n est possible de diffuser que des indicateurs correctement élaborés, qui produisent des résultats peuvent être décrits de manière narrative. On devra par conséquent centrer les efforts sur la mise en œuvre des indicateurs existants et s assurer que les futurs indicateurs supplémentaires puissent produire rapidement des résultats. Un ensemble d indicateurs correctement élaboré fournira tout un éventail de résultats qui pourront être interprétés de manière à en dégager des messages clairs spécifiques aux différents publics ciblés. L établissement de liens logiques entre les indicateurs facilitera la communication en fournissant des informations textuelles cohérentes et des messages clairs destinés à toute une gamme de publics. Il sera extrêmement utile de modifier et de simplifier le cadre actuel d indicateurs afin de mieux expliquer les relations entre les indicateurs relevant de différents domaines. L approche consistant à intégrer les résultats des indicateurs afin d obtenir des messages cohérents peut aussi être appliquée à différents thèmes ou sujets. Des messages clés dressant un tableau plus cohérent de l état de la biodiversité pourront alors être communiqués. Les indicateurs de biodiversité sont plus faciles à comprendre et à communiquer s ils sont liés les uns aux autres établissant ainsi un rapport entre les politiques et les résultats. Le renforcement des liens entre le Partenariat et d autres accords multilatéraux sur l environnement et secteurs permettrait d accroître l utilisation effective des indicateurs. De plus grands efforts sont nécessaires pour prouver aux autres accords multilatéraux sur l environnement et autres secteurs l utilité du 2010 BIP et des indicateurs qu il a aidé à élaborer. L existence de liens solides et plus clairs permettrait d élargir le public cible pouvant bénéficier des produits et résultats du Partenariat, tout en créant des synergies entre les accords multilatéraux sur l environnement afin de renforcer efficacement les efforts déployés pour l élaboration d indicateurs. La CITES COP 15 a pris la décision de poursuivre sa collaboration avec le 2010 BIP et de continuer à lui apporter son soutien. De telles décisions officielles sont importantes pour le maintien des liens existants. La production de résultats spécifiquement adaptés à chacun des accords multilatéraux sur l environnement et aux différents secteurs pourrait jouer un rôle décisif en permettant d accroître la pertinence des indicateurs pour des publics différents. Il sera nécessaire d accorder une plus grande importance à la communication des indicateurs après Lorsqu ils ont été définis à l origine, les principaux objectifs du Partenariat étaient axés sur l élaboration et la mise en œuvre d indicateurs et accordaient moins d importance à la communication. Si l on en juge par l utilisation positive des produits du 2010 BIP, il paraît de plus en plus clair que la communication des indicateurs devra constituer l un des principaux piliers de tout partenariat après En plus des activités de communication menées par le Secrétariat du 2010 BIP, une utilisation plus large des moyens de communication des partenaires serait mutuellement bénéfique. RENFORCEMENT DES CAPACITÉS D ÉLABORATION D INDICATEURS Les indicateurs nationaux de biodiversité jouent un rôle capital sur le plan de la conservation effective, de l utilisation durable et du partage équitable des ressources de la biodiversité. Ils permettent entre autres de mieux comprendre que la conservation de la biodiversité fait partie des moyens de lutte contre les problèmes prioritaires en matière de développement, tels que la réduction de la pauvreté et les changements climatiques. Des indicateurs de biodiversité doivent être élaborés afi n de répondre aux priorités nationales en matière de biodiversité et de développement, y compris celles des SPANB. On constate souvent une très faible sensibilisation aux indicateurs de biodiversité et une utilisation très limitée de ceux-ci à tous les niveaux (technique, scientifique et politique). Le manque de sensibilisation aux indicateurs de biodiversité provient souvent, en partie, d une connaissance limitée de ce qu est la biodiversité parmi de nombreux secteurs de la société. Il peut être dû également à l utilisation limitée d informations scientifiques lors de la prise de décisions. Bien que la diffusion d informations sur les progrès accomplis vers la réalisation des objectifs et accords internationaux soit importante, l investissement à long terme dans la production d indicateurs de biodiversité ne peut être maintenu que s ils sont perçus comme étant utiles pour répondre aux priorités nationales. OUTPUTS, EXPERIENCES AND LESSONS LEARNT FROM THE 2010 BIODIVERSITY INDICATORS PARTNERSHIP 17
19 Il est bénéfi que pour les pays de mettre en place une institution nationale effi cace chargée de coordonner les indicateurs nationaux de biodiversité. Dans de nombreux pays en développement notamment, la collecte et la communication d informations sur la biodiversité sont effectuées de manière ad hoc et discontinue, par exemple lorsqu elles sont nécessaires pour l établissement de rapports périodiques. Pour être en mesure de disposer d indicateurs de biodiversité et d autres informations en vue d une prise de décision efficace, la mise en place d une institution responsable est nécessaire. L établissement de contacts et la collaboration entre les institutions gouvernementales, les ONG et d autres parties prenantes intéressées au sein des pays et des régions renforcent de manière considérable les progrès accomplis sur le plan de l élaboration et de l utilisation d indicateurs nationaux. L organisation d ateliers régionaux et les activités menées en collaboration avec plusieurs parties prenantes ont été un moyen très efficace de renforcer les capacités et de stimuler les résultats au sein des pays. L utilisation d un cadre commun pour guider la conception de l élaboration d indicateurs et la formation à cette tâche a considérablement facilité les progrès. Les pays en développement ont besoin d un soutien fi nancier et technique pour leur permettre d élaborer et d utiliser des indicateurs de biodiversité. Sans l apport d un soutien financier et technique supplémentaire, les difficultés à l origine du manque de prise en considération des indicateurs de biodiversité dans les processus décisionnels des gouvernements et du reste de la société dans les pays en développement risquent de persister. Les partenaires du 2010 BIP continueront à chercher des moyens d apporter un soutien à l élaboration et à l utilisation d indicateurs de biodiversité nationaux et régionaux conjointement avec l élaboration d indicateurs mondiaux. Il est prévu que la mise au point plus poussée du Portail des indicateurs nationaux de la biodiversité ( constituera l un des mécanismes qui faciliteront la réalisation de cet objectif. Ce portail permettra le partage des vastes connaissances et de l expérience chevronnée du Partenariat en matière d élaboration d indicateurs régionaux et nationaux et constituera une ressource en ligne pour les pays et régions souhaitant élaborer et utiliser des indicateurs de biodiversité. Outre la fourniture de documents d orientation en ligne, il permettra aux pays de partager leurs expériences et les enseignements tirés de l élaboration d indicateurs. CONCLUSION La nécessité de maintenir un Partenariat relatif aux indicateurs de biodiversité est reconnue. Lors de la 14e réunion du SBSTTA, il a également été recommandé que la COP 10 «reconnaisse la nécessité de continuer à renforcer notre capacité de surveiller la diversité biologique à tous les niveaux, notamment en : (i) Mettant à profit et en poursuivant les travaux du Partenariat relatif aux indicateurs de biodiversité pour 2010 relatifs à l élaboration d indicateurs mondiaux pour l après-2010 et (iv) Appuyant les efforts déployés au niveau national et régional pour créer ou renforcer des systèmes de surveillance de la diversité biologique et de rapport afin de permettre aux Parties d évaluer les progrès accomplis dans l atteinte des objectifs relatifs à la biodiversité établis aux niveaux national et/ou régional.» Ces recommandations reflètent la reconnaissance que le suivi de l évolution de la biodiversité et des répercussions de celle-ci au niveau mondial exige l effort conjoint de nombreuses parties prenantes, qui devront s appuyer sur les bases locales/ nationales pour obtenir une idée de la situation mondiale et faciliter l échange d informations et d expériences d une échelle à l autre. Si un partenariat est maintenu, celui-ci augmentera le nombre de ses membres et intensifi era ses efforts visant à appuyer le renforcement des capacités d élaboration d indicateurs, afi n de répondre aux besoins du nouveau plan stratégique de la CDB. Il est clair que le maintien d un partenariat relatif aux indicateurs qui s appuierait sur le 2010 BIP et se poursuivrait au-delà de 2010, afin d assurer la coordination et l élaboration complémentaire d un ensemble cohérent d indicateurs pertinents, opportuns et robustes provenant de sources multiples et destinés à des fins multiples, serait dans l ensemble accueilli favorablement. Ce Partenariat renouvelé assurera entre autres une intensification considérable des activités en matière d élaboration d indicateurs nationaux et d établissement de rapports d avancement axés sur les indicateurs, permettant ainsi d améliorer l envergure et la couverture des indicateurs mondiaux disponibles et diffusés. 18 BIODIVERSITY INDICATORS & THE 2010 BIODIVERSITY TARGET
20 КРАТКИЙ ОБЗОР О ПРОДЕЛАННОЙ РАБОТЕ Данный отчет суммирует приобретенный опыт и навыки, полученные в ходе работы Партнерства по индикаторам биоразнообразия 2010 (2010 BIP), а также предоставляет данные по 27 глобальным индикаторам, разработанным при поддержке Задачи биоразнообразия на 2010 года Конвернции по биологическому разнообразию (КБР). Партнерство было образовано в 2007 году при значительном финансировании Глобального Экологического Фонда (ГЭФ), и работало совместно последние три года над разработкой, наращиванием, внедрением и сообщением наборов дополнительных индикаторов, которые были согласованы сторонами на Конвенции о биоразнообразии (КБР) на 8 встрече (COP 8 (решение от VIII/15)) в 2006 году. Сюда вошли индикаторы по измерению статуса и тенденции в биоразнообразии, по рациональному использованию, угрозам биоразнообразия, целостности экосистем, товаров и услуг экосистем, статусу знаний, инноваций и практических методов, а также статусу перемещения ресурсов. Задача 2010 BIP заключается в обеспечении того, чтобы решения, вынесенные правительствами и прочими заинтересованными сторонами, лучше информировались для улучшения охранного статуса биоразнообразия на глобальном уровне. Это достигается за счет обеспечения трех результатов: 1. Партнерство по индикаторам биоразнообразия 2010, вырабатывающее информацию полезную для лиц, принимающих решения; 2. Улучшенные глобальные индикаторы внедрены и имеются в наличии; 3. Правительства государств и региональные организации используют и оказывают вклад в улучшенное обеспечение глобальных индикаторов. Более 40 организаций по всему миру работали над усилием развития индикаторов для запуска их в Международный год Биоразнообразия, чтобы обеспечить более всестороннюю, аккуратную и обновленную информацию по тенденциям биоразнообразия для лиц, принимающих решения, особенно для Конвенции о биологическом разнообразии (КБР) на 10 встрече (COP 10) в г.нагоя. Это привело к значительному расширению и более всесторонней основе свидетельств по третьей Глобальной Перспективе в области Биоразнообразия, выпущенной в 2010 году, в сравнении с более ранними объемами. Кроме того, 2010 BIP непосредственно задействовали 45 стран во всем мире в поддержку развития и использования индикаторов, а также косвенно много других стран посредством обеспечения информации и инструментов через вебсайты партнерства: и BIP достигли своих целей в отношении Задачи биоразнообразия 2010 года, и продемонстрировали значение глобального партнерства большого числа заинтересованных сторон. Также это помогло определить задания на период после 2010 года в определении индикаторов. Ключевые сообщения, исходящие от 2010 BIP, рассматриваются в данном отчете. OUTPUTS, EXPERIENCES AND LESSONS LEARNT FROM THE 2010 BIODIVERSITY INDICATORS PARTNERSHIP 19
21 ПАРТНЕРСТВО 2010 BIP обеспечили комплексную оценку глобальным тенденциям по индикаторам, которые образовали основу для отчета КБР по прогрессу, относительно Задачи биоразнообразия на 2010 год BIP был главным образом установлен для обеспечения улучшенной отчетности и принятия решений на глобальном масштабе по Задачи биоразнообразия на Конвенции по биоразнообразию 2010 года. Поэтому первичной глобальной аудиторией стали Стороны и Секретариат КБР, и различные многосторонние природоохранные соглашения. Первой самой важной возможностью для 2010 BIP в сообщении своих результатах по прогрессу КБР стал отчет Секретариата КБР по Глобальной перспективе в области биоразнообразия (GBO-3), запущенной на совещании SBSTTA 14 в мае 2010 года. Первый раздел отчета посвящен оценке прогресса относительно Задачи Биоразнообразия на 2010 год, основанного на данных и анализах, произведенных 2010 BIP. Такое сотрудничество между 2010 BIP и Секретариатом КБР стало весьма эффективным способом для получения технической информации из индикаторов, которые доступны для более обширной нетехнической аудиенции BIP увеличили осведомленность о развитии индикаторов и их будущей необходимости среди ученных и лиц, принимающих стратегические решения. Партнеры и Секретариат 2010 BIP сыграли центральную роль в Международном экспертном семинаре по индикаторам Биоразнообразия 2010 и в разработке индикаторов после 2010 года, который был созван UNEP-WCMC при сотрудничестве Секретариата КБР в июле 2009 года. Семинар собрал вместе более 70 участников, включая экспертов от государств и представителей от конвенций, имеющих отношение к биоразнообразию, агентства ООН, академические и исследовательские институты, и другие различные организации международного, межправительственного и неправительственного уровня для обзора использования и эффективности индикаторов биоразнообразия 2010 года, и для рассмотрения результатов, используемых в разработке задач и индикаторов на период после 2010 года. Партнеры 2010 BIP также опубликовали оценки состояния развития индикаторов в преддверии 2010 года, а журнал Science опубликовал статью о синтезе глобальных тенденций по индикаторам. Основываясь на таких действиях, партнеры и секретариат хорошо организованы, чтобы обеспечить серьезных вклад в экспертнотехническую группу КБР по индикаторам (AHTEG) на 2011 год с целью развития последующей рекомендации по будущему мониторингу в рамках Конвенции и использования глобальных индикаторов, согласно рекомендации SBSTTA BIP сделали значительных вклад в развитие государственных индикаторов. Усилия по наращиванию потенциалов партнерства, поддерживая развитие, внедрение, сообщение и эффективной поддержки индикаторов биоразнообразия в государственном масштабе в Африке, Азии, Латинской Америке и в Карибском региона, почти везде получили похвалу. Во всем мире растет спрос на последующую разработку индикаторов государственного уровня, как по биоразнообразию, так и по услугам экосистем. Партнерство разработали интегрированный набор ресурсов в дополнение к семинарским работам, который включает руководства по развитию индикаторов, специальному масштабированию индикаторов и многоязычный веб-портал для широкого распространения информации. ИНДИКАТОРЫ Разработка и использование индикаторов биоразнообразия для отслеживания прогресса относительно государственных и международных планов и задач находится в процессе BIP сделал важные вклады в развитие индикаторов биоразнообразия 2010 года, а также выполнил их анализ, сообщение, понимание и применение. Так как стороны КБР рассматривают пересмотренный стратегический план на период после 2010 года, с новыми задачами и индикаторами, мы размышляем над опытом, извлеченным из 2010 BIP, предоставляя ценность ресурса и сути проблемы. Индикаторы после 2010 года должны быть связаны с задачами и строиться на существующих индикаторах. Выбор индикаторов на период после 2010 года будет зависеть от задачи(ей), принятых КБР. Однако, чтобы можно было отследить прогресс, необходимо вести измерение таких задач, что в свою очередь будет зависеть от научно-технической мощности в развитии и донесении соответствующих индикаторов. Таким образом, разработка задач и индикаторов должна проводиться последовательно за счет метода повторяющихся процессов, а построение на основе существующих сюжетных линий. Текущее партнерство необходимо для оказания поддержки в непрерывном развитии и использовании индикаторов. Независимо от того какая рабочая структура по индикаторам согласована, опыт 2010 BIP рекомендует, чтобы продолжающееся партнерство поставщиков данных, включая существующих и 20 BIODIVERSITY INDICATORS & THE 2010 BIODIVERSITY TARGET
22 новых партнеров, было основным для их развития и поставок. Таким образом, на семинаре, проходившем в г.ридинге в 2009 году, было сделано заключение: «Гибкий и содержательный процесс / партнерство по развитию индикаторов на период после 2010 года должен поддерживаться и соответствующим образом обеспечиваться, чтобы повышать участие в разработке, в контроле качества, во внедрении и сообщении индикаторов на всех уровнях, включая обмен опытом и наращивание потенциалов». СООБЩЕНИЕ ИНДИКАТОРОВ Только хорошо разработанные индикаторы могут обеспечивать четкие донесения для их сообщения. Индикаторы, которые дают результаты и производят сюжетные линии могут передаваться для их сообщения. Поэтому акцент необходимо делать на поставке существующих индикаторов и обеспечении дополнительных индикаторов в будущем, которые могут производить быстрые результаты. Хорошо разработанный набор индикаторов будет обеспечивать ряд результатов, которые могут интерпретироваться для создания четких донесений для различной целевой аудитории. Логически взаимосвязанные индикаторы могут помогать сообщению за счет обеспечения логически-последовательных историй и четких донесений для круга аудитории. Модифицирование и упрощение текущей рабочей структуры по индикаторам для более четкого пояснения взаимосвязей между индикаторами от различных участков внимания будет весьма ценным. Метод интеграции результатов по индикаторам для сообщения логически-последовательных историй также может применяться в различных темах или топиках. Ключевые донесения могут сообщаться, что будет давать более последовательную картину статуса биоразнообразия. Индикаторы биоразнообразия более просты в понимании и сообщении, когда они взаимосвязаны в набор, который соединит стратегии с результатами. Усиленные взаимосвязи Партнерства с другими многосторонними природоохранными соглашениями и секторами может способствовать увеличению понимания индикаторов. Необходимо больше усилий, чтобы продемонстрировать ценность 2010 BIP и индикаторов, что поможет разработать прочие многосторонние природоохранные соглашения и сектора. Более ясные, установленные связи помогут расширить аудиенцию по продуктам и результатам Партнерства, создавая совместные действия и продуктивность в усилиях над индикаторами между многосторонними природоохранными соглашениями. На 15 встрече CITES (COP 15) было принято решение продолжить контакт с 2010 BIP и поддержку, и подобные официальные решения очень важны для поддержания связей. Производство специально-приспособленных результатов для отдельных многосторонних природоохранных соглашений и различных секторов может быть ключевым элементов в увеличении релевантности индикаторов для сложной аудитории. Требуется уделять больше внимания на сообщение индикаторов в период после 2010 года. Когда изначально Партнерство задумывалось, его основные задачи фокусировались на развитии и обеспечении индикаторов с наименьшим фокусом на их сообщение. Из позитивного принятия продукции 2010 BIP стало ясно, что сообщение индикаторов должно стать одной из основных опор партнерства на период после 2010 года. Более широкое использование средств взаимосвязи партнеров будет приносить совместную выгоду наряду с сообщением индикаторов, которое ведется Секретариатом 2010 BIP. НАРАЩИВАНИЕ ПОТЕНЦИАЛА ИНДИКАТОРОВ Государственные индикаторы биоразнообразия жизненно важны для эффективной охраны природы, рационального использования и справедливого распределения ресурсов биоразнообразия. Их роль включает увеличение восприятия по тому, как биоразнообразие является частью рассматриваемых вопросов в развитии их приоритетности, например сокращение бедности и изменение климата. Индикаторы биоразнообразия нуждаются в разработке, чтобы рассматривать приоритеты биоразнообразия и развития, включая государственные стратегии в биоразнообразии и планы действий (NBSAP). Зачастую осведомленность об индикаторах биоразнообразия или их использовании весьма низкая на всех уровнях (техническом, научном и политическом). Недостаток осведомленность об индикаторах биоразнообразия это зачастую следствие ограниченного понимания предмета биоразнообразия среди многих отраслей сообщества, также это может быть из-за ограниченного использования научно-обоснованной информации на уровне принятия решений. Отчетность по прогрессу относительно международных задач и соглашений важна, но и долгосрочные инвестиции в производство индикаторов биоразнообразия могут поддерживаться только, если они полезны и соответствуют государственным приоритетам. OUTPUTS, EXPERIENCES AND LESSONS LEARNT FROM THE 2010 BIODIVERSITY INDICATORS PARTNERSHIP 21
23 Страны получают выгоду от эффективного национального ведомства по координированию индикаторов биоразнообразия их страны. Во многих развивающихся странах, сбор и сообщение информации по биоразнообразию проводится на специализированной и фрагментальной основе, например требования по периодическому отчету. Чтобы иметь возможность для обеспечения индикаторов биоразнообразия и прочей информации для эффективного принятия решений, необходимо обеспечить ответственное учреждение. Налаживание взаимосвязей и совместная работа управляющих учреждений, неправительственных организаций и прочих заинтересованных сторон в рамках стран и регионов, поможет значительно усилить прогресс в развитии и использовании государственных индикаторов. Организация региональных семинаров и сотрудничества множества заинтересованных сторон оказались весьма эффективными средствами наращивания потенциалов и стимулирования результатов внутри стран. Использование общей рабочей структуры в руководстве дизайна развития и изучения индикаторов весьма ощутимо способствовало прогрессу. Развивающиеся страны нуждаются в финансовой и технической поддержке для развития и использования индикаторов биоразнообразия. Без дополнительной финансовой и технической поддержки, вероятно, что причины будут оставаться из-за нехватки индикаторов биоразнообразия в принятии решений правительствами и оставшаяся часть сообщества в развивающихся странах. Партнеры в 2010 BIP будут продолжать искать способы для поддержания развития и использования государственных и региональных индикаторов биоразнообразия в сочетании с развитием глобальных индикаторов. Предполагается, что одним из механизмов в достижении этого будет последующее развитие Портала по международным индикаторам биоразнообразия ( net). Данный портал будет вести обмен обширных знаний и опыта Партнерства в разработке индикаторов на региональном и государственном уровне, и будет интерактивным ресурсом для стран и регионов, которые хотят разрабатывать и использовать индикаторы биоразнообразия. Наряду с обеспечением руководств в режиме онлайн, портал также будет позволять государствам осуществлять обмен опытом и знаниями, полученными из процесса разработки индикаторов. ЗАКЛЮЧЕНИЕ Необходимость в продолжении Партнерства по индикаторам биоразнообразия признается. SBSTTA 14 также рекомендует, чтобы 10-ая встреча (COP 10) «признала необходимость дальнейшего укрепления нашей способности проводить мониторинг биоразнообразия на всех уровнях, (i) на основе и в продолжение работы Партнерства по задачам индикаторов в сохранении биоразнообразия, намеченной на 2010 год, по разработке глобальных индикаторов на период после 2010 года» и (iv) «оказание поддержки государственным и региональным усилиям по становлению или усилению мониторинга за биоразнообразием и системами отчетности, чтобы позволить Сторонам оценивать прогресс относительно задач биоразнообразия, устанавливаемых на государственном и/или региональном уровне». Такие рекомендации отражают признак того, что отслеживание изменений в глобальном биоразнообразии и последствия такового, требуют совместных усилий множества заинтересованных сторон, за счет строительства фундаментов на локальных/государственных уровнях для создания глобальной картины, и упрощения обмена информацией и опытом между различными уровнями и среди этих уровней. Текущее партнерство будет расширять свое членство, и его усилия в поддержку наращивания потенциалов по индикаторам, чтобы отвечать требованиям нового стратегического плана КБР. Ясно, что партнерство по индикаторам, основываясь на 2010 BIP и продолжая работу после 2010 года, чтобы обеспечивать координирование и дальнейшее развитие последовательного набора релевантных, своевременных и устойчивых индикаторов биоразнообразия из множества источников и для различных целей, будет широко приветствоваться. В частности, такое обновленное Партнерство будет обеспечивать серьезный возросший уровень развития государственных индикаторов и отчетности о прогрессе с соответствующим улучшенным охватом и покрытием глобальных индикаторов, которые доступны и сообщены. 22 BIODIVERSITY INDICATORS & THE 2010 BIODIVERSITY TARGET
24 RESUMEN EJECUTIVO Este informe resume las experiencias y lecciones aprendidas mediante la Alianza 2010 sobre Indicadores de Biodiversidad (2010 BIP), además de proporcionar detalles sobre los 27 indicadores globales desarrollados como apoyo a la meta sobre diversidad biológica de 2010 del Convenio sobre la Diversidad Biológica (CDB). La alianza se formó en el 2007 con financiación sustancial del Fondo para el Medio Ambiente Mundial y ha trabajado durante los tres últimos años para desarrollar, fortalecer, implementar y comunicar un conjunto de indicadores complementarios que fueron acordados por las Partes del CDB en la COP 8 (decisión VIII/15) del Éstos incluyeron indicadores para medir la situación y las tendencias de la diversidad biológica, el uso sostenible, amenazas a la diversidad biológica, la integridad de los ecosistemas y bienes y servicios de los ecosistemas, la situación de los conocimientos, innovaciones y prácticas tradicionales, y la situación de las transferencias de recursos. El objetivo de la 2010 BIP es asegurar que las decisiones tomadas por los gobiernos y por otros actores implicados tengan una mejor base informativa para mejorar el estado de conservación de la biodiversidad a nivel global. Esto se está consiguiendo mediante tres procesos: 1. Una Alianza 2010 sobre Indicadores de Biodiversidad que genera información útil para quienes toman las decisiones; 2. Indicadores globales mejorados implementados y disponibles; 3. Gobiernos nacionales y organizaciones regionales usando y contribuyendo a una mejor producción de indicadores globales. Más de 40 organizaciones de todo el mundo han estado trabajando para mejorar el desarrollo de indicadores al aproximarse el Año de la Diversidad Biológica para asegurar que la información más completa, precisa y actualizada sobre las tendencias de la biodiversidad esté disponible para quienes toman las decisiones, particularmente para la COP 10 del CDB en Nagoya. Esto ha resultado en una base de evidencia significativamente mejor y más completa para la tercera Perspectiva Mundial sobre la Diversidad Biológica, lanzada en el 2010, en comparación con volúmenes anteriores. Además, la 2010 BIP ha participado directamente con 45 países de todo el mundo para apoyar el desarrollo y uso de indicadores, y con muchos más de forma indirecta a través de información y herramientas disponibles en sus páginas web y La 2010 BIP ha conseguido sus objetivos en relación a la meta sobre diversidad biológica de 2010 y ha demostrado el valor de una alianza global formada por diversos participantes. También ha identificado lecciones importantes para el desarrollo de indicadores después del Este informe explora los mensajes más importantes de la 2010 BIP. OUTPUTS, EXPERIENCES AND LESSONS LEARNT FROM THE 2010 BIODIVERSITY INDICATORS PARTNERSHIP 23
25 LA ALIANZA La 2010 BIP ha proporcionado una evaluación integrada de las tendencias de indicadores globales, lo cual ha formado la base para el informe del CDB sobre el progreso hacia la meta sobre diversidad biológica de La 2010 BIP se estableció principalmente para permitir reportes y toma de decisiones mejorados a nivel global en lo relacionado a la meta sobre diversidad biológica de 2010 del CDB. La principal audiencia global han sido por lo tanto las Partes y la Secretaría del CDB, además de otros acuerdos ambientales multilaterales. La primera gran oportunidad para la 2010 BIP de comunicar sus resultados al proceso del CDB ha sido el informe Perspectiva Mundial sobre la Diversidad Biológica (3) de la Secretaría del CDB, que se presentó en la reunión SBSTTA 14 en mayo de La primera parte del informe es una evaluación del progreso hacia la meta sobre diversidad biológica de 2010, basado en datos y análisis producidos por la 2010 BIP. Esta colaboración entre la 2010 BIP y la Secretaría del CDB fue una forma muy efectiva de hacer accesible información técnica de los indicadores a una audiencia en su mayoría no técnica. La 2010 BIP ha concienciado a científi cos y a tomadores de decisiones sobre el desarrollo y las necesidades futuras de los indicadores. Los Socios y la Secretaría de la 2010 BIP jugaron un papel crucial en el Taller Internacional de Expertos sobre los Indicadores de Biodiversidad 2010 y sobre el Desarrollo de Indicadores Post-2010, organizado por UNEP-WCMC en cooperación con la Secretaría del CDB en julio de El taller reunió a más de 70 participantes incluyendo expertos nominados por gobiernos y representantes de convenciones relacionadas con la biodiversidad, agencias de la ONU, instituciones académicas y de investigación y otras organizaciones internacionales, intergubernamentales y no gubernamentales relevantes, para revisar la utilización y la efectividad de los indicadores 2010 de biodiversidad y para considerar las implicaciones para el desarrollo de metas e indicadores después del Los socios de la 2010 BIP también publicaron evaluaciones del estado de desarrollo de los indicadores en las vísperas de 2010, y una síntesis de las tendencias de los indicadores globales en la revista científica Science. Basándose en esta actividades, tanto los socios como la secretaría se encuentran en una buena situación para proporcionar aportaciones significativas al grupo especial de expertos técnicos del CDB (AHTEG) en el 2011, para desarrollar el asesoramiento sobre el futuro seguimiento de la biodiversidad por la Convención y sobre el uso de indicadores globales, tal y como fue recomendado por SBSTTA 14. La 2010 BIP ha realizado una contribución signifi cativa al desarrollo de indicadores nacionales. Los esfuerzos de capacitación de la alianza, apoyando el desarrollo, implementación, comunicación y apoyo efectivo de indicadores de biodiversidad a escala nacional en África, Asia, Latinoamérica y el Caribe, han sido elogiados casi universalmente. Hay una creciente demanda mundial de más desarrollo de indicadores a nivel nacional, tanto para biodiversidad como para servicios ecosistémicos. La alianza ha desarrollado un conjunto integrado de recursos para complementar las actividades de los talleres; éstos incluyen documentos directrices sobre el desarrollo de indicadores, escala de indicadores específicos y un portal web en varios idiomas para diseminar ampliamente la información. LOS INDICADORES Se está trabajando en el desarrollo y uso de indicadores de biodiversidad para dar seguimiento al progreso en relación a planes y objetivos nacionales e internacionales. La 2010 BIP ha contribuido de forma importante al desarrollo de indicadores 2010 de biodiversidad, además de a su análisis, comunicación, acogida y uso. A medida que las partes del CDB consideren un plan estratégico revisado post 2010, con un nuevo conjunto de metas e indicadores, prevemos que la experiencia y lecciones de la 2010 BIP constituirán una perspectiva y un recurso valiosos. Los indicadores post 2010 deberían estar asociados a las metas y basarse en indicadores existentes. La variedad de indicadores para después del 2010 dependerá de la(s) meta(s) adoptada(s) por el CDB. Sin embargo, para poder dar seguimiento al progreso, estas metas deben ser medibles, lo que a su vez depende de la capacidad científica para desarrollar y presentar indicadores apropiados. Por lo tanto, es mejor llevar a cabo el desarrollo de metas e indicadores en tándem, mediante un proceso iterativo, y basándose en líneas base existentes. Es necesaria una alianza continua para apoyar el desarrollo y uso continuos de los indicadores. Independientemente de qué marco de indicadores se acuerde, la experiencia de la 2010 BIP sugiere que una alianza de provisores de datos, incorporando socios tanto existentes como nuevos, será fundamental para el desarrollo de estos indicadores. Por lo tanto, tal y como se concluyó en el taller de Reading de 2009, se debería mantener y financiar adecuadamente un proceso/alianza flexible e inclusivo para el desarrollo de indicadores post-2010 con el fin de incrementar la colaboración para el desarrollo, el control de calidad, la implementación y comunicación de indicadores a todos los niveles, incluyendo el compartir experiencias y la capacitación. 24 BIODIVERSITY INDICATORS & THE 2010 BIODIVERSITY TARGET
26 COMUNICACIÓN DE INDICADORES Sólo los indicadores bien desarrollados pueden proporcionar mensajes claros para su comunicación. Sólo es posible comunicar indicadores desarrollados que produzcan resultados e historias. Por lo tanto, el énfasis se tiene que poner en presentar los indicadores existentes y en asegurar que los indicadores futuros adicionales puedan producir resultados rápidamente. Un conjunto de indicadores bien desarrollado proporcionará un rango de resultados que pueden ser interpretados para generar mensajes claros específicos para las distintas audiencias. Relacionar indicadores de forma lógica ayudará a la comunicación al proporcionar historias coherentes y mensajes claros para varias audiencias. Resultará muy útil modificar y simplificar el marco actual de indicadores para explicar mucho más claramente las relaciones entre los indicadores de las distintas áreas focales. El enfoque de integrar los resultados de los indicadores para contar historias coherentes puede ser también aplicado a distintos temas o materias. Se pueden comunicar los mensajes más importantes que proporcionan una visión coherente del estado de la biodiversidad. Los indicadores de biodiversidad son más fáciles de entender y comunicar cuando se les reúne en un grupo que relaciona políticas y resultados. El fortalecimiento de enlaces entre la Alianza y otros acuerdos ambientales multilaterales y otros sectores aumentaría el uso de indicadores. Se necesitan mayores esfuerzos para demostrar el valor de la 2010 BIP y de los indicadores que esta ha ayudado a desarrollar para otros acuerdos ambientales multilaterales y para otros sectores. Enlaces más claros y fuertes ayudarían a expandir la audiencia de los productos y resultados de la Alianza, creando a su vez sinergias y eficiencias entre acuerdos ambientales multilaterales en lo relacionado a indicadores. En la CITES COP 15, se tomó la decisión de continuar colaborando y apoyando a la 2010 BIP, y decisiones oficiales de este tipo son importantes para mantener los enlaces. La producción de resultados específicos a medida para acuerdos ambientales multilaterales individuales y para distintos sectores podría ser un elemento clave para hacer los indicadores más relevantes para múltiples audiencias. Se necesita un mayor énfasis en la comunicación de indicadores post Los principales objetivos originales de la Alianza se centraron en el desarrollo y la entrega, con menos énfasis en la comunicación. La positiva acogida de los productos 2010 BIP ha dejado claro que la comunicación de los indicadores debería ser uno de los pilares principales de la alianza después del Además de la comunicación liderada por la Secretaría 2010 BIP, el uso más amplio de la maquinaria de comunicación de los socios sería de beneficio mutuo. DESARROLLO DE CAPACIDAD SOBRE INDICADORES Los indicadores de biodiversidad son vitales para una conservación efectiva, para el uso sostenible y para la distribución justa de los recursos de la diversidad biológica. Su papel incluye mejorar el entendimiento de cómo la biodiversidad es parte de la solución a problemas de desarrollo prioritarios como la reducción de la pobreza y el cambio climático. Es necesario desarrollar indicadores de biodiversidad para tratar prioridades nacionales de biodiversidad y desarrollo, incluyendo NBSAPs. A menudo existe poca concienciación o utilización de los indicadores de biodiversidad a todos los niveles (técnico, científico y político). La falta de concienciación sobre indicadores de biodiversidad frecuentemente se debe en parte a un entendimiento limitado del tema biodiversidad en muchos sectores de la sociedad, y puede también deberse a un uso limitado de información científica para la toma de decisiones. Aunque es importante reportar sobre el progreso hacia metas y acuerdos internacionales, la inversión a largo plazo en la producción de indicadores de biodiversidad sólo se puede mantener si se perciben como útiles para satisfacer las prioridades nacionales. Los países se benefi cian de una institución nacional efectiva para coordinar sus indicadores nacionales de biodiversidad. En muchos países en vías de desarrollo, la recogida y comunicación de información sobre biodiversidad se realiza de forma específica y fragmentada, por ejemplo para reportar de forma periódica. Para contar con la capacidad suficiente para tener indicadores de biodiversidad y otra información disponible para la toma efectiva de decisiones, es necesario que haya una institución responsable. El establecimiento de contactos y la colaboración de instituciones gubernamentales, ONGs y otras partes interesadas dentro de los países y regiones, fortalece signifi cativamente el avance en el desarrollo y el uso de indicadores nacionales. La organización de talleres regionales y de colaboraciones de múltiples partes interesadas ha sido una forma muy efectiva de capacitar y un estímulo para crear resultados en los países. El uso de un marco común para guiar el diseño del desarrollo y del aprendizaje de indicadores ha ayudado mucho en el proceso. OUTPUTS, EXPERIENCES AND LESSONS LEARNT FROM THE 2010 BIODIVERSITY INDICATORS PARTNERSHIP 25
27 Los países en vías de desarrollo necesitan asistencia económica y apoyo técnico para desarrollar y usar indicadores de biodiversidad. Sin apoyo económico y técnico adicional, es probable que continúen las razones para la falta de indicadores de biodiversidad en la toma de decisiones por parte de gobiernos y del resto de la sociedad en países en vías de desarrollo. Los socios de la 2010 BIP continuarán buscando formas de apoyar el desarrollo y el uso de indicadores de biodiversidad nacionales y regionales en conjunto con el desarrollo de indicadores globales. Se espera que uno de los mecanismos para conseguir esto sea el desarrollo del Portal Nacional de Indicadores de Biodiversidad ( Éste compartirá el extenso conocimiento y experiencia de la Alianza en el desarrollo de indicadores regionales y nacionales y será el recurso en línea para los países y regiones que deseen desarrollar y usar indicadores de biodiversidad. Además de proporcionar materiales de asesoramiento en línea, el portal permitirá a las naciones compartir sus experiencias y las lecciones aprendidas sobre el desarrollo de indicadores. CONCLUSIÓN Se reconoce la necesidad de una Alianza continua sobre Indicadores de Biodiversidad. SBSTTA 14 también recomendó que la COP 10 Reconozca la necesidad de continuar fortaleciendo nuestra capacidad de vigilancia de la diversidad biológica a todos los niveles, incluso, entre otras cosas, por conducto de lo siguiente: i) Basándose en la labor de la Asociación de indicadores de la diversidad biológica 2010 y continuándola con la entrega de indicadores mundiales para el periodo después de 2010 y (iv) Prestando apoyo a los esfuerzos nacionales y regionales para establecer o fortalecer los sistemas de vigilancia y de presentación de informes sobre la diversidad biológica que permitan a las Partes evaluar el progreso hacia las metas en materia de diversidad biológica establecidas a nivel nacional y/o regional Estas recomendaciones reconocen que el seguimiento de cambios en la diversidad biológica y sus implicaciones requiere el esfuerzo combinado de múltiples actores, trabajando desde las bases locales/nacionales para crear una visión global, y facilitando el reparto de información y experiencias entre las distintas escalas. Una alianza continua expandirá su número de socios y sus esfuerzos para apoyar el desarrollo de capacidad sobre indicadores, para satisfacer las necesidades del nuevo Plan Estratégico del CDB. Está claro que una alianza sobre indicadores, basada en la 2010 BIP y continuando más allá del 2010, para asegurar la coordinación y la continuación del desarrollo de un conjunto coherente de indicadores relevantes, oportunos y robustos de varias fuentes y para varios propósitos, sería bien acogida. En particular, esta Alianza renovada asegurará un grado significativamente mayor de desarrollo de indicadores nacionales y de reporte del progreso basado en indicadores; ampliando consecuentemente la variedad y cobertura de los indicadores globales disponibles y comunicados. 26 BIODIVERSITY INDICATORS & THE 2010 BIODIVERSITY TARGET
 補完的指標セットの開発 強化 実施 および公表において協働してきました このセットには 生物多様性の状況及び傾向 持続的利用 生物多様性に対する脅威 生態系保全と生態系の産物およびサービス 知識 革新 および慣習の状況 資源移転の状況を測定する指標が含まれます 2010 BIP の目的は")

28 エグゼクティブサマリー この報告書は 2010 年生物多様性指標パートナーシップ (2010 BIP) から得たさまざまな体験と教訓をまとめると同時に 生物多様性に関する条約 (CBD) の 2010 年生物多様性目標の支援のもとに開発された 27 の地球規模での指標の詳細をご紹介します このパートナーシップは 2007 年に地球環境ファシリティからの十分な資金により設立され この 3 年間 2006 年の COP 8 で CBD 締結国によって合意された ( 決議 VIII/15) 補完的指標セットの開発 強化 実施 および公表において協働してきました このセットには 生物多様性の状況及び傾向 持続的利用 生物多様性に対する脅威 生態系保全と生態系の産物およびサービス 知識 革新 および慣習の状況 資源移転の状況を測定する指標が含まれます 2010 BIP の目的は 政府による決議が実行され その他の利害関係者に的確に報告され 地球規模レベルでの生物多様性の保護状況を改善することです この点に関しては 次の 3 つの成果の提出により達成されつつあります 意思決定者に対して有益な情報を生成する 2010 年生物多様性指標パートナーシップ 実行に移され 利用可能な改善された指標 地球規模での指標の使用および改善されたものの提供に継続貢献している各国政府および各地域の組織 40 を超える世界中の組織が生物多様性国際年の準備段階における指標開発の強化で協働し 生物多様性の傾向に関する最も包括的 正確 最新の情報を意思決定者が 特に名古屋で開催される CBD COP 10 において利用できるよう努力しています この結果 2010 年に公開された第 3 版地球規模の生物多様性見通しは 以前のものと比較して 大幅に強化され より包括的な根拠基準となりました さらに 2010 BIP は指標開発および使用支援に関して世界中の 45 か国と直接関与 さらには Web サイト と から利用可能な情報とツールを介して間接的に関与しています 2010 BIP は 2010 年生物多様性目標に関してはその目標を達成し 地球規模でのマルチステークホルダパートナーシップの重要性を示しました 2010 年以降の指標開発に向けての重要な教訓も確認されました 2010 BIP から浮かび上がったキーとなるメッセージをこの報告書で取り上げます OUTPUTS, EXPERIENCES AND LESSONS LEARNT FROM THE 2010 BIODIVERSITY INDICATORS PARTNERSHIP 27
29 パートナーシップ 2010 BIP は地球規模の指標傾向の統合評価を提供し 2010 年生物多様性目標に向けての進捗に関する CBD 報告書の基準となりました 主に 2010 BIP は CBD の 2010 年生物多様性目標に関する地球規模での報告と意思決定の改善を目的に設定されました したがって 地球規模での主な対象は CBD の締結国および事務局 ならびにその他の多国間環境協定でした 2010 BIP がその成果を CBD プロセスに報告する最初の大きなチャンスは 2010 年 5 月の SBSTTA 14 会合で発表された CBD 事務局の地球規模での生物多様性見通し第 3 版 (GBO-3) 報告書によるものでした 2010 BIP と CBD 事務局の協力は 指標からの技術情報を主に非技術対象者が利用できるようにするための非常に効果的な方法でした 2010 BIP は 科学者や政策立案者の指標開発および今後のニーズについての認識を強化しました 2010 BIP のパートナーおよび事務局は 2009 年 7 月に事務局の協力により UNEP- WCMC が開催した 2010 年生物多様性および 2010 年以降の指標開発に関する国際的な専門家によるワークショップ で重要な役割を果たしました ワークショップには 政府が任命した専門家や生物多様性条約関連の代表者 国連機関 学術研究機関 政府間および非政府組織から 70 名を超える人が参加し 2010 年生物多様性指標の 利用および有効性が見直しされ 2010 年以降の目標および指標開発の意味合いが検討されました 2010 BIP パートナーも 2010 年までの準備段階での指標開発の評価状況と 地球規模での指標傾向の統合を ジャーナル Science で公開しました これらの活動の上に構築されたパートナーと事務局はどちらも 2011 年に予定されている CBD アドホック技術専門家グループ (AHTEG) に向けて SBSTTA 14 の勧告に従って 条約の下で生物多様性の今後の監視 地球規模での指標の利用に関するさらなる助言を開発するためにうまく設置されています 2010 BIP は国別指標開発に大きく貢献しました アフリカ アジア ラテンアメリカ カリブ海諸国における国レベルでの生物多様性指標の開発 実施 連絡 および効果的な支援活動をサポートするパートナーシップの能力開発努力は あらゆるところで称賛されています 生物多様性サービスおよび生態系サービスの両面で 国レベルの指標開発に対するさらなる要求が世界的に高まっています パートナーシップにより 指標開発に関するガイダンス文書 特定の指標のスケーリング 情報を広く普及させる多言語 Web ポータルなど ワークショップ活動を補完する統合されたリソースセットが開発されました 指標 国別および国際的な計画および目標に対する進捗度を追跡する生物多様性指標の開発および使用が 進行中 です 2010 BIP は 2010 年生物多様性指標の開発 およびその分析 公表 取込 利用に大きく貢献しました CBD 締結国が 新しい目標および指標セットで 2010 年以降の戦略計画を見直しするにつれて 2010 BIP から得た経験と教訓は貴重な洞察力とリソースを提供するものと予想しています 2010 年以降の指標は目標とリンクし 既存の指標の上に構築する必要があります 2010 年以降の指標の選択は CBD が採択する目標によって異なります ただし 進捗を追跡するためにはこれらの目標を測定できるようにして 科学的な能力に応じて適切な指標を開発して提供できるようにする必要があります したがって 目 標および指標の開発は反復プロセスにより連携して最善に実施し 既存の基準の上に構築する必要があります 指標の開発と利用を引き続きサポートする継続的なパートナーシップが必要です 指標に関して合意された枠組みにかかわらず 2010 BIP における経験により データ提供者の継続的なパートナーシップ 既存および新規パートナーの統合が 指標の開発および提供に不可欠であると提言されています 2009 年の Reading ワークショップでは 2010 年以降の指標開発に対する柔軟性があり包括的なプロセス / パートナーシップを維持および適切に提供し 経験の共有および能力開発など 全レベルでの開発 特性管理 実装 およびコミュニケーションにおける協働を拡大する必要があります と決議されました 28 BIODIVERSITY INDICATORS & THE 2010 BIODIVERSITY TARGET
30 指標の公表 十分に開発された指標のみが公表できる明確なメッセージを提供できます 結果と筋書きを提供できる開発された指標のみを公表することができます したがって 既存の指標を提供する際は強調して 将来の追加指標が迅速に成果を出せるようにする必要があります 十分に開発された指標セットは さまざまな対象に固有のメッセージを生成するように解釈できる一連の成果を提供できます 指標を論理的にリンクすると さまざまな対象に一貫した筋書きと明確なメッセージを提供することでコミュニケーションを支援できます さまざまな分野の指標間の関係をより明確に説明する現在の指標枠組みの変更および簡素化が 非常に重要となります 一貫した筋書きにするための指標結果の統合方法は さまざまなテーマまたはトピックに提供することもできます キーとなるメッセージを公表することで 生物多様性の状況に関するよりわかりやすい全体像を得ることができます 生物多様性指標は 方針と成果を結びつけるセット内でリンクされると 容易に理解および公表できます その他の MEA および部門とのパートナーシップの連携を拡張すると 指標に対する理解は高まります 2010 BIP その他の MEA および分野への開発に役立った指標の価値を広めるには大変な努力が必要です より明確な連携関係を確立すると パートナーシップの産品や成果に対する対象を広める上で役立ち MEA 間における指標努力の相乗効果と効率性が得られます CITES COP 15 では 2010 BIP に対する関与とサポートを継続することが決議され そのような正式決議は連携を維持する上で重要です 各 MEA およびさまざまな分野に対する特定の適合した成果をつくりあげることは 複数の対象への指標の関連性を増やす上での重要な要素となります 2010 年以降の指標の公表を重視する必要があります 当初 指標開発とその提供に重点を置いたパートナーシップの主な目的では 公表はそれほど重要視されていませんでした 2010 BIP の成果を積極的に取り込むことで 指標の公表を 2010 年以降のパートナーシップの重要事項の 1 つにする必要があることが明確になりました 2010 BIP 事務局主導の公表と同時に パートナーの通信機械の使用を増やすことが双方にとって有益です 指標能力開発 国内生物多様性指標は 生物多様性資源の効果的な保護 持続的利用 公正な配分にとって不可欠です その役割には 貧困の減少 気候変動などの優先的な開発上の問題に対処する上で生物多様性がどのような位置付けにあるかの理解力のアップが含まれます 生物多様性指標を開発し NBSAP などの国別生物多様性および開発優先度に取り組む必要があります すべてのレベル ( 技術 科学 政策 ) で生物多様性指標に対する認識がほとんどない またはほとんど利用されていないケースが多いです 生物多様性に対する認識の欠如は 社会の多くの分野で生物多様性のトピックに対する理解が限定されている 意思決定に科学ベースの情報の利用が限定されている事による場合が多いです 国際的な目標および合意事項に対する進捗報告は重要ですが 生物多様性指標の作成における長期投資は 国別の優先度を満たす上で有用であると考えられる場合のみ正当化できます 各国は国別生物多様性指標を調整する効果的な国別機関がもたらす利益を享受します 特に 多くの開発途上諸国では 生物多様性情報の収集および公表は 定期報告要件などに対するアドホックおよび断片的ベースに関するものです 効果的な意思決定に使用できる生物多様性指標およびその他の情報を得るには 担当機関がある必要があります 各国および各地域内の政府機関 NGO その他の利害関係者によるネットワークおよび協力により 国内指標開発および利用の進捗が大きく強化されます 地域のワークショップの組織およびマルチステークホルダの協力が 非常に効果的な能力開発の手段であり 各国内の成果を促進するものでした 指標開発のデザインをガイドする共通枠組みの使用と習得が 進捗に大きく貢献しました 開発途上国は 生物多様性指標の開発および使用に際して 財政的および技術的なサポートが必要です 追加の財政的および技術的サポートがない場合は 政府および開発途上国のその他の社会の意思決定における生物多様性指標の欠落に対する理由は残ったままとなりそうです 2010 BIP のパートナーは 地球規模での指標開発と連動して国および地域別生物多様性指標の開発および使用をサポートする方法を継続して模索します これを達成するメカニズムの 1 つが生物多様性国内指標ポータル ( の今後の開発になるものと考えられます これで 地域および国別指標開発におけるパートナーシップの広範な知識と経験を共有でき 生物多様性指標の開発および使用を模索する国および地域のオンラインリソースとなります ポータルはオンラインのガイダンス資料を提供すると同時に 各国は指標開発で得た経験と教訓を共有できます OUTPUTS, EXPERIENCES AND LESSONS LEARNT FROM THE 2010 BIODIVERSITY INDICATORS PARTNERSHIP 29
31 結論 継続した生物多様性指標パートナーシップの必要性が認識されています SBSTTA 14 は COP 10 は すべてのレベルでの生物多様性の監視能力の継続強化 とりわけ (i) 2010 年以降の地球規模での指標提供における 2010 年生物多様性の能力開発および継続作業 および (iv) 生物多様性監視システムおよび報告システムを設定または強化する国および地域の努力をサポートし 締結国が国または地域レベルで設定された生物多様性目標に対する進捗を評価できるようにする必要性を認識している とも勧告しました これらの勧告には 地球規模での生物多様性の変化およびそれが意味することを追跡するには 複数の利害関係者の協力 地球規模での全体像を作成するための地域 / 国基盤からの作成 各スケール間での情報および経験の共有の促進が必要であるとの認識が反映されています 新しい CBD 戦略計画のニーズを満たすために 継続中のパートナーシップはメンバーシップと指標能力開発をサポートする努力を続けます 2010 BIP に発足し 2010 年以降も継続される指標パートナーシップにより 複数のソースからの関連する タイムリーで 頑強な指標の一貫したセットの調整および追加開発が確保され 多くの目的に広範に受け入れられていることは明確です 特に この新たに更新されたパートナーシップにより 国別指標開発 指標ベースの進捗報告のレベルが大幅に上昇し 結果的に使用でき 公表される地球規模での指標の幅と範囲が改善されます 30 BIODIVERSITY INDICATORS & THE 2010 BIODIVERSITY TARGET
32 OUTPUTS, EXPERIENCES AND LESSONS LEARNT FROM THE 2010 BIODIVERSITY INDICATORS PARTNERSHIP 31
33 32 BIODIVERSITY INDICATORS & THE 2010 BIODIVERSITY TARGET
34 OUTPUTS, EXPERIENCES AND LESSONS LEARNT FROM THE 2010 BIODIVERSITY INDICATORS PARTNERSHIP 33


35 34 BIODIVERSITY INDICATORS & THE 2010 BIODIVERSITY TARGET


 global headline indicators, many of which have been developed with direct support from")


36 1. INTRODUCTION PURPOSE AND STRUCTURE OF THIS REPORT This report presents the results of the 2010 Biodiversity Indicators Partnership (2010 BIP) up to August As well as informing the international community in general it is hoped that the report will be a contribution to the considerations of the CBD Parties during 2010 and subsequently regarding biodiversity indicators and the revised CBD Strategic Plan. As well as presenting the results from the 2010 BIP the report includes key messages and considerations of ways forward for the development of biodiversity indicators at the global, regional and national scales. The report is structured to start with an explanation of the background to the 2010 BIP, a description of the Partnership and some lessons learnt from establishing a collaboration of over 40 agencies working internationally. This is followed by a summary of the current status and results of the Convention on Biological Diversity (CBD) global headline indicators, many of which have been developed with direct support from the 2010 BIP; and a section on their interpretation as a suite. Subsequent sections cover the Partnership s support to national indicator developers and to a range of international environment agreements; the numerous Partnership outreach activities and are complemented by a section on the Partnership s communication products and engagement with international meetings. The report concludes with an outlook for the future, together with a comprehensive Annex which describes the methodologies for the global indicators produced to date, as a resource for their continued development. BACKGROUND TO THE 2010 BIP The 2010 BIP was established to track progress at the global level in achieving the CBD 2010 Biodiversity Target. This target was adopted at the sixth Conference of the Parties (COP) of the CBD in April 2002 in decision VI/26 and its full definition is, to achieve by 2010 a significant reduction of the current rate of biodiversity loss at the global, regional and national level as a contribution to poverty alleviation and to the benefit of all life on Earth. Two years later at the seventh CBD COP in Kuala Lumpur, in decision VII/30, the COP adopted a framework of global indicators to facilitate the assessment of progress towards achieving the 2010 Biodiversity Target and communication of this assessment, to promote coherence among the programmes of work of the Convention and to provide a flexible framework within which national and regional targets may be set, and indicators identified. The framework was further refined in CBD decision VIII/15, and includes seven focal areas and 22 global headline indicators for assessing progress toward the 2010 Target, and communicating related key messages (Table 1). One of the challenges identified at CBD COP 7 in 2004 for using the CBD global indicators for reporting on the 2010 Biodiversity Target was that the existing indicators are developed and reported by a range of organisations, and there was no single mechanism for coordinating input to the CBD or identifying the key messages from the indicators as a suite. Another challenge was that the global indicators identified were at different stages of development and implementation. In some cases the indicators needed little additional work to develop and use them, in other cases there was significant work required to develop the indicator methodology and/or the underlying datasets. The 2010 BIP came into being when the CBD, in its decision VII/30, invited the UNEP World Conservation Monitoring Centre (UNEP-WCMC) to support the Convention Secretariat in facilitating the compilation of information necessary for measuring achievements on the 2010 Target. The 2010 BIP was designed to address these challenges and held its first meeting in 2005, with the support of a GEF OUTPUTS, EXPERIENCES AND LESSONS LEARNT FROM THE 2010 BIODIVERSITY INDICATORS PARTNERSHIP 35
37 Project Development Facility Block B (PDF-B) grant. In June 2007 a GEF Full-sized Project for the 2010 BIP was approved to deliver the three outcomes of: 1. A 2010 Biodiversity Indicators Partnership generating information useful to decision-makers; 2. Improved global indicators are implemented and available; 3. National governments and regional organizations using and contributing to the improved delivery of global indicators. The 2010 BIP brings together a host of international organizations working on indicator development, to provide the best available information on biodiversity trends to the global community and assess progress towards the 2010 Target. Table 1: Provisional indicators for assessing progress towards the 2010 Biodiversity Target as presented in CBD decision VIII/15 (2006). Indicators considered in 2006 as ready for immediate testing and use are shown in blue, those requiring further development and taken forward are shown in yellow, and those not progressed are shown in red. Focal Area Status and trends of the components of biological diversity Sustainable use Threats to biodiversity Ecosystem integrity and ecosystem goods and services Status of traditional knowledge, innovations and practices Status of access and benefit-sharing Status of resource transfers Headline indicator 1. Trends in extent of selected biomes, ecosystems, and habitats 2. Trends in abundance and distribution of selected species 3. Coverage of protected areas 4. Change in status of threatened species 5. Trends in genetic diversity of domesticated animals, cultivated plants, and fi sh species of major socioeconomic importance 6. Area of forest, agricultural and aquaculture ecosystems under sustainable management 7. Proportion of products derived from sustainable sources 8. Ecological footprint and related concepts 9. Nitrogen deposition 10. Trends in invasive alien species 11. Marine Trophic Index 12. Water quality of freshwater ecosystems 13. Trophic integrity of other ecosystems 14. Connectivity / fragmentation of ecosystems 15. Incidence of human-induced ecosystem failure 16. Health and well-being of communities who depend directly on local ecosystem goods and services 17. Biodiversity for food and medicine 18. Status and trends of linguistic diversity and numbers of speakers of indigenous languages 19. Other indicators of the status of indigenous and traditional knowledge 20. Indicator of access and benefi t-sharing 21. Offi cial development assistance provided in support of the Convention 22. Indicator of technology transfer 36 BIODIVERSITY INDICATORS & THE 2010 BIODIVERSITY TARGET
38 PURPOSE AND ORGANISATION OF THE 2010 BIP Purpose of the 2010 BIP The overall objective of the 2010 Biodiversity Indicators Partnership is that decisions made by governments and other stakeholders are better informed to improve the conservation and sustainable use of biodiversity at a global scale. More specifically, the focus of the Partnership, and the GEF project which is its principal funding source, is to track progress at the global scale in achieving the CBD 2010 Biodiversity Target. The central role of the 2010 BIP can therefore be summarised as the generation and communication of information. This information has principally been in the form of indicators for assessing progress towards the CBD 2010 Target, together with targeted syntheses and analyses using the indicators. Two of the three measurable outcomes of the GEF project for the 2010 BIP are (i) generating information useful to decision-makers and (ii) an improved suite of global indicators is implemented and available. At the global scale the principal decision-makers or users of the 2010 BIP products have been the Parties and Secretariat of the CBD. The 2010 BIP has also collaborated with other multilateral environmental agreements such as the Ramsar Convention on Wetlands, CMS and CITES. The communications strategy of the 2010 BIP has aimed to disseminate information on the global biodiversity indicators and the Partnership more widely, particularly through its multilingual website. A central reason for establishing the 2010 BIP has been to provide a mechanism for coordination of the development and reporting of the full suite of global biodiversity indicators selected by the CBD for the 2010 Biodiversity Target. The indicator development has principally been achieved through the provision of funding to institutions with expertise in the subjects requiring new indicators, as well as facilitating technical exchange at meetings of the 2010 BIP Partners. The coordination role has also been essential in bringing together the indicator lead agencies for reporting on the indicators and their analysis as a suite. The third outcome of the GEF project for the 2010 BIP is to support increased linkages and development of biodiversity indicators at the national, regional and global scales, with an emphasis on capacity building. The activities and lessons learnt from this work are described in Section 5 of this report. Organization of the 2010 BIP Figure BIP organizational structure. USERS MEAs Corporate Sector Nations Scientific Peer Review CBD BIP SECRETARIAT Steering Committee Key Indicator Partners Scientific Advisory Body 2010 BIP Associate Indicator Partners National/Regional Partners Affiliate Indicator Partners Funding and Cofinance OUTPUTS, EXPERIENCES AND LESSONS LEARNT FROM THE 2010 BIODIVERSITY INDICATORS PARTNERSHIP 37
39 The organizational structure of the 2010 BIP is summarised in Figure 1. There are 18 Key Indicator Partners who lead the development and implementation of one or more global indicators and receive funding through the 2010 BIP project from the GEF. There are 13 Associate Indicator Partners who assist in the development and implementation of the CBD suite of global biodiversity indicators and provide technical support to the Partnership. The 2010 BIP also has 19 Affiliate Partners who are developing indicators in line with the CBD framework, but at the regional or national level. Profiles of the Partners can be found in Annex 2 of this report and in the Partners section of the 2010 BIP website. The primary donor for the 2010 BIP is the GEF as well as the European Commission, and UNEP is the Implementing Agency for the GEF. The 2010 BIP Secretariat and GEF Project Coordination Unit (PCU) is provided by UNEP-WCMC (the Executing Agency), whose roles include: Coordinating the activities of the Partnership; The 2010 BIP Steering Committee advises on the direction of the 2010 BIP and reviews its key outputs. Its nine members comprise individuals and representatives of organizations with a major interest in biodiversity indicators and the Partnership, including the GEF, UNEP and the CBD Secretariat. The SAB has ten members and was originally conceived to provide technical oversight to the development of new indicators and analyses by the 2010 BIP. During the evolution of the Partnership, the role of the SAB changed as some indicator developers perceived the SAB as a peer review body that would duplicate their own institutional peer review processes. The SAB has therefore not reviewed indicators themselves. The publication of indicator methods and results in international peer-reviewed literature has served part of the role envisaged for the SAB, whose primary role has become to advise and support the preparation of this report. Acting as the 2010 BIP focal point for the Partners and public enquiries; Developing and manage project work plans, budgets and reporting; Organizing meetings of the Partners and the Steering Committee; Drawing up contracts with Partners and ensure Partners are supported; Communicating the 2010 BIP s results to the public; Providing leadership in the production and communication of integrated analyses from the indicators; Producing guidance materials and capacity building workshops with regional and national indicator development organisations. 38 BIODIVERSITY INDICATORS & THE 2010 BIODIVERSITY TARGET

.")


40 2. THE INDICATORS SCOPE AND COVERAGE OF THE INDICATORS Since CBD COP decision VIII/15 and the establishment of the 2010 BIP, progress has been made in developing the global biodiversity indicators. Of those considered ready for testing and use in 2006, all have developed further in terms of data coverage and updating. Of the nine headline indicators that were identified as needing further development, four have received substantial attention (Proportion of products derived from sustainable sources; Ecological footprint and related concepts; Health and well-being of communities who depend directly on local ecosystem goods and services; and Biodiversity for food and medicine). Within the 17 CBD headline indicators under development, 34 specific metrics 1 are now being developed (see Table 2 and Figure 3). The data sourced and used for testing the indicators came from a range of countries, which are not universally biodiversity-rich or indeed data-rich. Any indicator developed has to be simple if it is to be widely used, and it can only be as good as the data on which it is based. Figures 2 and 3 are summaries of the spatial and temporal spread of the data used for the CBD global indicators. A detailed presentation of the metadata, methodologies, results and storylines for each individual indicator developed and reported under the CBD global indicators is presented in Annex 1. Table 2. Progress in the development of the CBD 2010 global indicators from 2006 to fully developed with established methodologies and global time-series data, under development, not being developed. Dots indicate multiple metrics under each headline Status and trends of the components of biodiversity Trends in extent of selected biomes, ecosystems and habitats Trends in abundance and distribution of selected species Coverage of protected areas Change in status of threatened species Trends in genetic diversity Sustainable use Area under sustainable management Proportion of products derived from sustainable sources Ecological footprint and related concepts Threats to biodiversity Nitrogen deposition Trends in invasive alien species Footnote 1 While the use of the terms measures, metrics and indicators can be interchangeable, this document defi nes them as: Measure: a value that is quantifi ed against a standard at a point in time; Metric: a set of measurements; Indicator: metrics presented in a meaningful way, usually by adding context. OUTPUTS, EXPERIENCES AND LESSONS LEARNT FROM THE 2010 BIODIVERSITY INDICATORS PARTNERSHIP 39
41 Ecosystem integrity and ecosystem goods and services Marine Trophic Index Water quality of freshwater ecosystems Trophic integrity of other ecosystems Connectivity / fragmentation of ecosystems Incidence of human-induced ecosystem failure Health and well-being of communities Biodiversity for food and medicine Status of knowledge, innovations and practices Status and trends of linguistic diversity Indicator of status of indigenous & traditional knowledge Status of access and benefit-sharing Status of access and benefit-sharing Status of resource transfers Official Development Assistance provided in support of the Convention Indicator of technology transfer Figure 2. Representation of regions within the data used to calculate the CBD global indicators. Data shown represents 20 out of the 27 indicators. Data for two indicators (2.1.2 Area of forest under sustainable management: degradation and deforestation and Forest fragmentation) are not yet available. Indicator totals are generated for each region. Indicators are counted if global indicators are generated with data from one or more countries within that region. Regions are assigned using UN World Macro Regions and Components definitions: Oceania Latin America Africa Asia Europe Polynesia Micronesia Melanesia Australia and New Zealand Northern America. South America Central America Caribbean Western Europe Southern Europe Northern Europe Eastern Europe Western Asia South-eastern Asia South-central Asia Eastern Asia Antarctica Western Africa Southern Africa Northern Africa Middle Africa Eastern Africa Number of global CBD Indicators Components of biodiversity Sustainable Use Threats to biodiversity Ecosystem Integrity Traditional Knowledge Access and benefit-sharing Resource Transfers 40 BIODIVERSITY INDICATORS & THE 2010 BIODIVERSITY TARGET
42 Figure 3. Time span of data used to calculate the CBD global indicators. Data for indicators Area of forest under sustainable management: degradation and deforestation and Forest fragmentation are not yet available Extent of forests & forest types Extent of marine habitats Living Planet Index Global Wild Bird Indicator Coverage of protected areas Protected area overlays with biodiversity Management effectiveness of protected areas IUCN Red List Index Ex-situ crop collections Genetic diversity of terrestrial domesticated animals Area of forest under sustainable management: Certification Area of agricultural ecosystems under sustainable management Status of species in trade Wild Commodities Index Ecological Footprint Nitrogen deposition Trends in invasive alien species Marine Trophic Index Water Quality Index for Biodiversity River fragmentation & flow regulation Health and well-being of communities directly dependant on ecosystem goods & services Nutrition indicators for biodiversity Biodiversity for food & medicine Status and trends of linguistic diversity & numbers of speakers of indigenous languages Official Development Assistance provided in support of the Convention on Biological Diversity REVIEW OF THE INDICATOR FRAMEWORK AND INDICATOR DEVELOPMENT In July 2009, the Secretariat of the CBD and UNEP- WCMC jointly convened a meeting to review the use and effectiveness of the 2010 biodiversity indicators and to consider the implications for the development of post-2010 targets and indicators (UNEP-WCMC, 2009a). The workshop, hosted by the UK Department for Environment, Food and Rural Affairs (Defra) in Reading, UK, brought together 75 participants including government-nominated experts and representatives of biodiversity-related conventions, UN agencies, academic and research institutions and other relevant international, inter-governmental and non-governmental organizations. This section and the following section presents some of the findings from that meeting (multilingual summaries of the findings of the meeting, and the full meeting report in English, can be downloaded from The meeting report is also available as document UNEP/ CBD/SBSTTA/14/INF/14). Regarding the logic and content of the CBD indicator framework, the Reading meeting concluded that: a. The flexibility of the framework, which enables its implementation at a variety of scales, has facilitated its political adoption, which, in turn, has boosted support for developing the detail of the indicators under the framework. b. The framework is comprehensive, and can be mapped to other frameworks (such as DPSIR), but there have been problems showing how it fits together to integrate the indicators into a coherent story. c. The framework is primarily structured around CBD priorities, but its relevance to other sectors / MEA processes is less clear, thereby hindering its uptake and use, beyond the CBD. OUTPUTS, EXPERIENCES AND LESSONS LEARNT FROM THE 2010 BIODIVERSITY INDICATORS PARTNERSHIP 41
43 d. The parallel development of the CBD targets and goals, and the indicator framework, has led to a disconnect which was not intended. e. The current indicator set is incomplete in a number of areas relevant to the CBD; e.g., wild genetic resources, ecosystem quality, ecosystem services, sustainable use, human well-being, ABS and indigenous local knowledge, and both threats and responses more broadly. It also identified a number of ongoing challenges to the delivery of the full suite of indicators and the tracking of progress against the 2010 Biodiversity Target: a. Five headline indicators are not receiving any attention under the 2010 BIP (Trophic integrity of other ecosystems; Incidence of human-induced ecosystem failure; Other indicators of the status of indigenous and traditional knowledge; Indicator of access and benefit-sharing, and; Indicator of technology transfer). One of the seven focal areas (Status of access and benefit-sharing) has no indicators under development. b. Many of the indicators have patchy coverage, either geographically or in terms of content. For example, the data within relatively well-developed species indicators tend to be biased towards certain taxonomic groups. Likewise comprehensive global data on the extent of very few ecosystems other than forests is available. c. For indicators compiled from sub-global (often national) datasets, data consistency across different sources can be an issue. d. Due in part to time and resource constraints, most of the indicators being developed within the 2010 framework are being compiled from existing datasets which may not have been collected or compiled for tracking biodiversity change, and which are therefore imperfect proxies. e. Current indicators lack reference values and other ways of quantifying the significance of changes. One of the issues is that the 2010 biodiversity target is rather loosely defined, without a clear baseline or success criteria - it is not a SMART (strategic, measurable, achievable, realistic and time-bound) target, but rather an aspirational goal. The current suite of global biodiversity indicators are not all designed for directly measuring progress towards this target, but it would in any case be difficult to design indicators without a more tightly framed target or sub-targets. f. At the time of the workshop, few of the global indicators had been subjected to independent and transparent peer review. There is no clear process or criteria for evaluating scientific rigour for those indicators that are not published in peer-reviewed literature. In the 12 months since the Reading workshop, the 2010 BIP Partners and Secretariat have taken significant steps to develop the indicators, improve the transparency of the indicators and the availability of methodologies and metadata for independent scrutiny (see net and Annex 1 of this report). This compendium forms part of that effort, as was the publication of the indicators and their methodologies in the peer-reviewed journal Science (Butchart et al. 2010a). As a result of these efforts the indicator set is more complete than it was a year ago (see Table 2), and it has been possible to report findings from the majority of indicators in GBO-3. Nevertheless many of the technical issues and challenges identified in the current indicator framework remain relevant for future indicator work: a. The representativeness and adequacy of the data underlying the indicators needs to be transparently documented, and their geographic / taxonomic / temporal coverage needs to be improved. b. Methods for assessing the significance of change, and distance to target, need to be developed, including the setting of a baseline. c. A clear process or criteria for evaluating the scientific rigour of the indicators needs to be established and implemented. d. Linkages between global/regional/national/local indicators need to be better considered. 42 BIODIVERSITY INDICATORS & THE 2010 BIODIVERSITY TARGET
44 THE WAY FORWARD: BIODIVERSITY INDICATORS BEYOND 2010 The development and use of biodiversity indicators for tracking progress against national and international plans and targets is work in progress. The 2010 BIP has made major contributions to the development of the 2010 biodiversity indicators, as well as their analysis, communication, uptake and use. As the parties to the CBD consider a revised, post-2010 strategic plan, with a new set of targets and indicators, we envisage the experience and lessons from the 2010 BIP providing a valuable insight and resource. Post-2010 indicators should be linked to the targets and build on existing indicators. The choice of indicators for the post-2010 period will depend on the target(s) adopted by the CBD. However in order for progress to be tracked these targets must be measurable, which in turn depends on scientific capability to develop and deliver appropriate indicators. Thus, the development of targets and indicators is best undertaken in tandem through an iterative process, and building upon existing baselines. Prior to the development of draft post-2010 targets, the Reading workshop concluded that: a. A small set of (10-15) broad headline indicators, clearly linked to the main target and sub-targets and underscored by more specific sub-indicators/ measures, should be maintained/developed, in order to communicate the indicator set through key storylines and clear, policy relevant messages, while maintaining a flexible framework to cater for national/ regional needs. b. The current framework of global indicators should be modified and simplified into four focal areas : Threats to Biodiversity; State of Biodiversity; Ecosystem services; and Policy Responses. Existing indicators should be re-aligned with the new framework, as appropriate, in order to maintain continuity and enhance their use. The relationships between the focal areas and between indicators and targets should be clearly explained and documented, including their scientific basis and assumptions. c. Some additional measures on threats to biodiversity, status of diversity, ecosystem extent and condition, ecosystem services and policy responses should be developed in order to provide a more complete and flexible set of indicators to monitor progress towards a post-2010 target and to clearly link actions and biodiversity outcomes to benefits for people. Echoing these conclusions, a Science Policy Forum article authored by members of the 2010 BIP concluded that: Continued investment must be made in the existing indicators to improve taxonomic, geographic, and temporal coverage, alongside support to develop measures at the finer (genetic) and broader (ecosystem) scales. Indicators of the biodiversity impacts of a wider range of threats, including climate change, should be incorporated. Critically, indicators must be developed to fill a major gap regarding the effect of biodiversity change on the provision of ecosystem services. A balance must be found between developing too large and confusing an array of individual measures versus relying on a few aggregate indices that appear compelling but that mask complexity and can be misinterpreted. Quality control efforts are needed to ensure that indicators are sufficiently scientifically rigorous, free of bias, and sensitive enough to detect meaningful change (Walpole et al. 2009). Since these conclusions were reached, significant progress has been made to develop a set of 20 draft targets, which it is expected will be agreed in some form as part of the new CBD strategic plan during COP 10 (UNEP/CBD/COP/10/4). These draft targets have been formulated and grouped logically in a way that mirrors the recommendations on indicators from the Reading workshop. Formal consideration of indicators for each target is likely to fall to an Ad Hoc Technical Expert Group (AHTEG) which, if approved by COP 10 is envisaged to be formed in early In the interim the 2010 BIP Partners have considered how the existing indicators map on to the proposed new targets, and where gaps might easily be filled. There is consensus that there are targets for which the current indicator suite is insufficient (e.g., awareness and value of biodiversity, level of economic subsidies, climate change, access and benefit-sharing of genetic resources, and both modern and traditional knowledge systems). However, the majority can be measured to some degree by existing indicators, while the need for additional new indicators to supplement the narrative was recognized. Table 3 is a summary of their findings. An ongoing Partnership to support continued development and use of indicators is necessary. Whatever framework of indicators is agreed, the experience of the 2010 BIP suggests that an ongoing Partnership of data providers, incorporating both existing and new Partners, will be fundamental to their development and delivery. Thus, as concluded at the 2009 Reading workshop, a flexible and inclusive process/partnership for post indicator development should be maintained and adequately resourced in order to increase collaboration in the development, quality control, implementation and communication of indicators at all levels, including the sharing of experience and the building of capacity. OUTPUTS, EXPERIENCES AND LESSONS LEARNT FROM THE 2010 BIODIVERSITY INDICATORS PARTNERSHIP 43
45 Table 3. Synopsis of 2010 BIP Partner discussions on potential themes for targets in the draft CBD Strategic Plan [Based on UNEP/CBD/COP/10/9]. Potential themes for targets Existing CBD global indicators Possible new indicators Proposed strategic goal A: Address the underlying causes of biodiversity loss by mainstreaming biodiversity across government and society 1: Greater awareness among people of the values of biodiversity and the steps they can take to conserve and use it. 2: Integration of the values of biodiversity into national accounts, local development and poverty reduction strategies and planning processes. 3: Elimination, phasing out or reform of incentives harmful to biodiversity, and promotion of positive incentives to conserve and use it sustainably. 4: Achievement of sustainable production and consumption, and keeping the impacts of natural resource use within safe ecological limits. None None None Living Planet Index (utilized species, food & medicine) Red List Index and Sampled Red List Index (specifi c cuts) Ex-situ crop collections Genetic diversity of terrestrial domesticated animals Area of forest under sustainable management: certifi cation Area of agricultural ecosystems under sustainable management Proportion of fi sh stocks in safe biological limits Ecological Footprint Marine Trophic Index. Polls of awareness, values. Number of visitors to parks, museums. Proposed strategic goal B: Reduce the direct pressures on biodiversity and promote sustainable use 5: Reducing the rate of loss, degradation and fragmentation of natural habitats. 6: Reducing or eliminating overfi shing and destructive fi shing practices. 7: Sustainably managing agriculture, aquaculture and forestry Extent of marine habitats Extent of forest biomes Wild Bird Index (cut by habitat type) Marine Trophic Index Water Quality Index River fragmentation and fl ow regulation Proportion of fi sh stocks in safe biological limits Wild Commodities Index Marine Trophic Index Biodiversity for food and medicine Extent of forest biomes Area of forest under sustainable management: certifi cation Area of forest under sustainable management: degradation and deforestation Area of agricultural ecosystems under sustainable management Forest fragmentation. Degree to which policy integrates biodiversity. Degree to which EIAs and SIAs are implemented. Positive AES or similar on area or uptake. Negative measures of perverse subsidies. Proportion of total resource base sustainably managed. Trends in extent of key habitats (grasslands, wetlands, polar). Terrestrial habitat fragmentation. Habitat quality. Trophic integrity (terrestrial & inland waters). Red List Index (fi sh cut). Certifi ed fi sheries (e.g., Marine Stewardship Council). Status of key bycatch species (e.g., cuts of the Red List Index & Living Planet Index). FAO stock assessments to ascertain sustainability. Aquaculture. 44 BIODIVERSITY INDICATORS & THE 2010 BIODIVERSITY TARGET
46 Potential themes for targets Existing CBD global indicators Possible new indicators 8: Reducing or eliminating the impact of pollution, including from excess nutrients, on ecosystem function and biodiversity. 9: Identifying, controlling or eradicating invasive alien species and introducing measures to control pathways for their introduction and establishment. 10: Minimizing the multiple pressures on coral reefs, and other vulnerable ecosystems impacted by climate change or ocean acidifi cation, so as to maintain their integrity and functioning Living Planet Index Red List Index and Sampled Red List Index (cuts for pollution drivers) Nitrogen deposition Water quality index Red List Index and Sampled Red List Index (impacts of invasive species) Trends in Invasive Alien Species (species distribution & policies) Extent of marine habitats Living Planet Index (cut for climate-affected species) Global Wild Bird Index (Climatic Impact Indicator) Coverage of Protected Areas (marine PAs) Red List Index and Sampled Red List Index (cut for corals). Phosphates & other pollutants. Trends/extent of dead zones (river miles) impaired due to pollution (e.g., South Africa River Health Index). National management / action plans. Number of species successfully eradicated or prevented. Extent & change of other vulnerable ecosystems. Fish catch from coral reefs. Proposed strategic goal C: To improve the status of biodiversity by safeguarding ecosystems, species and genetic diversity 11: Increasing coverage and effectiveness of protected areas. 12: Preventing the decline of threatened species, and improving their conservation status. 13: Safeguarding genetic diversity in agricultural and natural systems Coverage of Protected Areas Overlays with biodiversity (Protected Area coverage of IBAs and AZEs) Management effectiveness of protected areas Forest fragmentation River fragmentation and fl ow regulation Living Planet Index Red List Index and Sampled Red List Index Ex-situ crop collections Genetic diversity of terrestrial domesticated animals Status of species in trade Wild Commodities Index Biodiversity for food & medicine. Proposed strategic goal D: Enhance the benefits to all from biodiversity and ecosystem services 14: Safeguarding and restoring ecosystems that provide essential services. 15: Enhancing ecosystem resilience, contributing to climate change adaptation. 16: Equitably sharing the benefi ts arising from access to genetic resources Trends in forest biomes Trends in marine habitats Coverage of Protected Areas Forest fragmentation River fragmentation and fl ow regulation Health & well-being of communities directly dependent on ecosystem goods & services Biodiversity for food & medicine Coverage of Protected Areas Forest fragmentation. None National Red List Indexes compared to global trends. Disaggregations of Living Planet Index & Red List Index for wild relatives. Legal frameworks to safeguard wild relatives. Access & Benefi t-sharing. Ecosystem service indicators and mapping. More WHO-based indicators. Ecosystem restoration. Trends in carbon sequestration and storage across ecosystem types. Ecosystem degradation / restoration. Number of ABS legal instruments implemented at national level. Indicator on effectiveness of ABS policies. OUTPUTS, EXPERIENCES AND LESSONS LEARNT FROM THE 2010 BIODIVERSITY INDICATORS PARTNERSHIP 45
47 Potential themes for targets Existing CBD global indicators Possible new indicators Proposed strategic goal E: Enhance implementation through participatory planning, knowledge management and capacity building 17: Ensuring that all countries have developed national biodiversity strategies and action plans that are participatory and up-to-date. 18: Putting in place systems that respect traditional knowledge, and the contribution of indigenous communities to conservation and sustainable use. 19: Improving and sharing widely knowledge and the science base relating to biodiversity. 20: Capacity for implementing the Convention has increased. None Status and trends of linguistic diversity and numbers of speakers of indigenous languages. None Offi cial development assistance provided in support of the Convention. CHM existing at national level to document and monitor NBSAPs. Legal instrument implemented that relate to NBSAPs. Number & typology of stakeholders involved in revising NBSAPs. Traditional occupations. Land use change and land tenure. Types of protection measures in place. Increase in rate of biodiversity-related keywords in scientifi c articles. Capacity building programmes to improve, share, transfer and apply knowledge and technologies. Changes in university curricula. 46 BIODIVERSITY INDICATORS & THE 2010 BIODIVERSITY TARGET


, in particular at relevant meetings (see")
48 3. INDICATOR INPUT TO OTHER MULTILATERAL ENVIRONMENTAL AGREEMENTS AND ENVIRONMENTAL GOVERNANCE PROCESSES MEAs and other international processes are increasingly using a range of indicators to monitor their effectiveness, in many cases directly linked to the aims, objectives and targets set out in strategic plans. As a result there is a broad range of indicators either in current use or in development, some of the indicators being generally applicable, and others being specific to the needs of particular agreements or processes. In reality many of the indicators, and in particular the outcome-oriented indicators (as opposed to those associated with process), are relevant beyond each specific MEA or process. Most of the CBD indicators currently being developed within the 2010 BIP, for example, draw on work that has been ongoing for a number of years on the status and trends of biodiversity, and therefore allow for use by other biodiversity-related MEAs and wider societal sectors. As already described, the 2010 BIP has contributed in a number of ways to the Convention including major contribution to the production of the third edition of the Global Biodiversity Outlook (SCBD 2010), input into the development on the draft CBD Strategic Plan, and spearheading discussions on the current and post-2010 indicators framework. SUPPORT TO MEAS BEYOND CBD: UNCCD, CMS, RAMSAR, CITES The 2010 BIP Secretariat and Partners have engaged with six multilateral environmental agreements (MEAs), in particular at relevant meetings (see Annex 4 for event summaries). Listed are the indicator initiatives of the biodiversity-related MEAs with which the 2010 BIP has engaged: Ramsar Convention on Wetlands The Ramsar Convention adopted a set of eight outcome-oriented indicators (with 11 measures) to monitor effectiveness of the implementation of the Convention. Methodological development for the Ramsar indicators varies. Some will be based on national reporting, others will use different sources. Workshops and focus groups are being carried out with scientific experts and agencies to further this development, however in some cases gaps will remain due to a lack of time and resources to access available data. The Ramsar indicators and sub-indicators have substantial overlap with the CBD indicators. Institutionally there is also close engagement between CBD and Ramsar indicator processes. Through participation in expert group meetings, members of the Scientific and Technical Review Panel (STRP) and Ramsar Secretariat have contributed to the development of the CBD indicators, whilst the Ramsar Indicators are being developed with input from UNEP-WCMC and the 2010 BIP. Convention on Migratory Species (CMS) The CMS strategic plan includes 31 indicators under four objectives. Besides process indicators relating to the OUTPUTS, EXPERIENCES AND LESSONS LEARNT FROM THE 2010 BIODIVERSITY INDICATORS PARTNERSHIP 47
49 implementation of the CMS strategy, the CMS indicator framework includes a number of impact indicators relating to the status and trends in, threats to, and level of protection of, migratory species. Development of migratory species indicators was recognized at CMS COP 8 (2005) as an appropriate step towards an assessment of the contribution of the Convention in the achievement of the 2010 target. In this regard the CMS Secretariat is working closely with the CBD Secretariat and the 2010 BIP in order to adopt indicators that contribute to measuring the achievement of the 2010 Target. Within this process, progress has been recently made in exploring the suitability of two existing 2010 BIP indices, Red List Index and the Living Planet Index. Convention on International Trade in Endangered Species of Wild Fauna and Flora (CITES) CITES has a Strategic Vision , that includes 40 indicators under 16 Objectives. These indicators are primarily process-based, with some relating directly to status or trends in biodiversity. Despite the general view that indicators should be outcome-focused, it has proved difficult to reach collective agreement on what they should be. The CITES Secretariat is a partner member of the 2010 BIP and is collaborating on an indicator of the status of species in trade, as a contribution to assessing progress towards the CBD 2010 target. A number of the indicators (1.4.1, 1.4.2, 1.5.1, 1.5.3, and 3.4.1) are directly or indirectly related to status and trends in biodiversity. Although CITES gathers and holds a significant amount of population status and other information in documentation related to amendment proposals, the Review of Significant Trade and certain special reports, these data have to date not been easily searchable. A new online tool being developed with UNEP-WCMC will make the Review of Significant Trade information easier to access and search. CITES needs to partner with other organizations in order to obtain the population status and distribution information that it does not regularly collect through its annual, biennial or special reports. United Nations Convention to Combat Desertification (UNCCD) UNCCD is beginning to consider how to better incorporate biodiversity into its areas of work, including the development of indicators. At the latest UNCCD Conference of Parties in September 2009, Parties considered indicators and reporting and agreed a set of performance and impact indicators. Both the SCBD and the 2010 BIP participated in the COP, and a GEF-supported project on implementing performance indicators is underway. Incorporation of impact indicators, including reference to sustainable management, into reporting processes is currently being planned. SUPPORT TO OTHER PROCESSES Millennium Development Goals (MDGs) The MDGs are a set of eight goals, with associated timebound targets, adopted by nations in order to reduce poverty in all its forms. Goal 7, to ensure environmental sustainability, incorporates four targets including the 2010 Biodiversity Target. Four of the biodiversity indicators within the 2010 BIP (Extent of forests and forest types, Red List Index, Coverage of Protected areas, Proportion of fish stocks in safe biological limits) are included as MDG indicators under Goal 7, and the relevant 2010 BIP Partners are expected to report annually to the UN Statistical Division. The UN Statistical Division maintains a database of MDG indicator data that is disaggregated by region and country, and by year. One of the major challenges is rationalising national data (from national reporting) with global data from the international agencies. There are ongoing efforts to achieve this, also involving 2010 BIP Partners. Streamlining European 2010 Biodiversity Indicators (SEBI2010) Both the European Union and pan-european processes have adopted the target of halting the loss of biodiversity by SEBI2010 is a pan-european initiative led by the European Environment Agency (EEA) to ensure the development and uptake of a common set of biodiversity indicators to track progress towards this target. SEBI2010 has 26 indicators under seven of the CBD focal areas, and not unsurprisingly there is considerable overlap with the content of the global biodiversity indicator framework. Indeed this was actively pursued: SEBI2010 works closely with the 2010 BIP and the project coordination team included not only European organizations but also UNEP-WCMC with the intention of ensuring close linkages across national, pan-european and global activities. Circumpolar Biodiversity Monitoring Programme (CBMP) The CBMP was established to provide an integrated and sustained Arctic Biodiversity Monitoring Network. The CBMP functions as an international forum of key scientists and conservation experts from all eight Arctic countries, the six international indigenous organizations of the Arctic Council, and a number of global conservation organizations. 48 BIODIVERSITY INDICATORS & THE 2010 BIODIVERSITY TARGET
50 The CBMP is planning to develop 13 indicators during and a further nine indicators in The CBMP indicators and indices will facilitate the reporting of the Arctic s progress towards the Convention on Biological Diversity s 2010 target to reduce the rate of loss of biodiversity. In that regard there is significant correspondence with the global indicator framework, and CBMP works closely with the 2010 BIP. Intergovernmental Science-Policy Platform on Biodiversity and Ecosystem Services (IPBES) The Intergovernmental Platform on Biodiversity and Ecosystem Services (IPBES) is a mechanism proposed to further strengthen the interface between science and policy on biodiversity and ecosystem services. It looks to add to the contribution of existing processes that support decision-making based on the best available scientific information on conservation and sustainable use of biodiversity and ecosystem services. IPBES is proposed as a broadly similar mechanism to the Intergovernmental Panel on Climate Change (IPCC). As IPBES moves towards implementation, the 2010 BIP is well-placed to play a key role in supporting regular, scientifically-rigorous and comprehensive assessments on the status and trends of biodiversity at a range of scales. The achievements of the Partnership to date in bringing together key players in the field of global, regional and national indicator development, can contribute greatly to this over-arching initiative. Other international assessment processes are also envisaged to be outlets for the CBD global indicators. For example the biodiversity chapter in UNEP s fifth Global Environment Outlook (GEO), scheduled for launch in 2012, is being coordinated with support from the 2010 BIP Secretariat, and several 2010 BIP Partners are involved as lead and contributing authors. SUPPORT TO THE PRIVATE SECTOR The private sector is a major potential audience and user of biodiversity and ecosystem service indicators. Already, several 2010 BIP Partners engage the private sector, making data available through interactive tools. Most recently, the 2010 BIP Secretariat has also supported the Global Reporting Initiative (GRI) to offer a blueprint of ideas and actions to advance the integration of ecosystem services into performance measurement at the level of markets and individual companies. In addition, it also seeks to build coalitions of organizations working in the field to enable coordination moving forward. The GRI is an international organization based in the Netherlands and maintains the most widely used guidelines for private sector sustainability reporting in the world. The GRI Guidelines are developed through a multi-stakeholder process involving business, NGOs, investors, trade unions, and other stakeholders. The collaboration with GRI has resulted in a publication that will have immediate value in helping to guide companies as they consider integrating ecosystem services into their performance measurement and subsequent disclosure. It will also lay a foundation which can be further built upon to both codify ecosystem services thinking into leading tools and to develop the further enabling means to allow companies to more effectively measure and report. The publication will serve as a reference for: a. Further updates to the GRI Reporting Framework - the project findings will be of immediate value to sector specific working groups within the GRI and will guide any further thinking on changes to the environmental indicators of the GRI Guidelines. The GRI Reporting Framework is the key reference point for sustainability reporting around the world; b. Development of infrastructure for measurement - monitoring and measuring ecosystem service performance at the macro and micro levels requires management of scientific data. The project can contribute to further evolution in thinking about how data might be used more effectively to link the public policy concerns and private sector management, and how associated database initiatives could be leveraged; c. Informing policy inputs - initiatives and institutions working in the field of public policy will be able to more efficiently aim for interventions and directions that will support macro-micro linkages. d. Linking private sector tools/initiatives - by creating clearer explanations of the connections between the framework thinking of the Millennium Ecosystem Assessment through to how companies monitor and report, the 2010 BIP can contribute to future work on creating coherence amongst the many initiatives now working in this area. e. Paying for biodiversity - approaches to valuing ecosystem services to companies depend on having appropriate performance indicators to describe interactions between companies and ecosystems. The conclusions of this project will provide an important basis for further advancing work around measuring the value of ecosystem services at the organizational level. The specific impacts and resulting follow-on actions will depend much on the detailed findings of the project. However, the creation of a blueprint and conceptual framework can then support further activity by a range of actors independently or in coordination to extend existing practices around performance measurement, management, and reporting. OUTPUTS, EXPERIENCES AND LESSONS LEARNT FROM THE 2010 BIODIVERSITY INDICATORS PARTNERSHIP 49


51


 was launched in April 2010.")


, synthesising and analysing the indicators to provide the first empirical evidence that the 2010 Biodiversity Target was unlikely to be met.")
, launched in May, was the key CBD publication for 2010.")
52 tional l CDB: CDB icador: GFN undiale o ogénica ien e está 0, la pres bal d or nes act Na io s años s resu e WWF. Las desc ponib les serie n la pé enaz ivad rsi co 4. INDICATOR INTERPRETATION AND COMMUNICATION 2010 BIP COMMUNICATION ACTIVITIES A major objective of the 2010 BIP has been to enhance awareness of the biodiversity indicators and to make them available to a range of audiences. Since its establishment in 2007 the Partnership has produced numerous successful communication products to highlight the Partnership s work and indicator results. These have included reports, scientific publications, websites, keynote talks, brochures, policy briefs, newsletters and posters. In order to reduce barriers in communicating to a global audience the majority of outputs are available in all six UN languages plus Japanese. Highlighted outputs include: 2010 BIP Website Aimed to be the most comprehensive resource for biodiversity indicator information available online; the 2010 BIP website ( contains a wealth of information about the Partnership. Each indicator has its own webpage with a simple, unique URL. These pages provide detailed information on the indicators including their current status, applicability for national use and current global story. For some indicators, with less external communication support, this is the only source of information available to the global community. The site is translated into all six UN languages and Japanese. National Biodiversity Indicator Portal A companion site to the main 2010 BIP site, the National Biodiversity Indicators Portal ( was launched in April The website was produced in order to share the Partnership s extensive knowledge and experience in regional and national indicator development. This portal is the primary online resource for countries and regions looking to develop and use biodiversity indicators. As well as providing guidance and support through both online materials and resources for download, the Portal allows nations to share their experiences and lessons learnt from indicator development. The website complements the guidance documents produced by the 2010 BIP. The site is translated into all six UN languages and Japanese. Research paper in Science - Global biodiversity: Indicators of recent declines This manuscript was produced by 2010 BIP Partners (Butchart et al., 2010a), synthesising and analysing the indicators to provide the first empirical evidence that the 2010 Biodiversity Target was unlikely to be met. The article generated global interest featuring in over 60 newspapers and numerous websites in a variety of languages including Spanish, French, Russian, German, Portuguese, Estonian and Turkish. Third Edition of the Global Biodiversity Outlook The Third Edition of the Global Biodiversity Outlook (GBO-3, SCBD 2010), launched in May, was the key CBD publication for The 2010 BIP was a significant contributor to this publication, providing the content for the Biodiversity in 2010 chapter that reviewed the evidence of progress towards the 2010 Target. The 2010 BIP was acknowledged for its contribution in both the acknowledgements and the press release for the launch, and 2010 BIP Partners were involved in a number of launch events worldwide. Indicator Factsheets Individual indicator factsheets have been produced for each of the indicators. Each factsheet includes key information such as current status, interpretation, applicability for national use and the current indicator storyline. Revisions of the factsheets, to include the most up-to-date information, are ongoing in the latter half of : : : RSPB & BirdLife International : : Huella Ecológica Hechos Área Focal del CDB: Utilización sostenible Indicador Titular del CDB: Huella ecológica y conceptos relacionados Socios clave del indicador: ic d GFN Datos disponibles: Mundiales y regionales / nacionales de series es de tiempo tiempo, Estado de desarrollo: Listo para su uso mundial y nacional Razón Directo amenazas antropogénicas o a la diversidad biológica incluyen n la pérdida o daño del hábitat, sobreexplotación, contaminación, especies invasoras y el cambio climático. Estas amenazas son el resultado directo de los más lejanos, los impulsores indirectos de la pérdida de biodiversidad derivados del consumo de recursos y la generación de residuos. Los controladores de final de las amenazas a la biodiversidad son las necesidades humanas de alimentos, fibras y madera, el agua, la energía y el área sobre la que construir la infraestructura.a medida que la población humana y la economía global crece, también aumenta la presión sobre la biodiversidad. La Huella Ecológica mide la demanda de que nuestro uso de los lugares ecológicos activos en la capacidad regenerativa de los ecosistemas productivos. Comprensión de los vínculos y las interacciones entre la diversidad biológica, los impulsores de la pérdida de biodiversidad la Huella Ecológica es fundamental para frenar, detener y revertir el declive en curso en los ecosistemas naturales y las poblaciones de especies silvestres. Estado La demanda de medidas de la huella ecológica de la humanidad en la biosfera, en términos de la superficie de tierra biológicamente productiva y el agua necesaria para proporcionar los recursos que utilizamos y para absorber nuestras emisiones de dióxido de carbono. Esta zona se reporta en hectáreas globales (GHA) - de hectáreas con una productividad promedio mundial. La huella de un país incluye todas las tierras de cultivo, tierras de pastoreo, bosques y zonas de pesca necesarios para producir los alimentos, fibra y madera que consume, la absorción de carbono de la tierra necesaria para absorber el dióxido de carbono emitido en la generación de la energía que consume, y la construcción -hasta los terrenos necesarios para proporcionar espacio para su infraestructura, independientemente de donde estas áreas se encuentran en el planeta. Huella de las cuentas nacionales son derivados de fuentes internas reconocidas, tales como las Naciones Unidas-la FAO, y volver a Para ver si los límites ecológicos se están excediendo, ediendo, la huella ecológica puede compararse con la biocapacidad, la cantidad de área biológicamente productiva que está disponible para proporcionar recursos y absorber los residuos. A mediados de la década de 1980, la presencia encia global de la humanidad comenzó a sobrepasar la biocapacidad mundial, y en 2006 este exceso fue de aproximadamente amente 44 por ciento. Global Footprint Network versiones es actualizadas Nacional de Cuentas de la huella de cada año, y cada dos años publica los resultados de resumen en los informes Planeta Vivo de WWF.Las FLas descripciones de la metodología y los datos adicionales están disponibles en Indicador Ficha técnica Facts Water Quality Index for Biodiversity CBD Focal Area: Ecosystem integrity and ecosystem goods and services CBD Headline Indicator: Water quality of freshwater ecosystems Key Indicator Partners: UNEP GEMS/Water Programme Data Available: Global time series (1931 onwards, with regional variations) and regional/national case studies Development Status: Ready for global and national use Reason The integrity of an ecosystem is typically assessed through its ability to provide goods and services on a continuous basis. Together with the air we breathe, the provision of clean water is arguably the most fundamental service provided by ecosystems. Yet, human activities have fundamentally altered inland water ecosystems and their catchments. As a consequence species dependant on inland waters are more likely to go extinct, and future extinction rates of freshwater animals could be up to 5 times higher than for terrestrial animals. Water quality refers to the physical, chemical and biological characteristics of a water body. These characteristics determine how and for what water can be used and the species and ecosystem process it can support. Status The Water Quality Index for Biodiversity (WQIB), developed by the United Nation s Environment Programme s Global Environment Monitoring System, is based on the most comprehensive global water quality dataset in the world. The WQIB uses data related to water temperature, dissolved oxygen, ph, electrical conductivity (salinity), nitrogen and phosphorus, to determine how water quality is affecting biodiversity. Data is collected and compiled from 6,216 water monitoring stations around the globe. By examining changes in water quality at each of these stations over time it becomes possible to determine if water quality is declining, remaining stable or improving with regard to its ability to sustain biodiversity. This approach has the advantage of incorporating spatial patterns of observed species responses to fragmentation operating at multiple spatial scales. Performing similar analyses for different datasets from around the world will help to select the best possible form of BioFrag for application at regional and global scales. Indicator Factsheet OUTPUTS, EXPERIENCES AND LESSONS LEARNT FROM THE 2010 BIODIVERSITY INDICATORS PARTNERSHIP 51
53 CHALLENGES IN COMMUNICATING THE INDICATORS Although the 2010 BIP has made significant progress in the communication of the CBD indicator suite and Partnership activities, there are several challenges to effective indicator communication. Indicator communication challenges: The main objectives of the 2010 BIP have been focused around indicator development rather than communication. At the outset it was envisaged that indicator communication would receive greater emphasis post-2010, however it has become clear that communicating the indicator results widely in 2010 is extremely important. Limited time and resources have been available to effectively communicate indicator messages, and significant effort has been expended in a short space of time to bring the indicators to the attention of policy-makers in As structured in the existing framework, the indicators exist as separate entities with no clear links between them. This can lead to the development of separate key messages for each indicator and the absence of coherent stories which give a more complete picture of the status of biodiversity. Communication of multiple messages often acts to confuse and bombard the target audience and has a shielding effect with a risk that none of the messages are taken up. The solution lies in identifying key messages that are each supported (and underpinned) by a number of the indicators. In addition to the joint efforts of the 2010 BIP, Partners also work to communicate their individual indicators. Individual indicator communication conducted by Partners has been a very important part of overall awareness-raising. However it can inevitably lead to uneven levels of communication when indicators backed by strong institutional communication facilities receive greater profile. Moreover it does little to support the communication objectives of the Partnership if indicators are promoted individually without reference to the full indicator suite or the Partnership itself. The indicators are in different stages of development and as a result communication opportunities also vary. Well-developed indicators produce more results and messages and therefore are likely to receive a greater proportion of communication efforts. This factor combined with variation in communication support for individual indicators often results in disproportionate awareness of the indicators. An on-going conflict also exists between rapidly communicating the newly developed indicators results versus ensuring rigour and credibility by publishing the methods and results in internationally peer-reviewed scientific journals. Although the indicators are relevant to a number of MEAs and sectors, the 2010 BIP is often considered to be explicitly linked with the CBD. The 2010 BIP Secretariat has endeavoured to communicate the Partnership s work to potential users beyond the CBD (see Section 3), greater efforts are still required to highlight the utility of the indicators to MEAs beyond the CBD, and the private sector. Difficulties exist with the communication of the CBD target itself, to a general audience and the media, as it has widely been perceived as having negative connotations. These difficulties translate to the communication of the indicator suite, which, at a global level at least, is unfortunately lacking good news stories (Xu et al., 2010; Butchart et al., 2010b). There is also the absence of clear targets for each of the indicators around which a story can be woven, which creates a barrier to arousing public interest. The complexity of the meaning of the term biodiversity is a continuing challenge for communicating to disparate audiences. There is difficulty in communicating the indicators to multiple sectors as there are numerous different understandings of what biodiversity means. 52 BIODIVERSITY INDICATORS & THE 2010 BIODIVERSITY TARGET
54 COMMUNICATING BIODIVERSITY STORIES USING LINKED INDICATORS While the existing framework has been adopted widely, it is not always obvious how the constituent indicators can be used in combination to inform and monitor policies for stemming biodiversity loss. An often insufficiently considered aspect of indicator development is the challenge of communicating the messages derived in a meaningful and impactful way to the desired audience. A suite of scientific indicators can provide a useful exercise and speak clearly to an academic audience, but the question needs to be asked as to whether the politician, local official or boardroom executive will gain a clear and relevant understanding from a broad range of individually presented indicators. Since biodiversity has different significance to separate sectors of society, there is a need to ensure that the right terminology and approach is used for each audience. Using a simple visual, graphical or symbol-based means of presentation can be useful. For example, Table 4 provides an at-a-glance summary of the general trends across the suite of indicators. However, it also highlights the ineffectiveness of simply providing such a wide-ranging list of messages without showing the interlinkages therein. Table 4. Trends shown by agreed indicators of progress towards the 2010 biodiversity target. Source: GBO-3, SCBD Status and trends of the components of biological diversity Trends in extent of selected biomes, ecosystems, and habitats Trends in abundance and distribution of selected species Change in status of threatened species Trends in genetic diversity of domesticated animals, cultivated plants, and fi sh species of major socio-economic importance Most habitats in most parts of the world are declining in extent, although forest area expands in some regions, and the loss of mangroves has slowed signifi cantly, except in Asia. Most species with limited population size and distribution are being further reduced, while some common and invasive species become more common. (but limited number of taxa assessed) The risk of extinction increases for many threatened species, although some species recovery programmes have been very successful. (for those species assessed) It is likely that the genetic variety of cultivated species is declining, but the extent of such decline and its overall impacts are not well understood. (although many case studies with a high degree of certainty are available) Coverage of protected areas There has been a signifi cant increase in coverage of protected areas, both terrestrial and marine, over the past decade. However, many ecological regions, particularly in marine ecosystems, remain underprotected, and the management effectiveness of protected areas remains variable. Ecosystem integrity and ecosystem goods and services Marine Trophic Index Despite intense pressure the Marine Trophic Index has shown a modest increase globally since However there is substantial regional variation with declines being recorded in half of the marine areas with data. Although the global increases may indicate a recovery it is more likely a consequence of fi shing fl eets expanding their areas of activity, thus encountering fi sh stocks in which larger predators have not yet been removed in large numbers. Connectivity fragmentation of ecosystems Water quality of aquatic ecosystems Threats to biodiversity Nitrogen deposition Trends in invasive alien species Most terrestrial and aquatic ecosystems are becoming increasingly fragmented, despite an increased recognition of the value of corridors and connections, especially in climate change adaptation. Most parts of the world are likely to be suffering from declines in water quality, although quality in some areas has improved through control of point-source pollution. Human activity has doubled the rate of creation of reactive nitrogen on the planet s surface. Pressure on biodiversity from nutrient pollution continues to increase, although some measures to use nutrients more effi ciently, to reduce their release into water and the atmosphere, are beginning to show positive effects. The number and rate of spread of alien species is increasing in all continents and all ecosystem types. (although many case studies with a high degree of certainty are available) OUTPUTS, EXPERIENCES AND LESSONS LEARNT FROM THE 2010 BIODIVERSITY INDICATORS PARTNERSHIP 53
55 Sustainable use Area of forest, agricultural and aquaculture ecosystems under sustainable management Ecological footprint and related concepts Status of traditional knowledge, innovations and practices Status and trends of linguistic diversity and numbers of speakers of indigenous languages Status of access and benefit-sharing Indicator of access and benefi t- sharing to be developed There are considerable efforts under way to increase the extent of areas of land under sustainable management. Regional efforts on sustainable forest management are expected to contribute to this. Traditional agricultural practices are being maintained and revitalized as the demand for ethical and healthy products increases. However, these are still relatively small niches and major efforts are required to substantially increase the areas under sustainable management. The ecological footprint of humanity is increasing. Efforts at increasing resource effi ciency are more than compensated by increased consumption by a growing and more prosperous human population. A large number of minority languages are believed in danger of disappearing, and linguistic diversity is very likely declining. (although case studies with a high degree of certainty are available) The need and possible options for additional indicators are being examined by the Ad Hoc Open-ended Working Group on Access and Benefi t-sharing. Status of resources transfers Offi cial development assistance (ODA) provided in support of the Convention The volume of ODA for biodiversity has increased over the past few years. Negative changes Positive changes No clear global trend. Positive and negative changes are occurring depending on the region or biome considered Insuffi cient information to reach a defi nitive conclusion. Degree of certainty: Low Medium High As highlighted at the CBD expert workshop in July 2009, four kinds of indicators are needed to make a joined up set, using a modified DPSIR framework 2 (see Figure 5): Responses - indicators measuring the implementation of policies or actions to prevent or reduce biodiversity loss. Pressures - indicators monitoring the extent and intensity of the threats to biodiversity that responses aim to address. State - indicators tracking the condition of biodiversity. Benefits - indicators measuring trends in the benefits and services that humans derive from biodiversity. Such an approach was taken in the detailed synthesis and analysis of the indicators by the 2010 BIP Partners published in Science (Butchart et al. 2010a). Figure 4 summarises the results using a modified DPSIR framework. Taking this approach further, the 2010 BIP looked to develop thematic storylines that brought together a selection of indicators in a manner that presented a comprehensive review of a single issue. The following are summaries of two such examples, focusing on forest and marine biomes, and on biocultural diversity. Footnote 2 DPSIR is a general framework for organizing information about state of the environment. It assumes cause-effect relationships between interacting components of social, economic, and environmental systems, which are Driving forces of environmental change (e.g., industrial production) Pressures on the environment (e.g., discharges of waste water) State of the environment (e.g., water quality in rivers and lakes) Impacts on population, economy, ecosystems (e.g., water unsuitable for drinking) Response of the society (e.g., watershed protection) 54 BIODIVERSITY INDICATORS & THE 2010 BIODIVERSITY TARGET
 the state of biodiversity based on nine indicators of species population trends, habitat extent and condition, and community composition; (B) pressures on biodiversity")
56 Index A State B Pressure Figure 4. Aggregated indices for (A) the state of biodiversity based on nine indicators of species population trends, habitat extent and condition, and community composition; (B) pressures on biodiversity based on five indicators of ecological footprint, nitrogen deposition, numbers of alien species, overexploitation, and climatic impacts; and (C) responses for biodiversity based on six indicators of protected area extent and biodiversity coverage, policy responses to invasive alien species, sustainable forest management, and biodiversity related aid. Values in 1970 set to 1. Shading shows 95% confidence intervals derived from 1000 bootstraps. Significant positive/upward (open circles) and negative/downward (filled circles) inflections are indicated. Source: Modifi ed from Butchart et al. 2010a. 1.0 C Response target set Progress in developing linked indicator sets for improved tracking of biodiversity targets An important function of indicators is to facilitate the informed assessment of progress towards targets. Linked sets of indicators provide a more logical and effective framework for this than do individual indicators on their own or as an unstructured set. Linked sets of biodiversity indicators help to develop clearer understanding of relationships between policy actions, anthropogenic threats, the status of biodiversity and the benefits and services that people derive from it (Figure 5). Members of the 2010 BIP collaborated with the University of Cambridge, under the auspices of the Cambridge Conservation Initiative (CCI), on a project to assess the value of linking indicators to tell a more coherent story of the status of biodiversity for policymakers (Cambridge Conservation Initiative 2010). Linking indicators of in these four categories clarifies how policy responses are effecting change. The project tested the utility and practicality of this approach for communicating two scenarios: humid tropical forests (Figure 6) and marine fisheries (Figure 7). Policy RESPONSES Benefits generate support for effective responses BENEFITS from biodiversity Responses reduce pressures Enhanced biodiversity delivers more benefits PRESSURES upon biodiversity Less pressure helps biodiversity to recover STATE of biodiversity Figure 5. A schematic diagram showing how the four types of indicators can be linked to create a more informative set that will better guide policy OUTPUTS, EXPERIENCES AND LESSONS LEARNT FROM THE 2010 BIODIVERSITY INDICATORS PARTNERSHIP 55
57 In each case, the indicators presented are intended to be illustrative of the approach rather than definitive. In some cases, surrogate indicators are used for more directly relevant (but currently unavailable) measures, or are regional examples for which global data are not yet available. In humid tropical forests, indicators of responses monitor the degree to which policies and actions intended to reduce pressures on tropical forest biodiversity have been implemented. Response indicators could include the areas of forest under sustainable management, designated for conservation, or protected, and the coverage of Important Bird Areas by Protected Areas (as a measure of the extent to which Protected Area networks cover a critical set of sites for biodiversity conservation). To determine the impact of such policies in reducing threats to biodiversity ( pressures ), appropriate indicators could include the Ecological Footprint for human resource demands on forests, the area of land converted to crops (major drivers of tropical deforestation) and the incidence of fire in humid tropical forests. The impact of these pressures on the state of biodiversity in humid tropical forests can be measured in many ways, including, for example the area of tropical primary forest, trends in the populations of wild vertebrates in tropical forests (as measured by the Living Planet Index), and the extinction risk of tropical forest species (as measured by the Red List Index). Finally, to determine if policies aimed at improving the state of biodiversity are leading to impacts on the ecosystems services ( benefits ) that people derive from tropical humid forests, indicators of the volume of timber and fuelwood extracted sustainably, numbers of people employed in sustainable forestry and levels of carbon sequestered and stored in these forests, would assist. In marine fisheries, indicators to monitor the implementation of policy responses include the cumulative extent of marine Protected Areas and no take zones, the proportion of fish taken by fisheries certified as sustainably managed, and the degree of implementation of actions to reduce bycatch. To measure the impact of such policies in reducing the pressures on the biodiversity of this system, indicators could include the combined engine power of fishing fleets, the proportion of fish stocks that are overexploited, and (as measures of climate change impacts on the marine environment) average sea temperatures and ocean acidity. Indicators tracking the impact of pressures on the state of biodiversity in the marine fisheries system include trends in the populations of wild marine vertebrates (as measured by the Living Planet Index), the number of dead zones (caused by eutrophication), and the extent of habitats that are important as fish nurseries (mangroves, seagrasses and coral reefs). Finally, to determine the effectiveness of policies addressing biodiversity loss in marine fisheries and whether they are leading to improvements in the supply of benefits to people, indicators such as the quantity of fish sustainably caught and landed for human and industrial use, levels of employment in sustainable fisheries, and value of the recreational fishing industry would assist. Linked Indicator Examples Figure 6. Humid tropical forests example of linked indicators Responses Pressures Million ha Forest Area Designated Primarily for Conservation Million ha Area Under FSC Certification Soybeans (m ha) Crops in Humid Tropical Countries Oil palm 40 Soybeans Oil palm (m ha) Million ha Area Affected by Fire % Proportion of Forest in Protected Areas % Proportion of Forest Important Bird Areas in Protected Areas Proximity to Human Impact Under development Billion gha Forest Footprint Benefits State Million m Roundwood and Fuelwood Roundwood Fuelwood Giga Tonnes Carbon Storage 1970 = 1.0 Tropical Forest Vertebrate Living Planet Index Better Red List Index for Humid Tropical Forest Species Birds Mammals Amphibians Worse Employment in Forestry Provision of Clean Drinking Water Area of Forest Area of Primary Forest Million Person-years Under development Million ha Million ha BIODIVERSITY INDICATORS & THE 2010 BIODIVERSITY TARGET
58 Figure 7. Marine fisheries example of linked indicators Responses Pressures Cumulative Area (Million km 2 ) Marine Protected Areas Million Tonnes Tonnage of Fish from Certified Fisheries Index Fleet Capacity Index (fishing power) % Proportion of Fish Stocks Overexploited, Depleted or Recovering % Discard Rates Reduction in Discard Cumulative Area (Million km 2 ) No Take Zones Anomalies ( C) Global Sea Surface Temperature ph Trend in Ocean ph Benefits State Employment in Fisheries Global Landings from Marine Fisheries Marine Vertebrate Living Planet Index Number of Dead Zones Millions Million Tonnes Industrial Human consumption = Cumulative Number of Systems < Recreational Fisheries Under development Ecotourism Under development Worse Better Red List Index for Pelagic Seabirds Area (m km 2 ) Area of Mangrove and Seagrass, and Coral Condition 0.23 Mangrove 0.45 Seagrass 0.21 Coral Reef Mean Coral Reef Condition This approach can be applied to any sector or system, and at any scale from local to global. Sets of linked indicators should be established first at the scales most appropriate to decision-making and management. These vary according to the system: for terrestrial habitats such as forests it is often the scale of individual nations, while marine fisheries are often managed by many states, at a larger scale. Here we show mainly global indicators for the purposes of illustration, but these indicators can be broken down, as needed, to smaller scales (regional, national and local). Where data are limited, we have used regional or national examples, or proxy indicators, to illustrate the overall approach. As biodiversity targets are set for the post-2010 era, and indicators developed for these targets, adoption of the Response-Pressure-State-Benefit approach demonstrated here and in Butchart et al. (2010a) will help to maximise the usefulness and cost-effectiveness of indicator reporting. Similarly, as countries strengthen their efforts to address biodiversity loss, national indicators would benefit enormously from being framed as linked sets. Only by establishing the linkages and narrative between different types of indicators can we provide decisionmakers with the effective tools they need to make informed decisions on reducing biodiversity loss. Biocultural diversity The relationships between biological and cultural diversity, and the growing threats they face, have drawn increasing attention over the last decade. Analyses of these relationships have led to the concept of biocultural diversity, the total variety exhibited by the world s natural and cultural systems. Biocultural diversity may be thought of as the sum total of biological diversity at all its levels, from genes to populations to species to ecosystems; cultural diversity in all its manifestations, ranging from traditional knowledge through individual ideas to entire cultures; and, importantly, the interactions among all of these. The indigenous and local communities living all around the world today, especially those living by traditional means, embody much of world s cultural and linguistic diversity, and their territories overlap many of the world s most important areas for biodiversity. Indeed, their languages and cultures represent unique ways of living and understanding nature and their territories are broader than most current protected area systems. OUTPUTS, EXPERIENCES AND LESSONS LEARNT FROM THE 2010 BIODIVERSITY INDICATORS PARTNERSHIP 57
59 The loss of biocultural diversity is the combination of pressures on both traditional knowledge and biodiversity, many of which overlap. Globalization, increasing human populations, and land use change have led to unsustainable production and consumption, with the footprint of such growth impacting on biodiversity and ecosystems across the planet. The effects of the increased demand are mostly localized. For instance, increased water consumption of Lake Chad has led to a 10% fall in the water level over a 40 year period. Alternatively, the effects of such drivers as land use change, overconsumption or even climate change, which are not necessarily caused by local activities or demand, can impact on the biodiversity or traditional livelihood systems. Figure 8 uses a sample of the global CBD indicators to show the status and trends of biocultural diversity using the DPSIR framework. There is growing appreciation today of the value of traditional knowledge to the wider conservation and development communities. This knowledge is valuable not only to those who depend directly on local ecosystems in their daily lives - for instance, 80% of the developing world s populations relying to some degree on traditional medicinal products (SCBD 2010) - but also to modern industry and agriculture. Many widely used products, such as plant-based medicines and cosmetics, are derived from traditional knowledge. Other valuable products based on traditional knowledge include agricultural and non-wood forest products as well as handicrafts. Traditional knowledge can make a significant contribution to sustainable development. Most indigenous and local communities are situated in areas where the vast majority of the world s plant genetic resources are found, with the cultivation and use of biodiversity being carried out in a sustainable way for thousands of years. However, the contribution of indigenous and local communities to the conservation and sustainable use of biodiversity goes far beyond their role as natural resource managers. Their skills and techniques provide valuable information to the global community and a useful model for biodiversity policies. Furthermore, as on-site communities with extensive knowledge of local environments, indigenous and local communities are most directly involved with conservation and sustainable use. The decline in biological diversity and traditional knowledge continues unabated. The decline in tropical forest cover, where the highest biological and linguistic diversity are located, is impacting the communities living in those areas leading in some cases to the disappearance of marginal indigenous groups. The preservation of biodiversity therefore contributes to the preservation of our world s cultural heritage, and vice versa. The question is, therefore, what policy responses are needed to reverse this trend? Within the CBD indicator framework, other positive response indicators suggest areas where appropriate action could yield benefits to indigenous and local communities. For instance, the forest certification schemes, which are gaining much ground in temperate and boreal regions, may have a role. Equally, such certification schemes could be applied to other biotic aspects in demand by society as a whole. Appropriate mechanisms to ensure the benefits are shared equally among local stakeholders would clearly be required. Furthermore, as described above, the role of community managed areas in improving carbon sequestration should obviously have a place within the REDD discussions, as well as the concept of payment for ecosystem services more broadly. 58 BIODIVERSITY INDICATORS & THE 2010 BIODIVERSITY TARGET
 Coverage of protected areas (IUCN Categories V & VI) 600,000,000 500,000,000 400,000,000 300,000,000 200,000,000 100,000,000 0 1947 1957 1887 1897 1907 1917 1967 1977 1927 1937")
60 Figure 8. Schematic of selected global CBD indicators showing relevance to biocultural diversity in DPSIR framework. Responses Area (ha) Coverage of protected areas (IUCN Categories V & VI) 600,000, ,000, ,000, ,000, ,000, ,000, National policies supporting traditional knowledge Pressures Ecological Footprint 1.5 Ecological Footprint (number of Earths) World Biocapacity Built-up Land Forest Land Fishing Ground Grazing Land Cropland Carbon Footprint Number of parties responding positively Research on traditional knowledge, innovations & practices Capacity building programmes on traditional knowledge, innovations & practices Enhanced participation of indigenous & local communities in policy making Full participation of indigenous & local communities, especially women Establishement of indigenous & local community biodiversity advisory committees Promoted development of appropriate indigenous & local community development & biodiversity conservation strategies Increased capacity of indigenous & local communities to maintain agricultural biological diversity Relative increase in volume of global trade Relative value (2000=100) Benefits Red List Index for utilized species State Living Planet Index Better Red List Index of Species Survival Worse Amphibians used for Food and Meds Amphibians not used for Food and Meds Birds used for Food and Meds Birds not used for Food and Meds Mammals used for Food and Meds Mammals not used for Food and Meds Global Tropical Temperate Change in health and well-being of dependent communities Language vitality Non-threatened or data deficient Vulnerable Endangered Critically endangered Extinct since Percent of all Languages OUTPUTS, EXPERIENCES AND LESSONS LEARNT FROM THE 2010 BIODIVERSITY INDICATORS PARTNERSHIP 59
61 THE WAY FORWARD: INDICATOR COMMUNICATION BEYOND 2010 The 2010 BIP has experienced many successes in its indicator communications since its inception and has laid the foundations for future efforts. Building on the lessons learnt the Partnership has identified a number of options for improved indicator communication post-2010: Solutions for indicator communication: Only well-developed indicators can provide clear messages for communication. It is only possible to communicate developed indictors which produce results and stories. Emphasis therefore needs to be placed on delivering the existing indicators and ensuring future additional indicators can produce results quickly. Where new indicators are considered necessary, these should be well designed and the appropriate data collected systematically in order to ensure robust and justifiable metrics. While the costs and benefits of designing and populating new indicators must be carefully considered, continued reliance on existing datasets, which often were not collected with an indicator in mind, may not be ideal to meet this concern. A well-developed set of indicators will provide a range of results which can be interpreted to generate clear messages specific to different target audiences. Logically linking indicators will aid communication by providing coherent stories and clear messages for a range of audiences. The Reading workshop made six recommendations on strengthening the current indicator set (UNEP-WCMC 2009a), including modifying and simplifying the framework in an attempt to explain much more clearly the relationships between indicators from different focal areas. The approach of integrating indicator results to tell coherent stories can also be applied to different themes or topics. Key messages can be communicated which give a more coherent story of the status of biodiversity. Biodiversity indicators are easier to understand and communicate when linked together in a set which connects policies to outcomes. Greater coordination between Partners communication efforts would be benefi cial. As well as communication led by the 2010 BIP Secretariat, wider use of Partners communications machinery would be jointly beneficial. Potential solutions include the generation of a shared communications strategy which contains greater emphasis on aligning communication between all Partners. This would create greater awareness of the framework and Partnership and ensure that key messages are consistent and in keeping with the communication objectives of the Partnership as a whole. Enhanced Partnership links with other MEAs and sectors would increase indicator uptake. Greater efforts are needed to demonstrate the value of the 2010 BIP and the indicators it has helped to develop to other MEAs and sectors. Clearer, established links would help to widen the audience for Partnership products and outputs, whilst creating synergies and efficiencies in indicator efforts between MEAs. At CITES COP 15 a decision was made to continue engagement with and support for the 2010 BIP, and such official decisions are important for maintaining links. The production of specific tailored outputs for individual MEAs and different sectors could be a key element in increasing the relevance of the indicators to multiple audiences. Greater emphasis on indicator communication post-2010 is required. The main objectives of the Partnership when originally conceived focused on indicator development and delivery, with less focus on communication. It has become clear from the positive uptake of 2010 BIP products that indicator communication should become one of the main pillars of a post-2010 Partnership. 60 BIODIVERSITY INDICATORS & THE 2010 BIODIVERSITY TARGET


62 5. SUPPORT TO NATIONAL INDICATOR DEVELOPMENT DEVELOPMENT AND IMPLEMENTATION OF INDICATOR CAPACITY STRENGTHENING Part of the aims of the 2010 BIP is to support increased linkages and development of biodiversity indicators at the national, regional and global scales, with an emphasis on capacity building. This work, which responds to the call of CBD COP 8, through decision VIII/15, for the development of national and/or regional goals and targets and related national indicators, has involved a combination of regional workshops for biodiversity indicator developers, production of guidance materials and the establishment of a national indicator development support web-portal ( One purpose of this component of the 2010 BIP is to provide accessible information for national and regional indicator developers on the global indicators framework for the CBD 2010 Target. This was especially important to support Parties to the CBD submitting their fourth National Reports to the CBD, which included reporting on progress towards the 2010 Biodiversity Target. Explanatory information on the CBD global indicators framework is provided in the Indicators section of the 2010 BIP website and as a series of indicator fact sheets, developed with the global indicator lead Partners and translated into the six UN languages and Japanese. For four of the global indicators with well-established methods, comprehensive guidance documents have been produced to enable national indicator developers to understand and adapt the indicators for their needs, and to encourage collaboration with the global indicator agencies. These guidance documents are available for the Red List Index, Living Planet Index, Coverage of Protected Areas, and the Wild Bird Index (available from Direct engagement with national biodiversity indicator developers was conducted through a series of regional capacity building workshops, including three stand-alone workshops and a series of repeat workshops in Eastern and Southern Africa, as follows: November Bangkok, Thailand, for 10 South- East Asian government agencies responsible for implementation of the CBD, in conjunction with the ASEAN Centre for Biodiversity, Manila. December Port of Spain, Trinidad, for 15 Caribbean nations government agencies responsible for implementation of the CBD, in conjunction with the Cropper Foundation, Trinidad. June San Jose, Costa Rica, for 13 Central American government agencies responsible for implementation of the CBD and NGOs, in conjunction with the Instituto de Politica Ambiental. These three-day workshops were designed to assist the bodies responsible for CBD implementation and reporting to have an improved understanding of the global framework of indicators for the CBD 2010 Target, and to identify ways to improve their national indicators. The workshops reviewed existing experiences with biodiversity indicators, conducted capacity-building exercises, and examined possibilities for common regional indicators. The workshop reports are available at In Eastern and Southern Africa more extensive capacity building was conducted through a UNEP project funded by the UN Development Account and implemented by UNEP-WCMC as a complementary sister project to the 2010 BIP. A series of regional workshops have been run for government environment and wildlife agencies, national statistical offices and conservation NGOs, as follows: April 2009, September 2009, April regional workshops for 6 Eastern African countries, in collaboration with the Kenya Wildlife Service (KWS). July 2009, February 2010, August regional workshops for 7 Southern African countries, in collaboration with the South African National Biodiversity Institute (SANBI). OUTPUTS, EXPERIENCES AND LESSONS LEARNT FROM THE 2010 BIODIVERSITY INDICATORS PARTNERSHIP 61
63 The project introduced the CBD global indicator framework and supported the development of national biodiversity indicators to meet these needs and national priority issues, using existing data sets. Reports of the workshops and national progress can be found at www. bipnational.net. The capacity building workshops have been designed to cover the key concepts and steps in producing successful indicators which are explained in the Biodiversity Indicator Development Framework presented in Annex 3. As a resource for the workshops, and to complement the information on individual indicators, this information has been presented as a guidance document and on the website. APPLICABILITY OF GLOBAL INDICATORS FOR NATIONAL USE One of the challenges encountered in the capacity building work conducted with the 2010 BIP has been the varying degree to which global biodiversity indicators can be applied for national use. There is also a related problem for some global indicators if the quality of their results depends on the coverage and quality of data from national agencies. This section provides a brief review of the national applicability of global biodiversity indicators and their dependence on national data sets. It then discusses some of the possible reasons for barriers to greater linkages between global and national biodiversity indicators. Table 5. Summary of whether CBD global indicators are applicable at national level, and whether they rely on national-level data sets. CBD global indicator framework Focal Area and Headline Indicator Status and trends of the components of biodiversity Trends in the extent of selected biomes, ecosystems, and habitats Applicable at national level? Extent of forests and forest types Yes Yes Extent of marine habitats Yes Yes Trends in abundance and distribution of selected species Living Planet Index Yes No Global Wild Bird Index Yes Yes Coverage of protected areas Coverage of protected areas Yes Yes Protected area overlays with biodiversity Yes No Management effectiveness of protected areas Yes Yes Change in status of threatened species IUCN Red List Index Yes No Trends in Genetic Diversity Ex-situ crop collections Yes Yes Genetic diversity of terrestrial domesticated animals Yes No Sustainable Use Areas under sustainable development Area of forest under sustainable management: certifi cation Yes Yes Area of forest under sustainable management: degradation Yes No and deforestation Area of agricultural ecosystems under sustainable Yes Yes management Proportion of products derived from sustainable sources Status of species in trade Yes Yes Wild Commodities Index Yes No Ecological Footprint and related concepts Ecological Footprint Yes Yes Global indicator reliance on nationally reported data? 62 BIODIVERSITY INDICATORS & THE 2010 BIODIVERSITY TARGET
64 CBD global indicator framework Focal Area and Headline Indicator Threats to biodiversity Nitrogen deposition Applicable at national level? Nitrogen deposition Yes No Status of invasion and trends in invasive alien species impacts and policy Trends in invasive alien species Yes Yes Ecosystem integrity and ecosystem goods and services Marine Trophic Index Marine Trophic Index Yes Yes Water quality of freshwater ecosystems Yes No Connectivity/fragmentation of ecosystems Forest fragmentation Yes No River fragmentation and fl ow regulation Yes Yes Health and well-being of communities Health & well-being of communities directly dependent on Yes No local ecosystem goods & services Biodiversity for food and medicine Nutritional status of biodiversity No No Biodiversity for food and medicine Yes Yes Status and trends of linguistic diversity and numbers of speakers of indigenous languages Status and trends of linguistic diversity and numbers of speakers of indigenous languages Status and trends of linguistic diversity and numbers of speakers of indigenous languages Yes Yes Status of resource transfers Offi cial Development Assistance provided in support of the Convention on Biological Diversity Offi cial Development Assistance provided in support of the Yes Convention on Biological Diversity Global indicator reliance on nationally reported data? Yes All the global headline indicator methods can in principle be applied at the national scale, but require an understanding of their scientifi c concept and data requirements. Table 5 shows that in principle the methods of all of the CBD global headline indicators can be applied at a national scale. This is most straightforward for the global indicators which rely on data reported at the national level, such as coverage of protected areas. For some global indicators there are conceptual issues which need to be considered before their application at national level. This is the case for the IUCN Red List Index and River Fragmentation, where the unit of analysis may well not fit within national boundaries, such as the global population of a species covering many countries, or a multinational river system. A national calculation for these indicators would first need to determine the appropriate scale and boundaries for including data, such as nationally endemic species, discrete national populations of species or river basins and sub-basins. Most of the technical challenges in the application of global indicator methods to a national or regional scale relate to limitations in obtaining appropriate and sufficient data. Their application requires an understanding of the scientific concept of the indicator and its data requirements to obtain a scientifically defensible result. The CBD headline global indicators are rarely used at the national scale. From the experience of conducting the 2010 BIP regional capacity building workshops involving 45 countries in south-east Asia, the Caribbean, Central America, and eastern and southern Africa, almost none of the CBD headline global indicators are currently calculated at the national level in these countries. The two main exceptions are some form of coverage of protected areas and extent of forests, both of which are indicators within MDG 7. There is a national Living Planet Index in Uganda where the LPI global Partners have worked with national Partners; and the Ecological Footprint and biocapacity values are calculated and available for most countries. OUTPUTS, EXPERIENCES AND LESSONS LEARNT FROM THE 2010 BIODIVERSITY INDICATORS PARTNERSHIP 63
65 One reason for the weak linkages between global and national biodiversity indicators is that they are often intended for different users and purposes. The motivations for global-scale indicators are usually to provide information and understanding: for reporting on global targets and implementation (e.g., CBD, MDGs); as a communication tool to raise awareness of important issues (e.g., IUCN Red List Index for threatened species); to support global-scale strategic planning and prioritisation (e.g., the GEF). Recognizing that actions and policies are usually taken and developed at national level, thus making the availability of indicators at national level of great importance, the aims of national-scale indicator development commonly include: to aid the design and monitoring of conservation strategies (e.g., NBSAPs, protected area systems); to assist the development of policies and management plans for commercially important biodiversity (e.g., timber production, fisheries, wildlife tourism); to raise awareness and actions for topics of importance to interest groups, including NGOs and academia, (e.g., threatened species or sites, pollution problems, compliance with international agreements). National production of biodiversity indicators requires institutions with this capacity and responsibility. From the 2010 BIP workshops it was evident that most countries were working to include indicators in their CBD fourth National Reports, but indicators were often compiled on an ad hoc basis for the reporting exercise, rather than as part of long-term monitoring and decision-support processes. The exceptions tend to be larger and relatively well-resourced countries with a dedicated biodiversity information institution, such as China, South Africa, Brazil, Mexico and UK. At the CBD expert workshop on the 2010 Biodiversity Indicators and Post-2010 Indicator Development in Reading, UK in July 2009 an analysis was presented of the biodiversity indicators included in fourth National Reports to the CBD by that date (UNEP-WCMC 2009b). From the reports the majority of developing countries identified constraints to routinely applying indicators that included lack of capacity, lack of consistent trend data, absence of ecological baselines against which change is measured and lack of established monitoring systems. Particular issues included: Marginalisation of environmental ministries and limited knowledge of the definition of indicators to measure progress towards the 2010 CBD target. Although there are often data available on various aspects of biodiversity many of the data sets are one-off studies, often covering only a portion of a country. As a result, it has been a challenge to find ways of integrating different data sets and making them comparable to produce time series statistics. A lack of institutional responsibility and accountability for biodiversity survey and monitoring makes it very difficult for some countries to establish and verify biodiversity trends. Data ownership and management were common problems. Many government institutions do not have data management structures in place so that data are often person-bound rather than institution-bound. Sustaining robust biodiversity monitoring systems over time is a major challenge in some cases, particularly after donors exit. The existence of institutional capacity for the on-going production of national biodiversity indicators is obviously a key factor in the effectiveness of provision of biodiversity information for implementation of the CBD. This capacity includes the existence of professionals able to understand the appropriate scientific and statistical procedures for gathering, analysing and presenting data for some of the more complex indicators, such as indices derived from multiple data sources. The experience of the 2010 BIP workshops, and especially where on-going technical assistance can be provided as in eastern and southern Africa, is that major progress can be made in establishing a few straightforward indicators, such as coverage of protected areas and trends in key wildlife species. Some relevant data and monitoring systems often exist, but these data need to be systematically collated and interpreted in the form of indicators. National biodiversity indicators are developed to meet national needs but there are opportunities for greater linkages with global indicator development. The 2010 BIP workshops found that the CBD global indicators were sometimes misunderstood as being a reporting requirement for countries, rather than being part of, a flexible framework within which national and regional targets may be set, and indicators identified, where so desired by Parties (CBD COP 7 Decision VII/30). Many countries have reported biodiversity indicators in their third and fourth National Reports to the CBD which are broadly within the seven focal areas of the CBD global indicator framework, but are not using the same methods as the global headline indicators. 64 BIODIVERSITY INDICATORS & THE 2010 BIODIVERSITY TARGET
66 Most national indicators are primarily developed to meet national priorities rather than international reporting processes, which has been encouraged by the capacity building activities of the 2010 BIP. However, there are many opportunities for improving the alignment between national and global biodiversity indicators. This would not only strengthen the global indicators but also assist countries and regions to develop comparable indicators and analyses. From the 2010 BIP workshops it was evident that there was no apparent motivation or mechanism for countries to contribute to global biodiversity indicators, except for the existing mechanisms for reporting on coverage of forests and protected areas (which is partly why they are included as indicators for MDG-7). The 2010 BIP, including through its website and guidance materials, has assisted in helping countries to understand the global biodiversity indicators that exist and are in development, highlighting indicator methodology and communications that might be useful and relevant to their national needs. However, it will also often require investment by the lead agencies for the global indicators to promote their use and the necessary capacity at the national level. A recent example is the launch of national Red Listing advice ( to provide a link between global and national/regional level species threat assessments. The 2010 BIP supported the development of a Red List Index calculation tool that is available both at the National Red List website and THE WAY FORWARD: NATIONAL INDICATOR DEVELOPMENT BEYOND 2010 An analysis of capacity building needs for developing national biodiversity indicators was conducted in April 2010 at the final regional workshop of the eastern Africa biodiversity indicators capacity building project. The participants reviewed their experience over one year of producing biodiversity indicators and considered the steps in the biodiversity indicator development framework (Annex 3). Their conclusions were focused on making recommendations to the discussions by CBD Parties during 2010 for the revision of the CBD Strategic Plan, which were included an information paper for the CBD SBSTTA 14 meeting in May 2010 (UNEP/CBD/ SBSTTA/14/INF/12) and summarised as follows: National biodiversity indicators are vital for effective conservation, sustainable use and equitable sharing of biodiversity resources. Their role includes raising understanding of how biodiversity is part of addressing priority development issues such as poverty reduction and climate change. The participants in the 2010 BIP recognised that they cannot achieve their mandates or objectives without relevant and accessible information on biodiversity. This includes being able to communicate the importance of biodiversity in sustaining development and its inclusion in development policies. National indicators have been produced for populations of key mammals and birds that are important for wildlife tourism, are threatened species, are important for achieving protected area objectives, and as indicators of the status of biodiversity and the environment at the national level. Indicators are also being developed on the coverage of important habitats and ecosystems, coverage of conservation areas, harvest levels of fish stocks, human-wildlife conflict, wildlife diseases, invasive alien species, and other topics. It has been noticed that there is very little awareness or use of biodiversity indicators at all levels (technical, scientific, and policy). The participating countries in the 2010 BIP have shown that some relevant national biodiversity indicators can be produced, but there is frequently inadequate or inaccessible data for biodiversity indicators to answer priority national questions for policy and monitoring. The lack of awareness of biodiversity indicators is often partly due to limited understanding of the topic of biodiversity amongst many sectors of society, and can also be due to a limited use of science-based information in decision-making. The challenge of a lack of data is universally identified as a major limitation in the production of biodiversity indicators. Capacity building assistance can help to convert existing data into useful indicators. Biodiversity indicators need to be developed to address national biodiversity and development priorities, including NBSAPs. Whilst reporting on progress towards international targets and agreements is important this was viewed as a secondary priority to addressing national priorities. Examples of national priorities include the maintenance of protected area systems, inclusion of biodiversity concerns in land use policies for investment in biofuels, sustainable fisheries management, and land degradation. The long-term investment in the production of biodiversity indicators can only be sustained if they are seen to be useful and in demand to meet national priorities. Countries need to have an effective national institution to coordinate their national biodiversity indicators. In many developing countries the gathering and communication of biodiversity information is on an ad hoc and fragmented basis, such as for periodic reporting requirements. The capacity to have biodiversity OUTPUTS, EXPERIENCES AND LESSONS LEARNT FROM THE 2010 BIODIVERSITY INDICATORS PARTNERSHIP 65
67 indicators and other information available for effective decision-making requires the existence of a responsible institution for this. It is not necessary for one institution to conduct all the activities of collection of data, calculation of indicators, and their communication to users. Agreements between government agencies, NGOs and academic institutions can fulfill many of these roles. However, the existence of one national coordinating institution is essential. National statistical offices have a key leadership role in the institutionalisation of biodiversity indicators, as they can validate and provide credibility to the indicators for non-environmental sectors of government and wider society; as well as often having a familiarity with indicator development and communication that can be shared with the environmental government sector. Developing countries need financial and technical support to institutionalise and operationalise biodiversity indicators. Without additional financial and technical support it is likely that the reasons will remain for a lack of biodiversity indicators in decision-making by government and the rest of society in developing countries. Networking and collaboration by government institutions, NGOs and other stakeholders within countries and regions signifi cantly strengthens progress in national indicator development and use. The organization of regional workshops and the multi-stakeholder collaborations have been a very effective means of capacity building and a stimulation of results within countries. The use of a common framework (Annex 3) to guide the design of indicator development and learning has greatly aided progress. The Partners in the 2010 BIP will continue to seek ways to support the development and use of national and regional biodiversity indicators in conjunction with global indicator development. It is intended that one of the mechanisms to achieve this will be the further development of the National Biodiversity Indicators Portal (www. bipnational.net). This will share the Partnership s extensive knowledge and experience in regional and national indicator development and be the online resource for countries and regions looking to develop and use biodiversity indicators. As well as providing online guidance materials the portal will allow nations to share their experiences and lessons learnt from indicator development. 66 BIODIVERSITY INDICATORS & THE 2010 BIODIVERSITY TARGET


. The first section of the report is an assessment of progress towards the 2010 Biodiversity Target based on data and analyses produced by the 2010 BIP.")

.")

 in 2011 to develop further advice on")

68 6. CONCLUSIONS AND THE WAY FORWARD EXPERIENCES AND LESSONS LEARNT FROM THE 2010 BIP There are a range of experiences and lessons from the 2010 BIP that we anticipate will help the development of the Partnership, and other coordination and facilitation mechanisms, beyond In this section a range of issues relating to the organization and operation of the 2010 BIP, its outputs, communication and identity are discussed. The 2010 BIP has provided an integrated assessment of global indicator trends, which has formed the basis for the CBD report on progress towards the 2010 Biodiversity Target. The 2010 BIP was principally established to enable improved reporting and decision-making at the global scale on the CBD s 2010 Biodiversity Target. The primary global audience therefore has been the Parties and Secretariat of the CBD, as well as other Conventions such as Ramsar. The first major opportunity for the 2010 BIP to communicate its results to the CBD process has been through the CBD Secretariat s Global Biodiversity Outlook 3 (GBO-3) report, which was launched at the SBSTTA 14 meeting in May 2010 (SCBD 2010). The first section of the report is an assessment of progress towards the 2010 Biodiversity Target based on data and analyses produced by the 2010 BIP. This collaboration between the 2010 BIP and the CBD Secretariat was a very effective way to make technical information from the indicators accessible to a largely non-technical audience. The 2010 BIP has enhanced awareness amongst scientists and policy-makers of indicator development and future needs. The Partners and Secretariat of the 2010 BIP played a central role in the International Expert Workshop on the 2010 Biodiversity Indicators and Post-2010 Indicator Development, convened by UNEP- WCMC in cooperation with the Secretariat of the CBD in July 2009 (UNEP-WCMC 2009a). The workshop brought together over 70 participants including government nominated experts and representatives of biodiversity-related conventions, UN agencies, academic and research institutions and other relevant international, intergovernmental and non-governmental organizations to review the use and effectiveness of the 2010 biodiversity indicators and to consider the implications for the development of post-2010 targets and indicators. The 2010 BIP Partners also published an assessment of the state of indicator development in the run-up to 2010 (Walpole et al. 2009). Building on these activities, both Partners and Secretariat are well-placed to provide significant input to the proposed CBD Ad Hoc Technical Expert Group (AHTEG) in 2011 to develop further advice on future monitoring of biodiversity under the Convention and the use of global indicators, as recommended by SBSTTA 14. Accessible information on the global indicators has been well received. The integrated analyses of the indicator set made possible by the 2010 BIP has yielded clear, strong messages which have been widely and vigorously communicated by the CBD and which have resonated with policy audiences. At the same time, the provision of detailed and up-to-date information on the indicators in accessible media has proved successful. Available in all six UN languages and Japanese, the 2010 BIP website forms the primary outlet for detailed information on each of the 27 indicators as well as the latest news from the Partnership. The site receives around 1,000 visits per week from 132 countries, with this figure increasing on a weekly basis as international awareness of the Partnership continues to grow amongst a range of audiences. The general public was envisaged to be a key audience for the 2010 BIP and the development of the website and associated products, such as indicator factsheets and newsletters, have been well received by the Partners as a means to reach this audience. Engagement with the scientific community has been important for the credibility of the indicators. During the development of the indicators, and especially for their integrated analysis to assess progress towards the 2010 Biodiversity Target, the 2010 BIP worked to ensure the scientific credibility of the indicators and resulting analyses. The two papers authored by 2010 BIP Partners in the journal Science (Walpole et al. 2009, Butchart et al. 2010a) have contributed to ensuring transparent peer review. Equally, Partners have implemented their own indicator peer review processes, including in several cases publishing indicator methodologies and results in academic journals. The 2010 BIP Scientific Advisory Body, part of the original governance structure of the GEF project, has not been utilized for scientific oversight as originally anticipated, in part because its functions have been delivered through these other processes. OUTPUTS, EXPERIENCES AND LESSONS LEARNT FROM THE 2010 BIODIVERSITY INDICATORS PARTNERSHIP 67
69 There is a signifi cant national-level demand for information and support for biodiversity indicators. Another primary audience for the 2010 BIP has been national and regional biodiversity indicator developers. The original aim was for the national governments and regional organizations to be using the global indicators, contributing to their improved delivery through the provision of data. The experience of the 2010 BIP regional capacity building workshops found that most developing countries were not seeking to utilise the CBD global indicators beyond ad hoc information gathered for the CBD fourth National Reports. Given the broad definitions of many of the global headline indicators (e.g., trends in abundance and distribution of selected species), if countries were already producing biodiversity indicators they often fitted within these global indicator categories. National government agencies and NGOs were usually keen to produce at least a few biodiversity indicators. They wanted to understand the CBD global indicator framework, but their choice of indicators for reporting over time reflected national priorities and availability of data. Another limitation on national adoption of the global indicators is that the methods for several of them have not yet been fully developed, especially for their use at national scale. Four of the global headline indicators rely on data reported at the national scale: Forest extent (FAO), Coverage of protected areas, Marine Trophic Index, and Ecological footprint. The 2010 BIP has not had any impact on increasing the national data availability for these indicators or national linkages with the other global indicators. A few of the 2010 BIP Partners carry out activities for promoting the national adoption of their indicators, such as the Ecological footprint, Red List Index and Living Planet Index. The national capacity building activities of the 2010 BIP have aimed to promote understanding and skills in successful indicator development in response to national priorities, rather than training in particular indicators. The audience for this has been not only government agencies responsible for CBD implementation and reporting, but also NGOs active in gathering and using biodiversity information, research institutes, and a particularly strong enthusiasm for this work by national statistical agencies in eastern and southern Africa. It is expected that any post-2010 work of the Biodiversity Indicators Partnership will include a greater focus on national capacity building, including facilitating the sharing of experiences and lessons learnt between national and global indicator developers. Partnership meetings have been an essential means for establishing and building the 2010 BIP as an effective Partnership. With over 40 internationally distributed agencies involved, efforts to engender a sense of shared purpose and identify opportunities for greater collaboration have taken time. The 2010 BIP was first established in 2005 with the support of GEF PDF-B funding to develop the full project design and proposal for submission in This preparation involved two meetings of potential Partners and definition of the project s objectives, organization and activities. These meetings started the identification of the technical and information gaps for reporting on the CBD global indicator suite, and formed the basis for the selection of indicators to be further developed and Partners for this. Annual technical meetings of the Partners in 2008, 2009 and 2010 have been vital for building the relationships between the 2010 BIP Secretariat and the Partners to enable the development and reporting of the indicators and collaboration on joint products. The earlier meetings mostly addressed strategic and operational issues of the 2010 BIP, but at the request of the Partners the last two meetings included technical sessions to share experiences on the design and communication of the indicators, both individually and as a suite. At these meetings the added value of the Partnership as more than the sum of its parts started to be more fully realised. The 2010 BIP as a Partnership has been strengthened through collaboration on joint products. The basis of a Partnership is that Partners participate by giving and receiving benefits towards a common purpose, but the amount of resources or benefits a partner receives will obviously affect their level of participation. Where Partners in the 2010 BIP received little or no funding they had less incentive for participation in Partnership activities and reporting. As the profile and products of the 2010 BIP became more established during 2009 and 2010 the involvement of some Partners increased. The collaboration on products requiring the input of all the Partners and which are of clear mutual benefit, such as GBO-3 and the papers for Science, provided an essential focus and stimulus for the Partnership to realise its potential. 68 BIODIVERSITY INDICATORS & THE 2010 BIODIVERSITY TARGET
70 The role of the Secretariat and other governance structures is a balancing act between leadership and facilitation. The role of the 2010 BIP Secretariat at UNEP-WCMC has evolved along with the establishment of the Partnership. Following invitation by the CBD, UNEP-WCMC originated the project concept and led the design process, building on its own technical capacity and previous experience supporting indicator development. The Secretariat has sought to find an appropriate balance of responding to the collective decisions of the Partnership and providing leadership or vision when this is required. The initiation and implementation of all the 2010 BIP s communication products, including the website and presentations at international meetings, has been conducted by the Secretariat with consultation and input from the Partners. The input of the Steering Committee has increased over the life of the 2010 BIP, particularly in 2010 for discussions on the post-2010 future of the Partnership. The role of Partners in promoting and communicating the 2010 BIP can be enhanced. One of the challenges for the 2010 BIP, as a newly created body, is the definition and communication of an appropriate identity in relation to the roles and marketing of its many Partners. The 2010 BIP is not a legal entity but it has been the intention to create an identity for the Partnership, as a collaboration and website to track global biodiversity trends, and also as a resource of information and expertise to support national and regional biodiversity indicators. The 2010 BIP Communications Strategy has carefully sought to not compete with the communication work of the Partners, but to provide a complementary means to raise awareness of their work and add value as a coordinated suite of global indicators and collaborative products. The Partners have to some extent included weblinks and promotion of the 2010 BIP in their work, but much of this promotional role has fallen to the Secretariat. It has taken time to establish the identity of the 2010 BIP with the Partners as more than a GEF-funded project with a finite lifespan. The inclusion of the year 2010 in the name of the 2010 BIP and its website address ( net), which is obviously beneficial for reporting on the 2010 Biodiversity Target, could be a constraint when considering the future of the Partnership. OUTPUTS, EXPERIENCES AND LESSONS LEARNT FROM THE 2010 BIODIVERSITY INDICATORS PARTNERSHIP 69
71 THE WAY FORWARD: THE PARTNERSHIP BEYOND 2010 There is a recognized need for an ongoing Biodiversity Indicators Partnership. In October 2010 the CBD COP 10 will decide on a new Strategic Plan of the Convention for the period , which is expected to include a Vision statement and a framework of up to 20 targets to be achieved by The framework of targets will cover many aspects of the Convention and its implementation, including emerging topics such as ecosystem services and resilience. Recommendation 3/5 of the third meeting of the Working Group on Review of Implementation of the Convention on the framework states that, The targets comprise both: (i) aspirations for achievement at the global level, and (ii) a flexible framework for setting national targets. Parties would be invited to set their own targets within this flexible framework, taking into account national needs and priorities, while also bearing in mind national contributions to the global aspirations established by the targets. SBSTTA also recommended that COP 10 recognizes the need to continue strengthening our ability to monitor biodiversity at all levels including through, inter alia, (i) building on and continuing the work of the 2010 BIP in delivering global indicators for the post-2010 period... and (iv) Supporting national and regional efforts to establish or strengthen biodiversity monitoring and reporting systems to enable Parties to... assess progress towards biodiversity targets established at national and/or regional level. These recommendations reflect recognition that tracking global biodiversity change and its implications requires the combined effort of multiple stakeholders, building from local/national foundations to create a global picture, and facilitating the sharing of information and experiences among and between scales. An ongoing partnership will expand its membership, and its efforts to support indicator capacity development, in order to meet the needs of the new CBD Strategic Plan. It is therefore concluded that an indicators Partnership of some description, building on the 2010 BIP and continuing beyond 2010, would be broadly welcomed. The potential focus of such a Partnership beyond 2010 is envisaged to: extend the capacity and resources established through the 2010 BIP at the global and national levels in order to respond to the new CBD strategic plan and targets that will be agreed in Nagoya, and in doing so develop indicator information and capacity that can support the proposed Intergovernmental Platform on Biodiversity and Ecosystem Services (IPBES). expand participation in the Partnership established under the 2010 BIP to produce new biodiversity (and related) indicators required for the CBD Strategic Plan, including a wider range of data providers, particularly in the realms of pressures/ threats and ecosystem services/benefits. This will be conducted in close coordination with the Secretariats of the CBD and other MEAs and their processes to develop indicators. Analyses of the combined indicators will support global biodiversity reporting and strategy development, as well as providing guidance for national indicators and analyses and stories from the combined suite of post-2010 (global) indicators. provide cost-effective support to many countries in gathering and using existing information in the form of indicators to assist in target-setting, developing strategies and reporting on progress. This will be achieved through a combination of regional and in-country capacity building workshops and technical support, and the development of a biodiversity indicators hub website. This website will provide e-learning courses on biodiversity indicator development and use, guidance on the CBD 2020 targets and relevant indicators, case studies, and results of indicators in use. Its content will be developed from the national capacity building work, and will be available in all UN languages. The Partnership will also make available to national indicator developers the expertise of global indicator organizations. It is therefore concluded that an indicators Partnership, building on the 2010 BIP and continuing beyond 2010, would be broadly welcomed to ensure the coordination and further development of a coherent set of relevant, timely and robust indicators from multiple sources and for multiple purposes. In particular, this renewed Partnership will ensure a significantly increased level of national indicator development and indicatorbased progress reporting, with consequently improved breadth and coverage of global indicators available and communicated. 70 BIODIVERSITY INDICATORS & THE 2010 BIODIVERSITY TARGET


 National Indicators Show Biodiversity Progress: Response.")
. 2010. Global Biodiversity Outlook 3.")


72 7. REFERENCES Alkemade, R., van Oorschot, M., Miles, L., Nellemann, C., Bakkenes, M. & ten Brink, B GLOBIO3: A Framework to Investigate Options for Reducing Global Terrestrial Biodiversity Loss. Ecosystems 12: Butchart, S.H.M., Walpole, M., Collen, B., van Strien, A., Scharlemann, J.P.W., Almond, R.E.A., Baillie, J.E.M., Bomhard, B., Brown, C., Bruno, J., Carpenter, K.E., Carr, G.M., Chanson, J., Chenery, A.M., Csirke, J., Davidson, N.C., Dentener, F., Foster, M., Galli, A., Galloway, J.N., Genovesi, P., Gregory, R.D., Hockings, M., Kapos, V., Lamarque, J.F., Leverington, F., Loh, J., McGeoch, M.A., McRae, L., Minasyan, A., Morcillo, M.H., Oldfield, T.E.E., Pauly, D., Quader, S., Revenga, C., Sauer, J.R., Skolnik, B., Spear, D., Stanwell-Smith, D., Stuart, S.N., Symes, A., Tierney, M., Tyrrell, T.D., Vié, J.C. & Watson, R. 2010a. Global Biodiversity: Indicators of Recent Declines. Science 328: Butchart, S.H.M, Baillie, J.E.M., Chenery, A.M., Collen, B., Gregory, R.D., Revenga, C. & Walpole, M. (2010b) National Indicators Show Biodiversity Progress: Response. Science 329: Cambridge Conservation Initiative Joined-up indicators guide policy better. UNEP-WCMC, University of Cambridge, BirdLife International & 2010 Biodiversity Indicators Partnership, Cambridge, UK. 8pp. SCBD (Secretariat of the Convention on Biological Diversity) Global Biodiversity Outlook 3. CBD, Montréal, Canada. 94pp. UNEP-WCMC. 2009a. International Expert Workshop on the 2010 Biodiversity Indicators and Post-2010 Indicator Development. UNEP-WCMC, Cambridge, UK. 65pp. UNEP-WCMC. 2009b. The 2010 Biodiversity Indicators and the Post-2010 Indicators Framework: Background Review Document for Reading Workshop Participants. UNEP-WCMC, Cambridge, UK. 45pp. Walpole, M., Almond, R.E.A., Besançon, C., Butchart, S.H.M., Campbell-Lendrum, D., Carr, G.M., Collen, B., Collette, L., Davidson, N.C., Dulloo, E., Fazel, A.M., Galloway, J.N., Gill, M., Goverse, T., Hockings, M., Leaman, D.J., Morgan, D.H.W., Revenga, C., Rickwood, C.J., Schutyser, F., Simons, S., Stattersfield, A.J., Tyrrell, T.D., Vié, J.C. & Zimsky, M Tracking Progress Toward the 2010 Biodiversity Target and Beyond. Science 325(5947): Xu, H., Ding, H. & Wu, J National Indicators Show Biodiversity Progress. Science 329: 900. OUTPUTS, EXPERIENCES AND LESSONS LEARNT FROM THE 2010 BIODIVERSITY INDICATORS PARTNERSHIP 71
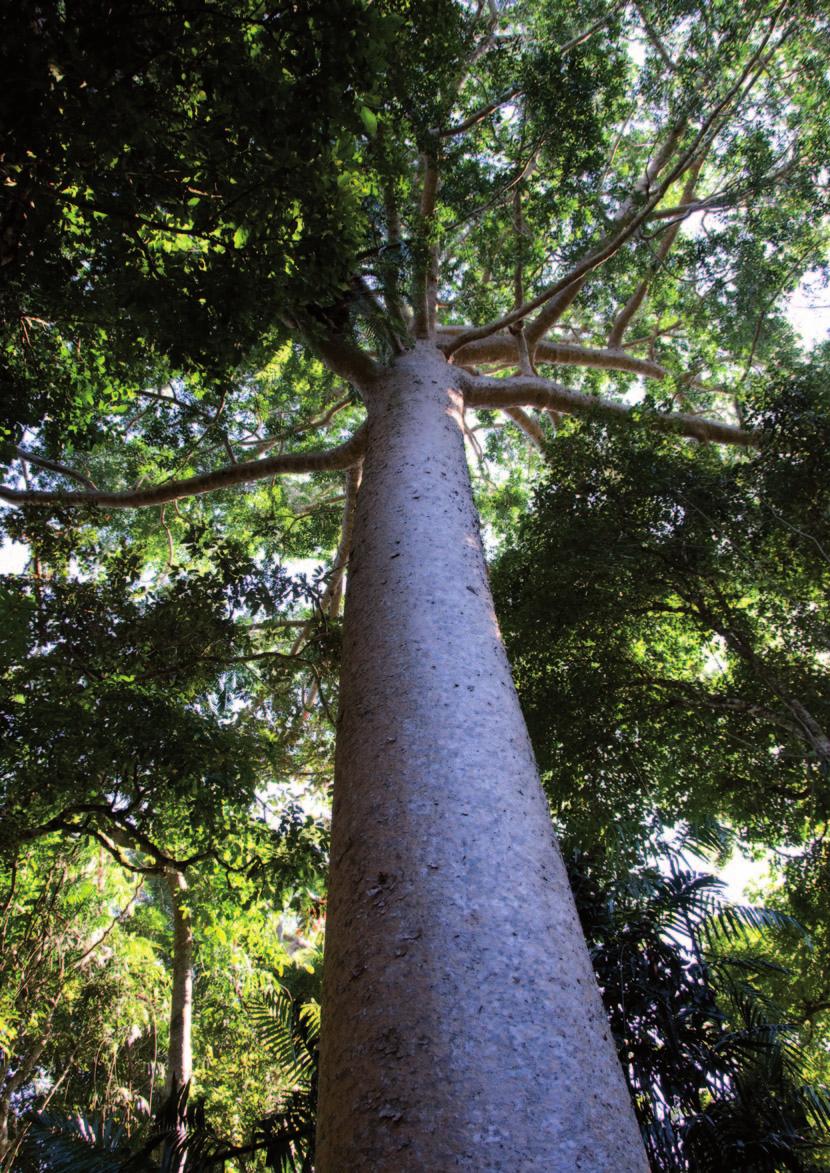
73


74 8. LIST OF ACRONYMS AND ABBREVIATIONS USED ACB AES AHTEG ASEAN BINU BIP CAFF CBD CBMP CI CCI CIESIN CITES CMS Centre for Biodiversity Agri-Environment Schemes Ad Hoc Technical Expert Group Association of Southeast Asian Nations Biodiversity Indicators for National Use Biodiversity Indicators Partnership Conservation of Arctic Flora and Fauna Working Group of the Arctic Council Convention on Biological Diversity Circumpolar Biodiversity Monitoring Program Conservation International Cambridge Conservation Initiative Center for International Earth Science Information Network Convention on the International Trade of Endangered Species of wild fauna & flora Convention on the conservation of Migratory Species of wild animals CONABIO Comisión Nacional para el Conocimiento y Uso de la Biodiversidad COP Defra DGEF DPSIR EC EEA EIA FAO GBIF GBO Conference of the Parties UK Department for Environment, Food and Rural Affairs Division of Global Environment Facility Coordination Drivers-Pressures-State-Impacts-Responses European Commission European Environment Agency Environmental Impact Assessment Food and Agriculture Organization of the United Nations Global Biodiversity Information Facility Global Biodiversity Outlook GEF GEMS GEO GFN GISP GNL GRI GRID GWBI IABIN IAEG IAS ICIMOD ICMM IIFB IISD ILRI INBio INFASA INI INWEH IOZ IPBES IRD Global Environment Facility Global Environment Monitoring System Global Environment Outlook Global Footprint Network Global Invasive Species Program Global-National Linkages Global Reporting Initiative Global and Regional Integrated Data centre Global Wild Bird Index Inter-American Biodiversity Information Network Interagency and Expert Advisory Group Invasive Alien Species International Centre for Integrated Mountain Development International Council on Mining and Metals International Indigenous Forum on Biodiversity International Institute for Sustainable Development International Livestock Research Institute Instituto Nacional de Biodiversidad International Forum on Assessing Sustainability in Agriculture International Nitrogen Initiative Institute for Water, Environment & Health Institute of Zoology Intergovernmental Platform on Biodiversity and Ecosystem Services L Institut de Recherche pour le Développement IT PGRFA International Treaty on Plant Genetic Resources for Food and Agriculture OUTPUTS, EXPERIENCES AND LESSONS LEARNT FROM THE 2010 BIODIVERSITY INDICATORS PARTNERSHIP 73
75 IUCN International Union for the Conservation of Nature SMART Strategic-Measurable-Achievable-Realistic- Time bound LPI Living Planet Index SRLI Sampled Red List Index MA Millennium Ecosystem Assessment SSC Species Survival Commission MDG Millennium Development Goal STRP Scientific and Technical Review Panel MEA Multilateral Environmental Agreement SUSG Sustainable Use Specialist Group MTI NBSAP NGO OECD Marine Trophic Index National Biodiversity Strategy and Action Plan Non-Governmental Organisation Organisation for Economic Co-operation and Development SwedBio TEEB TNC UBC Swedish International Biodiversity Programme The Economics of Ecosystems and Biodiversity The Nature Conservancy University of British Columbia PCU Project Coordination Unit UN United Nations PDF Ramsar Project Development Facility Convention on Wetlands of International Importance, especially as Waterfowl Habitat UNCCD UNCTAD United Nations Convention to Combat Desertification United Nations Conference on Trade and Development REDD RLI RSPB SANBI SBSTTA Reducing Emissions from Deforestation and Forest Degradation in Developing Countries Red List Index Royal Society for the Protection of Birds South African National Biodiversity Institute Subsidiary Body on Scientific, Technical and Technological Advice UNEP UNESCO UNU WBI WCC WCMC WCPA United Nations Environment Programme United Nations Educational, Scientific and Cultural Organization United Nations University Wild Bird Index World Conservation Congress World Conservation Monitoring Centre World Commission on Protected Areas SCBD SEBI2010 SIA SIAM Secretariat of the Convention on Biological Diversity Streamlining European 2010 Biodiversity Indicators Sustainability Impact Assessment or Social Impact Assessment Sistema de Información Ambiental mesoamericano WCS WGRI WHO WWF ZSL Wildlife Conservation Society Ad hoc open-ended Working Group on Review of Implementation of the CBD World Health Organisation World Wide Fund for nature (or World Wildlife Fund, North America only) Zoological Society of London 74 BIODIVERSITY INDICATORS & THE 2010 BIODIVERSITY TARGET

76 ANNEX 1. INDICATOR SYNOPSES, METADATA AND METHODOLOGIES Extent of forests and forest types Facts Focal Area: Status and trends of the components of biological diversity Headline Indictor: Trends in extent of selected biomes, ecosystems and habitats Key Indicator Partner/s: FAO Data Available: Regional/national time series of forest area ( ) Development Status: Ready for global use. For latest indicator development see: The Indicator Figure A1. Net change in forest area by country, (ha/year). Source: FAO 2010 Storyline The rate of deforestation- mainly the conversion of tropical forest to agricultural land - shows signs of decreasing in several countries but continues at a high rate in others. Around 13 million hectares of forest were converted to other uses or lost through natural causes each year in the last decade compared to 16 million hectares per year in the 1990s. Both Brazil and Indonesia, which had the highest net loss of forest in the 1990s, have significantly reduced their rate of loss, while in Australia severe drought and forest fires have exacerbated the loss of forest since Data Extent of forests The data source for extent of forests is national data in the form of standardized and officially validated country reports compiled by officially nominated National Correspondents to the Global Forest Resources Assessment (FRA) reporting process. The reporting process covers 233 countries and territories for four points in time (1990, 2000, 2005 and 2010). OUTPUTS, EXPERIENCES AND LESSONS LEARNT FROM THE 2010 BIODIVERSITY INDICATORS PARTNERSHIP 75
77 Data collection and management FAO has been collecting and analyzing data on forest area since This is done at intervals of 5-10 years as part of the Global Forest Resources Assessment (FRA). FRA 2010 contains information for 233 countries and territories on more than 90 variables related to the extent of forests, their conditions, uses and values for three points in time: 1990, 2000, 2005 and The national figures in the database are reported by the countries themselves following standardized format, definitions and reporting years, thus eliminating any discrepancies between global and national figures. The reporting format ensures that countries provide the full reference for original data sources as well as national definitions and terminology. Separate sections in the reporting format (country reports ) deal with the analysis of data (including any assumptions made and the methods used for estimates and projections to the common reporting years); calibration of data to the official land area as held by FAO; and reclassification of data to the classes used in FAO s Global Forest Resources Assessments. Officially nominated national correspondents and their teams prepare the country reports for the assessment. Some prepare more than one report as they also report on dependent territories. For the remaining countries and territories where no information is provided, a report is prepared by FAO using existing information and a literature search. Once received, the country reports undergo a rigorous review process to ensure correct use of definitions and methodology as well as internal consistency. A comparison is made with past assessments and other existing data sources. Regular contacts between national correspondents and FAO staff by and regional/sub-regional review workshops form part of this review process. All country reports (including those prepared by FAO) are sent to the respective Head of Forestry for validation before finalization. The data are then aggregated at sub-regional, regional and global levels by the FRA team at FAO. The data source for forest types is a global remote sensing survey which is based on a sapling approach. The survey covers the whole land surface of the Earth sampled through a systematic grid with a sample site of 10 x 10 km at each latitude and longitude degree intersection, equivalent to a sampling intensity of 1 percent at global level. Associated Data Standards Forest is defined in the Food and Agriculture Organization s (FAO) Global Forest Resources Assessment as land spanning more than 0.5 hectares with trees higher than 5 meters and a canopy cover of more than 10 percent, or trees able to reach these thresholds in situ. It does not include land that is predominantly under agricultural or urban land use. Data custodians (institutions) Food and Agriculture Organization of the United Nations. FRA@fao.org Data access and availability Data are freely available at Quality assurance procedures The country reports undergo a rigorous review process to ensure correct use of definitions and methodology as well as internal consistency. A comparison is made with past assessments and other existing data sources. Regular contacts between national correspondents and FAO staff by and regional/sub-regional review workshops form part of this review process. All country reports (including those prepared by FAO) are sent to the respective Head of Forestry for validation before finalization. The data are then aggregated at sub-regional, regional and global levels by the FRA team at FAO. Forest types Data Sources The data source for forest types is a global remote sensing survey which is based on a sapling approach. The survey covers the whole land surface of the Earth sampled through a systematic grid with a sample site of 10 x 10 km at each latitude and longitude degree intersection, equivalent to a sampling intensity of 1 percent at global level. 76 BIODIVERSITY INDICATORS & THE 2010 BIODIVERSITY TARGET
78 Data collection and management The FRA 2010 Remote Sensing Survey (RSS) uses satellite remote sensing of the Earth s surface to improve information on worldwide tree cover and forest land use. The main goal is to obtain systematic information on the distribution and changes in forest cover and forest land use from 1990 to 2000 and 2005 at regional, ecozone and global levels. Associated Data Standards For each sample plot, four Landsat images - dating from around 1975, 1990, 2000 and will be interpreted and classified and a change matrix prepared providing quantitative information on the magnitude of different land use change processes. FAO and its partner organizations will make rectified and pre-processed imagery available through an on-line information gateway and will develop the necessary training material. Data custodians (institutions) Food and Agriculture Organization of the United Nations. FRA@fao.org Data access and availability Data are freely available at Quality assurance procedures A systematic sampling design based on each longitude and latitude intersection has been implemented ( sites). Each sample tile covers a 10 by 10 kilometre square for which various Landsat optical bands of the GLS acquisitions were compiled, for the three dates ( individual imagery chips). As an experimental addition, for a portion of the sample tiles where persistent cloud cover obscures the forest, TerraSAR-X radar data augment the dataset. The image processing includes segmentation of the images into polygons based on similar satellite image characteristics and labeling these following a simplified form of the FAO land cover and land use classifications. Polygons, pre-labeled with draft land cover and use attributes, and the remotely sensed imagery are provided to countries and regional experts for validation. Through a series of regional training workshops, and in partnership with the European Commission s Joint Research Centre (JRC) and South Dakota State University (SDSU) in the United States, the RSS brings together leading land cover remote sensing scientists to analyse satellite data and engage with country experts in over 150 countries. A web-based data portal has been built to access the raw data, the pre-labelled land cover polygons and the final, validated land cover and land use attribution. The access to free remote sensing data and software will particularly benefit developing countries with limited forest monitoring data or capacity. Methods Information on the methods used is available via the Global Forest Resources Assessment website: fao.org/forestry/fra/en/ Extent of marine habitats Facts Focal Area: Status and trends of the components of biodiversity Headline Indictor: Trends in the extent of selected biomes, ecosystems, and habitats Key Indicator Partner/s: UNEP-WCMC, FAO Data Available: Global time series (Mangroves: 1980 onwards, with regional and national variations; Seagrasses: 1930s onwards), Regional case studies (Coral reefs: 1980s onwards) Development Status: Ready for global and national use. For latest indicator development see: OUTPUTS, EXPERIENCES AND LESSONS LEARNT FROM THE 2010 BIODIVERSITY INDICATORS PARTNERSHIP 77
79 The Indicator Area (m km 2 ) Mangrove Seagrass Coral Reef Mean Coral Reef Condition Figure A2. Extent of Mangrove and Seagrass, and Coral Condition. Source: Adapted with permission from Butchart et al. 2010a Storyline Mangroves: The FAO estimates that approximately 20% or 36,000 km2 of the world s mangroves have been lost between 1980 and The amount of mangrove forest area that has been lost is disturbingly high, however the rate at which mangroves are declining seems to have reduced more recently, falling from an average of 1,870 km2 (or- 1.10%) per year during the 1980s, to 1,185 km2 (-0.75%) in the 1990s, to 1,020 km2 (-0.67%) between This represents a 45% reduction in the annual rate of loss. Seagrass beds: A comprehensive assessment of global seagrass losses conducted on data from between 1879 and 2006 estimated that 29% of the known, measured area of seagrass beds had disappeared, equating to a global figure of 51,000 km2. The rate of decline is high (median = 0.9% per year) and has been accelerating since 1980 averaging greater than 5%, or 110 km2 of seagrass meadow lost per year. Coral reefs: It is thought that coral reefs have suffered a significant global decline in biodiversity since the 1970s or earlier, with coral cover in the Indo-Pacific and Caribbean regions falling by almost half during the 1980s before stabilizing but not recovering to earlier levels. There are also indications that both reef structure and the proportion of reefs with living coral has declined which has had further ramifications on levels of reef-associated biodiversity Data Three indicators were developed for the index Trends in the Extent of Marine Habitats : the extent of mangroves, the extent of seagrasses and the status of coral reefs. Trends for each habitat type were calculated at the global, national or regional level. Data sources and methodology are described for each indicator separately. Extent of Mangroves Data Sources The extent of mangroves indicator was based on 900 national or sub-national estimates of the area covered by mangroves provided in the following report from the Food and Agriculture Organization of the United Nations (FAO): FAO. 2007a. The World s Mangroves FAO Forestry Paper 153, Food and Agriculture Organization of the United Nations, Rome, Italy. URL: Trends were calculated at a global scale for four different time periods: 1980, 1990, 2000 and 2005, although note that extrapolation to 2005 was constrained by lack of recent estimates from a number of countries. Therefore the estimate for 2005 is indicative only. The indicator can be disaggregated into regional (Africa, Asia, North and Central America, Oceania and South America) and national estimates using the reference above and the following FAO country reports: 78 BIODIVERSITY INDICATORS & THE 2010 BIODIVERSITY TARGET
80 FAO. 2007b. Mangroves of Africa : Country Reports. Forest Resources Assessment Programme Working Paper 135 Food and Agriculture Organization of the United Nations, Rome, Italy. URL: forestry/40375/en/ FAO. 2007c. Mangroves of Asia : Country Reports. Forest Resources Assessment Programme Working Paper 136 Food and Agriculture Organization of the United Nations, Rome, Italy. URL: forestry/40375/en/ FAO. 2007d. Mangroves of North & Central America : Country Reports. Forest Resources Assessment Programme Working Paper 137 Food and Agriculture Organization of the United Nations, Rome, Italy. URL: FAO. 2007e. Mangroves of Oceania : Country Reports. Forest Resources Assessment Programme Working Paper 138 Food and Agriculture Organization of the United Nations, Rome, Italy. URL: fao.org/forestry/40375/en/ FAO. 2007f. Mangroves of South America : Country Reports. Forest Resources Assessment Programme Working Paper 139 Food and Agriculture Organization of the United Nations, Rome, Italy. URL: fao.org/forestry/40375/en/ Data collection and management The data collection process carried out by FAO first entailed a search for references containing recent reliable national information on the extent of mangroves from countries worldwide. Past estimates were also sought in order to facilitate an analysis of area changes over time in each country. Sub-national data for provinces and forests were included where available; in a few cases in which past estimates were lacking at the national level, the sub-national figures were used to create a composite national estimate to be used in trend analysis. Full details of how data were collected are provided in FAO (2007a). Frequency of surveys to estimate areal extent of mangroves varied from country to country, but were generally, at most, conducted once per year. Extraction and analysis of the data originally collected and reported on by the FAO, has occurred as a one-off for the development of this indicator for the 2010 BIP. All summary data is presented in FAO (2007a). Details of reference sources, area estimates and regressions used for individual countries are provided in the five regional working papers (listed above). All reports are available on-line in PDF format (see URLs listed above). Data extracted from these reports and used to calculate the extent of mangroves indicator have been entered into a database which is stored on site at the UNEP-WCMC. Associated Data Standards Not applicable Data custodians (institutions) Raw Data: Food and Agriculture Organization (FAO) of the United Nations, Rome ( Data used in indicator: UNEP-WCMC 219 Huntingdon Road, Cambridge CB3 0DL, UK Tel: +44 (0) Fax: +44 (0) Contact: Megan Tierney (Megan.Tierney@unep-wcmc.org). Data access and availability Summary data is freely available in FAO reports. These can be downloaded from the FAO website - full references and URLs are listed above. OUTPUTS, EXPERIENCES AND LESSONS LEARNT FROM THE 2010 BIODIVERSITY INDICATORS PARTNERSHIP 79
81 Quality assurance procedures Cross-checking of data was done by the FAO where possible and the information analyzed with the assistance of specialists. An initial screening of results included the weeding out of duplicates, discarding of rough guesstimates and selection of one estimate for the trend analyses for those years for which more than one was available. This was followed by regression analyses (best fit of linear, polynomial, logarithmic and power curves) of the most reliable data over time for each country, which provided estimates for 1980, 1990, 2000 and Drafts of the study were sent to all the official national correspondents for the global Forest Resources Assessment (FRA) process for comments and validation. Extent of Seagrasses Data Sources The seagrass indicator was based on 1128 seagrass measurements taken at 215 sites, using data from the following peer-reviewed publication: Waycott, M., Duarte, C.M., Carruthers, T.J.B., Orth, R.J., Dennison, W.C., Olyarnik, S., Calladine, A., Fourqurean, J.W., Heck, K.L. Jr., Hughes, A.R., Kendrick, G.A., Kenworthy, W.J., Short, F.T. & Williams, S.L Accelerating loss of seagrasses across the globe threatens coastal ecosystems. Proceedings National Academy of Sciences (PNAS) 106(30): URL: pdf+html?sid=e1f073ec-320c-498d-92cf-f88b87f59ad4 Additional data were sourced from: Green, E. & Short, F.T World Atlas of Seagrasses. Prepared by the UNEP World Conservation Monitoring Centre. University of California Press, Berkley, USA. URL: introduction.htm Trends in seagrass extent were calculated at a global scale for each decade spanning the period , although it should be noted that there is a lag of ~5 years between final measurements and reporting of results. Therefore data for the current decade is incomplete. All records pre-1930 were grouped to counter small sample sizes. Data collection and management Data was synthesized from extensive on-line Web of Science searches and requests for data through the Seagrass Forum ( list server, which resulted in 2,346 references. Of these, 70 references contained data that was judged suitable for inclusion in analyses. Full details of how data were collected and screened are provided in Waycott et al. (2009). The frequency of seagrass meadow surveys varied from country to country and site to site, but only studies with at least two estimates of areal extent that covered more than two years were included in analyses. Web of Science searches for data were conducted in February 2006 and again in October The final database was comprised of 215 sites (i.e., individual locations of study sites), 1128 events (i.e., 1 event = 1 measurement of seagrass area) sourced from 70 references. This database is provided in Waycott et al. (2009) as Supplementary On-line Material ( 498d-92cf-f88b87f59ad4). The data used to calculate the extent of seagrasses indicator have been entered into a database which is stored on site at UNEP-WCMC. Associated Data Standards Not applicable Data custodians (institutions) Raw Data: School of Marine and Tropical Biology. James Cook University. Townsville QLD, Australia Contact: Associate Professor Michelle Waycott ( michelle.waycott@jcu.edu.au) 80 BIODIVERSITY INDICATORS & THE 2010 BIODIVERSITY TARGET
82 Data used in indicator: UNEP-WCMC 219 Huntingdon Road, Cambridge CB3 0DL, UK Tel: +44 (0) Fax: +44 (0) Contact: Megan Tierney Data access and availability Summary data is freely available in Waycott et al. (2009) - full references and URLs are listed above. Quality assurance procedures Data verification checks were conducted, including independent checks of 63% of all site entries (136 of 215). Extent of Coral Reefs Data Sources The status of coral reefs was assessed by measuring the percentage cover of live hard coral. The indicator was developed for two regions: the Indo-Pacific and the Caribbean, although note that these regional estimates can be aggregated to produce a global indicator if the regional trends are weighted in relation to the area they cover. Data for the Indo-Pacific region was sourced from the following: Bruno, J. & Selig, E.R Regional decline of coral cover in the Indo-Pacific: timing, extent, and sub-regional comparisons. PLoS One 2: e711. URL : Additional, updated but unpublished data collated by Dr John Bruno Calculation of the indicator was based on 5825 surveys at 2590 reefs conducted between 1968 and 2004; although note, data prior to 1980 was excluded owing to small sample sizes. Data for the Caribbean region was sourced from: Shutte, V.G.W., Selig, E.R. & Bruno, J Regional spatio-temporal trends in Caribbean coral reef benthic communities. Marine Ecology Progress Series 402: URL: m402p115.pdf Calculation of indicator was based on 3,777 surveys at 1,962 reefs conducted between 1971 and A new dataset representing the global distribution of warm water coral reefs has been created from numerous data files and sources has been brought together by UNEP-WCMC. This global product will form one of the main data sources for this indicator in the future. For more information about this new dataset see Data collection and management Data was collected and synthesized for the Indo-Pacific and Caribbean indicators by conducting extensive on-line literature searches for both peer-reviewed and grey literature from academic, governmental, and NGO scientists, and trained volunteer organizations - e.g., Reef Check, as well as searches of all issues of relevant journals. The Caribbean indicator also incorporated raw data from monitoring programs such as CREMP, AGRAA, and Reef Check. Full details of data collection and synthesis are provided in Bruno & Selig (2007) and Shutte et al. (2010). Frequency of surveys to assess the status of coral reefs varied from region to region and site to site, with some sites only being surveyed once and others multiple times. Combining this data from both regions has occurred as a one-off for the development of this indicator for the 2010 BIP. Data Storage: Summary data is provided in Bruno & Selig (2007) and Shutte et al. (2010). Both publications are freely available on-line in PDF format (see URLs listed above). Raw data is stored and maintained by the respective authors and is available upon request. The data used to calculate the status of coral reefs indicator have been entered into a database which is stored on site at WCMC. Associated Data Standards Not applicable OUTPUTS, EXPERIENCES AND LESSONS LEARNT FROM THE 2010 BIODIVERSITY INDICATORS PARTNERSHIP 81
83 Data custodians (institutions) Indo-Pacific data: Department of Marine Sciences. The University of North Carolina at Chapel Hill. 340 Chapman Hall Chapel Hill, NC USA Contact: Dr John Bruno ( Caribbean data: Odum School of Ecology The University of Georgia 140 E. Green Street Athens, Georgia USA. Contact: Dr Virginia Schutte ( and Dr John Bruno (details as above). Data used in indicator: WCMC 219 Huntingdon Road Cambridge CB3 0DL Contact: Megan Tierney Data access and availability Summary data is freely available in published manuscripts - full references and URLs are provided above. Raw data is available upon request from the authors. Quality assurance procedures Only results from surveys that had been peer-reviewed or conducted by organizations using trained personnel were included in the analyses. Data from years with small sizes was excluded from the analyses. Repeated measures and non-independence were accounted for, as was the potential for especially well surveyed areas (e.g., the Great Barrier Reef and the Philippines) to bias results. Methods Extent of Mangroves Methods Used Trends in global and regional estimates of the areal extent of mangroves was calculated by summing the estimated area of mangroves measured in each country in four different time periods (1980s, 1990s, 2000s, ). Trends in the global estimates of the annual rate of change in the areal extent of mangroves was calculated from the global estimated area lost or gained in each time period (1980s, 1990s, ). Note that extrapolation to 2005 was constrained by lack of recent estimates from a number of countries. Technology/Systems in Use Estimates of the areal extent of mangroves at the country level were determined by regression analyses (best fit of linear, polynomial, logarithmic and power curves) on the most reliable data over time for each country, which provided estimates for 1980, 1990, 2000 and Peer Review The underlying data and drafts of the FAO report were sent to all official national correspondents for the FRA process for comments and validation. The indicator and methodology used to develop it, have not been subjected to a peer review process; however cuts have been provided for some collaborative projects, e.g., a synthesis of global biodiversity indicators reporting on progress toward reducing biodiversity loss, which have subsequently been published in peer reviewed journals (e.g., Butchart et al. 2010a). Procedures for maintenance and archiving No procedures are currently in place for indicator maintenance and archiving. 82 BIODIVERSITY INDICATORS & THE 2010 BIODIVERSITY TARGET
84 Extent of Seagrasses Methods Used The net and rate of change in areal extent of sea grasses was calculated for each decade from These decadal rates of change and net change were derived from data from 215 sites with at least two estimates of areal extent spanning periods of at least two years, applied to an estimate of global seagrass extent of 177,000 km2 in 2003 from Green and Short (2003). Full details of the statistical approach used are provided in Waycott et al. (2009). Note: there is a lag of ~5 years between final measurements and reporting of results. Therefore data for the current decade is incomplete. Also, all records pre-1930 were grouped to counter small sample sizes. Technology/Systems in Use The statistical approach for calculating this indicator is outlined above. Peer Review The underlying data were peer-reviewed prior to original publication. The indicator and methodology used to develop it have not been subjected to a peer review process; however cuts have been provided for some collaborative projects, e.g., a synthesis of global biodiversity indicators reporting on progress toward reducing biodiversity loss, which have subsequently been published in peer reviewed journals (e.g., Butchart et al. 2010a). Procedures for maintenance and archiving No procedures are currently in place for indicator maintenance and archiving. Extent of Coral Reefs Methods Used Trends in the regional estimates of the percent cover of coral reefs was calculated by summing the estimated percent cover of coral reefs measured in each sub-region for each year that data was available. A global estimate of the percent cover of coral reefs could be calculated from trends for the Caribbean and Indo-Pacific weighted by and respectively to account for the disparity in area of reefs in each region (26,000 km2 and 158,000 km2 respectively). Note pre-1980 data from the Indo-Pacific region was excluded from the analysis owing to small sizes. Technology/Systems in Use The statistical approach for calculating this indicator is outlined above. Peer Review The underlying data were peer-reviewed prior to original publication. The indicator and methodology used to develop it, have not been subjected to a peer review process; however cuts have been provided for some collaborative projects, e.g., a synthesis of global biodiversity indicators reporting on progress toward reducing biodiversity loss, which have subsequently been published in peer reviewed journals (e.g., Butchart et al. 2010a). Procedures for maintenance and archiving No procedures are currently in place for indicator maintenance and archiving Living Planet Index Facts Focal Area: Status and trends of the components of biological diversity Headline Indictor: Trends in abundance and distribution of selected species Key Indicator Partner/s: WWF, ZSL Data Available: Global time series, 1970 onwards Development Status: Ready for global use. For latest indicator development see: OUTPUTS, EXPERIENCES AND LESSONS LEARNT FROM THE 2010 BIODIVERSITY INDICATORS PARTNERSHIP 83
85 The Indicator Global Tropical Temperate Figure A3. Global Living Planet Index ( ) Source: WWF & ZSL Storyline The current global LPI shows a 30% decline from 1970 to 2005 meaning that on average, vertebrate populations have declined in abundance over this 35 year period. The temperate and tropical indices show contrasting results. The tropical index shows that vertebrate populations have declined markedly (about 60%) since 1970 whereas temperate populations have increased by an average of 18%. Although the tropical index reveals a worse trend than the temperate index, it does not necessarily imply that tropical biodiversity is in a worse state as temperate populations may have undergone similar declines before 1970 when pressures were already high in many temperate regions. Data Data sources The Living Planet Index (LPI) is based on abundance trend information from populations of vertebrate species of all five taxonomic classes (amphibians, birds, fish, mammals and reptiles), all three systems (freshwater, marine and terrestrial) and from all biogeographic realms and oceans globally, including Antarctica. This information can comprise actual counts, abundance or density estimates, catch per unit effort (CPUE) measures or a proxy measure of abundance. Data are gathered from a variety of published and unpublished sources, and as the study focus of such published research is often not the LPI, the indicator combines population information at all levels, including national and site level. For this reason, the LPI can be calculated for species populations from selected regions, biomes or taxonomic groups, depending on data availability, although it is used primarily as a measure of global biodiversity. Temporal coverage extends from about 1900 to 2010, although the index itself is based on records between 1970 and 2007 for reasons of data availability, reliability, and spatial and taxonomic coverage. Data collection and management Data are gathered from a variety of published and unpublished sources: principally scientific journals, but also government reports, wildlife and other natural resource management authority records, as well as databases from academic organisations and personal communications with experts. Data collection is ongoing through the use of journal alerts, but also dependent on the needs of specific projects, which will dictate the focus of targeted data collection, be it taxonomic or regional. Once collected, new population trend data and related information are added to the previously locally stored Microsoft Office Access database, which will be made available to a wider audience via an online web portal ( to be launched alongside the Living Planet Report 2010 this autumn. It contains both facilities to download and upload data, and will enable partner organisation collaborations and encourage greater data contribution to the indicator. 84 BIODIVERSITY INDICATORS & THE 2010 BIODIVERSITY TARGET
86 Associated Data Standards Data are entered into the LPI database only if certain criteria are met. The measure of abundance has to be collected from the same population using the same method and available for at least two years. Sightings, catch or landings data must contain a measure of effort (i.e., CPUE/SPUE). In addition, the units of measurement and geographic location including lat/long information have to be clearly stated, and the data source must be referenced and traceable. As most trend data are collected from peer reviewed journals, a high quality standard is already set. Standardised methods are used for coding additional information such as details of taxonomy, system, and biome to ensure temporal consistency in data management. Data custodians Institute of Zoology Zoological Society of London Regent s Park London NW1 4RY, UK WWF International Av. du Mont-Blanc 1196 Gland Switzerland Data access and availability The LPI database is currently locally stored on the premises of the Zoological Society of London and access is restricted to those working with the indicator on a daily basis. However, data cuts have been provided on request for a number of collaborative and independent projects, e.g., a Mediterranean wetlands LPI. Data are not freely available primarily for reasons of confidentiality, and direct contribution prohibited to ensure the highest possible data quality and consistency. While online storage was not previously feasible, this is set to change in the future, with the database launching an online web portal from Autumn 2010 ( This will make the LPI available to a wider audience, promoting not only further research and sparking collaborative projects, but also inviting data contributions, particularly from regions for which little trend information is published in peer reviewed literature. Ultimately, this will greatly strengthen the global indicator. Quality assurance procedures The coding is entirely based on reputable mostly online sources, such as taxonomic authorities like Wilson & Reeder, the IUCN Red List, the Global Register of Migratory Species, and the World Database on Protected Areas. Any interns working on the indicator are trained extensively and guidelines as to how to handle such coding and classification are presented in a dedicated user manual, which can be consulted at all times. Methods Methods Used Two complementary methods are used to generate index values: a chain method (Loh et al. 2005) and a generalized additive modelling technique(collen et al. 2009). The choice of method depends on the length of the time series, with time series of n>6 data points being processed using the GAM framework, and those that do not meet the criteria processed using the chain method. To calculate an index, the logarithm of the ratio of population measure for each species is calculated for successive years. Mean values are calculated for species with more than one population. The overall index is then calculated with the index value set to 1 in Due to its reliance on the published literature, non-random selection bias could result in an inaccurate index - to control for this, indices are produced weighting populations equally within species, and species weighted equally within each index. Indices for terrestrial, marine and freshwater systems are calculated as the geometric mean of tropical and temperate species, which are themselves equally weighted to produce the global trend. The LPI offers the possibility to assess the reliability of the estimate by examining the confidence interval, which can be customised by defining the desired number of bootstraps used for resampling (Collen et al. 2009, Loh et al. 2005). In addition, inflection points in the index can be identified using the bootstrap to identify time points at which the second derivative of the index differed significantly from zero (Collen et al. 2009), i.e., years in which the curvature of the index curve is statistically significant (Fewster et al. 2000). Using this method to assess changes in the rate of abundance is vital for assessing the progress towards the CBD 2010 target (Buckland et al. 2005). OUTPUTS, EXPERIENCES AND LESSONS LEARNT FROM THE 2010 BIODIVERSITY INDICATORS PARTNERSHIP 85
87 Technology/Systems in Use Microsoft Office Access and, in future, SQL Server is used for data storage, while the production of the indices relies on the latest R software. In terms of the index calculation, two different statistical approaches are employed depending on time series length: a chain method (Loh et al. 2005) and a generalized additive modelling technique (Collen et al. 2009). For the chain method, the logarithm of the ratio of population measure for successive years is calculated and one percent of the mean population measure value for the whole time series added to all years in time series for which N was zero in any year. Missing values are imputed with log-linear interpolation. For species with more than one time series, the mean value is calculated across all time series for that species. For time series with 6 or more data points, a generalized additive model (GAM) is implemented, specified with the mgcv package framework in R (Wood 2006). For each time series, a GAM is fitted on observed values with log10(nt) as the dependent variable and year (t) as the independent, and the smoothing parameter set to the length of the population time series divided by 2 (Wood 2006). The fitted GAM values are used to calculate predicted values for all years (including those with no real count data). A bootstrap resampling technique is used to generate confidence limits around index values. The procedure is repeated 10,000 times and the bounds of the central 9,500 I values for each year taken to represent the 95% confidence interval for the index in that year (Loh et al. 2005). Following (Fewster et al. 2000), inflection points in the index can be identified using the bootstrap to identify time points at which the second derivative of the index differs significantly from zero (see Collen et al. 2009) i.e., years in which the curvature of the index curve is statistically significant. Peer Review The indicator is based primarily on data published in peer reviewed journals, and its underlying methodology has been extensively described and reviewed in reputable scientific publications (Collen et al. 2009, Loh et al. 2005). In addition, the LPI has been applied to various data cuts (Butchart et al. 2010a, Craigie et al. 2010, Galewski et al. (in review)). Procedures for maintenance and archiving Throughout the development of the indicator, changes and decisions made have been documented. The database is archived through regular backups, any changes made to the structure are recorded and a user manual is kept up to date to ensure clear guidelines for accurate data entry are available Global Wild Bird Index Facts Focal Area: Status and trends of the components of biological diversity Headline Indictor: Trends in abundance and distribution of selected species Key Indicator Partner/s: RSPB & BirdLife International Associate Indicator Partners: European Bird Census Council, National Audubon, NABCI State of the Birds Subcommittee, Birds Australia, Museum National d Histoire Naturelle, Czech Society for Ornithology, Statistics Netherlands, SOVON, British Trust for Ornithology, Lund University, Dansk Ornitologisk Forening, BirdWatch Ireland, BirdLife Austria, Directorate of Nature Management Norway, Norwegian Institute of Nature Research, BirdLife Norway, Nord-Trøndelag University College, Swiss Ornithological Institute, Catalan Ornithological Institute, Centro Italiano Studi Ornitologici, LIPU, FaunaViva, Aves-Natagora, Zoological Museum of the Finnish Museum of Natural History, Finnish Game of Fisheries Research Institute, Finnish Environmental Institute, SPEA Latvian Ornithological Society and Latvian Fund for Nature. Data Available: Regional/national time series, 1980 onwards Development Status: Ready for sub-global use. For latest indicator development see: 86 BIODIVERSITY INDICATORS & THE 2010 BIODIVERSITY TARGET
88 The Indicator U.S. Forest Specialists (96) U.S. Grassland Specialists (24) U.S. Aridland Specialists (17) Europe Forest Specialists (29) Europe Farmland Specialists (36) All Specialists (202) Figure A4. Provisional Wild Bird Indices for two continental regions, North America and Europe The indicator is set to a value of 100 in Source: European Bird Census Council/RSPB/BirdLife International/Statistics Netherlands, and U.S. NABCI Committee State of the Birds 2009: United States of America. U.S. Department of Interior: Washington, DC. Storyline Bird population indices are currently only available from Europe and North America, but a wild bird index combining these data shows that specialist birds have declined by nearly 30% in 40 years. The largest population declines have occurred in grasslands and arid lands in North America and in farmed lands in Europe, whereas widespread specialists of forests show fluctuating but stable trends. There is the suggestion that bird populations in some of these categories have recovered in the last five years, but we do not know if this trend will continue. The wild bird index project seeks to mobilise relevant information on bird trends globally and encourage the establishment of breeding birds surveys in countries and regions where none exist. Data Data Sources The WBI currently combines national level data sources from 24 countries - the USA, Canada and 22 European countries. The WBI measures the average population trends in habitat specialist bird species. Data for Europe come from the European Bird Census Council/RSPB/BirdLife International/Statistics Netherlands Pan-European Common Bird Monitoring Scheme (Gregory et al. 2005), with trends based on data from 36 farmland and 29 forest species. Data for North America came from US NABCI Committee, State of the birds 2009: United States of America (U.S. Dept. Interior, Washington DC, 2009; and are based on longterm trend data from the North American Breeding Bird Survey (administered by the U.S. Geological Survey and Canadian Wildlife Service), the Christmas Bird Count (National Audubon Society) and the Waterfowl Breeding Population and Habitat Survey (U.S. Fish and Wildlife Service and Canadian Wildlife Service.) North American trends are based on data from 17 arid land, 24 grassland, 96 forest and 139 wetland obligate species. Trends are calculated as the geometric mean of indices for each habitat type in each region. As trends for terrestrial and wetland habitat specialists were substantially divergent, aggregated trends were also calculated separately for these two sets. OUTPUTS, EXPERIENCES AND LESSONS LEARNT FROM THE 2010 BIODIVERSITY INDICATORS PARTNERSHIP 87
89 Contributing national data cover different time periods, depending on the country: Austria ( ), Belgium ( ), Bulgaria ( ), Czech Republic ( ), Denmark ( ), Estonia ( ), Finland ( ), France (from two schemes, and , data from both schemes being combined), Germany (combining data from former East Germany and West Germany ), Hungary ( ), Ireland ( ), Italy ( ), Latvia (combining data from three different schemes, two old ones, differing in their regional coverage, covering the periods and , respectively, and a new one ), Netherlands ( ), Norway ( ), Poland ( ), Portugal ( ), Slovakia ( ), Spain ( ), Sweden (combining data from two schemes, and ), Switzerland ( ), United Kingdom ( ), United States and Canada ( ). The 22 European countries contribute data on population trends and indices of 136 common bird species in Europe, covering the time-period , whilst the USA and Canada contribute data for almost 500 species of North American birds at a continental scale. At present, not all of these species trends are incorporated in the WBI. Contributing data are generated at the local level so WBIs are scalable and can be aggregated or disaggregated at the global, regional and national (sub- national) level. WBIs can also be disaggregated by the habitat or guild a bird occurs in, or by aspects of species ecology, in order to aid interpretation. Data collection and management Data are based on surveys at a stratified-random or stratified-semi-randomized sample of sites and are likely to be geographically well representative within countries. European data is sourced from Bird Population Monitoring schemes that are designed to deliver robust and representative species indices. These indices can be updated annually, and are produced for most common bird species within participating countries, dependant on sample size. A number of different methodologies and survey designs are used. For example, in the UK, Poland and Bulgaria volunteers walk line transects to survey birds within randomly sampled 1km grid squares; in the Netherlands the scheme is based on territory mapping methods within sites chosen by observers; and in Hungary and Spain point count transects are used with a stratified sampling design. North American data (U.S.A. and Canada) is also taken from schemes providing consistent, long-term data. Longterm trend data comes from three primary bird population surveys. The North American Breeding Bird Survey (BBS) is administered by the U.S. Geological Survey and Canadian Wildlife Service and conducted at more than 4,000 sites in continental U.S.A. and southern Canada by volunteer observers: it has provided data for 365 breeding species since For 120 species that breed outside the area of reliable BBS coverage, but winter primarily within the U.S.A., trends come from the National Audubon Society s Christmas Bird Count. Finally, trends for 13 waterfowl species are provided by the U.S. Fish and Wildlife Service and Canadian Wildlife Service, from the Waterfowl Breeding Population and Habitat Survey conducted by trained pilots and wildlife biologists across the northern U.S.A. and Canada. There are no requirements for survey methodology to be standardised across countries: as long as the national approaches are robust and employed to a high standard (in field methodology, sampling design and statistical analysis), the species indices produced by a variety of methodologies are all eligible for use in the indicator production. Underlying data for Europe are available on request from the European Bird Census Council at info/, and for North America are available at Associated Data Standards The EBCC PECBMS continues to improve data quality control and the automation procedure for calculation of trends and indices. National approaches to data collection and archiving in contributing countries are robust and employed to a high standard. A software tool for combining data from countries with several monitoring schemes is in place and is being used for computations. Furthermore, another software tool enables checks for inconsistencies in national and supranational results in order to detect potential errors in computation. Data custodians (institutions) Contributing European data is coordinated by the Pan-European Common Bird Monitoring Scheme (PECBMS): Petr Voříŝek, Czech Society for Ornithology, Na Bělidle 34, CZ Prague 5, Czech Republic, Tel: , EuroMonitoring@birdlife.cz 88 BIODIVERSITY INDICATORS & THE 2010 BIODIVERSITY TARGET
90 Contributing North America data is held by: The BBS, a cooperative effort between the U.S. Geological Survey s Patuxent Wildlife Research Center and Environment Canada s Canadian Wildlife Service: The National Audubon Society: The United States Fish and Wildlife Service, the Canadian Wildlife Service, and state, provincial, and tribal agencies: may-breeding-population-and-habitat-survey. Data access and availability Underlying data for Europe are available on request from the European Bird Census Council at info/, and for North America are available at Whilst most contributing data is not publicly available in its raw form, summaries of data are available at the following URLs: The Waterfowl Breeding Population and Habitat Survey (WBPHS, Smith 1994) can be accessed at gov/birddata/databases/mas/maydb.html. The North American Breeding Bird Survey (BBS, Sauer et al. 2008) provides estimates of long-term population change for over 420 species, and trend estimates, summaries for groups of species of interest such as grasslandbreeding birds or neotropical migrant birds, and other results are available on the survey website ( usgs.gov/bbs). The Christmas Bird Count (CBC) has some basic results provided at European and Pan-European data summaries can be accessed via Quality assurance procedures For the 22 European countries, National data on species trends are checked using the following criteria: 1 European species indices are only calculated for species where contributing data comes from enough countries hosting at least 50 % of the PECBMS European population of that species. PECBMS Europe means the set of countries included in our definition of Europe for assessment of abundant and widespread species. This includes countries which already contribute actively by data provision or are supposed to provide data by 2010: Austria, Belgium, Bulgaria, Czech Republic, Denmark, Estonia, Finland, France, Germany, Hungary, Italy, Latvia, Lithuania, Netherlands, Norway, Poland, Portugal, Republic of Ireland, Romania, Slovakia, Spain, Sweden, Switzerland, United Kingdom. 2 The reliability of the national data are inspected using the following criteria (see below) and all suspicious results are examined in detail and either excluded from the data or validated. This procedure also includes consultations with coordinators of national monitoring schemes. National species data are subjected to closer examination when: Slope (Multiplicative) < 0.6 Slope (Multiplicative) > 1.5 Slope (Multiplicative) standard errors > 0.5 Percentage of scheme time totals of the species > 95% of national population size of the species in Birds in Europe 2 (BirdLife International 2004) Ratio of national population size to scheme time totals > maximum of species population size in Birds in Europe 2 (BirdLife International 2004) Number of zero counts < 1 Number of missing counts < 1 Index value < 0.5 Index value > 1000 Scheme time totals < 1 Scheme time totals > More than one year with index = 100 and SE = 0 present in the results OUTPUTS, EXPERIENCES AND LESSONS LEARNT FROM THE 2010 BIODIVERSITY INDICATORS PARTNERSHIP 89
91 The data quality checks are done by an automated system developed by Statistics Netherlands. 3 As a part of more precise and careful data quality control, all national indices - species by species - are also checked for their inter-annual consistency (comparison of previous and new versions of trends and indices), and all suspicious and inexplicable inconsistencies in indices are examined in detail. The same control for consistency is also carried out for supranational (regional and European) indices and trends. European and regional species are also checked for their use in the production of indicators. If a species index is classified as Uncertain (i.e., no significant increase or decline) AND the index value is >200 % or <5 %, then the species index and data quality are examined in detail. Methods Methods Used The Wild Bird Index (WBI) will aim to measure population trends of a representative suite of wild birds, to act as a barometer of the general health of the environment and how it is changing. The method for producing WBIs is well developed; European WBIs have already been produced and are being used to measure progress towards the European Union s aim of halting biodiversity loss by They are used by nearly twenty national governments in Europe within strategies to assess sustainability and environmental health. WBIs have recently been published for North America, and WBI initiatives have begun in Africa and Australia. There is also scheme planned in China. The WBI measures biodiversity change in a similar fashion to the Living Planet Index, the main difference is that the WBI only incorporates trend data from formally designed breeding bird surveys to deliver scientifically robust and representative indicators. The requirement for robust data, however, means that data coverage is currently patchy and the WBI is not presently applicable at a global scale. Technology/Systems in Use The statistical approach to indicator production combines national single-species indices to produce a multi-species indicator represented by a single line on a graph, indexed to an arbitrary year for presentational purposes (usually 100 in the start year). Rises and falls in this line indicate changes in common bird populations overall. Indicators (multi-species indices) are a geometric mean of the set of individual (or supranational) species indices. The index for each group of species is constructed by setting the first year in the series for each species trend to 1 and taking the geometric mean of the population trend across species, so that each species is given equal weight in the multi-species index. It is necessary to take the geometric mean rather than the arithmetic mean because of the skewed nature of the distribution of a simple index value; i.e., population increases can be infinite, but population decreases can be no more than 100%. Using this approach, a population doubling (index going from 1 to 2) is balanced by a population halving (index going from 1 to 0.5). Hence, each indicator is simply the average population trend of the species that it includes. When positive and negative changes of indices are in balance, then we would expect their mean to remain stable. The software package TRIM (TRends and Indices for Monitoring data) has been developed for analysis of count data obtained from monitoring wildlife populations. It is currently the standard to analyse count data obtained from bird monitoring schemes and is freely available from Statistics Netherlands via (Pannekoek & van Strien 2001). TRIM allows yearly indices and trends (with standard errors) to be calculated by way of log-linear Poisson regression, with corrections for over-dispersion and serial correlation. The analyses allow for plot-turnover, and missing counts from sites are estimated from other sites within the same country, and (wherever possible) from sites with similar characteristics. Supranational indices for species are produced by combining national indices, weighted by the national population size of each species. This means that changes in larger populations have a greater influence on the overall trend. Although national schemes may differ in count methods in the field, these differences do not influence the supranational results because the indices are standardised before being combined. Similarly, the fact that national schemes may have been running for different lengths of time may mean that there are missing year totals. However, TRIM is able to estimate these based on values from neighbouring countries in the same region. Supranational indicators are then combined on a geometric scale, to create multi-species indicators. 90 BIODIVERSITY INDICATORS & THE 2010 BIODIVERSITY TARGET
92 Web-based bird recording also offers a process of systematic collection and capabilities through a new global system called WorldBirds. The WorldBirds project is working to cover the whole globe with a family of intelligent web-based systems to pull together important information on birds from a single species record in one place at one time, through more systematic complete lists of species recorded in one place at one time, to species records from formally designed surveys in one place at one time. All of the different kinds of information have their use and all are valuable. By standardising the way data is captured, WorldBirds ensures that such data is available for use, both for science and as a way to bringing together and nurturing a birding community. The Worldbirds model has been developed based on the simple collection of bird species records. We know that single species records are useful in their own right, but that complete lists of species encountered are potentially much more useful scientifically. Furthermore, we know that species records captured according to pre-designed survey protocols (sampling strategies and fieldwork methods) are even more valuable still and WorldBirds has developed scheme-specific screens to capture these data. We know that both complete species lists and data from formally designed surveys can form the basis of robust WBIs, so in time Worldbirds will make a valuable and increasing contribution to bird and biodiversity monitoring and reporting nationally, regionally and globally. Peer Review The underlying methodology has been extensively described and reviewed in reputable scientific publications (Bird- Life International 2008, Butchart et al. 2010a, Gregory et al. 2003, 2004, 2005, 2007, 2008, 2009, Gregory 2006, Gregory & van Strien 2010, PECBMS 2009, U.S. NABCI 2009, Vorisek et al. 2008a&b). Sauer, J.R. & Link, W.A Hierarchical modeling of population stability and species group attributes from survey data. Ecology 83(6): North American Bird Conservation Initiative, U.S. Committee, The State of the Birds, United States of America, U.S. Department of Interior, Washington, DC., USA. 36 pages. URL: Sauer, J.R., Hines, J.E. & Fallon, J The North American Breeding Bird Survey, Results and Analysis Version USGS Patuxent Wildlife Research Center, Laurel, MD, USA Procedures for maintenance and archiving To assess and maintain the high quality of data included in the index, the field methods, sampling design, area covered and analytical approach are clearly documented for each survey contributing data to the WBI. Data are archived in a way that guarantees that they will be available indefinitely into the future, which means multiple copies in multiple locations, and with the archives being accompanied by the relevant metadata, describing exactly how they were obtained. Versions and sources of each data set used for the analysis are thoroughly documented and, where possible, a common standard of metadata is used to enable easy cross comparison and data management Coverage of protected areas Facts Focal Area: Status and trends of the components of biodiversity Headline Indictor: Coverage of protected areas Key Indicator Partner/s: UNEP-WCMC Data Available: Global, regional and national time series, 1872 onwards Development Status: Ready for global, regional and national use. For latest indicator development see: OUTPUTS, EXPERIENCES AND LESSONS LEARNT FROM THE 2010 BIODIVERSITY INDICATORS PARTNERSHIP 91
93 The Indicator Total Area Protected (km) 20,000,000 18,000,000 16,000,000 14,000,000 12,000,000 10,000,000 8,000,000 6,000,000 4,000,000 2,000,000 0 Cumulative total area protected Cumulative total terrestrial area protected Cumulative total marine area protected Figure A5. Growth in nationally designated protected areas from 1872 to 2008 Graph excludes protected areas with unknown year of establishment Source: UNEP-WCMC Storyline The global number and extent of nationally designated protected areas has increased dramatically over the past century. By 2008, there were over 120,000 protected areas covering a total of about 21 million square kilometres of land and sea, an area more than twice the size of Canada. While the terrestrial protected areas listed in the World Database on Protected Areas cover 12.2% of the Earth s land area, marine protected areas currently cover 5.9% of the Earth s territorial seas and only 0.5% of the extraterritorial seas. Among nations there is a great deal of variation in protection: only 45% of the 236 countries and territories assessed had more than 10% of their terrestrial area protected, and only 14% had more than 10% of their marine area protected. Data Data Sources The data source for this indicator is the World Database on Protected Areas (WDPA; the most comprehensive global spatial dataset on marine and terrestrial protected areas available. The WDPA is a joint project of UNEP and IUCN, produced by UNEP-WCMC and the IUCN World Commission on Protected Areas working with Governments, the Secretariats of Multilateral Environmental Agreements, and collaborating Non- Governmental Organizations (NGOs). The data in the WDPA is obtained from national and regional authorities, NGOs and other sources. Data availability, both in terms of quantity and quality, is improving but not even across the globe. The WDPA currently contains data for over 140,000 protected areas established between 1872 (Yellowstone National Park, USA) and now. Data on terrestrial protected areas is available for over 220 countries/territories and data on marine protected areas is available for 170 countries/territories with marine areas. Data collection and management The WDPA is continuously updated by UNEP-WCMC with information obtained from national and regional authorities, NGOs and other sources. Quality control criteria are applied to ensure consistency and comparability of the data in the WDPA. New data are validated at UNEP-WCMC through a number of tools and translated into the standard data structure of the WDPA. The WDPA is published annually and the data in the WDPA is freely available for non-commercial use at: The process followed to produce the UN List of Protected Areas, which takes place every 5 years or so, is another major source of information for the WDPA. As part of this process, UNEP-WCMC requests national agencies to review the data in the WDPA for their country/territory as well as to provide new data. Associated Data Standards The WDPA data standard is available at: 92 BIODIVERSITY INDICATORS & THE 2010 BIODIVERSITY TARGET
94 Data custodians (institutions) WDPA Content Officer UNEP-WCMC 219 Huntingdon Road, Cambridge CB3 0DL, UK Tel: +44 (0) Fax: +44 (0) Data access and availability The WDPA is published annually and the data in the WDPA is freely available for non-commercial use at: www. wdpa.org Quality assurance procedures Quality control criteria are applied to ensure consistency and comparability of the data in the WDPA. New data are validated at UNEP-WCMC through a number of tools and translated into the standard data structure of the WDPA. Methods Methods Used This indicator is calculated using all the nationally designated protected areas recorded in the WDPA whose location and extent is known. The WDPA is held within a Geographic Information System (GIS) that stores information about protected areas such as their name, type and date of designation, documented area, geographic location (point) and/or boundary (polygon). A GIS analysis is used to calculate terrestrial and marine protection (for territorial waters up to 12 nautical miles from the coast) by country/territory per year. For this a global protected area layer is created by combining the polygons and points recorded in the WDPA. Circular buffers are created around points based on the known extent of protected areas for which no polygon is available. Annual protected area layers are created by dissolving the global protected area layer by the known year of establishment of protected areas recorded in the WDPA. For each year in the time series (e.g., 1990 to present) the annual protected area layers up to and including the given year are combined and any spatial overlaps between protected areas removed. Protected areas with unknown year of establishment are included in each year to avoid double counting spatial overlaps between dated and undated protected areas. The resulting annual protected area layers are overlaid with country/territory boundaries, coastlines and buffered coastlines (delineating the territorial waters) to obtain the absolute coverage in square kilometers of protected areas by country/territory per year. The total area of a country s/territory s terrestrial protected areas and marine protected areas in territorial waters is divided by the total area of its land areas (including inland waters) and territorial waters to obtain the relative coverage (percentage) of protected areas. Global and regional figures are aggregated from the national figures calculated through GIS analysis. The global, regional and national figures provided by UNEP-WCMC are therefore consistent. Gaps and/or time lags in reporting national protected area data to the WDPA can however result in discrepancies between the national figures provided by UNEP-WCMC and national figures available from national agencies. Where no new data is received for a country/territory during a given year, protected area coverage is assumed to be equal to the previous year. Technology/Systems in Use A Geographic Information System (GIS) and spreadsheets are used to analyze the protected area data from the WDPA. Peer Review Coverage of protected areas is a widely used indicator (e.g., for Goal 7 of the Millennium Development Goals) and the methodologies used to calculate the indicator differ between different users and/or have changed over time. The peer reviewed publication by Chape et al. (2005) provides an overview of the methodology then used by UNEP-WCMC. A simplified version of the indicator, not accounting for spatial overlaps between protected areas, was recently included in the peer reviewed publication by (Butchart et al. 2010a). The methodology of the Coverage of protected areas indicator also features in a couple of peer reviewed journals (Butchart et al. 2010a, Chape et al. 2005). OUTPUTS, EXPERIENCES AND LESSONS LEARNT FROM THE 2010 BIODIVERSITY INDICATORS PARTNERSHIP 93
. The results of UNEP-WCMC s annual MDG analysis are published in the annual MDG report, its statistical annex, and on the MDG Indicators webpage: http://mdgs.un.")
95 Procedures for maintenance and archiving At present UNEP-WCMC carries out an updated analysis of protected area coverage in the beginning of each year to report progress towards Goal 7 of the Millennium Development Goals (MDGs). The results of UNEP-WCMC s annual MDG analysis are published in the annual MDG report, its statistical annex, and on the MDG Indicators webpage: They are also made available on the Statistics webpage of the WDPA: The data, metadata and results of UNEP-WCMC s annual MDG analysis are maintained and archived at UNEP-WCMC Protected area overlays with biodiversity Facts Focal Area: Status and trends of the components of biodiversity Headline Indictor: Coverage of protected areas Key Indicator Partner/s: UNEP-WCMC Associate Indicator Partners: Alliance for Zero Extinction, BirdLife International, Conservation International and World Wildlife Fund Data Available: Global time series, 1872 onward Development Status: Ready for global, regional and national use. For latest indicator development see: The Indicator Figure A6. Protection of the world s terrestrial ecoregions in The map shows the protected area coverage of 821 ecoregions (white areas indicate rock and ice). Source: UNEP-WCMC Storyline Overlays of protected areas with biodiversity show that important areas for the world s biodiversity are not yet adequately protected although 12.2% of the planet s total land area and nearly 1% of the planet s total sea area has been protected to date. In 2009, only half the world s 821 terrestrial ecoregions and less than 20% of the world s 232 marine ecoregions had more than 10% of their area under protection, a target set by the Convention on Biological Diversity. Nearly 10% of the terrestrial ecoregions and 50% of the marine ecoregions still have less than 1% protection, indicating significant gaps in the protection of large areas that contain distinctive biodiversity. 94 BIODIVERSITY INDICATORS & THE 2010 BIODIVERSITY TARGET
96 By 2007, 35% of 561 Alliance for Zero Extinction sites (AZEs) and 26% of 10,993 Important Bird Areas (IBAs) were completely covered by protected areas, compared to 25% and 19% in AZEs and IBAs are two types of key biodiversity areas, i.e., site-scale priorities for biodiversity conservation, for which global data is available. Protecting all AZEs and IBAs would significantly contribute to the Convention on Biological Diversity s target to protect areas of particular importance to biodiversity; however, more than two thirds of these sites are still unprotected or only partially protected. Data Data Sources The primary data source for this indicator is the World Database on Protected Areas (WDPA; the most comprehensive global spatial dataset on marine and terrestrial protected areas available. The WDPA is a joint project of UNEP and IUCN, produced by UNEP-WCMC and the IUCN World Commission on Protected Areas working with Governments, the Secretariats of Multilateral Environmental Agreements, and collaborating Non-Governmental Organizations (NGOs). The data in the WDPA is obtained from national and regional authorities, NGOs and other sources. Data availability, both in terms of quantity and quality, is improving but not even across the globe. The WDPA currently contains data for over 140,000 protected areas established between 1872 (Yellowstone National Park, USA) and now. Data on terrestrial protected areas is available for over 220 countries/territories and data on marine protected areas is available for 170 countries/territories with marine areas. In order to measure progress towards the CBD targets, the WDPA data is overlaid with data on the world s 821 terrestrial and 232 marine ecoregions (cf. Olson et al and Spalding et al. 2007), Important Bird Areas (IBAs), and Alliance for Zero Extinction sites (AZEs). IBAs and AZEs are two types of key biodiversity areas, i.e., site-scale priorities for biodiversity conservation, for which global data is available. IBAs and AZEs continue to be identified by the BirdLife International Partnership and the Alliance for Zero Extinction, respectively; so far they have identified 10,993 IBAs in 218 countries/territories and 561 AZEs worldwide. More up-to-date information on these datasets is available on the webpages of the respective data custodians (see below for web addresses). Data collection and management The WDPA is continuously updated by UNEP-WCMC with information obtained from national and regional authorities, NGOs and other sources. Quality control criteria are applied to ensure consistency and comparability of the data in the WDPA. New data are validated at UNEP-WCMC through a number of tools and translated into the standard data structure of the WDPA. The WDPA is published annually and the data in the WDPA is freely available for non-commercial use at: The process followed to produce the UN List of Protected Areas, which takes place every 5 years or so, is another major source of information for the WDPA. As part of this process, UNEP-WCMC requests national agencies to review the data in the WDPA for their country/territory as well as to provide new data. The data on the terrestrial and marine ecoregions has been published (Olson et al. 2001, Spalding et al. 2007), does not undergo regular updates, and is available at: The data on IBAs is from BirdLife International s World Bird Database (WBDB) at: sites/index.html. This data is regularly updated as new IBAs are identified by the BirdLife International Partnership. The data on AZEs is available from the Alliance for Zero Extinction at: This data is currently being updated by the Alliance for Zero Extinction for the first time since its initial publication (Ricketts et al. 2005). Associated Data Standards The WDPA data standard is available at: OUTPUTS, EXPERIENCES AND LESSONS LEARNT FROM THE 2010 BIODIVERSITY INDICATORS PARTNERSHIP 95
97 Data custodians (institutions) WDPA data: WDPA Content Officers UNEP-WCMC 219 Huntingdon Road, Cambridge CB3 0DL, UK Tel: +44 (0) Fax: +44 (0) IBA data: BirdLife International Wellbrook Court, Girton Road, Cambridge CB3 0NA, UK Tel: +44 (0) Fax: +44 (0) AZE data: Benjamin Skolnik, AZE Coordinator International Division, American Bird Conservancy 1731 Connecticut Avenue, N.W. 3rd Floor, Washington D.C , USA Tel: +1 (0) ext. 202 Fax: +1 (0) Data access and availability The WDPA is published annually and the data in the WDPA is freely available for non-commercial use at: www. wdpa.org Data on the terrestrial and marine ecoregions is freely available for non-commercial use from WWF at: Data on IBAs is freely available for non-commercial use from BirdLife International s World Bird Database (WBDB) at: Data on AZEs is freely available for non-commercial use from the Alliance for Zero Extinction at: zeroextinction.org/search.cfm Quality assurance procedures Quality control criteria are applied to ensure consistency and comparability of the data in the WDPA. New data are validated at UNEP-WCMC through a number of tools and translated into the standard data structure of the WDPA. Ecoregions, IBAs and AZEs are identified using globally standardized criteria. Terrestrial ecoregions have been identified by Olson et al. (2001), marine ecoregions by Spalding et al. (2007). IBAs and AZEs continue to be identified by the BirdLife International Partnership and the Alliance for Zero Extinction, respectively. Methods Methods Used The protected area overlays indicator is currently made up of a composite of three sub-indicators that together help to measure progress towards the CBD targets: 1) the degree of protection of terrestrial and marine ecoregions of the world; 2) the degree of protection of Important Bird Areas (IBAs); and 3) the degree of protection of Alliance for Zero Extinction sites (AZEs). IBAs and AZEs are two types of key biodiversity areas, i.e., site-scale priorities for biodiversity conservation, for which global data is available. 96 BIODIVERSITY INDICATORS & THE 2010 BIODIVERSITY TARGET
98 The sub-indicators are calculated based on overlays of ecoregions, IBAs and AZEs with all the nationally designated protected areas recorded in the WDPA whose location and extent is known. The methodology used to create annual protected area layers from the WDPA follows the one used to calculate the protected area coverage indicator. The resulting annual protected area layers are then overlaid with data on ecoregions, IBAs and AZEs to obtain the absolute and relative coverage by protected areas of ecoregions, IBAs and AZEs. Technology/Systems in Use A Geographic Information System (GIS) and spreadsheets are used to analyze the protected area data from the WDPA and the data on ecoregions, IBAs and AZEs. Peer Review The methodology of this indicator features in a several other peer reviewed journals (Butchart et al. 2010a, Chape et al. 2005, Jenkins & Joppa 2010, Ricketts et al. 2005, Schmitt et al. 2009, Spalding et al. 2008). A paper (Butchart et al. Do protected areas safeguard biodiversity? ) with detailed methodology is currently in preparation. Protected area overlays with biodiversity are a fairly widely used indicator and the methodologies used to calculate the indicator differ between different users and/or have changed over time. Predating the development of the current sub-indicator on ecoregion protection, the peer reviewed publication by (Chape et al. 2005) provides an overview of a methodology then used by UNEP-WCMC to calculate protection by Udvardy biomes and major habitat types, More recently, (Jenkins and Joppa 2010) assessed protection of terrestrial ecoregions, (Schmitt et al. 2009) protection of forest ecoregions, and (Spalding et al. 2008) protection of marine ecoregions. (Ricketts et al. 2005) identified the initial set of AZEs and at the same time assessed the protection of these centers of imminent extinction. A simplified version of the current sub-indicators on AZE and IBA protection, not accounting for spatial overlaps between protected areas, was recently included in the peer reviewed publication by Butchart et al. (2010a). A peer reviewed publication focusing specifically on the sub-indicators on IBA and AZE protection is currently in preparation. Procedures for maintenance and archiving At present there is neither a process nor resources in place that would ensure updated analyses of ecoregion, IBA and AZE protection are carried out by UNEP-WCMC and/or its partners each year. In contrast to the protected area coverage indicator, where UNEP-WCMC carries out an updated analysis in the beginning of each year to report progress towards Goal 7 of the Millennium Development Goals (MDGs), there are currently no regular reporting mechanisms for the protected area overlays indicator. The data, metadata and results of the various analyses of ecoregion, IBA and AZE protection are currently not maintained and archived in one location; however, they should be available from the lead authors, or organizations, responsible for the respective analyses Management effectiveness of protected areas Facts Focal Area: Status and trends of the components of biodiversity Headline Indictor: Coverage of protected areas Key Indicator Partner/s: UNEP-WCMC and University of Queensland/WCPA Associate Indicator Partners: IUCN World Commission on Protected Areas, TNC, WWF International, Equilibrium Consultants, Conservation International, GEF, World Bank, BirdLife International. Data Available: Global Baseline Development Status: Ready for global, regional and national use. For latest indicator development see: OUTPUTS, EXPERIENCES AND LESSONS LEARNT FROM THE 2010 BIODIVERSITY INDICATORS PARTNERSHIP 97

99 The Indicator Figure A7. Percentage of protected areas in which management effectiveness studies have been completed The fi gure represents the coverage of the indicator. Management effectiveness scores will form the true indicator Source: UNEP-WCMC. Storyline Across a sample of 3184 protected areas where data from management effectiveness assessments is available, management varied from weak to effective, with about a third of them showing clear inadequacies. The overall mean score for management effectiveness was 0.53 on a scale of zero (completely ineffective management) to one (highly effective management). About 13% of the surveyed areas lacked basic requirements to operate effectively, and did not have an effective management presence. Strongest management factors recorded on average were gazettal, effectiveness of governance, threat monitoring, appropriateness of protected area design, conservation of values and marking of boundaries, while the weakest aspects of management included community benefit programs, funding reliability and adequacy, management effectiveness evaluation, facility and equipment maintenance, communication, and community involvement. Data Data Sources This indicator set is derived using data from many different protected area management effectiveness evaluation (PAME) methods (Hockings et al. 2006): which aim to give a balanced picture of management, including resourcing and management processes as well as outcomes. This data from which the indicator is compiled is derived from site-level assessments, though information at country-level is also being collected. Records of about 9,000 assessments have been compiled from 140 countries, and results are available for approximately half of these. Most of the data is available from 2000 onwards. In some cases more than one assessment has been carried out and only the most recent results are counted in analyses, except for trends and correlations. Data collection and management Assessment of management effectiveness of protected areas (PAME) have been conducted across the world, using a wide range of methodologies. From 2005, the Global Study into Management Effectiveness has been compiling the metadata, and where possible the results, of these PAME studies. Methods for finding out about and compiling the studies include direct approaches to governments and NGOs, literature searches, communication through professional and conservation networks. 98 BIODIVERSITY INDICATORS & THE 2010 BIODIVERSITY TARGET
100 Information is stored on a Microsoft Access database and associated files held by the University of Queensland. Much of the information is confidential and cannot be released except in reports which obscure the individual protected areas. Metadata about the studies (extracted from the full database) is publicly available. It is stored within a component of the World Database on Protected Areas (WDPA), and this can be searched by methodology, country or individual protected area: Associated Data Standards Indicators were analysed to produce a series of 45 headline indicators. For reasons of statistical validity (see below), only those assessments which could populate at least six of these fields were included in the study. Any study site which could not be classed as a protected area was discarded, except for the case of Important Bird Areas, which were kept in the data set if more than 80-% of their area was within a recognised protected area Data custodians (institutions) University of Queensland: Brisbane QLD 4072, Australia Tel: Contact: Associate Professor Marc Hockings (m.hockings@uq.edu.au) UNEP-WCMC): 219 Huntingdon Road, Cambridge CB3 0DL, UK Tel: +44 (0) Fax: +44 (0) Contact: Bastian Bomhard, Senior Programme Officer (bastian.bomhard@unep-wcmc.org) Data access and availability Much of the data underlying the indicator is confidential and cannot be released except in reports which obscure the individual protected areas. This is due to the sensitive nature of the information and the conditions under which access to the raw data was granted by the original data holders (NGOs and protected area management agencies). It should be noted that this project has been able to access about half of the known raw data. Metadata about the studies (extracted from the full database) is publicly available. It is stored within the management effectiveness component of the World Database on Protected Areas (WDPA), and this can be searched by methodology, country or individual protected area: Quality assurance procedures Information incorporated into this index came from three primary sources: management agencies of the protected areas (usually government); large non-government organisations (including those conducting projects under the auspices of IUCN, the World Bank or Global Environment Fund); and recognised academic institutions. All data sources were regarded as being credible and the individual methodologies used have all been reviewed and summarised (Leverington et al. 2010a&b). Methods Methods Used The indicator incorporates results from the variety of PAME different methodologies through the use of a common reporting format, which matches the wide range of indicators in individual methods to a set of 45 headline indicators and a consolidated set of 14 summary indicators representing broad management topics. Individual scores in the various methods were re-scaled onto a common 0-1 scale. An overall mean across the 14 summary indicators was calculated for each protected area. Mean scores of >0.66 are regarded as sound, as basic, and <0.33 as clearly inadequate. Overall proportions in each of these three categories were calculated, using the most recent score where there was more than one. Technology/Systems in Use Statistical approaches followed normal procedures to ensure validity and to evaluate significance. OUTPUTS, EXPERIENCES AND LESSONS LEARNT FROM THE 2010 BIODIVERSITY INDICATORS PARTNERSHIP 99
101 After data was rescaled and transformed via the common reporting format into 45 headline indicators, a comparison of least-square means was conducted to ensure that the results were not being biased depending on which indicators were available in a particular study. This test showed that the procedure was valid providing at least six headline indicators were populated by the methodology in question. This set of 45 headline indicators was then consolidated into 14 summary indicators. Correlations between the individual indicators and the overall mean (item-total correlations) were corrected to exclude the item from the mean with which it was being correlated, to avoid the possible bias introduced by the variability of different indicators (Guilford 1954). Overall mean scores for each the management effectiveness of protected areas are useful for a rapid overview but the mean is not considered to be a completely valid measurement on its own. This is because some of the indicators have relatively low item-total correlations, and the single score does not have the internal consistency normally expected of an index. For this reason, our results are also reported in terms of the strengths and weaknesses of the different headline indicators (45) or summary indicators (14). Peer Review Leverington, F., Lemos Costa, K., Pavese, H., Lisle, A. & Hockings, M A global analysis of protected area management effectiveness. Environmental Management. Procedures for maintenance and archiving The database held at University of Queensland was developed to maintain and archive data in a format where the information from many different methodologies can be accessed and analysed IUCN Red List Index Facts Focal Area: Status and trends of the components of biodiversity Headline Indictor: Change in the status of threatened species Key Indicator Partner/s: IUCN, BirdLife International & ZSL Associate Indicator Partners: Conservation International, Kew, NatureServe, Sapienza Universitá di Roma, Texas A&M University, WildScreen, Botanic Gardens Conservaiton International Data Available: Global time series, 1980 onwards (periods differing for different taxonomic groups) Development Status: Ready for global use. For latest indicator development see: The Indicator Better Red List Index of Species Survival Corals Birds Mammals Amphibians Worse Figure A8. Red List Index for the world s mammals, birds, amphibians and corals. Source: Hilton-Taylor et al BIODIVERSITY INDICATORS & THE 2010 BIODIVERSITY TARGET
102 Storyline The RLI shows that all species groups with known trends are deteriorating in status, as more species move towards extinction than away from it. Amphibians are more threatened than birds and mammals, but corals are deteriorating in status fastest, owing to increased frequency of bleaching events brought about by climate change. South-East Asia is the region in which mammals are most threatened and in which mammals and birds have deteriorated most dramatically. This is a consequence of the rapid rate of deforestation of the region s Sundaic lowlands combined with unsustainable levels of hunting. Birds are most threatened in Oceania, where island species are often susceptible to invasive species that humans have deliberately or inadvertently introduced. The fungal disease chytridiomycosis is the major driver of declines in amphibians. Data Data Sources Data for this indicator are extracted from the Species Information Service (SIS) database maintained by the Red List Unit of the IUCN Species Programme. This data is made available online through the IUCN Red List of Threatened Species: Data collection and management The IUCN Species Survival Commission is an established knowledge network of ~8,000 volunteer members working in almost every country of the world. The IUCN Species Survival Commission (SSC) and IUCN Species Programme are jointly responsible for maintaining and developing the IUCN Red List of Threatened Species. In order to maintain the credibility of the IUCN Red List, the SSC has formalized the process by which species can be included on the list. In particular, this process includes the designation of Red List Authorities (RLAs). There are three routes by which assessments feed onto the IUCN Red List: Red List Authorities (RLA). The majority of RLAs are within one of the ~120 IUCN SSC Specialist Groups, but they can also be independent networks (termed Stand-alone Red List Authorities ), or IUCN Red List Partner institutions (e.g., BirdLife International, NatureServe) and other organizations (e.g., Project Seahorse). IUCN Species Programme and Red List Partner projects. These include the global biodiversity assessments (e.g., Global Amphibian Assessment, Global Mammal Assessment, Global Marine Species Assessment), and regional biodiversity assessment projects (e.g., Mediterranean biodiversity assessments, African freshwater biodiversity assessments) and assessments for the Sampled Red List Index (SRLI) run by the Zoological Society of London and the Royal Botanic Gardens Kew. External projects. Red List assessments resulting from projects carried out by individuals, academia, and organizations outside of the IUCN network (this includes national Red List initiatives). All three routes use the same basic process for preparing and submitting assessments for publication: data are gathered and provided by contributors ; assessors use the data and the IUCN Red List Categories and Criteria to assess the species, and to document the assessment; the assessment is reviewed by at least two reviewers ; accepted reviewed assessments are published on the IUCN Red List. But, the specific activities involved in the process may differ depending on the route. Comprehensive information on data collection and management can be found in Hoffman et al. (in review) or Associated Data Standards The IUCN Red List process aims to collate comprehensive, expert-reviewed data on the distribution, abundance, population trends, ecology, habitat preferences, threats, utilization, conservation actions, and conservation status for all currently recognized wild species. Detailed information on all data types collected is available in Hoffman et al. (in review). The Red List Index is based on IUCN Red List category assigned to each species. This data is generated using the IUCN Red List Categories and Criteria (Version 3.1) (IUCN 2001, Mace et al. 2008), the most widely accepted system for classifying extinction risk at the species level (de Grammont & Cuaron 2006, Hoffmann et al. 2008, Lamoreux et al. 2003, Rodrigues et al. 2006). OUTPUTS, EXPERIENCES AND LESSONS LEARNT FROM THE 2010 BIODIVERSITY INDICATORS PARTNERSHIP 101
103 The IUCN Red List Categories comprise eight different categories of extinction risk: Extinct(EX), Extinct in the Wild (EW), Critically Endangered (CR), Endangered (EN), Vulnerable (VU), Near Threatened (NT) and Least Concern (LC), plus Data Deficient (DD) for species for which there is insufficient data to apply the criteria. A species qualifies for one of the three threatened categories (CR, EN, or VU) by meeting a quantitative threshold in one of the five different available criteria (A-E). The criteria are designed to be objective, quantitative, repeatable, and to handle uncertainty. Two tags (Possibly Extinct and Possibly Extinct in the Wild) may be applied to Critically Endangered species to indicate those that are likely to be extinct but for which this has not yet been confirmed (Butchart et al. 2006, IUCN Standards and Petitions Subcommittee 2010). Each IUCN Red List assessment is accompanied by detailed documentation justifying the assessment, date of assessment, underlying data, and associated uncertainties, plus the names of the contributors, assessors, reviewers, etc. Data custodians (institutions) IUCN and Partner Organisations 219c Huntingdon Road Cambridge, CB3 0DL, UK Tel: +44 (0) Fax: +44 (0) Contact: Craig Hilton-Taylor, Head of Red List Unit (craig.hilton-taylor@iucn.org) Data access and availability All assessments must go through a review process before they can be accepted on the IUCN Red List. This involves at least two experts in the IUCN assessment process reviewing the assessment and agreeing that the data used have been interpreted correctly and consistently, and that uncertainty has been handled appropriately. Detailed information on how the review process differs between RLAs, IUCN Species Programme and Red List Partner projects and External Projects is provided in Hoffman et al. (in press). Methods Methods Used To calculate the RLI, all species in a group must have been assessed for the IUCN Red List at least twice. In 2008, the IUCN Red List (IUCN Standards and Petitions Subcommittee 2010) included assessments for 44,838 species, spanning every country of the world, of which 16,928 species were threatened with extinction. This includes species from a broad range of taxonomic groups spanning vertebrates, invertebrates, plants and fungi. At present, it is possible to calculate a RLI for several groups in which all species have been assessed for the IUCN Red List: birds (9,956 species, 12 per cent threatened), mammals (5,416 species, 23 per cent threatened), amphibians (6,119 species, 31 per cent threatened), corals (845 species, 33 per cent threatened) and gymnosperms (primarily conifers and cycads, 980 species, 35 per cent threatened). Further groups will be globally assessed over the next few years. To address the challenge of assessing taxonomic groups which have extremely large numbers of species and/or that are poorly known, a sampled approach has been developed in which 1,500 species are randomly selected and assessed(see Baillie et al. 2008). In the coming years, this will expand considerably the breadth of taxonomic groups for which complete or representative RLIs can be calculated. The formula for calculating Red List Indices was improved and revised in 2007 (Butchart et al. 2007). Mathematically the calculation of the RLI can be expressed as: RLI t =1 _ s W c(t,s) W EX N where Wc(t,s) is the weight of category c for species s at time t, (WEX) is the weight for Extinct, and N is the number of assessed species excluding those considered Data Deficient in the current time period and those considered to be Extinct in the year the set of species was first assessed. 102 BIODIVERSITY INDICATORS & THE 2010 BIODIVERSITY TARGET
104 The RLI is calculated from the number of species in each Red List Category (Least Concern, Near Threatened, Vulnerable, Endangered, Critically Endangered), and the number changing Categories between assessments as a result of genuine improvement or deterioration in status (Category changes owing to improved knowledge or revised taxonomy are excluded). Put simply, the number of species in each Red List Category is multiplied by the Category weight (which ranges from 0 for Least Concern, 1 for Near Threatened, 2 for Vulnerable, 3 for Endangered, 4 for Critically Endangered and 5 for Extinct in the Wild and Extinct). These products are summed, divided by the maximum possible product (the number of species multiplied by the maximum weight), and subtracted from one. This produces an index that ranges from 0 to 1. The formula for calculating the RLI requires that (a) exactly the same set of species is included in all time steps, and (b) the only category changes are those resulting from genuine improvement or deterioration in status (i.e., excluding changes resulting from improved knowledge or taxonomic revisions). In practice, species lists will often change slightly from one assessment to the next (e.g., owing to taxonomic revisions), and many species change category between assessments owing to improved knowledge of their population size, trends, distribution, threats etc. The conditions can therefore be met by retrospectively correcting earlier Red List categorizations using current information and taxonomy. This is achieved through assuming that the current Red List Categories for the taxa have applied since the set of species was first assessed, unless there is information to the contrary that genuine status changes have occurred. Such information is often contextual, e.g., relating to the known history of habitat loss within the range of the species (see Butchart et al for further details). Technology/Systems in Use The Red List data are managed in IUCN s Species Information System, BirdLife s World Bird Database and other Red List Partner databases. A Red List Index Calculator tool (MS Excel spreadsheet with embedded macros) for automatically calculating and plotting the RLI is freely available (downloadable from and Peer Review The underlying methodology has been extensively described and reviewed in reputable scientific publications (Butchart & Vie 2006, Butchart et al. 2004, 2005, 2006, 2007, 2008, 2010, McGeoch et al. 2010, Hoffman et al., in press). Procedures for maintenance and archiving IUCN plan to implement a system to allow PDFs of historical Red List assessments to be downloadable from the Red List website Ex-situ crop collections Facts Focal Area: Status and trends of the components of biodiversity Headline Indictor: Trends in genetic diversity Key Indicator Partner/s: FAO Associate Indicator Partners: Bioversity International Data Available: Global time series, (Data being used to test methodology) Development Status: Methodology under review. For latest indicator development see: OUTPUTS, EXPERIENCES AND LESSONS LEARNT FROM THE 2010 BIODIVERSITY INDICATORS PARTNERSHIP 103
105 The Indicator Index value Figure A9. Ex-Situ Crop Collections Enrichment index Source: Dataset pooled from EURISCO (European National Inventories), USDA-GRIN, ICRISAT, CIAT and SINGER (excluding ICRISAT and CIAT) data Storyline Ex-situ conservation represents the most significant and widespread means of conserving plant genetic resources for agriculture (PGRFA). There are now more than 1,750 individual genebanks worldwide. These genebanks maintain about 7.4 million accessions, a 1.4 million increase since However, it is estimated that less than 30 percent of the total number of accessions conserved in ex-situ collections are distinct, with the majority being duplicates held either in the same or, more frequently, a different collection. While the number of accessions of minor crops and crop wild relatives (CWR) has increased in the past 14 years, these categories are still generally underrepresented in ex-situ collections. Data Data Sources Data used to calculate the indicator are from SINGER, EURISCO, USDA-GRIN, CIAT and ICRISAT. More than 2.1 million records of accessions conserved ex-situ were published by these sources in late Out of these, accession records included necessary information (holding genebank, accession number, genus, species, biological status, country of origin, and acquisition date) and were used to calculate the indicator. They cover species, coming from 152 countries. The indicator was calculated for each year from 1893 to Data collection and management Data used to calculate the indicator were directly received from SINGER, EURISCO, USDA-GRIN, CIAT and ICRISAT. Nonetheless they are publicly available through the web portal of each provider (see list below). As per CIAT and ICRISAT data were received directly from their respective genebank units, in view of the fact that data under SINGER for these CGIAR Centres had not been updated recently Associated Data Standards Applied data standards are based on the FAO/IPGRI Multi-crop Passport Descriptors (Alercia et al. 2001). Data custodians Dr. Elizabeth Arnaud, SINGER Coordinator, Bioversity International (e.arnaud@cgiar.org) Dr. Sonia Dias, EURISCO Coordinator, Bioversity International (s.dias@cgiar.org) Dr. Quinn Sinnot, USDA GRIN (dbmuqs@ars-grin.gov) Dr. Ahmed Amri, Head, Genetic Resources Section, ICARDA (a.amri@cgiar.org) Dr. Daniel Debouck, Head, Genetic Resources Program, CIAT (d.debouck@cgiar.org) 104 BIODIVERSITY INDICATORS & THE 2010 BIODIVERSITY TARGET
106 Data access and availability See Data collection and management. Quality assurance procedures Dataset fields occurrences have been checked against standards defined in FAO/IPGRI Multi-crop Passport Descriptors. Accession records with not compliant fields were rejected. Methods Methods Used The Enrichment Index of the ex-situ crops collection describes how much an ex-situ collection is enriched every year. The enrichment is a function of the number of accessions, the novelty of the species, and the novelty of the countries added each year to the collection. To calculate the enrichment we assign to each new accession a weight and sum weights for all accessions entering the collection the year under consideration. The weight of each accession is calculated as follows: For each species (s): We consider N (s) as the total number of accessions belonging to the species and present in the total collection, and S (s) as the total cumulative area in km 2 of all represented countries for the species under consideration in the total collection. We calculate d (s), the species averaged density, as the number of accessions per surface unit (km_) for the species as d (s) = N(s) / S(s). For each country (cty), we calculate numbers (s ; cty), an arbitrary calculated optimal number of accessions, that is proportional to the surface of the country under consideration given d (s) : no (s ; cty) = d (s). S (cty), being S (cty) the surface of the country under consideration. For each accession entering the collection in a given year t : Let us consider nt-1 (s ; cty), the number of accessions already present in the collection of the same species and country than the accession under consideration We calculate the weight of the accession as the logarithm increment due to the addition of the accession under consideration. The logarithm increment is used in order to add less and less weight when the number of accession already present in the collection for the same species and the same country increases. This increment is the difference between the logarithm of the number of accessions present in the collection and scaled on the optimal number of accession for the country for which the accession is added (F(t-1)) and the logarithm of the same number + 1 (the added accession) (F(t)). F(t-1) = log [1 + (9 nt-1 (s ; cty) / no (s ; cty))] F(t) = log [1 + (9 (nt-1 (s ; cty) + 1) / no (s ; cty))] The 1 allows starting with one accession and positive values. The 9 is an arbitrary choice, placing the optimal number of accession no (s ; cty) on the value 10 of a simple logarithm function. The weight represents an increment of originality due to the addition of the accession under consideration compared to the accessions present in the collection. The increment on the index each year has been correlated to the number of accessions added each year, the number of species added each year, the number of new species (not yet represented in the collection) added each year, the number of countries added each year and the number of new countries added each year. Only the number of new countries added each year is not well represented by the Index enrichment Considering cultivated surfaces or arable surfaces instead of total countries surfaces improves a little the index representation, although not dramatically. Taking into account wild relatives distribution to increase the weight of accessions coming from the center of origin of the crop they represent also has little effect on the indicator s efficiency to reflect the collection enrichment. All together, this tells us that the proposed indicator describes properly the collection enrichment. OUTPUTS, EXPERIENCES AND LESSONS LEARNT FROM THE 2010 BIODIVERSITY INDICATORS PARTNERSHIP 105
107 Technology/Systems in Use Tools used included: Perl and Visual BASIC Script: to test and calculate index from data sets; and MS Access as DBMS software for data storage SQL treatments and data management. Peer Review Internal peer review within FAO Procedures for maintenance and archiving Not yet finalised Genetic diversity of terrestrial domesticated animals Facts Focal Area: Status and trends of the components of biodiversity Headline Indictor: Trends in genetic diversity Key Indicator Partner/s: FAO Associate Indicator Partners: ILRI, Centre for Genetic Resources, the Netherlands (CGN) of Wageningen University Data Available: Global, regional and national time series since early 1980s (many gaps) Development Status: Methodology under review. For latest indicator development see: The Indicator 7% 1% 5% 1% 8% 12% 36% 10% 3% 9% 35% 2% 11% 40% 1% 16% 4% 2% Critical Critical-maintained Endangered Endangered-maintained Extinct Not at risk Unknown 34% 38% 25% All species Mammalian Avian Figure A10. Proportion of the world s breeds by risk status category The indicator has not yet been fi nalized. The following fi gure is based on the data that will feed into the indicator. Source: FAO Status and trends report of animal genetic resources Rome. Storyline Among the approximately 8,000 breeds reported to FAO, about 21% are currently classified as being at risk based on the most recently available population figures. For another 36% no population data are available and therefore risk status is unknown. Data updates are insufficiently regular at present to allow for an accurate assessment of trends. However, many individual breeds continue to decline in numbers. Data Data Sources Breed risk-status status figures used in the indicator are obtained from the Domestic Animal Diversity Information System (DAD-IS which includes data from 198 countries and territories and 34 species, species groups or fertile interspecies crosses. The following countries and territories have not yet provided any data: Andorra, Brunei Darussalam, Gaza Strip, Holy See, Liechtenstein, Marshall Islands, Federated States 106 BIODIVERSITY INDICATORS & THE 2010 BIODIVERSITY TARGET
108 of Micronesia, Monaco, Montenegro, Nauru, Qatar, San Marino, Singapore, Timor-Leste, United Arab Emirates, West Bank, Western Sahara. All data are entered into DAD-IS (or an associated national or regional system) by National Coordinators for the Management of Animal Genetic Resources, who are officially nominated by their countries. Approximately 8,000 breeds (14,000 national breed populations) are recorded in DAD-IS. Countries can enter demographic data (population size and structure) for any of their national breed populations for any year. They can also enter any historical data that they have available. The Commission on Genetic Resources for Food and Agriculture (the intergovernmental body that oversees work this field) has requested that status and trends reports on animal genetic resources for food and agriculture (otherwise known as terrestrial domesticated animals) be prepared for each of its regular sessions every two years and has stressed the need for countries to regularly maintain their national data in DAD-IS (ftp://ftp.fao.org/docrep/fao/meeting/017/k6536e.pdf). Nonetheless, for many breeds no data on population size and structure have been entered into DAD-IS to date. For this reason, about 36 percent of breeds cannot be assigned to a risk status category. Moreover, among the other 64 percent data updates are insufficiently frequent to allow overall trends to be tracked accurately. List of species included in DAD-IS Alpaca, Ass, Bactrian Camel, Buffalo, Cattle, Chicken, Chilean Tinamou, Deer, Dog, Dromedary, Dromedary/ Bactrian Camel, Duck (domestic), Duck (domestic)/muscovy Duck, Goat, Goose (domestic), Guinea Pig, Guinea Fowl, Horse, Llama, Muscovy duck, Nandu, Ostrich, Partridge, Peacock, Pheasant, Pig, Pigeon, Quail, Rabbit, Sheep, Swallow, Turkey, Vicuña, Yak (domestic). Data collection and management As described, data are provided by officially nominated National Coordinators for the Management of Animal Genetic Resources who enter them via the internet into DAD-IS or an associated regional or national information system from which data are passed to DAD-IS (see list below). Individual countries are responsible for the data they provide, which may be collected via breed-level surveys or calculated based on the estimated proportion of the breed in the total population for the respective species in the relevant parts of the country. Regional and national information systems European Farm Animal Biodiversity Information System (EFABIS) ( Austria ( Cyprus ( Estonia ( Finland ( Georgia ( Greece ( Hungary ( Iceland ( Ireland ( Italy ( Netherlands ( Poland ( Slovakia ( Slovenia ( Switzerland ( United Kingdom ( Associated Data Standards All the data in DAD-IS are entered into the system by National Coordinators for the Management of Animal Genetic Resources via standard web-based data entry screens in DAD-IS (or a linked national or regional information system) and therefore have a standard form. The minimum set of data items for a national breed population entered into DAD-IS is the breed name, the species and the country. Other fields are optional, but countries are encouraged to report all data that they have available. Help texts linked to each data-entry field specify the data required. Countries are responsible for the quality of the data that they enter. OUTPUTS, EXPERIENCES AND LESSONS LEARNT FROM THE 2010 BIODIVERSITY INDICATORS PARTNERSHIP 107
109 Data custodians DAD-IS is hosted by the Food and Agriculture Organization of the United Nations. Data access and availability Data sheets for all breeds and various tools for generating reports can be accessed via DAD-IS as well as via the regional and national systems (URLs listed above). Quality assurance procedures DAD-IS data entry screens have built-in validation features to ensure internal consistency. Methods Methods Used An expert meeting on indicators for animal genetic resources, organized by FAO in February 2010 recommended the following set of indicators to be calculated at national, regional and global levels for livestock species of major economic importance: 1. number of native breeds; 2. proportion of the total population accounted for by native and non-native breeds; 3. number of breeds classified as at risk, not at risk and unknown. The third of these recommended indicators can be calculated from existing DAD-IS data and has previously been calculated in global assessments such as the report on Status and trends of Animal Genetic Resources presented to the Fifth Session of the Intergovernmental Technical Working Group on Animal Genetic Resources in 2009 (ftp://ftp.fao.org/docrep/fao/meeting/016/ak220e.pdf). The first and second recommended indicators require the development of a method for classifying breeds as native or non-native that is relevant throughout the world and acceptable to the countries that provide DAD-IS data. Even if such a classification is developed, the second recommended indicator cannot be calculated from existing DAD- IS data because of gaps in the availability of data on breed population size and in some cases incomplete national breed inventories. The expert meeting proposed using species-level data from FAO s statistical database FAOSTAT ( to estimate the size of the species population not accounted for in the DAD-IS breed population figures. The feasibility of this approach needs to be further investigated. The expert meeting recommended that the indicator set should be calculated for each of the following species or groups of species: ass, buffalo, cattle (including yak), camel (both Bactrian camel and dromedary), goat, horse, llamoids (alpaca and llama), pig, rabbit, sheep, chicken, duck, goose and turkey. Technology/Systems in Use DAD-IS is a multilingual web-based database system operating in a network of information systems; open source code; back-end: PostgreSQL, PostGIS for spatial data; engine: CGI scripts in PERL. Peer Review The following paper reviews progress to date in the development of the indicator and other indicators related to animal genetic resources: Martynuik, E., Pilling, D. & Scherf, B Indicators: do we have effective tools to measure trends in genetic diversity of domesticated animals? Animal Genetic Resources. 47 (in press). Procedures for maintenance and archiving Raw data are maintained in DAD-IS. 108 BIODIVERSITY INDICATORS & THE 2010 BIODIVERSITY TARGET
110 2.1.1 Area of forest under sustainable management: certification Facts Focal Area: Status and trends of the components of biodiversity Headline Indictor: Trends in genetic diversity Key Indicator Partner/s: FAO Data Available: Global time series, 1995 onwards Development Status: Ready for global use. For latest indicator development see: The Indicator 450,000, ,000,000 Cumulative area (ha) 350,000, ,000, ,000, ,000, ,000, ,000,000 Figure A11. Total Area Under FSC Certification Source: FSC & UNEP-WCMC Storyline 50,000, The indicator shows a positive response in regard to protecting biodiversity through the sustainable management of forests. The area of certified forest has increased from 3.24 million hectares in 1995 to million hectares in The rate of site designation was greatest between 2000 and 2005 with an average area of million hectares being designated per year. The designation rate decreased after 2005 with the average area of designation standing at million hectares per annum between 2006 and It is important to remember that any benefit to biodiversity from certification designation would be undone if there was an increase in the area of natural forest converted to forestry. Data Data Sources The indicator combines national level data available through the FSC datasets for , with reasonable global coverage. Coverage is a reflection on if a country standard has been developed. The data that is collected includes, country, name of site, forest type (natural, plantation or mixed), the area in ha for each forest type, total area in ha, latitude, longitude, date site was certified and the body who carried out the certification. Data collection and management Data are collected every 6 months to a year by accessing the website for the FSC bodies in different countries. Data is obtained and/or cross checked with the individual certification certificates. Data is stored electronically in a Microsoft Excel spreadsheet at UNEP-WCMC. Through the FSC website, check on the validity of certificates is possible ( OUTPUTS, EXPERIENCES AND LESSONS LEARNT FROM THE 2010 BIODIVERSITY INDICATORS PARTNERSHIP 109
111 Associated Data Standards None Data custodians (institutions) FSC Data access and availability Data is freely available from FSC bodies Quality assurance procedures Data is cross checked against certificates Methods Methods Used Addition of the area of forest certified for each year and presented graphically. Technology/Systems in Use Excel spreadsheet Peer Review Indicator has not been peer reviewed Procedures for maintenance and archiving Data maintained by FSC Area of forest under sustainable management: degradation and deforestation Facts Focal Area: Sustainable Use Headline Indictor: Areas under sustainable management Key Indicator Partner/s: FAO Data Available: Regional/national case studies Development Status: Methodology under review. For latest indicator development see: The Indicator Indicators under development are likely to include assessments of parameters related to ecosystem and species diversity, forest intactness and resilience. This is an evolving process and other indicators may be developed in the future 110 BIODIVERSITY INDICATORS & THE 2010 BIODIVERSITY TARGET
112 Storyline Forest degradation is a serious, but complex issue with numerous drivers and different perceptions of what constitutes a degraded forest. Monitoring the status and the process of degradation is difficult; however, there are some indications that illegal logging (one of the contributors to degradation) is decreasing in some countries. Data Area of forest under sustainable management Data Sources The data source for forest area under sustainable management is national data in the form of standardized and officially validated country reports compiled by officially nominated National Correspondents to the Global Forest Resources Assessment (FRA) reporting process. The reporting process covers 233 countries and territories for four points in time (1990, 2000, 2005 and 2010). Data collection and management The national figures in the database are reported by the countries themselves following standardized format, definitions and reporting years, thus eliminating any discrepancies between global and national figures. The reporting format ensures that countries provide the full reference for original data sources as well as national definitions and terminology. Officially nominated national correspondents and their teams prepare the country reports for the assessment. Some prepare more than one report as they also report on dependent territories. For the remaining countries and territories where no information is provided, a report is prepared by FAO using existing information and a literature search. Once received, the country reports undergo a rigorous review process to ensure correct use of definitions and methodology as well as internal consistency. A comparison is made with past assessments and other existing data sources. Regular contacts between national correspondents and FAO staff by and regional/sub-regional review workshops form part of this review process. All country reports (including those prepared by FAO) are sent to the respective Head of Forestry for validation before finalization. The data are then aggregated at sub-regional, regional and global levels by the FRA team at FAO. Associated Data Standards To be defined and documented by the country. Countries should apply their own national definition or description of sustainable forest management and document in the country report the definition, criteria and process applied for estimating the area under sustainable forest management. If no national definition or criteria exist, countries are encouraged to use the following (ITTO, 2006): Forest areas that fulfill any of the following conditions: i. have been independently certified or in which progress towards certification is being made; ii. have fully developed, long-term (ten years or more) forest management plans with firm information that these plans are being implemented effectively; iii. are considered as model forest units in their country and information is available on the quality of management; iv. are community-based forest management units with secure tenure for which the quality of management is known to be of high standard; v. are protected areas with secure boundaries and a management plan that are generally considered in the country and by other observers to be well managed and that are not under significant threat from destructive agents. OUTPUTS, EXPERIENCES AND LESSONS LEARNT FROM THE 2010 BIODIVERSITY INDICATORS PARTNERSHIP 111
113 Data custodians (institutions) Food and Agriculture Organization of the United Nations. Data access and availability Data are freely available at Quality assurance procedures The country reports undergo a rigorous review process to ensure correct use of definitions and methodology as well as internal consistency. A comparison is made with past assessments and other existing data sources. Regular contacts between national correspondents and FAO staff by and regional/sub-regional review workshops form part of this review process. All country reports (including those prepared by FAO) are sent to the respective Head of Forestry for validation before finalization. The data are then aggregated at sub-regional, regional and global levels by the FRA team at FAO. Degradation and deforestation Data Sources Ongoing special study on forest degradation. Data collection and management Ongoing FAO special study and currently developing criteria and indicators, for eventual use by countries/partners in their reporting on forest degradation. Associated Data Standards The approach for the classification uses the seven elements of sustainable forest management to provide a framework for development of criteria and indicators. Data custodians (institutions) Food and Agriculture Organization of the United Nations. FRA@fao.org Data access and availability Degradation and deforestation: Quality assurance procedures Ongoing special study. Technical meeting with expert input to discuss approach and methods used Area of agricultural ecosystems under sustainable management Facts Focal Area: Sustainable Use Headline Indictor: Areas under sustainable management Key Indicator Partner/s: FAO Data Available: National case studies Development Status: Ready for sub-global use. For latest indicator development see: BIODIVERSITY INDICATORS & THE 2010 BIODIVERSITY TARGET
. Data source: LADA National Assessment, Senegal. George et al.")
114 The Indicator Figure A12. Area of agro-ecosystem under management practices supporting sustainability i.e., practices which are associated with positive trends in the LADA impact indicator food security, health and poverty (Note: percentages refer to the extent of all management practices within a given administrative unit). Data source: LADA National Assessment, Senegal. George et al Storyline For Senegal, one of the pilot countries of the LADA project, a total of 287 management interventions covering 9.1 million hectares were inventoried in the country-wide LADA baseline survey carried out in Only 12 percent of these cases, covering 1.7 million hectares, were judged by stakeholders to have had concurrent positive social, economic and environmental impacts over the preceding 10 years, and would therefore be considered sustainable. Of the major land use systems in the country, rainfed cropping recorded the highest percentage of management interventions which support sustainability (39 percent). In contrast, low values were associated with agropastoral areas. Future repeat surveys will allow trends from the 2008 indicator baseline to be determined, and conclusions drawn regarding threats on biodiversity due to management practices and their associated driving forces. Data Data Sources The indicator is derived from national surveys for which data are currently available for the six pilot countries of the LADA project: Argentina, China, Cuba, Senegal, South Africa, and Tunisia. Manuals on how to carry out LADA national assessments, including mapping, as well as information on the pilot countries are available at the LADA site ( Data collection and management The data collection procedure is that developed by the LADA project for the global assessment of land degradation ( In this procedure, estimates are made, based on expert opinion, of the extent of various types of resources-conserving interventions undertaken in different land-use systems as well as directly related impacts covering social, economic and environmental aspects. OUTPUTS, EXPERIENCES AND LESSONS LEARNT FROM THE 2010 BIODIVERSITY INDICATORS PARTNERSHIP 113
115 Associated Data Standards Sub-national data on the extent of various land and water management practices relevant to land degradation assessment have been collected by the 6 pilot counties of the LADA project (Argentina, China, Cuba, South Africa, Senegal, and Tunisia). These standardized data represent a national baseline from which to measure future progress on the adoption of practices supporting the sustainability of agro-ecosystems. Data custodians (institutions) The data custodians are the institutions involved in the LADA project: FAO, UNEP and the six pilot countries which participate in the project with their national institutions: Argentina, China, Cuba, Senegal, South Africa, Tunisia. LADA Project FAO Viale delle Terme di Caracalla Rome, Italy Contact: Riccardo Biancalani, LADA Technical advisor (riccardo.biancalani@fao.org) Data access and availability In development Quality assurance procedures In development Methods Methods Used In order to develop a practical methodology for a global assessment which would yield results within a reasonable time frame, the proxy indicator Area of agro-ecosystems under management practices which support sustainability is used as a substitute for Area of agro-ecosystems under sustainable management. This is in acknowledgement of the fact that the presence of resources-conserving interventions alone does not necessarily imply that the associated agro-ecosystems are under sustainable management. It is also necessary to evaluate the acceptance by stakeholders of their impacts. The data collection procedure for the proxy indicator is that developed by the LADA project for the global assessment of land degradation ( In this procedure, estimates are made, based on expert opinion, of the extent of various types of resources-conserving interventions undertaken in different land-use systems as well as directly related impacts covering social, economic and environmental aspects. The proxy indicator is subsequently derived by selecting the subset of those land management interventions which, based on stakeholder responses, have had simultaneous positive social, economic and environmental impacts within the previous 10 years. Technology/Systems in Use Geographic Information Systems (GIS) Peer Review Not yet applicable Procedures for maintenance and archiving Not yet applicable 114 BIODIVERSITY INDICATORS & THE 2010 BIODIVERSITY TARGET
116 2.2.2 Status of species in trade Facts Focal Area: Sustainable Use Headline Indictor: Proportion of products derived from sustainable sources Key Indicator Partner/s: The Convention on International Trade in Endangered Species of Wild Fauna and Flora (CITES) Data Available: Global time series, Development Status: Ready for global use. For latest indicator development see: The Indicator Better Worse Red List Index of species survival Internationally traded species Non-utilised species Utilised species that are not internationally traded Figure A13. Red List Index for internationally traded species (n=3,332 internationally traded non-data Defi cient species extant in 1988). Source: BirdLife International Better Worse Red List Index of species survival Non CITES-listed internationally traded species All species CITES-listed Figure A14. Red List Index for birds listed on CITES Appendix I and II (n=9,794 non-data Defi cient species extant in 1988, 1,447 non-data Defi cient extant CITES-listed species, and 2,601 non-data Defi cient extant internationally traded Storyline Over 40% of the world s bird species are utilized in one way or another and 80% (3,337) of these are internationally traded, primarily as pets. Internationally traded species have declined in status since 1988, although they are, on average, less threatened than utilised species that are not internationally traded. One possible reason for this difference relates to what the species are used for, as internationally traded species tend to be common and attractive species that are used as cage-birds, whereas locally used or nationally-traded species tend to be larger-bodied species that are hunted for food and are more sensitive to exploitation. OUTPUTS, EXPERIENCES AND LESSONS LEARNT FROM THE 2010 BIODIVERSITY INDICATORS PARTNERSHIP 115
117 CITES-listed birds are more threatened overall than all species on average (i.e., their RLI values are lower), indicating that CITES is, in general, listing species that are more threatened. Among internationally traded species, those listed on CITES Appendix I or II are declining faster than those that are not-cites listed. However, CITES operates only at an international level, and significant trade may also take place at a local and national level. Therefore, although this index reflects changes in the conservation status of CITES listed species, it is not possible to determine a direct causal link between CITES listing and the trends seen in this RLI. Data Data Sources Data for this indicator are extracted from the Species Information Service (SIS) database maintained by the Red List Unit of the IUCN Species Programme. These data are made available online through the IUCN Red List of Threatened Species: The data available online covers all taxa that have been assigned an IUCN Red List category with the exception of those designated as Not Evaluated (NE). All the assessments presented, except those for geographically isolated subpopulations or stocks, are for the taxon (species, subspecies or variety) as a whole (i.e., they indicate the global risk of extinction). No national or regional Red List assessments are included, except for national extinctions (where known) and an occasional note about national or sub-national status in one of the documentation fields. Data on utilisation in international trade are held in IUCN s SIS and BirdLife s WBDB and are available online at and Data collection and management The IUCN Species Survival Commission is an established knowledge network of ~8,000 volunteer members working in almost every country of the world. The IUCN Species Survival Commission (SSC) and IUCN Species Programme are jointly responsible for maintaining and developing the IUCN Red List of Threatened Species. In order to maintain the credibility of the IUCN Red List, the SSC has formalized the process by which species can be included on the list. In particular, this process includes the designation of Red List Authorities (RLAs). There are three routes by which assessments feed onto the IUCN Red List: Red List Authorities (RLA). The majority of RLAs are within one of the ~120 IUCN SSC Specialist Groups, but they can also be independent networks (termed Stand-alone Red List Authorities ), or IUCN Red List Partner institutions (e.g., BirdLife International, NatureServe) and other organizations (e.g., Project Seahorse). IUCN Species Programme and Red List Partner projects. These include the global biodiversity assessments (e.g., Global Amphibian Assessment, Global Mammal Assessment, Global Marine Species Assessment), and regional biodiversity assessment projects (e.g., Mediterranean biodiversity assessments, African freshwater biodiversity assessments) and assessments for the Sampled Red List Index (SRLI) run by the Zoological Society of London and the Royal Botanic Gardens Kew. External projects. Red List assessments resulting from projects carried out by individuals, academia, and organizations outside of the IUCN network (this includes national Red List initiatives). All three routes use the same basic process for preparing and submitting assessments for publication: data are gathered and provided by contributors ; assessors use the data and the IUCN Red List Categories and Criteria to assess the species, and to document the assessment; the assessment is reviewed by at least two reviewers ; accepted reviewed assessments are published on the IUCN Red List. But the specific activities involved in the process may differ depending on the route. Comprehensive information on data collection and management can be found in Hoffman et al. (in press) or Associated Data Standards The IUCN Red List process aims to collate comprehensive, expert-reviewed data on the distribution, abundance, population trends, ecology, habitat preferences, threats, utilization, conservation actions, and conservation status for all currently recognized wild species. Detailed information on all data types collected is available in Hoffman et al. (in press). 116 BIODIVERSITY INDICATORS & THE 2010 BIODIVERSITY TARGET
118 The Red List Index deals specifically with the actual IUCN Red List assessment (threat category) assigned to each species. This data is generated using the 2001 IUCN Red List Categories and Criteria (Version 3.1) (IUCN 2001, Mace et al. 2008), the most widely accepted system for classifying extinction risk at the species level (de Grammont & Cuaron 2006, Hoffmann et al. 2008, Lamoreux et al. 2003, Rodrigues et al. 2006). The IUCN Red List Categories include eight different categories of threat : Extinct(EX), Extinct in the Wild (EW), Critically Endangered (CR), Endangered (EN), Vulnerable (VU), Near Threatened (NT), Least Concern (LC) and Data Deficient (DD). A species qualifies for one of the three threatened categories (CR, EN, or VU) by meeting a critical threshold for that category in one of the five different available criteria (A-E). The criteria are designed to be objective, quantitative, repeatable, and to handle uncertainty. Two special tags (Possibly Extinct and Possibly Extinct in the Wild), under the category Critically Endangered, have been developed to indicate species for which there remains some reasonable doubt that a species is Extinct or Extinct in the Wild (Butchart et al. 2006a, IUCN Standards and Petitions Subcommittee 2010). Each IUCN Red List assessment is accompanied by a rationale that explains how then supporting documentation was used to justify the assessment, date of assessment, names 15 of assessors and reviewers, and any notes relating to IUCN Red Listing (e.g., any important issues, assumptions or inferences in deciding the category). Assessments are done globally at the species level, integrating the information across all populations and/or subspecies. Threat categories therefore reflect the overall conservation status of the species, which may, for example, be of Least Concern despite particular populations/subspecies being highly threatened. Data custodians (institutions) IUCN and Partner Organisations 219c Huntingdon Road Cambridge, CB3 0DL, UK Tel: +44 (0) Fax: +44 (0) Contact: Craig Hilton-Taylor, Head of Red List Unit (craig.hilton-taylor@iucn.org) Data access and availability All assessments must go through a review process before they can be accepted on the IUCN Red List. This involves at least two experts in the IUCN assessment process reviewing the assessment and agreeing that the data used have been interpreted correctly and consistently, and that uncertainty has been handled appropriately. Detailed information on how the review process differs between RLAs, IUCN Species Programme and Red List Partner projects and External Projects is provided in Hoffman et al. (in press). Methods Methods Used Calculating the RLI See details for Red List Index The RLI is calculated from the number of species in each Red List category (Least Concern, Near Threatened, Vulnerable, Endangered, Critically Endangered), and the number changing categories between assessments as a result of genuine improvement or deterioration in status (category changes owing to improved knowledge or revised taxonomy are excluded). The original methodology was described in detail in Butchart et al. (2004, 2005), and revised in Butchart et al. (2007); the latter is used here. An RLI value is calculated as follows: W c(t,s) RLI t =1 s W EX N where Wc(t,s) is the weight of category c for species s at time t, which ranges from 1 for Near Threatened to 5 for Extinct (WEX), and N is the number of assessed (non-data deficient) species. Put simply, the number of species in each Red List category is multiplied by the category weight, these products are summed, divided by the maximum possible product (the number of species multiplied by the maximum weight), and subtracted from one. This produces an index that ranges from 0 to 1 (see below). OUTPUTS, EXPERIENCES AND LESSONS LEARNT FROM THE 2010 BIODIVERSITY INDICATORS PARTNERSHIP 117
119 The method assumes that species should have been classified at their current Red List category since they were first assessed in1988, apart from those species for which genuine category changes have occurred, in which case these status changes are assigned to appropriate time periods, corresponding to the dates in which all species were reassessed (see Collar & Andrew 1988, Collar et al. 1994, BirdLife International 2000, 2004, 2008). To determine these genuine cases, all category changes during for birds were assigned a reason for change, allowing genuine ones to be distinguished from those resulting from improved knowledge or taxonomic revisions (see Butchart et al. 2004, 2005, 2007 for further details). Selecting species for the Indicator of Species in International trade For each genuine category change, the primary driver of the change in status was identified. Information was extracted from BirdLife s extensive datasets on population size and trend, range size and trend, ecology, life history, threats (including threat magnitude, timing, scope, severity and stresses), and conservation actions implemented and underway (all of which are synthesised in the World Bird Database, and summarised in the published species factsheets at including the data sources, unpublished literature and correspondence underpinning the published Red List assessments. Both current information and earlier assessments were examined. For each genuine status change, the parameter that increased or decreased sufficiently to cross a Red List category threshold was identified (e.g., the population size fell below 250 mature individuals, the number of locations increased to six owing to successful establishment of a translocated population, etc). Then, for the specific parameter for each species, the primary driver of change was categorised using the IUCN/CMP classification scheme for threats (see Where one of these factors was a secondary (contributory) driver, this was also recorded. Primary drivers were defined as those believed to have been a cause of the majority (i.e., >50%) of the decline/ improvement (as measured by the change in the population or range parameter that crossed the relevant Red List category threshold). Secondary drivers were defined as those believed to have caused 10-49% of the decline/improvement. For the driver of hunting, trapping and trade, we attempted to determine the relative contribution of international/regional, national/sub-national and local/subsistence scale use and trade, again by scoring these as primary or secondary as defined above. These scores were assigned on the basis of information held in BirdLife s World Bird Database and associated documentation and references. They should be regarded as preliminary, and require validation through more in-depth research than was feasible for this project. Comparing the importance of different factors driving trends in the RLI In order to compare the importance of different factors driving trends, it is simpler to interpret RLIs with a common starting point rather than a common end point (i.e., to ask the question what would be the status of all species now if only factor X or Y had been operating over recent years?, rather than what would have been the status of all species in year A if only factor X or Y had driven them to today s status? ). To achieve this, the initial RLI data point for each factor was set to the value calculated for the set of species considering status changes driven by all factors. Hence, these RLIs show, for the set of species concerned, the net effect of status changes driven only by the particular factor concerned. This permits a more logical comparison than starting from the present RLI value and asking what trajectory the RLI would have taken to reach that value if it had been driven by different factors. CITES Appendix data Data on listing of species on CITES Appendices were obtained from UNEP-WCMC in September 2009 and are believed to be up to date. Data on the utilisation of birds and the scale of any trade come from BirdLife s World Bird Database, and are summarized in Butchart (2008). Technology/Systems in Use See details for Red List Index Peer Review The underlying methodology has been extensively described and reviewed in reputable scientific publications (Butchart & Vie 2006, Butchart et al. 2004, 2005, 2006, 2007, 2008, 2010, McGeoch et al. 2010, Hoffman et al., in press). Procedures for maintenance and archiving See details for Red List Index (Section 1.4.1) 118 BIODIVERSITY INDICATORS & THE 2010 BIODIVERSITY TARGET
120 Wild Commodities Index Facts Focal Area: Sustainable Use Headline Indictor: Proportion of products derived from sustainable sources Key Indicator Partner/s: IUCN Species Survival Commission (SSC); IUCN Sustainable Use Specialist Group (SUSG); UNEP-WCMC Data Available: Global time series, Living Planet Index: Development Status: Ready for global use: Living Planet Index. Methodology under review: Harvest indicator. For latest indicator development see: The Indicator Index (1970=1) Upper confidence interval Index value Lower confidence interval No change in the index 0 Figure A15. Global Living Planet Index for Utilized Species Source: IUCN SSG Storyline The current global LPI for utilised species shows a 15% decline from 1970 to This is less than the recorded decline for utilised and non-utilised species combined, which was measured at 30%. A possible reason for this may be that utilized species are more likely to be common or widespread, or that they may be more resilient or better managed. However, it is important to note that a significant negative trend for utilised species has been recorded. Data Data Sources This indicator measures mean trends for populations of vertebrate species that are utilized by humans for any purpose (food, medicine, pets, clothing, sport, etc). The primary data source for the Wild Commodities Index is the global LPI - see above for details on how and where data were sourced. Additional sources of data were used to select the species included in the LPI for Utilized Species. These include: the IUCN Red List ( the World Bird Data Base ( html), the CITES trade database ( FAO forestry country profiles (www. fao.org/forestry/nwfp/en/ and the International Timber Trade Organisation (ITTO: publications by CIFOR ( the University of British Columbia (UBC) Sea Around Us Project ( and the Fishbase online database ( A database of Utilized Species was compiled by applying a filter to each database to select those species that were coded as being utilized and/or as being in active commercial trade. As for the global LPI, this indicator can be calculated for species populations from selected regions, biomes or taxonomic groups, depending on data availability, although it is used primarily as a global measure of vertebrate species that are utilized by humans. Temporally, the index is based on records from between 1970 and OUTPUTS, EXPERIENCES AND LESSONS LEARNT FROM THE 2010 BIODIVERSITY INDICATORS PARTNERSHIP 119
121 Data collection and management As outlined, the primary source of data for this indicator is the global LPI. Therefore data collection and management procedures for these particular data follow those for the global LPI detailed above. Data from other listed sources have only been collected as a once-off for the development of this indicator for the 2010 BIP. The database of Utilized Species is currently held at the World Conservation Monitoring Centre (WCMC), but is not currently freely available primarily for reasons of confidentiality, and direct contribution prohibited to ensure the highest possible data quality and consistency. Associated Data Standards Data will only have been entered into each of the source databases (e.g., LPI, IUCN Red List) if they met certain criteria - see details for these indicators above or in references provided. Species were only entered into the Utilized Species database if they were coded in the source databases as utilized or as being in active commercial trade. Data custodians Utilized Species Database: UNEP-WCMC 219 Huntingdon Road, Cambridge CB3 0DL, UK Tel: +44 (0) Fax: +44 (0) Contact: Megan Tierney (Megan.Tierney@unep-wcmc.org) Data access and availability The Utilized Species database is currently locally stored on the premises of WCMC. Access is restricted to those working with the indicator directly. However, cuts have been provided for some collaborative projects - e.g., a synthesis of global biodiversity indicators reporting on progress toward reducing biodiversity loss (Butchart et al. 2010a). Data are not currently freely available primarily for reasons of confidentiality, and direct contribution prohibited to ensure the highest possible data quality and consistency. However, the intention is to make sections of the database (i.e., those which do not contain confidential data) available online in the near future. Quality assurance procedures All data extracted from source databases have internal quality assurance checks. Additional quality assurance procedures included cross-checking the status of any species that had been identified as not being utilized between different data sources. Methods Methods Used The LPI for Utilized Species was generated using the same procedure as for the global LPI - see details above. Note: indices for terrestrial, marine and freshwater were also calculated for tropical and temperate species. Reliability of the estimate was determined by examining confidence intervals calculated from bootstrapping techniques (10,000 iterations were used). Technology/Systems in Use Statistical approaches follow those of the global LPI - see details above. Peer Review The indicator is based primarily on published data in peer-reviewed journals. The methodology for selecting species to be included has undergone internal peer-review by the Steering Committee for the Wild Commodities Index. Methodology for calculating the global LPI, upon which the LPI for Utilized Species has been based has been extensively described and reviewed in reputable scientific publications - for example: Collen B., Loh J., Whitmee S., McRae L., Amin R. & Baillie J.E.M Monitoring change in vertebrate abundance: the Living Planet Index. Conservation Biology 23: Loh, J., Green, R.E., Ricketts, T., Lamoreux, J., Jenkins, M., Kapos, V. & Randers, J The Living Planet Index: using species population time series to track trends in biodiversity. Phil. Trans. R. Soc. B. 360: BIODIVERSITY INDICATORS & THE 2010 BIODIVERSITY TARGET
122 Procedures for maintenance and archiving The Utilized Species database is archived in Access and Excel. No changes or additions have been made to this database since However, new or additional data on utilized species that has been added to the global LPI database since this time could be extracted and matched to the existing utilized species database. The index could then be recalculated to add to or investigate the emergence of any new trends Ecological Footprint Facts Focal Area: Sustainable Use Headline Indictor: Ecological Footprint and related concepts Key Indicator Partner/s: Global Footprint Network Data Available: Global, regional and national time series, 1961 onwards Development Status: Ready for global and national use. For latest indicator development see: The Indicator Ecological Footprint (number of Earths) World Biocapacity Built-up Land Forest Land Fishing Ground Grazing Land Cropland Carbon Footprint Figure A16. Humanity s Ecological Footprint by component, Source: Global Footprint Network Storyline Human demand on ecological assets has constantly increased in the period Demanding almost 50% of the planet s regenerative capacity in 1961, humans now demand 144% of this capacity - the equivalent of 1.4 planets worth of resources and ecological services. Resource and ecological service demands have increased for all land types, although demand from forest and carbon uptake land has increased fastest. Differences in Footprint values can be also found at regional level as per capita consumption values are highest in North America (8.7 gha/capita) and Europe (4.5), and lowest in Africa (1.4) and Asia-Pacific (1.5). An even more heterogeneous situation can be found at national level. Footprint values for nearly 160 countries can be found in Ewing et al. (2009). Data Data Sources Data from international statistical databases are used by Global Footprint Network to calculate national Ecological Footprint and biocapacity values for nearly 160 countries. The Ecological Footprint is a temporally explicit and multi-dimensional indicator, which can be applied to single products, cities, regions, nations and the whole biosphere. More than 200 countries for the period are tracked. OUTPUTS, EXPERIENCES AND LESSONS LEARNT FROM THE 2010 BIODIVERSITY INDICATORS PARTNERSHIP 121
123 National Ecological Footprint accounts utilize approximately 50 million data points, primarily based on international datasets published by the United Nations Food and Agriculture Organization (FAOSTAT), United Nations Commodity Trade Statistics Database (UN Comtrade), International Energy Agency (IEA) and Global Agro-Ecological Zones 2000 (IIASA and FAO, 2000). Production, import, and export statistics for agricultural, forestry and fisheries primary and derived products are obtained from the FAO ProdSTAT, FAO ForesSTAT and FAO FishSTAT Statistical Database. Production statistics for carbon dioxide emissions are obtained from the International Energy Agency. Trade statistics for commodities are drawn from UN Comtrade. Land yield and potential crop productivity data are obtained by FAOSTAT and the FAO GAEZ model respectively. Data on marine and terrestrial carbon sequestration capacity is taken from IPCC. Data collection and management National Ecological Footprint values are updated and published on an annual basis by Global Footprint Network under the National Footprint Accounts (NFA) programme. Prior to the calculation of each new edition of the NFA, starting raw data (used to calculate national Ecological Footprint values) are drawn from the international statistical databases reported above and stored in an internal database (MySQL) maintained by Global Footprint Network. In calculating each country s Ecological Footprint, this database is queried for the appropriate country and year values - via custom built data managing software - and the resulting information are organized in 79 interconnected worksheets in a Microsoft Excel workbook, which constitutes the NFA Excel workbook for that specific country. Results for each country and each year are then stored into MySQL and available to be distributed to users upon request. A detailed Guidebook (Kitzes et al. 2008a) and Method paper (Ewing et al. 2008b) org/download.php?id=508) are then provided to explain the methodology of the Ecological Footprint, the accounting framework of the National Footprint Accounts, and to walk users through each of the 79 worksheets. All starting data used by Global Footprint Network in calculating NFA can be accessed by users by directly contacting the respective databases custodian institutions, though a subscription might be required. There is no public access to the Global Footprint Network s internally maintained database while National Footprint Accounts Licenses and the most recent National Footprint Accounts calculation files are available for both commercial use and non-commercial review under license. Full information about Ecological Footprint values licensing can be found at Associated Data Standards As reported above, a detailed Guidebook and Method paper are freely available for download from Global Footprint Network s website. These two documents explain the methodology of the Ecological Footprint, the specific classification and coding systems of each set of raw starting data used in the calculation, as well as the accounting framework of the National Footprint Accounts. Moreover, in 2009, Global Footprint Network officially released the Ecological Footprint Standards 2009 ( This document is designed to ensure that Footprint assessments are produced consistently and according to community-proposed best practices. They aim to ensure that assessments are conducted and communicated in a way that is accurate and transparent, by providing standards and guidelines on such issues as use of source data, derivation of conversion factors, establishment of study boundaries, and communication of findings. The Standards are applicable to all Footprint studies, including sub-national populations, products, and organizations. The Standards have been developed through a consensus, committee-based process by a Standards Committee (more info on this committee can be found at drawn from representatives of academia, government, NGOs, and consulting firms. Data custodians (institutions) National Footprint Account values are maintained by Global Footprint Network. Info on Footprint methodology and national Footprint values can be found on Global Footprint Network s web-site: org/ or requested by at info@footprintnetwork.org. National Footprint Accounts are a work in progress and improvements to the Ecological Footprint methodology are ensured by the National Accounts Improvement project, an ongoing research and development initiative designed to improve the accuracy, transparency, and applicability of the accounts and the methodology behind them. Continual improvements of the scientific basis of the National Footprint Accounts are supported by the National Accounts Review Committee. More info on this committee and its activities can be found at footprintnetwork.org/en/index.php/gfn/page/national_accounts_review_committee/. 122 BIODIVERSITY INDICATORS & THE 2010 BIODIVERSITY TARGET
124 Data access and availability See information provided above and available online: licenses1/. Quality assurance procedures As with any scientific assessment, Ecological Footprint values need to be evaluated in terms of reliability and validity. This is a complex task given that the National Footprint Accounts draw on a wide range of datasets, many of which have incomplete coverage, and most of which do not specify confidence limits. Considerable care is taken to minimize any data inaccuracies or calculation errors that might distort the National Footprint Accounts, including inviting national governments to collaboratively review the assessment of their country for accuracy, and develop improvements in the method either specific to their country or that generalize to all countries. In addition, efforts are continually made to improve the transparency of the National Footprint Accounts, allowing for more effective internal and external review. Overall, the Accounts are designed to err on the side of over-reporting biocapacity and under-reporting Ecological Footprint of production, making it less likely that any errors will significantly overstate the scale of human demand for biocapacity. Detailed info on potential errors in calculating Ecological Footprint values as well as the quality assurance procedures for raw data and final Footprint results can be found on pages of the Ecological Footprint Atlas 2009 (Ewing et al. 2009) Methods Methods Used The Ecological Footprint measures human demand on the biosphere s regenerative capacity in terms of both direct and indirect demands for resource production and carbon sequestration capacity, and compares them with the planet s ecological assets (biocapacity). The Ecological Footprint tracks resource and emissions flows and provides a picture of a country s dependence on ecological assets, in the same way GDP tracks monetary flows and provides a picture of the monetary status of a country. The Ecological Footprint tracks six key ecosystem services associated with particular types of land cover: plantbased food and fibre products (cropland); animal-based food and other animal products (cropland and grazing land); fish-based food products (fishing grounds); timber and other forest products (forest); absorption of anthropogenic carbon dioxide emissions (carbon uptake land); and the provision of physical space for shelter and other infrastructure (built-up area). By tracking a wide range of human activities, the Ecological Footprint monitors the combined impact of anthropogenic pressures that are more typically evaluated independently (carbon dioxide emissions, fisheries collapse, land degradation/ land-use change, etc) and can thus be used to understand, in an integrated manner, the environmental consequences of the pressures humans place on the biosphere and its composing ecosystems. The Ecological Footprint is a flows indicator; however, it is measured in terms of the bioproductive land areas needed to generate such flows, and thus is expressed in the unit of global hectares (gha). There is an advantage in expressing demand for flows in terms of bioproductive land appropriation, in that the use of an area better reflects the fact that many basic ecosystem services and ecological resources are provided by surfaces where photosynthesis takes place (bioproductive areas). These surfaces are limited by physical and planetary constraints and the use of gha helps to better communicate the existence of physical limits to the growth of human economies. Method papers, manuals, guidebooks and peer reviewed articles are available on line and include a detailed description of the methods in place for calculating the indicator. Selected papers include Wackernagel et al. 1999a; Wackernagel et al. 1999b; Wackernagel et al. 2002; Monfreda Wackernagel & Deumling 2004; Galli et al. 2007; Ewing et al. 2008; Kitzes et al OUTPUTS, EXPERIENCES AND LESSONS LEARNT FROM THE 2010 BIODIVERSITY INDICATORS PARTNERSHIP 123
125 Technology/Systems in Use Peer Review Almost 20 years of research application and methodological advancements (Ewing et al. 2008a&b, 2009, Galli et al. 2007, Kitzes et al. 2008a, Monfreda et al. 2004, Wackernagel et al. 1999a&b, 2002) have made the Ecological Footprint an increasingly robust theoretical framework. However it continues to be refined and improvements are ensured by the National Accounts Improvement project, and by the various review projects countries around the world are carrying out independently or together with Global Footprint Network, and overseen by the National Accounts Review Committee. A number of international agencies and countries have tested the Ecological Footprint, and several - including Switzerland, Finland, Japan, United Arab Emirates, Ecuador and Luxembourg - are now using the tool in varying capacities. The list of external reviews of the Ecological Footprint methodology and the National Footprint Accounts accounting framework includes the following studies and publications: Switzerland (both the technical and the descriptive report). Germany - France - Stiglitz commission ( France - SOeS of the French Ministry of Sustainable Development. The study Une expertise de l empreinte écologique (May 2009, No 4) examined the transparency and reproducibility of the National Footprint Accounts and found reproducibility of time trends within 1-3 percent. The initial report is available at uploads/media/etudes_documentsn4.pdf or see France - Conseil économique, social et environnemental. «Les indicateurs du développement durable et l empreinte écologique» - le 11 mai Projet d avis présenté au nom de la Commission ad hoc par M. Philippe Le Clézio, rapporteur. European Union s Beyond GDP conference ( a strong endorsement arose from the European Economic and Social Committee. Ireland - Belgium - DG Environment - June 2008: Potential of the Ecological Footprint for monitoring environmental impact from natural resource use available at Eurostat - United Arab Emirates - al. Basama al. Beeiya Initiative Directorate General for Research, Division Industry, Research, Energy, Environment, and Scientific and Technological Options Assessment (STOA), 2001, Ecological Footprinting stoa/publications/studies/ _en.pdf 124 BIODIVERSITY INDICATORS & THE 2010 BIODIVERSITY TARGET
126 As mentioned before, the Ecological Footprint methodology is continuously improved under the guidance of the National Accounts Review Committee and following the indications of the international scientific community. In 2009, a group of almost 30 scientists and practitioners from around the world have proposed a series of key research priorities for improving national Ecological Footprint accounting (Kitzes et al. 2009). Building on the above mentioned 2009 document, a specific agenda for improving Ecological Footprint accounts has been compiled by Global Footprint Network s National Accounts Review Committee, with input from government agencies and other organizations that use the Ecological Footprint, as well as from the general public. This agenda focuses on improvements to the science behind the accounts, to the calculation methodology, and on the usefulness of the metric for policy makers and other stakeholders. The 2010 Edition is being prepared (due to release in September 2010) and improvements will include: better modelling of cattle metabolism; data filtering; inclusion of trade in electricity; more accurate embodied energy figures for trade commodities Finally, it has to be highlighted that the Ecological Footprint has been recently invited to participate in the SEEA (System of Integrated Environmental and Economic Accounting) discussion of the UN, to explore the possibility to include the Ecological Footprint in Volume 3 of the next revision of SEEA (due in 2013). Procedures for maintenance and archiving See above OUTPUTS, EXPERIENCES AND LESSONS LEARNT FROM THE 2010 BIODIVERSITY INDICATORS PARTNERSHIP 125

127 3.1.1 Nitrogen deposition Facts Focal Area: Threats to biodiversity Headline Indictor: Nitrogen deposition Key Indicator Partner/s: International Nitrogen Initiative Associate Indicator Partners: SCOPE and IGBP Data Available: Global and regional time series, 1860 onwards Development Status: Ready for global and regional use. For latest indicator development see: The Indicator Figure A17. Spatial patterns of total inorganic nitrogen deposition in (a) 1860 and (b) early 1990s Source: Lelieveld & Dentener 2000; Galloway et al Storyline On a global basis, nitrogen deposition from the atmosphere has increased by a factor of 4 between 1860 and Many regions have experienced increases in nitrogen deposition by a factor of 8 or more. Every continent of the world, except Antarctica, has experienced biodiversity losses due to these increases. In the future, large regions of Asia, Africa and Latin America are expected to see continued increases in nitrogen deposition 126 BIODIVERSITY INDICATORS & THE 2010 BIODIVERSITY TARGET
128 Data Data Sources This indicator describes the rate of nitrogen deposition (dry and wet) from the emissions of reactive nitrogen (NOx) and ammonia (NH 3 ), including from natural sources, to estimate global nitrogen deposition. Emissions estimates were based on preliminary data from the emissions database for the Intergovernmental Panel on Climate Change fifth assessment report, partly derived from the Emissions Database for Global Atmospheric Chemistry (EDGAR version 4; J. Van Aardenne, S. Monni & U. Doering et al., unpublished data; eu). Data for 2000 emissions from biomass burning came from the Global Fire Emissions Database ( falw.vu/~gwerf/gfed/index.html). Emissions are described in Lamarque et al. (2010; The emissions data are input into a model, CAM3.5, that permits calculation of N deposition on a gridded scale of 1.9ºx2.5º, for the time period 1850 to The deposition is dependent at each grid point on the distribution of meteorological conditions and of nitrogen-containing compounds.data collection and management Emission data are available as netcdf files from ge&page=download. They are available every decade and provide emissions on a monthly timescale. Deposition data are available at ftp://acd.ucar.edu/user/lamar/ndep/ /ndep_ _1.9x2.5.nc ftp://acd.ucar.edu/user/lamar/ndep/ /ndep_ _1.9x2.5.nc Associated Data Standards Data standard: netcdf format using the CF-convention for variable and dimension names. Data custodians (institutions) Emissions: International Institute for Applies Systems Analysis (IIASA), Austria Deposition: National Center for Atmospheric Research (NCAR), USA Contact name: Jean-François Lamarque (lamar@ucar.edu) Data access and availability It is freely available at the web sites described above. Quality assurance procedures Evaluation of the emissions is discussed in Lamarque et al. (2010). Nitrogen deposition is discussed in a paper submitted to Climatic Change. OUTPUTS, EXPERIENCES AND LESSONS LEARNT FROM THE 2010 BIODIVERSITY INDICATORS PARTNERSHIP 127
129 Methods Methods Used From the emissions described above, the global modelling computes the rate of transformation into additional nitrogen containing compounds (e.g., nitric acid and ammonium nitrate). The model then represents the removal rate of those compounds based on their effective Henry s law coefficient and associated dry deposition parameters. Technology/Systems in Use We use the global three-dimensional Community Atmosphere Model version 3.5 (Gent et al. 2009) modified to include interactive chemistry to calculate distributions of gases and aerosols in the troposphere and the lower to mid-stratosphere. In order to limit the computational cost, this model only solves for the atmospheric and land portions of the climate system, using pre-computed sea-surface temperatures and sea-ice extent as boundary conditions. The model configuration used in this study includes a horizontal resolution of 1.9 (latitude) by 2.5 (longitude) and 26 hybrid levels, from the surface to 40 km with a timestep of 30 minutes. In order to simulate the evolution of the atmospheric composition over the recent past, the chemical mechanism used in this study is formulated to provide an accurate representation of both tropospheric and stratospheric chemistry. The tropospheric chemistry mechanism has a limited representation of non-methane hydrocarbon chemistry in addition to standard methane chemistry, extended from Houweling et al. (1998) with the inclusion of isoprene and terpene oxidation and updated to JPL-2006 (Sander et al. 2006). This model has a representation of aerosols based on the work by Tie et al. (2001, 2005). Furthermore, the model includes a representation of ammonium nitrate that is dependent on the amount of sulfate present in the air mass following the parameterization of gas/aerosol partitioning by Metzger et al. (2002). Dry and wet removal of all species is performed using the simulated meteorology and follows the methods described in Emmons et al. (2010). References: Emmons et al. 2010; Gent et al. 2009; Houweling et al. 1998; Sander et al. 2006; Tie et al. 2001; Tie et al Peer Review The emissions have been reviewed in the paper listed above. The model representations of chemistry and removal processes have been discussed in numerous publications, including Dentener et al. 2006, Lamarque et al and Holland et al Procedures for maintenance and archiving All files listed above are regularly backed-up and have a copy on long-term storage facility at the National Center for Atmospheric Research Trends in Invasive Alien Species Facts Focal Area: Threats to biodiversity Headline Indictor: Trends in Invasive Alien Species Key Indicator Partner/s: GISP Associate Indicator Partners: CIB, BirdLife International Data Available: Global trend (RLI: , international policy: , national policy: ), global baseline (number of documented IAS: 2009) Development Status: Ready for global use. For latest indicator development see: BIODIVERSITY INDICATORS & THE 2010 BIODIVERSITY TARGET
130 The Indicator Better status Worse status Cumulative % species changing category IAS were primary driver of category change IAS were secondary driver of category change Figure A18. Cumulative percentage of bird species undergoing genuine IUCN Red List category changes driven by impacts of IAS. Example of IAS impact for birds Source: BirdLife International Percentage of countries with national legislation relevant to controlling IAS Figure A19. Adoption of national legislation relevant to the prevention or control of IAS. Source: Global indicators of biological invasion: species numbers, biodiversity impact and policy responses, McGeoch et al. (2010). Storyline PRESSURE: The number of IAS is higher on islands and in countries that are more developed and have more information available on IAS. The mean number of IAS per country is 50 for the 57 countries assessed. STATE: Red List Indices show that the extinction risk of birds, mammals and amphibians is increasing over time. Analyses of the drivers of these shifts in species status show that for all three groups, IAS were having a net negative impact. Although some threatened species have improved in status (as a result of successful control or eradication of IAS), more have been uplisted to higher threat categories owing to increasing spread and threats from IAS. RESPONSE: There are 10 international agreements with provisions for tackling IAS that have been ratified by a cumulative total of 1,434 signatories (82% of the maximum possible number). All countries are signatory to at least two IAS-relevant international conventions; more than 90% are signatory to at least half, and 8% of countries are signatory to all % of countries have overarching national legislation to manage, control and/or limit the spread and impact of IAS. Data Data sources Number of documented IAS per country: Baseline (2009) data of records of invasive alien mammal, bird, vascular plant, amphibian, freshwater fish and marine (including algae, corals, invertebrates and fish) species in a stratified random selection of 57 countries. National level data. Red List Index for impacts of invasive alien species: Red List conservation status changes primarily and secondarily due to impacts from invasive alien species for birds (1988, 2008), mammals (1996, 1994, 2000, 2004, 2008) and amphibians (2004) from IUCN redlist. Global scale. Trends in international invasive alien species policy: Dates (year) countries become party to 10 international agreements relevant to controlling alien species ( ). Trend in national invasive alien species policy: Dates (year) countries enact legislation relevant to controlling alien species ( ). OUTPUTS, EXPERIENCES AND LESSONS LEARNT FROM THE 2010 BIODIVERSITY INDICATORS PARTNERSHIP 129
131 Data collection and management Number of documented IAS per country: data collected from peer-reviewed literature, and online databases. Once off collection for 2010 indicator. The database is located at: Red List Index for impacts of invasive alien species: data collated from the IUCN redlist ( Trends in international invasive alien species policy: data collected from websites of conventions and organisations with relevant agreements. Trend in national invasive alien species policy: Legislation texts were obtained from the online legislation database Associated Data Standards Number of documented IAS per country: species were only included if they are alien to the country concerned, established in the country and there is evidence in the peer-reviewed literature of biodiversity impacts or geographic spread, high population growth rates or large population sizes anywhere in the species introduced range. Red List Index for impacts of invasive alien species: data only used where invasive alien species are a primary or secondary threat. Trends in international invasive alien species policy: only included policy relevant to regulating the movement of alien species, preventing introductions and controlling or eradicating alien species. Trend in national invasive alien species policy: only included policy relevant to regulating the movement of alien species, preventing introductions and controlling or eradicating alien species. Legislation was only included if it concerned more than one taxa e.g., plants and animals (or if there was more than one piece of legislation covering different taxa) and if the legislation was not solely concerned with the protection of agriculture and human health. Data custodians Number of documented IAS per country: Centre for Invasion Biology. IASI@sun.ac.za Red List Index for impacts of invasive alien species: Stuart Butchart stuart.butchart@birdlife.org Trends in international invasive alien species policy: Centre for Invasion Biology. IASI@sun.ac.za Trend in national invasive alien species policy: Centre for Invasion Biology. IASI@sun.ac.za Data access and availability Number of documented IAS per country: Trends in international invasive alien species policy: to be uploaded to Trend in national invasive alien species policy: to be uploaded to Quality assurance procedures Number of documented IAS per country: standardised approach to inclusion of invasive species. Red List Index for impacts of invasive alien species: standardised approach to calculating status changes and whether invasive species are responsible for this conservation status change. Trends in international invasive alien species policy: only included relevant policy. Trend in national invasive alien species policy: only included relevant policy 130 BIODIVERSITY INDICATORS & THE 2010 BIODIVERSITY TARGET
132 Methods Methods Used Number of documented IAS per country: A simple count of the documented invasive alien species per country from primary literature and technical reporting (Governmental Grey Literature). Red List Index for impacts of invasive alien species: A calculation of the number of species in each Red List category and the number changing categories between assessments as a result of genuine improvement or deterioration in status (category changes owing to improved knowledge or revised taxonomy are excluded). For each genuine category change, the primary driver (threat, or threat mitigated) is identified. RLIs are then calculated to show, in a stacked area chart, the contribution of each threat to the overall deterioration in the status of species. The RLI shows changes in the overall extinction risk of sets of species, with RLI values relating to the proportion of species expected to remain extant in the near future without additional conservation action. An RLI value of 1.0 equates to all species being categorised as Least Concern, and hence that none are expected to go extinct in the near future. An RLI value of zero indicates that all species have gone Extinct. Trends in international invasive alien species policy: Cumulated number of international agreements relevant to invasive alien species control through time (per year, using year of establishment of each agreement). Cumulated number of countries party to all relevant international agreements. Trend in national invasive alien species policy: Cumulated number of countries with legislation relevant to controlling alien species through time (per year, using year legislation enacted). Technology/Systems in Use Number of documented IAS per country: Count. Red List Index for impacts of invasive alien species: Count and proportion Trends in international invasive alien species policy: Count. Trend in national invasive alien species policy: Count and proportion. Peer Review Butchart et al. 2005; Butchart et al. 2004; McGeoch et al Procedures for maintenance and archiving All of the indicators can be updated through time building on current data. OUTPUTS, EXPERIENCES AND LESSONS LEARNT FROM THE 2010 BIODIVERSITY INDICATORS PARTNERSHIP 131
133 4.1.1 Marine Trophic Index Facts Focal Area: Ecosystem integrity and ecosystem goods and services Headline Indictor: Marine Trophic Index Key Indicator Partner/s: Sea Around Us Project Data Available: Global, regional and national time series, 1950 onwards Development Status: Ready for global use. For latest indicator development see: The Indicator Trophic Level Figure A20. Combined (Global) Marine Trophic Index for all Large Marine Ecosystems The combined index excludes data for Peruvian anchoveta and large pelagic fi sheries. The very localized fi shery for Peruvian anchoveta, a low trophic level species, is the largest single-species fi shery in the world, and it exhibits extreme fl uctuations in landings which would mask the comparatively more subtle patterns in trophic level changes by the rest of the world s fi sheries. Data for large tunas and billfi shes have been excluded as much of their catch is taken in pelagic waters outside of currently defi ned LMEs. Inclusion of these species would artifi cially infl ate trophic level patterns, especially in recent decades, as tuna fi sheries have expanded tremendously. Source: adapted from Pauly et al Storyline The trend in mean trophic level for all LMEs combined indicates a decline in the MTI from a peak in the 1950s to a low in the mid 1980s. The decline represents a global decrease in the abundance of high tropic level species, resulting in the phenomenon of fishing down marine food webs, in which fisheries catches increasingly consist of smaller fish and invertebrates lower in the food web. From the mid 1980s there is a trend reversal and the global MTI increases. This increase does not necessarily represent improvements in the global sustainability of fisheries and in turn an increase in the abundance of higher trophic level species. In fact, data from the complementary Fishing-in-Balance (FiB) index (see a measure of the balance between catches and tropic level indicates that this increase is the result of offshore expansion of the fisheries into pelagic waters outside of the currently defined LMEs. 132 BIODIVERSITY INDICATORS & THE 2010 BIODIVERSITY TARGET
134 Data Data Sources Global coverage, by Exclusive Economic Zone (EEZ), Large Marine Ecosystems (LMEs), and High Seas. Currently, all available for at Data collection and management MTI for each EEZ, LME, and High Seas area available at Associated Data Standards MTI based on taxa and catch data provided by several sources, including FAO, ICES etc., trophic level information mainly from FishBase and SeaLifeBase (Sea Around Us Project partners). Data custodians (institutions) Sea Around Us project, Fisheries Centre, University of British Columbia Data access and availability MTI in fisheries catch time series by EEZs, LMEs and High Seas are freely available at Quality assurance procedures Catch data from FAO is quality checked upon download for errors. For a number of countries, catch reconstructions have been made which have significantly improved the basic landings data from FAO. These reconstructions fill in the gaps in the original catch data with supplementary national and historical information. Data on taxa are from FishBase and SeaLifeBase, the imminent database for information on marine species and their environment. The information from these websites is provided by field experts in fisheries biology. Methods Methods Used Trophic levels (TL) express the position of an animal in a food web, relative to the primary producers (which have a definitional TL of 1). TL can be calculated from: TL k = j TL j DC ij where TLj represents the fractional trophic levels of prey j, and DCij represents the fraction of j in the diet of i. Using catch data, and TL estimates for species (or groups thereof ), mean TL and, hence, Marine Trophic index values, can be computed, for each year k from: Mean TL k = i (Y ik TL i ) / i Y ik Where Y i refers to the landings of species (group) i, as included in fisheries statistics. [Note that, ideally, mean TL should be based on catches - i.e., all animals killed by fishing (landings + discards) - rather than only on the landings included in most fisheries statistics. This is ignored here, where we deal only with landings]. Mean maximum length (ML) is calculated similarly to mean TL, by weighting by the catches. The Sea Around Us Project is currently working on addressing possible biases in MTI that can be attributed to offshore expansion of fishing effort. This work will facilitate the understanding of the extent to which geographic expansion may be influencing MTI, as expressed by the FiB. Peer Review Pauly et al. 1998; Pauly & Palomares 2005; Pauly & Watson Procedures for maintenance and archiving As part of the Sea Around Us Project database and web presence, the MTI by EEZs, LMEs and High Seas are being maintained and updated every 2-3 years in line with the global fisheries catch allocation processes of the Project. OUTPUTS, EXPERIENCES AND LESSONS LEARNT FROM THE 2010 BIODIVERSITY INDICATORS PARTNERSHIP 133
135 Stations Stations Stations Stations Stations Water Quality Index for Biodiversity Facts Focal Area: Ecosystem integrity and ecosystem goods and services Headline Indictor: Water quality of freshwater ecosystems Key Indicator Partner/s: UNEP GEMS/Water Programme Data Available: Global time series ( , with regional variations) and regional/national case studies Development Status: Ready for global and national use. For latest indicator development see: The Indicator 100 Americas Europe Asia 200 Percentage Percentage Percentage Percentage Africa Percentage Oceania Excellent - Good Fair - Marginal Poor Figure A21. Regional WQIB for monitoring scores. Excellent to good scores are indicated in green, fair marginal and poor score are indicated in yellow and red respectively. Solid black line indicates number of stations reporting in any given year. Source: UNEP-GEMS. Storyline General declines in the percentage of stations classified as good or excellent were detectable in the Americas and Europe dating back to the 1970s and 1980s. Water quality in Asia and Oceania appears to have increased in the last decade or two, as the proportion of stations classified as Excellent or Good has increased. Patterns in Africa were more variable, but it appears as though water quality has been declining, with fewer river and lake monitoring stations being classified as excellent or good in recent years. 134 BIODIVERSITY INDICATORS & THE 2010 BIODIVERSITY TARGET
136 Data Data Sources The data used for the water quality indicator for biodiversity was compiled using data from two international sources; GEMStat is an online global database of water quality maintained by the United Nations Environment Program GEMS/Water Programme (GEMS refers to the Global Environment Monitoring System). It contains over four million entries for lakes, reservoirs, rivers and groundwater systems, and its over 3,700 monitoring stations include baseline (reference or non-impacted), trend (impacted) and flux (at the mouth of large rivers that discharge into the oceans) stations. Data in the GEMS/Water database date back to the 1960s. While the GEMS/Water database is the most comprehensive global database of water quality, there are still gaps in country coverage. European countries report annual average water quality conditions for river, lake and groundwater monitoring stations to the European Environment Agency (EEA) and these data are available through the EEA web site. The EEA database includes monitoring data for over 5,000 rivers and lakes, with records dating as far back as the 1930s through to the present. This was the second source of water quality data used to calculate the water quality index for biodiversity. To calculate our index, data from both sources resulted in collections from 6,216 water monitoring stations around the globe. Both data sources contain a significant number of water quality parameters. The specific parameters used to assess water quality related to biodiversity were chosen based on findings reported in the primary literature. A literature review was conducted to determine which water quality parameters were most adequately reflective of aquatic biodiversity in both temperate and tropical rivers and lakes. The choice of parameters to be included in the computation of a composite index of water quality was based on: 1) the presence of a relationship between the water quality parameter and biodiversity 2) the availability of monitoring data for the parameter in our international water quality monitoring databases. With these two factors in mind, the following parameters were chosen for inclusion within our index: dissolved oxygen, electrical conductivity, ph, temperature, nitrogen, and phosphorus. Beyond being good correlates with aquatic biodiversity, the parameters chosen for the development of a water quality index for biodiversity were selected for an additional reason, that is, they are good indicators of specific issues that are relevant on a global basis (eutrophication, nutrient pollution, acidification, salinization, climate change). The countries analyzed were: Albania, Algeria, Argentina, Australia, Austria, Bangladesh, Belgium, Bolivia, Bosnia and Herzegovina, Brazil, Bulgaria, Cambodia, Canada, Chile, China, Colombia, Congo, Cote d Ivoire, Croatia, Cuba, Cyprus, Czech Republic, Denmark, Ecuador, Egypt, Estonia, Fiji, Finland, France, French Guiana, Germany, Ghana, Greece, Guatemala, Hong Kong, Hungary, Iceland, India, Indonesia, Iraq, Iran, Republic of Islamic, Ireland, Israel, Italy, Japan, Jordan, Kenya, Republic of Korea, Lao People s Democratic Republic, Latvia, Liechtenstein, Lithuania, Luxembourg, Macedonia (former Yugoslav Republic of), Malaysia, Mali, Malta, Mexico, Montenegro, Morocco, Netherlands, New Zealand, Norway, Pakistan, Panama, Papua New Guinea, Peru, Philippines, Poland, Portugal, Romania, Russian Federation, Senegal, Serbia, Singapore, Slovakia, Slovenia, South Africa, Spain, Sri Lanka, Sudan, Sweden, Switzerland, United Republic of Tanzania, Thailand, Tunisia, Turkey, Uganda, United Kingdom, United States, Uruguay, Viet Nam, Zimbabwe. Data collection and management The UNEP GEMS/Water Programme is in a unique position to monitor the state of inland water quality as it maintains the only global database of water quality for inland waters. The monitoring of water quality is conducted by each country at a station level and the data collated by national monitoring authorities to intergovernmental agencies. National Focal Points of governmental agencies, and Collaborating Focal Points of non-governmental agencies, submit water quality data and information to GEMStat ( OUTPUTS, EXPERIENCES AND LESSONS LEARNT FROM THE 2010 BIODIVERSITY INDICATORS PARTNERSHIP 135
137 Associated Data Standards All water quality data collected and analyzed by partners of the UNEP GEMS/Water Programme meet stringent data standards beginning with analysis in internationally certified analytical laboratories. The GEMS/Water Programme as one of its mandates is to conduct routine and on-going certification of these laboratories. Once data are submitted to GEMStat data are checked for quality assurance and quality control using protocols that include confirmation of geo-referenced data. Latest developments in GEMStat allow host countries to submit their data electronically in a standard data format to increase the number of data updates, to increase efficiency, and to minimize even further data handling and associated potential for transcription errors. Details are collected on the type of monitoring station and method codes are assigned to ensure analytical methodologies are consistent and identifiable. Data custodians (institutions) Science Development and Application, Programme Director Dr. Richard Robarts Director c/o National Water Research Institute 11 Innovation Blvd Saskatoon, Saskatchewan S7N 3H5, Canada Tel: Fax: Database, Technical Development, Communications, Science Support: Kelly Hodgson Data Specialist UN GEMS/Water Programme Office c/o National Water Research Institute 867 Lakeshore Road Burlington, Ontario L7R 4A6, Canada Tel: Fax: Yvonne Stokker Quality Assurance Specialist UN GEMS/Water Programme Office c/o National Water Research Institute 867 Lakeshore Road Burlington, Ontario L7R 4A6, Canada Tel: Fax: Data access and availability Information on the UNEP GEMS/Water Programme: Summary statistics and graphical presentation of data are available online from GEMStat: Quality assurance procedures GEMS/Water is committed to maintaining a database of consistent and reliable quality. As such, quality assurance (QA) and quality control (QC) are integral components of all aspects of the monitoring programme. Focal Points are urged to ensure that their monitoring programmes have sampling and analytical QA and QC protocols that are able to assess the quality of their data, and rapidly identify and correct circumstances when data are not of acceptable quality. In addition, each analytical result submitted to GEMS/Water is tested against pre-assigned limits for reasonableness and a series of logical checks are performed to identify gross data translation errors. 136 BIODIVERSITY INDICATORS & THE 2010 BIODIVERSITY TARGET
138 Methods Methods Used To compute a water quality index for aquatic biodiversity assessment required firstly, identification of suitable water quality parameters to be assessed for each monitoring station within each country. These were based on a literature review and identified as dissolved oxygen, electrical conductivity, ph, temperature, nitrogen and phosphorus. In addition to raw data, use of benchmarks or targets is essential to measure deviations of the data from these targets and to assess changes in water quality. The table below summarizes the targets used for comparison for the 6 parameters of water quality chosen. Details on derivations of these targets can be found in Carr & Rickwood (2008). Parameter Target Details Dissolved oxygen 6 mg L 9.5 mg L DO must not be less than target when average water temperatures are > 20 C DO must not be less than target when average water temperatures are = 20 C ph ph must fall within target range Conductivity 500 μs cm Conductivity must not exceed target Total Nitrogen 1 mg L Total nitrogen must not exceed target Total Phosphorus 0.05 mg L Total phosphorus must not exceed target Temperature Latitude dependent Temperature must not exceed modeled temperature Once parameters and their associated targets were identified, the water quality index for biodiversity (WQIB) was calculated as a proximity-to-target (PTT) index computed on a station by station basis. PTT scores for each parameter were derived from exceedances of annual average concentrations from targets, following winsorization of the exceedance data at the upper 95th percentile. PTT was calculated as the difference between observed values and the target divided by the range between the worst observed value and the target. PTT scores ranged from 100 (targets met) to 0 (most extreme failure to meet targets). The WQIB was computed as the average of PTT scores for the variables reported at a station in one year. A WQIB of 100 indicates that targets for all of the parameters measured at a station and year were met; increasing distance away from a perfect score indicates progressive deterioration of water quality. The WQIB was computed for a total of 73,657 records, with data from 6,216 stations from 88 countries from each of the world s continents except Antarctica. The index computations ranged from 1931 to The average time span and number of years of data for the entire set is 12 years; some stations have as many as 55 years of data, spanning up to a 74 year time period. The average number of parameters included in the index is 3.7, with a median of 4, indicating that two thirds of the parameters chosen for the index computation were included at least half of the time. Technology/Systems in Use Data were downloaded from GEMStat and the EEA portal as access databases and all statistical analyses were conducted using Microsoft Excel using statistical add-ins available on-line and publicly accessible. Peer Review Many versions of water quality indices exist around the world and are applied to assess water quality for the protection of freshwater aquatic life, drinking water quality as well as water quality indices related to other uses such as agriculture. In addition, many countries apply indices for specific parameter groupings. For example depending upon the parameters entered and the targets chosen, many countries have developed indices for assessment of pesticide contamination, eutrophication, acidification, etc. In Canada, use of a form of the PTT water quality index is now part of the national reporting structure at the highest levels of the national monitoring agency of Environment Canada as well as within each province. These approaches have been published in the primary literature and peer reviewed and can be found at: CCME Canadian water quality guidelines for the protection of aquatic life: CCME Water Quality Index 1.0, User s manual. In: Canadian Environmental quality guidelines, Canadian Council of Ministers of the Environment, Winnipeg, Manitoba, Canada. A global water quality index for drinking water can be found at: UNEP GEMS/Water Programme Water Quality for Ecosystem and Human Health. UNEP GEMS/Water Programme, Burlington, Canada. OUTPUTS, EXPERIENCES AND LESSONS LEARNT FROM THE 2010 BIODIVERSITY INDICATORS PARTNERSHIP 137
139 Water quality indices have also been developed to assess changes due to particular stressor sources, in this case, the discharge of metal mine effluents into freshwaters: de Rosemond, S., Duro, D.C. & Dubé, M Comparative analysis of regional water quality in Canada using the Water Quality Index. Environmental Monitoring and Assessment 156: Procedures for maintenance and archiving The WQIB developed and reported in 2008 is in a regular state of scientific development and adaptive assessment. Reports and applications are compiled and archived on the GEMS/Water website. Future development of the index will consider a more direct approach where rather than comparing water quality data to water quality targets that are associated with maintaining aquatic biological diversity we will strive to correlate water quality parameters directly with biological data Forest fragmentation Facts Focal Area: Ecosystem integrity and ecosystem goods and services Headline Indictor: Connectivity/fragmentation of ecosystems Key Indicator Partner/s: UNEP-WCMC Data Available: Two case studies have been published for New Zealand, others will be available shortly. Development Status: Methodology under review. For latest indicator development see: Data Data custodians (institutions) Dr Robert Ewers Imperial College London South Kensignton Campus London SW7 2AZ, UK Tel: +44 (0) r.ewers@imperial.ac.uk Methods Methods Used For information on methods see: River fragmentation and flow regulation Facts Focal Area: Ecosystem integrity and ecosystem goods and services Headline Indictor: Connectivity/fragmentation of ecosystems Key Indicator Partner/s: The Nature Conservancy in collaboration with the Landscape Ecology Group of the Umeå University Data Available: Global, regional or river basin baseline Development Status: Ready for global and river basin use. For latest indicator development see: BIODIVERSITY INDICATORS & THE 2010 BIODIVERSITY TARGET

140 The Indicator Figure A22. Impact classification based on river channel fragmentation and water flow regulation by dams on 292 of the world s large river systems. Unaffected rivers -shown in green- are those without dams in the main channel of the river and, if tributaries have been dammed, the fl ow of the river has not changed substantially (less than 2% of the natural fl ow has been affected). Highly fragmented and regulated rivers (shown in red) include those with less than one quarter of their main channel left without dams, where the largest tributary has at least one dam, and where the reservoirs retain a considerable portion of a year s fl ow. Source: Nilsson et al. (2005) Storyline Globally, two-thirds of all large river systems are moderately to highly fragmented by dams and reservoirs. Industrialized regions such as the United States and Europe and heavily populated countries like China and India encompass the most fragmented rivers. Arid regions also tend to have some of the highest levels of river fragmentation, since people in these regions have managed scarce water resources by building dams and reservoirs. Rivers flow most freely in the world s most remote and less-populated regions of Alaska, Canada, and Russia, and in small coastal basins in Africa and Asia. Data Data Sources 1) Individual river systems are delineated on topographic maps, and Virgin Mean Annual Discharge (VMAD) data collected. Data sources for the river system delineation include: Operational Navigation Charts 1:1,000,000, Defense Mapping Agency, USA additional topographic maps/data provided electronically by national governments communication with regional authorities for confirmation and/or clarification of delineations. For the VMAD data: the vast list of potential and existing data sources include international, national and subregional hydrologic databases; personal correspondence with agency personnel, academics and/or non-governmental staff working with a particular river system; and published literature. Some examples of commonly cited sources include: Global Hydrology Research Group, University of New Hampshire, USA ( guides/ghaas_usa_dg.jsp) The Global Runoff Data Centre, D Koblenz, Germany ( Milliman et al OUTPUTS, EXPERIENCES AND LESSONS LEARNT FROM THE 2010 BIODIVERSITY INDICATORS PARTNERSHIP 139
141 van der Leeden, F Water resources of the world. Geraghty & Miller, Inc., New York, USA. State Hydrological Institute, Russia and UNESCO, World Water Resources and Their Use, St. Petersburg, Russia, 1999 ( The usefulness of national or subregional government sources varies dramatically, and avenues of personal communication may require much persistence and patience. Many basins have transboundary commissions set up (such as the Mekong River Commission), and these organizations can be extremely informative. Internet searches may result in anything from an address from which a lengthy search for someone informative ensues, to direct acquisition of reliable data. 2) All dams within a river system are located and storage capacities identified. This is the most time consuming aspect of developing the indicator as dam data are not readily available for most countries. Dam data used includes: World Register of Dams (International Commission on Large Dams; ICOLD), World Atlas (International Journal on Hydropower and Dams), WRI s rivers at risk from dams planned and under construction database - compiled from multiple sources; as well as new dam data being collected currently by The Nature Conservancy for its Global Habitat Assessment with help from TNC regional and country offices. Data collection and management There has been no updates or modifications to the indicator, since its publication in Science in This is the third version of the indicator, and it includes the fragmentation and flow regulation analysis for rivers with a Virgin Mean Annual Discharge (VMAD) of more or equal to 350m 3 /s, except for Indonesia and Malaysia, for which reliable discharge and environmental data (from which to estimate discharge) are largely unavailable. Only dam and reservoir information were included (i.e., water withdrawals and diversion are not taken into account specifically). The results of the analysis have been published in Nilsson et al The database and supporting materials are also on-line on the Science website (as online supplementary materials to the published manuscript). Associated Data Standards See methods below Data custodians (institutions) Carmen Revenga, Senior Scientist, The Nature Conservancy, 4245 N. Fairfax Drive - Suite 100, Arlington, Va , crevenga@tnc.org; Tel: C. Nilsson, Professor, Department of Ecology and Environmental Science, Umeå University, Uminova Science Park, Umea University, Umea SE-90187, SWEDEN. Tel: +46-(0) ; Christer.Nilsson@emg.umu.se Cathy Reidy Liermann, Postdoctoral Researcher, University of Washington, School of Aquatic and Fishery Sciences, Campus Box , Seattle, WA Tel: (+01) , cathyrl@u.washington.edu Data access and availability Data are available on the Science website as on-line supplementary materials to the published manuscript. However, subscription to Science may be required to access the on-line materials. Quality assurance procedures Data on VMAD and the location of dams was cross-checked among as many databases as available at national and regional level, including government sources. Detailed information on all sources is available in the supplementary materials to the published manuscript on the Science website BIODIVERSITY INDICATORS & THE 2010 BIODIVERSITY TARGET
142 Methods Methods Used Flow regulation is calculated as the sum of reservoir live storage capacities within the system as a percent of the virgin mean annual discharge (VMAD) - the most water-rich river channel section, in most cases close to the estuary, before any significant direct human manipulation. Channel fragmentation is ranked into five classes describing the longest main-channel segment without dams (but frequently including reservoir water tables) in relation to the entire main channel (0 = 100%; 1 = 75-99%; 2 = 50-74%; 3 = 25-49%; and 4 = 0-24%). For the tributaries, fragmentation is described by three classes (0 = no dams; 1 = dams only in the catchment of minor tributaries; 2 = dams also in the catchment of the largest tributary). Presented below are the principles for constructing the indicator, comprised of classes of river system impact (not affected, moderately affected, and strongly affected) from the combination of fragmentation and flow regulation assessments. Fragmentation Flow regulation (%) (Main channel + tributaries) Not affected Moderately affected Strongly affected > > > > , > > , > > , 4 + 0, 1, 2 0 Technology/Systems in Use ESRI Geographic Information Systems ArcGIS Desktop v 9.3, Microsoft Excel, and the Water Balance Model developed by Fekete et al. (1999). Peer Review The indicator has been peer reviewed extensively, through the different publications in scientific journals and other publications. Peer review Journal articles: Dynesius & Nilsson 1994; Nilsson et al Reports and Books: Revenga 2005; Revenga et al. 2000; Revenga & Kura 2003; WCD 2000; World Resources Institute Procedures for maintenance and archiving Not applicable OUTPUTS, EXPERIENCES AND LESSONS LEARNT FROM THE 2010 BIODIVERSITY INDICATORS PARTNERSHIP 141


143 4.4.1 Health and well being of communities directly dependant on ecosystem goods and services Facts Focal Area: Ecosystem integrity and ecosystem goods and services Headline Indictor: Health and well-being of communities directly dependent on local ecosystem goods and services Key Indicator Partner/s: UNEP-WCMC Data Available: Global Baseline Development Status: Methodology under review. For latest indicator development see: The Indicator Figure A23. Global ecoregions with worst trends of increasing numbers of isolated people suffering from malnutrition Source: UNEP-WCMC Storyline The highest levels of dependency on locally produced ecosystems within threatened ecoregions are found in Sub-Saharan Africa, and Madagascar. The next highest levels of dependency are found throughout Central Asia, the Indonesian Archipelago and parts of central South America. Dependency in western Europe, North America and Australia is relatively low. With regards worsening well-being, Sub-Saharan Africa has the highest proportion of increasing numbers of dependent people who are also suffering increased child mortality (as a proxy for nutritional status and well-being). Areas in the Western, Central and South-East Asia also show high levels of negative change. 142 BIODIVERSITY INDICATORS & THE 2010 BIODIVERSITY TARGET
144 Data Data Sources Data for the development of this indicator were sourced from a variety of academic and UN-affiliated sources. The Center for International Earth Science Information Network (CIESIN) of Columbia University provided maps on the spread of global rural and urban populations and the incidence of infant mortality. The Global Map of Accessibility and Global Land Cover 2000 were provided by the European Commission s Joint Research Centre (JRC) Global Environment Monitoring Unit (GEM). Additional national level data on infant mortality rates were provided by the World Health Organization. Data collection and management No primary data collection was carried out in developing this indicator. Data were sourced from the above sources. Management of data is the responsibility of the custodians. Associated Data Standards Data standards are set by and maintained by the data custodians. They are detailed in the metadata information associated with each dataset (see Data access and availability below). Data custodians (institutions) Center for International Earth Science Information Network Columbia University 61 Route 9W, PO Box 1000 Palisades, NY USA Tel.: +1(845) Fax: +1(845) info@ciesin.columbia.edu Global Environment Monitoring Unit Institute for Environment and Sustainability Joint Research Centre Via E. Fermi 2749 I Ispra (VA) Italy Tel: Fax: ies-contact@jrc.ec.europa.eu World Health Organization Avenue Appia Geneva 27 Switzerland Tel: Fax: Data access and availability WHO Nutrition Landscape Information System CIESIN Global Poverty Mapping Project CIESIN Global Rural-Urban Mapping Project European Commission s Joint Research Centre (JRC) Global Environment Monitoring Unit (GEM) bioval.jrc.ec.europa.eu/products/gam/ European Commission s Joint Research Centre (JRC) Global Environment Monitoring Unit (GEM) bioval.jrc.ec.europa.eu/products/glc2000/glc2000.php OUTPUTS, EXPERIENCES AND LESSONS LEARNT FROM THE 2010 BIODIVERSITY INDICATORS PARTNERSHIP 143
145 Quality assurance procedures The data have all been used in publications of the data holders as well as third parties, and are therefore considered scientifically robust. Methods Methods Used The population base layer was derived from the CIESIN GRUMP dataset, with populations living in urban areas of 50,000 people identified. This was overlaid with a >12 hour raster layer derived from the GEM Global Map of Accessibility, which was calculated using the travel time layer (acc_50k grid) and reclassified into two groups of populations living less than and more than twelve hours travel time to the above urban areas. This process allowed for the identification of isolated rural populations (IRP), whose distance from major markets thereby implies a suitable degree of dependence on their local ecosystems that substitute resources are more difficult to obtain. The infant mortality rate (IMR, per 1000 live births) was derived from national WHO data 1990, 2000 and The relationship between these data over the three years was established and applied to 2000 sub-national data from the CIESIN Global Poverty Mapping Project to derive sub-national infant mortality data for 1990, 2005 and IMR rate change and IRP change were plotted and the results displayed spatially and graphed. In order to categorize the IMR and IRP combinations considering their different data ranges (IMR: ; IRP: ), the data were sorted ascending by IMR and assigned values of A - H, and then sorted ascending by IRP and assigned labels of A - H resulting in categories such as AA, AB and HH. The results were then displayed on a bivariate map (see above). Technology/Systems in Use The spatial analysis was carried out using ArcMap Peer Review Paper in preparation. Procedures for maintenance and archiving The data used and associated results derived have been stored electronically at UNEP-WCMC. Depending on future funding, the further development, maintenance and archiving of this indicator will be carried out Nutritional Status of Biodiversity Facts Focal Area: Ecosystem integrity and ecosystem goods and services Headline Indicator: Biodiversity for food and medicine Key Indicator Partner/s: FAO Data Available: Global time series (food composition: ), Global baseline of 2009 (food consumption) Development Status: Ready for global, regional and national use. For latest indicator development see: BIODIVERSITY INDICATORS & THE 2010 BIODIVERSITY TARGET
146 The Indicator Baseline data Baseline data Global database Asia Africa America Oceania Europe Total Figure A24. The cumulative number of foods which meeting the biodiversity criteria from different regions: baseline data (8,660) and baseline plus 2009 data (10,338) data. Source: FAO Storyline Data collected for the food composition indicator show that the level of knowledge on the nutrients and beneficial bioactive non-nutrients in food biodiversity, i.e., varieties of food plants, native breeds of dairy and meat animals, and wild/underutilized species, is increasing. These compositional data are used to promote and highlight the nutritional superiority of food biodiversity in the scientific and popular press, on food labels, and in point-of-purchase materials at food markets. The food consumption indicator shows that conservation is supported by the sustainable use in diets of these previously neglected species and varieties; livelihoods are improved, and nutrient intakes are enhanced. Data Data Sources Monitoring the indicators involves examining food composition databases and scientific literature, and following the food consumption surveys conducted through national governments, UN Agencies, Research Centres and NGOs. The indicators can be reported and used at the international and regional levels, and at the national level for a few countries. Data collection and management FAO collects data from food composition databases, scientific literature and dietary surveys. Yearly reporting is undertaken for the Food Composition Indicator; biennially reporting is undertaken for the Food Consumption Indicator. Associated Data Standards Food Composition - INFOODS Standards (see Both indicators standards were developed during the Expert Consultations process. Data custodians (institutions) FAO Viale delle Terme di Caracalla Rome, Italy Contact: Barbara Burlingame (barbara.burlingame@fao.org) and Ruth Charrondiere (ruth.charrondiere@fao.org) Data access and availability Data will be freely available in FAO website through links in different internal Divisions. Reports will also be published in the peer-reviewed international scientific literature. Quality assurance procedures Data submitted by countries are assessed for adherence to standardized procedures. OUTPUTS, EXPERIENCES AND LESSONS LEARNT FROM THE 2010 BIODIVERSITY INDICATORS PARTNERSHIP 145
147 Methods Methods Used Data collection is based on the count of number of foods with a sufficiently detailed description to identify genus, species, subspecies and variety/cultivar/breed, for both nutrition indicators. In addition, the Food Composition Indicator needs information on at least one value for a nutrient or other bioactive component. Instructions and criteria for the inclusion or exclusion of foods counting for the indicators have been developed and reported in the following website: Technology/Systems in Use International Network of Food Data Systems (INFOODS) Peer Review The identification and monitoring of nutrition indicators for biodiversity is an international collaborative process, led by FAO together with Bioversity International and other partners. The indicators were elaborated through two Expert Consultations held in 2007 and Papers describing the processes and reporting data are published in the peer review, international scientific literature (e.g., Journal of Food Composition and Analysis). Procedures for maintenance and archiving Presentation at each IFDC (biennially) and ICDAM (every 3rd year), and FAO updating FAO website Biodiversity for food and medicine Facts Focal Area: Ecosystem integrity and ecosystem goods and services Headline Indictor: Biodiversity for food and medicine Key Indicator Partner/s: TRAFFIC & IUCN SSC Medicinal Plant Specialist Group Data Available: Global time series for animals used for food and medicine, 1978 onwards, and regional/national case studies Development Status: Ready for global use (Red List Index Component), Ready for national use (Accessibility Index) For latest indicator development see: The Indicator Better Red List Index of Species Survival Worse Amphibians used for Food and Meds Amphibians not used for Food and Meds Birds used for Food and Meds Birds not used for Food and Meds Mammals used for Food and Meds Mammals not used for Food and Meds Figure A25. Red List Indices for utilized and non utilized species Red List Indices showing the proportion of species expected to remain extant in the near future without additional conservation action for all species, species used for food and/or medicine or not used for these purposed for: amphibians, birds and mammals. Source: RLIs produced using IUCN Red List data with assistance from IUCN Species Programme and BirdLife International. 146 BIODIVERSITY INDICATORS & THE 2010 BIODIVERSITY TARGET
148 10 Decreasing affordability 5 MP MA FA 0-5 Increasing affordability Cameroon India Mexico Peru South Africa Tanzania Vietnam Figure A 26. Change in percentage of GDP per capita for 10% poorest used to purchase baskets of goods (medicinal plants, medicinal animals and food animals), , indicating affordability Key: MA = Medicinal Animals, FA = Wild Food Animals, MP = Medicinal Plants Data sources: Market survey data for current price, vendor recall for past price (TRAFFIC), IMF, UNDP. Storyline Red List Index `Many of the wild species used for food and medicine are threatened with extinction, some due to over-exploitation, some to different pressures, e.g. habitat loss, or a combination of factors. Of the 9,956 known extant bird species, 14% are thought to be used for food and or medicinal purposes. Of all bird species 12% are classified as threatened but of those used for food and medicinal purposes 23% are threatened. Similarly mammal species used for food and medicines (22% of all known mammal species) are more threatened on average than those not utilised in this way. In contrast to the birds and mammals, amphibians used for food and medicine appear overall to be less threatened than amphibians not used for these purposes. However, the conservation status of these species is declining more rapidly than that of amphibian species not used for food and medicine. Just 3% of the world s well-documented medicinal flora has been evaluated for global conservation status. The proportion of medicinal plants flora considered to be threatened appears to have remained relatively stable (ca 40% to 45%) between 1997 and This stability however may be the artefact of a number of variables. The conservation status of medicinal plants is alarming if this pattern is maintained by assessment of a larger and more representative sample of medicinal plant species. Accessibility Index `Whether people are able to access wild foods and medicines is a function of their price and affordability, which in turn depends on resource availability and other factors influencing supply and demand. In terms of affordability, all but two of the sampled countries wild products were apparently becoming increasingly affordable to the poorest 10% of the population, particularly so for animal products in Mexico and medicinal animals in India. Medicinal plants in Tanzania were found to be becoming increasingly more affordable. However, wild food animals have decreased in affordability in Cameroon, despite wild meat remaining cheaper than domestic meat, whereas in Tanzania wild meat has remained at an almost constant level of affordability. In Viet Nam, where wild meat is considered more of a luxury product and its sale is illegal, it has seemingly decreased in affordability in the past 10 years. For the other countries, sampled wild products are becoming relatively more affordable even though global indicators show that in general animal species that are used for food and medicine are becoming more threatened. Data Data Sources Red List Index IUCN s Red List Assessments record supporting information on use of species including purpose of use and scale of use (subsistence/local, national or international). These data were used to define which species are used for food and/or medicine. Red List Indices were calculated for Bird, Mammals and Amphibians used for food and medicine compared with those not used for these purposes (for further information on RLIs calculation see Annex 1, Section 1.4.1). Data collected as part of the Red List Assessment on regional occurrence and scale of use (subsistence/local, national or international) were used for disaggregation of the Red List Indices. OUTPUTS, EXPERIENCES AND LESSONS LEARNT FROM THE 2010 BIODIVERSITY INDICATORS PARTNERSHIP 147
149 Many plants assessed in the Red List do not have accompanying use data. An existing database was further developed as a Global Checklist of Medicinal Plants (GCL-MP). To identify Red Listed species used medicinally the list of plants in the Red List was compared with the GCL-MP. Global Checklist of Medicinal Plants (GCL-MP) The number of medicinal plants included in this database has increased from 16,634 species in April 2008 to 21,524 (including sub-species) in June Many plant species are used for several purposes. The term medicinal plant is understood in a wide sense, therefore also including overlapping areas such as spices, food, diets, and cosmetics. All those species have been included in the checklist which are (or have been) used for these purposes either traditionally or commercially. This use information has to be referenced through at least one publication. The plant names in the checklist are based on a large number of publications which contain plant names related to ethnobotany, pharmacy, conservation and trade. Incorporation of sources is an ongoing process and will continue. Standard references evaluated for GCL-MP: MAPCIS. Medicinal and Aromatic Plant Conservation Information System Germplasm Resources Information Network (GRIN) Database NAPRALERT Database export Wyk, Medicinal plants of the world Ayensu, Medicinal plants of West Africa Anon., Medicinal plants in North Africa Boulos, Medicinal plants of North Africa Lange, Europe s medicinal and aromatic plants Özhatay, Wild medicinal plant trade in Turkey Prosea, MP South East Asia Gurib-Fakim, Medicinal and aromatic plants of Indian Ocean islands Mors, Medicinal plants of Brazil Herbs of Commerce WHO Monographs 1-3 Pharmacopoeia of Europe Pharmacopoeia of China The GCL-MP is an output of the database MAPROW. This database holds, apart from taxonomic and nomenclatural data, a wide range of information on common names, distribution, population status, habitat, ecology, legislation, utilization, commodities, and trade data. Plant groups: The majority of taxa covered by GCL-MP are flowering plants (angiosperms taxa, gymnosperms 186, pteridophytes 409), but it also includes some algae (15 taxa), bryophytes (4 taxa), lichens (27 taxa) and fungi (11 taxa). The information provided in the checklist will be covered the following data elements: Accepted name with author Synonym(s) Region (or country) of distribution Use type References Accessibility indicator Primary data on price of selected species were obtained from market surveys in 8 countries. Data collection and management IUCN Red List IUCN Red List Database (Use data not yet available to access from website) BirdLife International s World Bird Database GCL-MAP For data and sources see Data Sources (above). 148 BIODIVERSITY INDICATORS & THE 2010 BIODIVERSITY TARGET
150 Accessibility Indicator A basket of animals commonly used for food and medicines, and medicinal plant products, was selected for a number of countries, including: Mexico, Peru, Cameroon, Tanzania, South Africa, India, Viet Nam and China. These countries were chosen as a sample representative of Latin America, Africa and Asia, regions chosen for their high biodiversity. Markets in each country were selected and visited by a researcher between November 2009 and June Where possible, the markets were selected on the basis that they sold all the target wild plant and animal species, which were selected on the basis that they are commonly used. However, in some cases markets specialized in medicinal products or foods and therefore it was necessary to visit more than one market per country. Some markets were well established and fairly permanent, whereas others were highly informal, more so when the goods in question were in trade illegally in that country. Price data were collected from vendors at the market for a standard unit of the goods (for example, a kilogramme, or an individual). Ten vendors were surveyed at each market (although in some cases this was not possible if fewer vendors sold a given product). In addition to current price for each product, vendors were asked if they could recall the price in 2000 and in Furthermore, they were asked to estimate the distance to the source of the wildlife in question and if they had identified any trends in supply over time, including seasonally. Vendors recall varied significantly and very few felt able to remember the price in 1990 and therefore it was decided that these data should not be included in any analyses. Current and historical prices for locally relevant marker products (such as staple food products, for example rice, maize, domestic meat and generic/manufactured medicines, for example aspirin) were also obtained for each country, in order to compare prices and/or affordability of these with those of the wildlife products. Information on national or local populations of the species was also collected where possible, although, little information was available. Other sources of published data for the selected countries were obtained for human population and income (see table below). Table A1. Monetary and population data and sources used for indicator calculations Measure Source Notes GDP (local currency, current price) IMF 2010 data are based on IMF estimates. % share of GDP for 10% poorest in population UNDP reports Figure for the nearest year to 2000 and 2010 used. Population IMF 2010 data are based on IMF estimates. Offi cial infl ation rates IMF national consumer price infl ation rates 2010 data are based on IMF estimates. Exchange rates IMF Calculated using IMF GDP current prices for 2000 and 2010 in national currency and USD Human Development Reports (UNDP) from: IMF Statistics from: World Economic Outlook Database, April weo/2010/01/weodata/download.aspx Associated Data Standards Red List categories and criteria are detailed at Data custodians (institutions) IUCN and BirdLife International GCL-MP is owned and managed by the members of the Medicinal Plant Specialist Group. IMF UNDP OUTPUTS, EXPERIENCES AND LESSONS LEARNT FROM THE 2010 BIODIVERSITY INDICATORS PARTNERSHIP 149
151 Contact Thomasina Oldfield, Research and Analysis Programme Leader IUCN/TRAFFIC TRAFFIC International 219A Huntingdon Road, Cambridge CB3 0DL, UK Tel: +44 (0) Data access and availability Red List Data are freely available. Use data is currently not available GCL-MP Quality assurance procedures Red List Assessments undergo an evaluation process. Methods Methods Used Red List Index See RLI information for Birds, Mammals, and Amphibians. RLIs were calculated for species used for food and medicine and for species not used for these purposes. An RLI value of zero indicates that all species have gone Extinct. A downwards trend in the graph line (i.e., decreasing RLI values) means that the expected rate of species extinctions is increasing i.e., that the rate of biodiversity loss is increasing. A horizontal graph line (i.e., unchanging RLI values) means that the expected rate of species extinctions is unchanged. An upward trend in the graph line (i.e., increasing RLI values) means that there is a decrease in expected future rate of species extinctions (i.e., a reduction in the rate of biodiversity loss) Status of Medicinal Plants Red List status for medicinal plants was extracted from the Red List using the GCL-MAP. Data was also presented disaggregated by region. No conclusion regarding the global status of medicinal plants could be made as not all plants have been assessed. Few species have been reassessed and therefore it was not possible to investigate changing status of medicinal plant species over time, however in future years this will be possible. Accessibility Indicator Inflation rates (I = (Price 2010-Price 2000)/Price 2000)*100) were calculated using local currency current price for each country s medicinal plant, medicinal animal and food animal baskets using an average of the inflation rates for each product within the basket. Inflation rates for marker products (staple foods and generic medicines) were also calculated. Inflation rates for wild products were compared with those of marker products and the official inflation rates. Current price GDP figures in local currency (not adjusted) were used in conjunction with figures for proportion of GDP share of the 10% poorest in the population. Per capita GDP for the 10% poorest in the population was then calculated. Although wild meat and medicines may not always be consumed by the poorest, in this instance we wanted to investigate affordability of wild species to the poorest in each country in order to investigate the links between reliance on wildlife use and poverty. Technology/Systems in Use No detailed statistical analyses of the significance of changes have been undertaken. Peer Review Paper in preparation. The recently submitted report has been reviewed by an economist at IUCN. Procedures for maintenance and archiving Data have been stored electronically at TRAFFIC. 150 BIODIVERSITY INDICATORS & THE 2010 BIODIVERSITY TARGET
152 5.1.1 Status and trends of linguistic diversity and numbers of speakers of indigenous languages Facts Focal Area: Status of traditional knowledge, innovations and practices Headline Indictor: Status and trends of linguistic diversity and numbers of speakers of indigenous languages Key Indicator Partner/s: UNESCO Data Available: Regional/national time series Development Status: Methodology under review. For latest indicator development see: The Indicator Non-threatened or data deficient Vulnerable Endangered Critically endangered Extinct since Figure A27. Language Vitality and Endangerment Status. Source: Moseley 2010 Storyline Percent of all Languages Preliminary analysis of the data suggests that languages spoken by fewer than 10,000 people (51% of the current 6,900 languages) have lost speakers over the past forty years and many of them are in danger of disappearing within this century. Languages of small indigenous groups living in biodiversity-rich areas are more likely to lose speakers over time compared to larger indigenous languages whose dynamics bear some similarities to that of majority and/or dominant languages such as English, Mandarin Chinese, Hindi, Spanish and French. Further analyses of the collected data is needed to account for ethnic group population trends, overall population trends, migration flows, linguistic policies at various levels, as well as changes in attitudes both among governments and the speakers of indigenous languages. Data Data Sources The data are extracted from 57 national and sub-national governmental sources (see list below), as well as three intergovernmental (one regional and two global) and 14 non-governmental sources (different levels). Romania National Institute of Statistics National Institute of Statistics Bolivarian Republic of Venezuela National Institute of Statistics and Censuses of Ecuador INEC National institute of Statistics (Bolivia) OUTPUTS, EXPERIENCES AND LESSONS LEARNT FROM THE 2010 BIODIVERSITY INDICATORS PARTNERSHIP 151
153 National Statistics Office of Georgia National Statistical Committee of the Republic of Belarus National Institute of Statistics and Geography of Mexico Nauru Bureau of Statistics National Administrative Department of Statistics DANE (Colombia) Statistical Office of the Slovak Republic Statistics Austria Languages of Russia: sociolinguistic portrait Statistics Canada Czech Statistical Office - CSU Federated States of Micronesia Division of Statistics Fiji Island Bureau of Statistics Statistics South Africa Statistics New Zealand Hungarian Statistical Office Institut National de Statistique et des Etudes Economiques (INSEE-France) U.S. Census Bureau (USA) Statistics Latvia Statistics Finland Nepal Central Bureau of Statistics Statistical Office of the Republic of Serbia Statistical Institute of Belize Russia Federal State Statistics Service Palau Office of Planning and Statistics Peru National Institute of Statistics and Information Technology Australian Bureau of statistics Republic of Macedonia State Statistical Office Recensement de la population Nouvelle-Caledonie Republic of Bulgaria National Statistical Institute Republic of Croatia - Central Bureau of Statistics Australian National Indigenous Languages Survey Botswana Central Statistics Office CIRTB Bolivia - Censo Indígena Rural de Tierras Bajas CSO Central Statistics Office Ireland Census India - Office of the Registrar General & Census Comissioner Central Bureau of Statistics (Aruba) UK National Statistics Central Statistical Office Zambia Commonwealth of the Northern Mariana Islands Department of Commerce National Institute of Statistics and Censuses of Costa Rica INEC U.S. Census Bureau (American Samoa) National Institute of Statistics and Censuses (Argentina) Statistical Office of the Republic of Slovenia National Institute of Statistics Guatemala Head Office of Statistics, Surveys and Censuses (Paraguay) National Institute of Development Information (Nicaragua) National Bureau of Statistics of the Republic of the Moldova Statistics Lithuania Generalitat de Catalunya. Statistics on linguistic use in Catalunya 2003 National Institute of Statistics and Census (Panama) Statistical Institute of French Polynesia Central Statistical Agency of Ethiopia CSA Universal Bureau of Statistics (Suriname) 152 BIODIVERSITY INDICATORS & THE 2010 BIODIVERSITY TARGET
154 Data collection and management Data collection and collation for this indicator was launched in 2008, after a pilot in At present our dataset contains 5600 records covering 128 countries and territories. There are still regions that have not been thoroughly surveyed, notably, Asia and Africa. Continuous efforts are made in order to gather more data, and the current list of countries with available data is by no means complete. Data are stored in a tailor-made database which permits analyses on languages individually, by country and across countries. It is also possible to generate statistics and graphs, such as speaker trends by language (filtered by country, year, source and the type of question used to elicit the data). The database has three main types of population data concerning speakers of indigenous languages, ethnic groups and countries. In order to illustrate how the structure works, the language Chipewyan, spoken in Canada, is taken as an example. The database records, for a given source dating from a specific time, Canada s total population (country population), the number of speakers of Chipewyan (Chipewyan language population) and the number of members of the eponymous ethnic group in which the language is spoken (ethnic population). There are thus three types of population figures relevant to Chipewyan: country, language and ethnic populations. These three types of information might have the same source, or distinct sources: the database works under the premise that any source may potentially provide all three types of data, or only one or two types. In the case of the Chipewyan case study: Statistics Canada (a governmental source) provided country and language population figures; the Ethnologue, a non-governmental source, also provided language population figures, as well as ethnic population figures. Associated Data Standards Language names are used exactly as they appear in the primary sources. Each discrete language is additionally identified by a three-letter code (ISO international standard). Data custodians (institutions) At national level: see census offices listed above At international level: UNESCO Additionally: academic institutions (for instance, the Endangered Languages Programme at the School of Oriental and African Studies in London) and NGOs (in particular SIL International) that have relevant databases. Data access and availability At present, the entire dataset is accessible from UNESCO only. It is planned to launch its public interface in the autumn A number of national subsets are accessible online from websites of Statistics Offices. In addition, data collected by SIL International s linguists is accessible at Quality assurance procedures During the data collation phase, consultations were held with leading experts in the field of language statistics (in particular, Dr. John Paolillo, Indiana University). An expert meeting was organized at UNESCO HQ in December 2009 bringing together a dozen of linguists and demographers in order to review the methodology. OUTPUTS, EXPERIENCES AND LESSONS LEARNT FROM THE 2010 BIODIVERSITY INDICATORS PARTNERSHIP 153
155 Methods Methods Used The main issue with using a wide array of sources for a single global analysis of linguistic vitality is that each source typically determines its own methodology for language data collection independently from the others. This often results in substantial differences of approach and in difficulties with, and sometimes even an impossibility of, comparing data among sources. In order to remedy this problem, our first step was to make a complete inventory of speaker-counting/estimating methods and approaches for which information is available. Surprisingly few sources reporting on numbers of speakers specify how they arrived at the given figure. Some state the general principle (for instance, the Ethnologue counts first-language (L1) speakers wherever possible and relies on secondary sources that apply a variety of approaches in other cases). National censuses are clearly the best documented sources in terms of specifying the variable (i.e., the language question asked by the census-takers) on the basis of which data on numbers of speakers were collected and aggregated. They also appear to yield best results in terms of special and temporal comparability. Thus, for our sample of 25 countries with time-series data representing a total of 246 indigenous/minority languages and a cumulative time-span of five decades, we used only data from governmental sources (mainly censuses and sometimes language surveys), even if this decreased dramatically the number of languages for which trends could be established. To facilitate data analysis and interpretation, this set of 246 languages was broken down into three subsets of languages based on their size at the earliest datapoint ( Size Groups ): SG1: 1 to 9,999 speakers SG2: 10,000 to 99,999 speakers SG3: 100,000 and more speakers 20% to 9,999 speakers: 139 languages 10,000 to 99,999 speakers: 59 languages 100,000 and more speakers: 48 languages 23% 57% Percent of all Languages Figure A28. Sample of 246 languages by size group This sample was then analyzed for trends in numbers of speakers indicating either language maintenance (number of speakers at the latest available data point superior to that at the earliest, i.e., positive trend) or language attrition (number of speakers at the latest available data point inferior to that at the earliest, i.e., negative trend). 58% of the sample (143 languages) had a positive trend, and 42% (103 languages) had a negative trend. In terms of size groups, attrition was observed for 57% of the languages with fewer than 10,000 speakers, 29% of the languages between 10,000 and 99,999 speakers and 15% of the languages with more than 100,000 speakers. To recapitulate, our data suggest a general trend toward attrition in indigenous languages with fewer than 10,000 speakers and a maintenance trend for large indigenous languages over the past decades. 154 BIODIVERSITY INDICATORS & THE 2010 BIODIVERSITY TARGET
156 Technology/Systems in Use The application is developed in MySQL database, PHP, Javascipt, using Open Flash Chart for statistical tables. Peer Review The indicator is very recent, and the critical mass of data necessary for analysis and meaningful interpretation was reached in July 2010; preliminary findings have been reported in the article published in Science in May 2010 (Butchart et al. 2010a). Procedures for maintenance and archiving A sustained data collection, organization and analysis effort, as well as regular revisions and updates of the data already gathered are required. This task is labour- and resource-intensive and the funds available on UNESCO s regular budget are very limited. It is possible to reduce the time spent entering data if the source allows its data to be transferred by exporting it to a Microsoft Excel table. Whenever this is the case, the database is prepared to receive imported data from an Excel table. However, this possibility is rare: most sources are not set up in ways that would allow exporting data. OUTPUTS, EXPERIENCES AND LESSONS LEARNT FROM THE 2010 BIODIVERSITY INDICATORS PARTNERSHIP 155
157 7.1.1 Official development assistance provided in support of the Convention Facts Focal Area: Status of resource transfers Headline Indictor: Official development assistance provided in support of the Convention on Biological Diversity Key Indicator Partner/s: UNEP World Conservation Monitoring Centre (UNEP-WCMC) in collaboration with the Organisation for Economic Co-operation and Development (OECD) Data Available: Global time series, 2005 onwards Development Status: Ready for global use. For latest indicator development see: The Indicator Biodiversity-focused Biodiversity-focused, % Principal objective USD million % of total ODA Figure A29. Biodiversity-related ODA , commitments, USD million, constant 2008 prices Biodiversity-focused aid is the total commitments from activities scored as principally or signifi cantly targeting the objectives of the CBD. Commitments scored as not targeting objectives of the CBD are omitted from the biodiversity-focused total. Source: OECD Storyline The current indicator shows biodiversity-related aid to be of the order of USD 3 billion per year which represents 2-3% of total ODA ($3.36 billion in 2008, representing 2.5% of total ODA that year). Japan is the greatest donor, contributing 40.1% ($5.38 billion) of the total biodiversity related aid for 2005 to European institutions and the Netherlands are the second and third highest donors respectively, contributing 12.4% and 9.21% of the global total for China was the greatest recipient of biodiversity related aid in 2005 to 2007 receiving 20.4% of the global total for this timeframe. India also received a large proportion, 17.3% of the global total. Four of the five highest recipient countries for 2005 to 2007 are located in Asia. Data Data Sources The source of the data is the OECD Development Assistance Committee (DAC) which collects aid flows at activity level through the Creditor Reporting System (CRS) and expanded CRS (CRS++), and in the form of aggregates through the annual DAC Questionnaire. The DAC is an international forum of 24 members: 23 donor governments and the European Commission. The DAC collects aid data from its members, and also from other donors (non-dac countries and multilateral agencies such as the World Bank, regional development banks, UN agencies). 156 BIODIVERSITY INDICATORS & THE 2010 BIODIVERSITY TARGET
158 The DAC has collected Rio marker data from 1998 onwards: data for years were obtained on a trial basis, and reporting became mandatory starting with 2007 flows. The data included some gaps, inconsistencies and partial reporting, but the coverage improved regularly. For 2008 data, only Luxembourg and the United States did not report on the biodiversity marker. The ODA indicator provides a global picture of biodiversity related international aid. National use of the indicator is limited to the 24 DAC members which submit aid data through the annual Creditor Reporting System (CRS). The member countries include most European countries, Australia, Canada, Japan, New Zealand, the United States (Korea also joined the DAC early 2010, but its data will be available only later in the year). Data collection and management Aid reporting, including on Rio markers via the CRS, is undertaken annually and data collection is based on a standard methodology and agreed definitions. Associated Data Standards In their reporting to the CRS, donors are requested to indicate for each activity whether or not it targets the objectives of the Convention on Biological Diversity (CBD) using a scoring system as follows: 0 = Not targeted, 1 = Significant objective, 2 = Principal objective. the field is left blank ( Null ) if the activity is not screened against the marker. Principal policy objectives can be identified as those being fundamental in the design and impact of the activity (the activity would not have been undertaken without this objective). Significant policy objectives are those which, although important, are not one of the principal reasons for undertaking the activity. The score not targeted means that the activity has been screened against, but was found not to be targeting the CBD objectives. Data custodians (institutions) Organisation for Economic Co-operation and Development (OECD) DCD/STAT 2, rue André Pascal Paris Cedex 16 France Tel: +33 (0) Contact: Valerie Gaveau, Statistical Analyst, ODA eligibility (valerie.gaveau@oecd.org) Data access and availability All information related to biodiversity-related aid is centralised on a special web site at: rioconventions (ready-made tables containing annual data, definitions, statistical analyses by the DAC Secretariat). The CRS database is available online at (go to the OECD.STAT browser for CRS). Two possibilities are offered to users for consultation of data on biodiversity-related aid: Produce totals for biodiversity-related aid by filtering data using the Rio markers dimension; Download complete project-level aid data by clicking on ready-made files. Quality assurance procedures A Task Team of DAC members was created in 2009 to work on the quality of Rio marker data. The DAC Secretariat conducted an in-depth review of the quality and presented the outcomes to the Task Team early 2010, including proposals for improvements. DAC members confirmed that Rio marker data reflected the reality of their programmes, and will continue working on improvements in the coming months. Coverage of reporting is controlled on an annual basis for each member. OUTPUTS, EXPERIENCES AND LESSONS LEARNT FROM THE 2010 BIODIVERSITY INDICATORS PARTNERSHIP 157
159 Methods Methods Used The methodology for data collection on the biodiversity marker has been developed in close collaboration between the DAC Working Party on Statistics, the DAC Network on Environment and Development Co-operation the CBD Secretariat. The definition and methodology used are available in the CRS Directives: see Corrigendum 4 at dac/stats/crsdirectives. The production of the indicator includes the extraction of relevant data from the database. Unless otherwise stated, aid activity data are expressed in United States dollars at the exchange rate prevailing in the year of the flow i.e., in current USD. Analyses of trends in aid over longer periods should be based on constant USD so as to take account of inflation and exchange rate variations. The online data series are presented both in current and constant USD. Technology/Systems in Use The DAC databases are running in Microsoft SQL Server Peer Review By DAC task team. Procedures for maintenance and archiving Standard SQL backup procedure. 158 BIODIVERSITY INDICATORS & THE 2010 BIODIVERSITY TARGET
160 References Alercia, A., Diulgheroff, S. & Metz, T FAO/IPGRI Multi-Crop Passport Descriptors. FAO, Rome, Italy. Available at: php?id=19&user_bioversitypublications_pi1%5bshowuid%5d=2192. Baillie, J.E.M., Collen, B., Amin, R., Akcakaya, H.R., Butchart, S.H.M., Brummitt, N., Meagher, T.R., Ram, M., Hilton-Taylor, C. & Mace, G.M Toward monitoring global biodiversity. Conservation Letters 1: BirdLife International Threatened Birds of the World. Lynx Edicions and BirdLife International, Barcelona and Cambridge, UK. BirdLife International Birds in Europe: population estimates, trends and conservation status. BirdLife International, Cambridge, UK. BirdLife International State of the World s Birds: Indicators for our changing world. BirdLife International, Cambridge, UK. Bruno, J. & Selig, E.R Regional decline of coral cover in the Indo-Pacific: timing, extent, and sub-regional comparisons. PLoS One 2: e Buckland, S.T., Magurran, A.E., Green, R.E. & Fewster, R.M Monitoring change in biodiversity through composite indices. Philosophical Transactions of the Royal Society B-Biological Sciences 360: Butchart, S.H.M. & Vié, J.C The Red List Index: measuring trends in the threat status of biodiversity. In: Proceedings of the International Conference Biodiversity, Science and Governance, Paris January 24-28, CD-ROM. Paris: Museum National d Histoire Naturelle. Butchart, S.H.M Red List Indices to measure the sustainability of species use and impacts of invasive alien species. Bird Conservation International 18: S245-S262. Butchart, S.H.M., Akcakaya, H.R., Kennedy, E. & Hilton-Taylor, C. 2006b. Biodiversity Indicators Based on Trends in Conservation Status: Strengths of the IUCN Red List Index. Conservation Biology 20: Butchart, S.H.M., Resit Akakaya, H., Chanson, J., Baillie, J.E.M., Collen, B., Quader, S., Turner, W.R., Amin, R., Stuart, S.N. & Hilton-Taylor, C Improvements to the Red List Index. PLoS ONE 2: e140. Butchart, S.H.M., Stattersfield, A. & Brooks, T. 2006a. Going or gone: defining Possibly Extinct species to give a truer picture of recent extinctions. Bulletin of the British Ornithologists Club 126A. Butchart, S.H.M., Stattersfield, A.J., Baillie, J., Bennun, L.A., Stuart, S.N., Akcakaya, H.R., Hilton-Taylor, C. & Mace, G.M Using Red List Indices to measure progress towards the 2010 target and beyond. Philosophical Transactions of the Royal Society B-Biological Sciences 360: Butchart, S.H.M., Stattersfield, A.J., Bennun, L.A., Shutes, S.M., Akcakaya, H.R., Baillie, J.E.M., Stuart, S.N., Hilton-Taylor, C. & Mace, G.M Measuring global trends in the status of biodiversity: Red list indices for birds. Plos Biology 2: Butchart, S.H.M., Walpole, M., Collen, B., van Strien, A., Scharlemann, J.P.W., Almond, R.E.A., Baillie, J.E.M., Bomhard, B., Brown, C., Bruno, J., Carpenter, K.E., Carr, G.M., Chanson, J., Chenery, A.M., Csirke, J., Davidson, N.C., Dentener, F., Foster, M., Galli, A., Galloway, J.N., Genovesi, P., Gregory, R.D., Hockings, M., Kapos, V., Lamarque, J.F., Leverington, F., Loh, J., McGeoch, M.A., McRae, L., Minasyan, A., Morcillo, M.H., Oldfield, T.E.E., Pauly, D., Quader, S., Revenga, C., Sauer, J.R., Skolnik, B., Spear, D., Stanwell-Smith, D., Stuart, S.N., Symes, A., Tierney, M., Tyrrell, T.D., Vié, J.C. & Watson, R Global Biodiversity: Indicators of Recent Declines. Science 328: Carr, G.M. & Rickwood, C.J Water Quality Index for Biodiversity Technical Development Document. UNEP GEMS/Water Programme, Gatineau, QC, Canada. CCME Canadian water quality guidelines for the protection of aquatic life: CCME Water Quality Index 1.0, User s manual. In: Canadian Environmental quality guidelines, Canadian Council of Ministers of the Environment, Winnipeg, Manitoba, Canada. OUTPUTS, EXPERIENCES AND LESSONS LEARNT FROM THE 2010 BIODIVERSITY INDICATORS PARTNERSHIP 159
161 Chape, S., Harrison, J., Spalding, M. & Lysenko, I Measuring the extent and effectiveness of protected areas as an indicator for meeting global biodiversity targets. Philosophical Transactions of the Royal Society B-Biological Sciences 360: Collar, N.J. & Andrew, P Birds to Watch: the ICBP World Checklist of Threatened Birds. ICBP and IUCN, Cambridge, UK. Collar, N.J., Crosby, M.J. & Stattersfield, A.J Birds to Watch 2: The World List of Threatened Birds (BirdLife Conservation Series No. 4): The Official Source for Birds on the IUCN Red List. BirdLife International, Cambridge, U.K. Collen, B., Loh, J., Whitmee, S., McRae, L., Amin, R. & Baillie, J.E.M Monitoring Change in Vertebrate Abundance: the Living Planet Index. Conservation Biology 23: Collen, B., Ram, M., Zamin, T. & McRae, L The tropical biodiversity data gap: addressing disparity in global monitoring. Tropical Conservation Science 1. Craigie, I.D., Baillie, J.E.M., Balmford, A., Carbone, C., Collen, B., Green, R.E. & Hutton, J.M Large mammal population declines in Africa s protected areas. Biological Conservation 143: de Grammont, P.C. & Cuaron, A.D An evaluation of threatened species categorization systems used on the American continent. Conservation Biology 20: de Rosemond, S., Duro, D.C. & Dubé, M Comparative analysis of regional water quality in Canada using the Water Quality Index. Environmental Monitoring and Assessment 156: Dentener, F., Drevet, J., Lamarque, J.-F., Bey, I., Eickhout, B., Fiore, A., Hauglustaine, D., Horowitz, L., Krol, M., Kuhlsherestha, U., Lawrence, M., Galy-Lacaux, C., Rast, S., Shindell, D., Stevenson, D., van Noije, T., Atherthon, C., Bell, N., Bergman, D., Butler, T., Cofala, J., Collins, W., Doherty, R., Ellingsen, K., Galloway, J., Gauss, M., Montanaro, V., Müller, J.-F., Pitari, G., Rodriguez, J., Sanderson, M., Strahan, S., Schultz, M., Sudo, K., Szopa, S., & Wild, O Nitrogen and sulphur deposition on regional and global scales: a multi-model evaluation. Global Biogeochemical Cycles 20: GB4003. Dynesius, M. & Nilsson, C Fragmentation and Flow Regulation of River Systems in the Northern Third of the World. Science 266: Emmons, L.K., Walters, S., Hess, P. G., Lamarque, J.-F., Pfister, G.G., Fillmore, D., Granier, C., Guenther, A., Kinnison, D., Laepple, T., Orlando, J., Tie, X., Tyndall, G., Wiedinmyer, C., Baughcum, S.L., & Kloster, S Description and evaluation of the Model for Ozone and Related chemical Tracers, version 4 (MOZART-4). Geoscientific Model Development 3: European Bird Census Council/RSPB/BirdLife International/Statistics Netherlands, and U.S. NABCI Committee State of the Birds U.S. Department of Interior, Washington, DC, United States of America. Ewers, R.M., Kapos, V., Coomes, D.A., Lafortezza, R. & Didham, R.K Mapping community change in modified landscapes. Biological Conservation 142: Ewing B., Reed, A., Rizk, S.M., Galli, A., Wackernagel, M. & Kitzes, J. 2008b. Calculation Methodology for the National Footprint Accounts, 2008 Edition. Global Footprint Network, Oakland, California, USA. URL: Ewing, B., Goldfinger, A., Oursler, A., Moore, D., & Wackernagel, M The Ecological Footprint Atlas Global Footprint Network, Oakland, California, USA. URL: Ecological_Footprint_Atlas_2009.pdf. Ewing, B., Goldfinger, A., Wackernagel, M., Stechbart, S.M., Rizk, S.M., Reed, A. & Kitzes, J. 2008a. The Ecological Footprint Atlas Global Footprint Network, Oakland, California, USA. URL: footprintnetwork.org/download.php?id=506. FAO. 2007a. The World s Mangroves FAO Forestry Paper 153, Food and Agriculture Organization of the United Nations, Rome, Italy. URL: FAO. 2007b. Mangroves of Africa : Country Reports. Forest Resources Assessment Programme Working Paper 135 Food and Agriculture Organization of the United Nations, Rome, Italy. URL: fao.org/forestry/40375/en/. 160 BIODIVERSITY INDICATORS & THE 2010 BIODIVERSITY TARGET
162 FAO. 2007c. Mangroves of Asia : Country Reports. Forest Resources Assessment Programme Working Paper 136 Food and Agriculture Organization of the United Nations, Rome, Italy. URL: forestry/40375/en/. FAO. 2007d. Mangroves of North & Central America : Country Reports. Forest Resources Assessment Programme Working Paper 137 Food and Agriculture Organization of the United Nations, Rome, Italy. URL: FAO. 2007e. Mangroves of Oceania : Country Reports. Forest Resources Assessment Programme Working Paper 138 Food and Agriculture Organization of the United Nations, Rome, Italy. URL: fao.org/forestry/40375/en/. FAO. 2007f. Mangroves of South America : Country Reports. Forest Resources Assessment Programme Working Paper 139 Food and Agriculture Organization of the United Nations, Rome, Italy. URL: fao.org/forestry/40375/en/. FAO Status and trends report of animal genetic resources FAO, Rome, Italy. FAO Global Forest Resources Assessment FAO, Rome, Italy. Fekete, B., Vörösmarty, C. J. & Grabs W Global, composite runoff fields based on observed river discharge and simulated water balance. World Meteorological Organization Global Runoff Data Center Report No. 22, Koblenz, Germany. Fewster, R.M., Buckland, S.T., Siriwardena, G.M., Baillie, S.R. & Wilson, J.D Analysis of population trends for farmland birds using generalized additive models. Ecology 81: Galewski, T., Collen, B., McRae, L., Loh, J., Grillas, P., Gauthier-Clerc, M. & Devictor, V. Long-term trends in the abundance of Mediterranean wetland vertebrates: from global recovery to localized declines. Biological Conservation. In review. Galli, A., Kitzes, J., Wermer, P., Wackernagel, M., Niccolucci, V. & Tiezzi, E An Exploration of the Mathematics behind the Ecological Footprint. International Journal of Ecodynamics 2(4), Galloway, J.N., Townsend, A.R., Erisman, J.W., Bekunda, M., Cai, Z., Freney, J.R., Martinelli, L.A., Seitzinger, S.P. & Sutton, M.A Transformation of the Nitrogen Cycle: Recent Trends, Questions, and Potential Solutions. Science 320 (5878): Gent, P.R., Yeager, S.G., Neale, R.B., Levis, S. & Bailey, D.A Improvements in a half degree atmosphere/ land version of the CCSM. Climate Dynamics 79: George, H., Todd, K. & Peiser, L Areas of agricultural ecosystems under sustainable management: building on LADA achievements. In: Proceedings of LADA workshop, Bangkok, April FAO, Rome, Italy. Global Footprint Network Ecological Footprint Standards Global Footprint Network, Oakland, California, USA. URL: Green, E. & Short, F. T World Atlas of Seagrasses. Prepared by the UNEP World Conservation Monitoring Centre. University of California Press, Berkley, USA. URL: introduction.htm. Gregory, R.D. & van Strien, A Wild Bird Indicators: Using Composite Population Trends of Birds as Measures of Environmental Health. Ornithological Science 9: Gregory, R.D Birds as biodiversity indicators for Europe. Significance 3: Gregory, R.D., Noble, D.G. & Custance, J The state of play of farmland birds: population trends and conservation status of lowland farmland birds in the United Kingdom. Ibis 146: Gregory, R.D., Noble, D.G., Field, R., Marchant, J.H., Raven, M. & Gibbons, D.W Using birds as indicators of biodiversity. Ornis Hungarica 12-13: Gregory, R.D., van Strien, A., Vorisek, P., Meyling, A.W.G., Noble, D.G., Foppen, R.P.B. & Gibbons, D.W Developing indicators for European birds. Philosophical Transactions of the Royal Society B-Biological Sciences 360: OUTPUTS, EXPERIENCES AND LESSONS LEARNT FROM THE 2010 BIODIVERSITY INDICATORS PARTNERSHIP 161
163 Gregory, R.D., Vorisek, P., Noble, D.G., van Strien, A., Klvanova, A., Eaton, M., Meyling, A.W.G., Joys, A., Foppen, R.P.B. & Burfield, I.J The generation and use of bird population indicators in Europe. Bird Conservation International 18: S223-S244. Gregory, R.D., Vorisek, P., van Strien, A., Meyling, A.W.G., Jiguet, F., Fornasari, L., Reif, J., Chylarecki, P. & Burfield, I.J Population trends of widespread woodland birds in Europe. Ibis 149: Gregory, R.D., Willis, S.G., Jiguet, F., Vorisek, P., Klvanova, A., van Strien, A., Huntley, B., Collingham, Y.C., Couvet, D. & Green, R.E An Indicator of the Impact of Climatic Change on European Bird Populations. PLoS ONE 4. Guilford, J.P Psychometric methods. McGraw-Hill, New York, USA. Hilton-Taylor, C., Pollock, C., Chanson, J., Butchart, S. H. M., Oldfield, T. & Katariya, V Status of the world s species. Pp In: J.-C. Vié, C. Hilton-Taylor and S. N. Stuart (eds). The 2008 review of the IUCN Red List of Threatened Species. IUCN, Gland, Switzerland. Hockings, M., Stolton, S., Leverington, F., Dudley, N. & Courrau, J Evaluating effectiveness a framework for assessing management effectiveness of protected areas. 2nd ed. IUCN Gland, Switzerland and Cambridge, UK. Hoffmann, M., Brooks, T., da Fonseca, G., Gascon, C., Hawkins, A., James, R., Langhammer, P., Mittermeier, R., Pilgrim, J., Rodrigues, A. & Silva, J Review: conservation planning and the IUCN Red List. Endangered Species Research 6. Hoffmann, M., Hilton-Taylor, C., Angulo, A., Böhm, M., Brooks, T.M., Butchart, S.H.M., Carpenter, K.E.,, Chanson, J., Collen, B., Cox, N.A., Darwall, W.R.T., Dulvy, N.K., Harrison, L.R., Katariya, V., Pollock, C.M., Quader, S., Richman, N.I., Rodrigues, A.S.L., Tognelli5, M.F., Vié, J-C., Aguiar, J.M., Allen, D.J., Allen, G.R., Amori, G., Ananjeva, N.B., Andreone, F., Andrew, P., Ortiz, A.L.A., Baillie, J.E.M., Baldi, R., Bell, B.D., Biju, S.D., Bird, J.P., Black-Decima, P., Blanc, J.J., Bolaño, F., Bolivar-G, W., Burfield, I.J., Burton, J.A., Capper, D.R., Castro, F., Catullo, G., Cavanagh, R.D., Channing, A., Chao, N.L., Chenery, A.M., Chiozza, F., Clausnitzer, V., Collar, N.J., Collett, L.C., Collette, B.B., Cortez Fernandez, C.F.,, Craig, M.T., Crosby, M.J., Cumberlidge, N., Cuttelod, A., Derocher, A.E., Diesmos, A.C., Donaldson, J.S., Duckworth, J.W., Dutson, G., Dutta, S.K., Emslie, R.H., Farjon, A., Fowler, S., Freyhof, J., Garshelis, D.L., Gerlach, J., Gower, D.J., Grant, T.D., Hammerson, G.A., Harris, R.B., Heaney, L.R., Blair Hedges, S., Hero, J-M., Hughes, B., Hussain, S.A., Icochea M, J., Inger, R.F., Ishii, N., Iskandar, D.T., Jenkins, R.K.B., Kaneko, Y., Kottelat, M., Kovacs, K.M., Kuzmin, S.L., Marca, E.L., Lamoreux, J.F., Lau, M.W.N., Lavilla, E.O., Leus, K., Lewison, R.L., Lichtenstein, G., Livingstone, S.R., Lukoschek, V., Mallon, D.P., McGowan, P.J.K., McIvor, A., Moehlman, P.D., Molur, S., Alonso, A.M., Musick, J.A., Nowell, K., Nussbaum, R.A., Olech, W., Orlov, N.L., Papenfuss, T.J., Parra-Olea, G., Perrin, W.F., Polidoro, B.A., Pourkazemi, M., Racey, P.A., Ragle, J.S., Ram, M., Rathbun, G., Reynolds, R.P., Rhodin, A.G.J., Richards, S.J., Rodríguez, L.O., Ron, S.R., Rondinini, C., Ryland, A.B., Sadovy de Mitcheson, Y., Sanciangco, J.C., Sanders, K.L., Santos-Barrera, G., Schipper, J., Self-Sullivan, C., Shi, Y., Shoemaker, A., Short, F.T., Sillero-Zubiri, C., Silvano, D.L., Smith, K.G., Smith, A.T., Snoeks, J., Stattersfield, A.J., Symes, A.J., Taber, A.B., Talukdar, B.K., Temple, H.J., Timmins, R., Tobias, J.A., Tsytsulina, K., Tweddle, D., Ubeda, C., Valenti, S.V., Paul van Dijk, P., Veiga, L.M., Veloso, A., Wege, D.C., Wilkinson, M., Williamson, E.A., Xie, F., Young, B.E., Akçakaya, R.H., Bennun, L., Blackburn, T.M., Boitani, L., Dublin, H.T., da Fonseca, G.A.B., Gascon, C., Lacher, Jr, T.E., Mace, G.M., Mainka, S.A., J., McNeely, J.A., Mittermeier, R.A., Reid, G.M., Rodriguez, J.P., Rosenberg, A.A., Samways, M.J., Smart, J., Stein, B.A. & Stuart, S.N The Impact of Conservation on the Status of the World s Vertebrates. Science (in press). Holland, E.A., Braswell, B.H., Sulzman, J. & Lamarque, J.-F Nitrogen deposition onto the Unites States and Western Europe: A synthesis of observations and models. Ecological Applications 15(1): Houweling, S., Dentener, F. & Lelieveld, J The impact of non-methane hydrocarbon compounds on tropospheric photochemistry. Journal of Geophysical Research 103: 10,673-10,696. IUCN Standards and Petitions Subcommittee Guidelines for Using the IUCN Red List Categories and Criteria. Version 8.0. IUCN, Gland, Switzerland. URL: RedListGuidelines.pdf. IUCN IUCN Red List Categories and Criteria: Version 3.1. IUCN Species Survival Commission. IUCN, Gland, Switzerland and Cambridge, UK. Jenkins, C.N. & Joppa, L Considering protected area category in conservation analyses. Biological Conservation 143: BIODIVERSITY INDICATORS & THE 2010 BIODIVERSITY TARGET
164 Kitzes, J., Galli, A., Bagliani, M., Barrett, J., Dige, G., Ede, S., Erb, K., Giljum, S., Haberl, H., Hails, C., Jolia- Ferrier, L., Jungwirth, S., Lenzen, M., Lewis, K., Loh, J., Marchettini, N., Messinger, H., Milne, K., Moles, R., Monfreda, C., Moran, D., Nakano, K., Pyhala, A., Rees, W., Simmons, C., Wackernagel, M., Wada, Y., Walsh, C. & Wiedmann, T A research agenda for improving national Ecological Footprint accounts. Ecological Economics 68: Kitzes, J., Galli, A., Rizk, S.M., Reed, A. & Wackernagel, M. 2008a. Guidebook to the National Footprint Accounts. Global Footprint Network, Oakland, California, USA. URL: download.php?id=507. Kitzes, J., Wackernagel, M., Loh, J., Peller, A., Goldfinger, S., Cheng, D. & Tea, K. 2008b. Shrink and share: humanity s present and future Ecological Footprint. Philosophical Transactions of the Royal Society B-Biological Sciences 363: Lafortezza, R., Coomes, D.A., Kapos, V. & Ewers, R.M Assessing the impacts of forest fragmentation in New Zealand: scaling from survey plots to landscapes. Global Ecology & Biogeography (in press). Lamarque, J.-F., Kiehl, J., Brasseur, G., Butler, T., Cameron-Smith, P., Collins, W.D., Collins, W.J., Granier, C., Hauglustaine, D., Hess, P., Holland, E., Horowitz, L., Lawrence, M., McKenna, D., Merilees, P., Prather, M., Rasch, P., Rotman, D., Shindell, D. & Thornton, P Assessing future nitrogen deposition and carbon cycle feedback using a multi-model approach. Analysis of nitrogen deposition. J. Geophys. Res. 110: D Lamargue, J.-F., Bond, T.C., Eyring, V., Granier, C., Heil, A., Klimont, Z., Lee, D., Liousse, C., Mieville, A., Owen, B., Schultz, M.G., Shindell, D., Smith, S.J., Stehfest, E., Van Aardenne, J., Cooper, O.R., Kainuma, M., Mahowald, N., McConnell, J.R., Naik, V., Riahi, K. & van Vuuren, D.P Historical ( ) gridded anthropogenic and biomass burning emissions of reactive gases and aerosols: methodology and application. Atmospheric Chemistry and Physics. 10: Lamoreux, J., Akcakaya, H.R., Bennun, L., Collar, N.J., Boitani, L., Brackett, D., Brautigam, A., Brooks, T.M., de Fonseca, G.A.B., Mittermeier, R.A., Rylands, A.B., Gardenfors, U., Hilton-Taylor, C., Mace, G., Stein, B.A. & Stuart, S Value of the IUCN Red List. Trends in Ecology & Evolution 18: Lelieveld, J. & Dentener, F.J What controls tropospheric ozone? Journal of Geophysical Research 105: Leverington, F., Hockings, M., Pavese, H., Costa, K.L., Courrau, J. 2010a. Management effectiveness evaluation in protected areas - a Global Study. University of Queensland, TNC, WWF, IUCN-WCPA, Gatton, Australia. Leverington, F., Kettner, A., Nolte, C., Marr, M., Stolton, S., Pavese, H., Stoll-Kleeman, S. & Hockings, M. 2010b. Protected Area Management Effectiveness Assessments in Europe: Overview of European methodologies. BfN- Scripten 271b. BfN, Vilm, Germany. Leverington, F., Lemos Costa, K., Pavese, H., Lisle, A. & Hockings, M A global analysis of protected area management effectiveness. Environmental Management (in press). Loh, J., Green, R.E., Ricketts, T., Lamoreux, J., Jenkins, M., Kapos, V. & Randers, J The Living Planet Index: using species population time series to track trends in biodiversity. Philosophical Transactions of the Royal Society B-Biological Sciences 360: Mace, G.M., Collar, N.J., Gaston, K.J., Hilton-Taylor, C., Akcakaya, H.R., Leader-Williams, N., Milner-Gulland, E.J. & Stuart, S.N Quantification of Extinction Risk: IUCN s System for Classifying Threatened Species. Conservation Biology 22: Martynuik, E., Pilling, D. & Scherf, B Indicators: do we have effective tools to measure trends in genetic diversity of domesticated animals? Animal Genetic Resources 47 (in press). McGeoch, M.A., Butchart, S.H.M., Spear, D., Marais, E., Kleynhans, E.J., Symes, A., Chanson, J. & Hoffmann, M Global indicators of biological invasion: species numbers, biodiversity impact and policy responses. Diversity and Distributions 16: Milliman, J.D., Rutkowski, C.M. & Meybeck, M River Discharge to the Sea, A Global River Index (GLORI). LOICZ Reports & Studies No. 2. LOICZ, Texel, Netherlands. Monfreda, C., Wackernagel, M. & Deumling, D Establishing national natural capital accounts based on detailed - Ecological Footprint and biological capacity assessments. Land Use Policy 21: OUTPUTS, EXPERIENCES AND LESSONS LEARNT FROM THE 2010 BIODIVERSITY INDICATORS PARTNERSHIP 163
165 Moseley, C. (ed.) Atlas of the World s Languages in Danger. UNESCO, Paris, France. Nilsson, C., Reidy, C. A., Dynesius, M. & Revenga, C Fragmentation and Flow Regulation of the World s Large River Systems Science 308(5720): North American Bird Conservation Initiative, U.S. Committee, The State of the Birds, United States of America, U.S. Department of Interior, Washington, DC, USA. 36 pages. URL: org/2009/. Olson, D.M., Dinerstein, E., Wikramanayake, E.D., Burgess, N.D., Powell, G.V.N., Underwood, E.C., D Amico, J.A., Itoua, I., Strand, H.E., Morrison, J.C., Loucks, C.J., Allnutt, T.F., Ricketts, T.H., Kura, Y., Lamoreux, J.F., Wettengel, W.W., Hedao, P. & Kassem, K.R Terrestrial ecoregions of the worlds: A new map of life on Earth. Bioscience 51: Pannekoek, J. & van Strien, A TRIM 3 Manual Trends and Indices for Monitoring Data. Research paper no Statistics Netherlands CBS Voorburg, The Netherlands. URL: natuur-milieu/methoden/trim/default.htm. Pauly, D. & Palomares, M.L Fishing down marine food web: it is far more pervasive than we thought. Bulletin of Marine Science 76(2): Pauly, D. & Watson, R Background and interpretation of the Marine Trophic Index as a measure of biodiversity. Philosophical Transaction of the Royal Society (B) 360(1454): Pauly, D., Alder, J., Booth, S., Cheung, W.W.L., Christensen, V., Close, C., Sumaila, U.R., Swartz, W., Tavakolie, A., Watson, R., Wood, L. & Zeller, D. Fisheries in Large Marine Ecosystems: Descriptions and Diagnoses. p In: K. Sherman and G. Hempel (eds.) The UNEP Large Marine Ecosystem Report: a Perspective on Changing Conditions in LMEs of the World s Regional Seas. UNEP Regional Seas Reports and Studies No UNEP, Nairobi, Kenya. Pauly, D., Christensen, V., Dalsgaard, J., Froese, R. & Torres Jr, F.C Fishing down marine food webs. Science 279(5352): PECBMS The State of Europe s Common Birds. CSO/RSPB, Prague, Czech Republic. Revenga, C. & Kura, Y Status and Trends of Inland Water Biodiversity. CBD Technical Papers Series no. 11. Convention on Biological Diversity, Montreal, Canada. Revenga, C Developing Indicators of Ecosystem Condition Using Geographic Information Systems and Remote Sensing. Regional Environmental Change 5(4): Revenga, C., Brunner, J., Henninger, N., Kassem, K., & Payne, R Pilot Analysis of Global Ecosystems: Freshwater Systems. World Resources Institute, Washington DC, USA. Ricketts, T.H., Dinerstein, E., Boucher, T., Brooks, T.M., Butchart, S.H.M., Hoffmann, M., Lamoreux, J.F., Morrison, J., Parr, M., Pilgrim, J.D., Rodrigues, A.S.L., Sechrest, W., Wallace, G.E., Berlin, K., Bielby, J., Burgess, N.D., Church, D.R., Cox, N., Knox, D., Loucks, C., Luck, G.W., Master, L.L., Moore, R., Naidoo, R., Ridgely, R., Schatz, G.E., Shire, G., Strand, H., Wettengel, W. & Wikramanayake, E Pinpointing and preventing imminent extinctions. Proceedings of the National Academy of Sciences of the United States of America 102: Rodrigues, A.S.L., Pilgrim, J.D., Lamoreux, J.F., Hoffmann, M. & Brooks, T.M The value of the IUCN Red List for conservation. Trends in Ecology & Evolution 21: Sander S.P. et al Chemical Kinetics and Photochemical Data for Use in Atmospheric Studies Evaluation Number 15, Publication Jet Propulsion Laboratory, Pasadena, CA, USA. Sauer, J.R. & Link, W.A Hierarchical modeling of population stability and species group attributes from survey data. Ecology 83(6): Sauer, J.R., Hines, J.E. & Fallon, J The North American Breeding Bird Survey, Results and Analysis Version USGS Patuxent Wildlife Research Center, Laurel, MD, USA. SCBD (Secretariat of the Convention on Biological Diversity) Global Biodiversity Outlook 3. CBD, Montréal, Canada. 164 BIODIVERSITY INDICATORS & THE 2010 BIODIVERSITY TARGET
166 Schmitt, C.B., Burgess, N.D., Coad, L., Belokurov, A., Besancon, C., Boisrobert, L., Campbell, A., Fish, L., Gliddon, D., Humphries, K., Kapos, V., Loucks, C., Lysenko, I., Miles, L., Mills, C., Minnemeyer, S., Pistorius, T., Ravilious, C., Steininger, M. & Winkel, G Global analysis of the protection status of the world s forests. Biological Conservation 142: Shutte, V. G. W., Selig, E. R. & Bruno, J Regional spatio-temporal trends in Caribbean coral reef benthic communities. Marine Ecology Progress Series 402: URL: m402p115.pdf. Spalding, M.D., Fish, L. & Wood, L.J Toward representative protection of the world s coasts and oceansprogress, gaps, and opportunities. Conservation Letters 1: Spalding, M.D., Fox, H.E., Halpern, B.S., McManus, M.A., Molnar, J., Allen, G.R., Davidson, N., Jorge, Z.A., Lombana, A.L., Lourie, S.A., Martin, K.D., McManus, E., Molnar, J., Recchia, C.A. & Robertson, J Marine ecoregions of the world: A bioregionalization of coastal and shelf areas. Bioscience 57: Tie, X.X., Brasseur, G.P., Emmons, L.K. et al Effects of aerosols on tropospheric oxidants: A global model study. Journal of Geophysical Research 106: Tie, X.X., Madronich, S., Walters, S. et al Assessment of the global impact of aerosols on tropospheric oxidants. Journal of Geophysical Research 110: d03024, 32pp. U.S. NABCI State of the Birds 2009: United States of America. U.S. Department of Interior, Washington, DC, USA. UNEP GEMS/Water Programme Water Quality for Ecosystem and Human Health. UNEP GEMS/Water Programme, Burlington, Canada. van der Leeden, F Water Resources of the World. Geraghty & Miller, Inc., New York, USA. Vorisek, P., Gregory, R.D., van Strien, A. & Meyling, A.W.G. 2008a. Population trends of 48 common terrestrial bird species in Europe: results from the Pan-European Common Bird Monitoring Scheme. Revista catalana d ornitologia 24: Vorisek, P., Klvanova, A., Wotton, S. & Gregory, R.D. 2008b. A best practice guide for wild bird monitoring schemes. CSO/RSPB, Prague, Czech Republic. Wackernagel, M., Lewan, L. & Hansson, C.B. 1999a. Evaluating the use of natural capital with the ecological footprint - Applications in Sweden and subregions. Ambio 28: Wackernagel, M., Onisto, L., Bello, P., Linares, A.C., Falfán, L., García, J.M., Suárez, G.A.I. & Suárez, G.M.G., 1999b. National natural capital accounting with the ecological footprint concept. Ecological Economics 29: Wackernagel, M., Schulz, N.B., Deumling, D., Linares, A.C., Jenkins, M., Kapos, V., Monfreda, C., Loh, J., Myers, N., Norgaard, R. & Randers, J Tracking the ecological overshoot of the human economy. Proceedings of the National Academy of Sciences of the United States of America 99: Waycott, M., Duarte, C.M., Carruthers, T.J.B., Orth, R.J., Dennison, W.C., Olyarnik, S., Calladine, A., Fourqurean, J.W., Heck, K.L. Jr., Hughes, A.R., Kendrick, G.A., Kenworthy, W.J., Short, F.T. & Williams, S.L Accelerating loss of seagrasses across the globe threatens coastal ecosystems. Proceedings National Academy of Sciences 106(30): URL: pdf+html?sid=e1f073ec-320c-498d-92cf-f88b87f59ad4. WCD (World Commission on Dams) Dams and Development: A new Framework for Decision-making. The Report of the World Commission on Dams. Earthscan Publications Ltd., London, U.K. Wood, S.N On confidence intervals for generalized additive models based on penalized regression splines. Australian & New Zealand Journal of Statistics 48: World Resources Institute in collaboration with the United Nations Environment Programme, The United Nations Development Programme, & the World Bank World Resources : People and Ecosystems the Fraying Web of Life. World Resources Institute, Washington, DC, USA. OUTPUTS, EXPERIENCES AND LESSONS LEARNT FROM THE 2010 BIODIVERSITY INDICATORS PARTNERSHIP 165


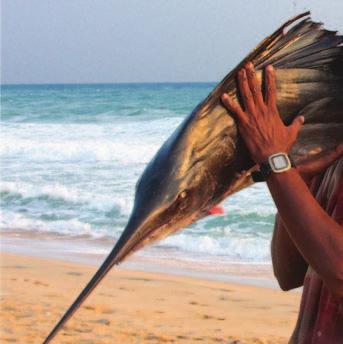
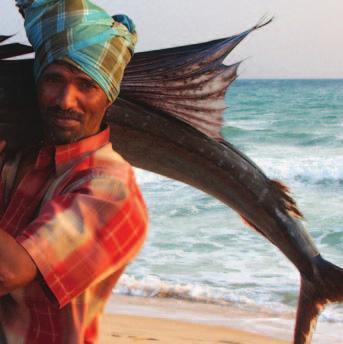


167
168 ANNEX 2. PARTNER PROFILES Indicator Partners Bioversity International (1.5.1 Ex-situ crop collections) Bioversity International is the world s leading organization dedicated to researching agricultural biodiversity to improve people s lives. Our research, carried out with partners around the world, seeks sustainable solutions to meet three important challenges: Malnutrition and hidden hunger of missing micronutrients; Sustainability and resilience in food supplies and farming systems; Conservation and Use, ensuring that agricultural biodiversity remains accessible to all. We also provide policy information and analysis to improve the legal framework - global, regional and national - needed to ensure that agricultural biodiversity can be put to work to deliver sustainable solutions for economic development. BirdLife International (1.2.2 Global Wild Bird Index, Protected areas overlays with biodiversity, Red List Index, Trends in Invasive Alien Species, Biodiversity for food and medicine) BirdLife International is a global Partnership of conservation organisations that strives to conserve birds, their habitats and global biodiversity, working with people towards sustainability in the use of natural resources. BirdLife s aims are to: prevent the extinction of any bird species; maintain and where possible improve the conservation status of all bird species; conserve and where appropriate improve and enlarge sites and habitats important for birds; help, through birds, to conserve biodiversity and to improve the quality of people s lives; integrate bird conservation into sustaining people s livelihoods. Convention on International Trade in Endangered Species of Wild Fauna and Flora (2.2.2 Status of species in trade) The Convention on International Trade in Endangered Species of Wild Fauna and Flora (CITES; is a treaty created to ensure that international trade in wild animals and plants does not put their survival at risk. It entered into force on 1 July 1975 and is currently one of the largest multilateral environmental agreements in existence, with a membership of 175 countries. CITES works through a system of import and export permits, and accords varying degrees of trade control to more than 34,000 species. Its Secretariat is part of the United Nations Environment Programme. Food and Agriculture Organization of the United Nations (1.1.1 Extent of forests, Ex-situ crop collections, Genetic diversity of terrestrial domesticated animals, Area of forest under sustainable management: degradation and deforestation, Area of agricultural ecosystems under sustainable management, Nutritional status of biodiversity) The Food and Agriculture Organization of the United Nations (FAO) leads international efforts to defeat hunger. Serving both developed and developing countries, FAO acts as a neutral forum where all nations meet as equals to negotiate agreements and debate policy. FAO is also a source of knowledge and information. It helps developing countries and countries in transition modernize and improve agriculture, forestry and fisheries practices and ensure good nutrition for all. Since its founding in 1945, it has focused special attention on developing rural areas, home to 70 percent of the world s poor and hungry people. OUTPUTS, EXPERIENCES AND LESSONS LEARNT FROM THE 2010 BIODIVERSITY INDICATORS PARTNERSHIP 167
169 Fisheries Centre, University of British Columbia (4.1.1 Marine Trophic Index) The Fisheries Centre promotes multidisciplinary study of aquatic ecosystems and broad-based collaboration with maritime communities, government, NGOs and other partners. We believe that the social capital developed through collaboration and the intellectual capital that increased knowledge of ecosystem function and values represents can lead to the re-investment in natural capital necessary to conserve and restore aquatic systems. The Sea Around Us project was established to assess fisheries impacts at ecosystem, ocean basin and global level and find solutions to the challenges they pose. The results of this work are accessible on the web, offering ecosystem data, distribution maps and catch data for more than 1,000 species, historical trends and peer-reviewed publications. Global Footprint Network (2.3.1 Ecological Footprint) Global Footprint Network ( is an international think tank working to advance sustainability through use of the Ecological Footprint, a resource accounting tool that measures how much nature we have, how much we use and who uses what. Using an internationally approved methodology, Global Footprint Network produces annual calculations on the Ecological Footprint and biocapacity of more than 150 nations and the world as a whole. It is also working with nations, cities and enterprises around the globe to make ecological limits central to decision-making. Global Footprint Network s mission is to enable a world where all people can live well, within the means of one planet. Global Invasive Species Programme (3.2.1 Trends in Invasive Alien Species) The Global Invasive Species Programme (GISP) is an international partnership dedicated to tackling the global threat of invasive species. GISP s mission is to conserve biodiversity and sustain livelihoods by minimising the spread and impact of invasive species. GISP provides support to the implementation of Article 8(h) of the Convention on Biological Diversity and has contributed extensively to the knowledge and awareness of invasive species through the development of a range of products and publications. A dedicated GISP Secretariat was established in 2003 to facilitate and coordinate implementation of the global strategy on invasive species and in 2005, GISP was constituted as a legal entity with four founding partners i.e., CABI, IUCN, the South African National Biodiversity Institute (SANBI) and The Nature Conservancy (TNC). International Nitrogen Initiative (3.1.1 Nitrogen deposition) The overall goal of the International Nitrogen Initiative (INI) is to optimize nitrogen s beneficial role in sustainable food production and minimize nitrogen s negative effects on human health and the environment resulting from food and energy production. The INI proposes a three-pronged, interactive process to meet the challenge of nitrogen. One focus is the assessment of basic knowledge on the creation and distribution of reactive nitrogen: Where is there not enough nitrogen? Where is there too much? What are the effects of the decrease or increase in the abundance of nitrogen, relative to societies needs? The second focus consists of the development and identification of solutions for regions with an under- or over-abundance of nitrogen. The third focus is the implementation of scientific, engineering and policy tools to solve the identified problems. Policy makers at the governmental level must be involved in these steps, if the problems of nitrogen supply are to be reversed. Institute of Zoology of the Zoological Society of London (1.4.1 Red List Index, Living Planet Index, Wild Commodities Index) The Institute of Zoology (IoZ) is the research division of the Zoological Society of London. It is a government-funded research institute specialising in scientific issues relevant to the conservation of animal species and their habitats. The five thematic areas on which we focus our research span evolutionary biology, genetics, ecology, reproductive biology and wildlife epidemiology. Our scientific research and training programmes are outlined on this site and in our annual scientific reports. The Institute of Zoology was graded 4, in the UK Research Assessment Exercise. 168 BIODIVERSITY INDICATORS & THE 2010 BIODIVERSITY TARGET
170 International Union for the Conservation of Nature Species Survival Commission (1.4.1 Red List Index, Biodiversity for food and medicine) The IUCN Species Survival Commission (SSC) is a science-based network of some 7,500 volunteer experts from almost every country of the world, all working together towards achieving the vision of a world that values and conserves present levels of biodiversity. Most members are deployed in more than 100 Specialist Groups and Task Forces. Some groups address conservation issues related to particular groups of plants or animals while others focus on topical issues, such as reintroduction of species into former habitats or wildlife health. Organisation for Economic Co-operation and Development (7.1.1 Offi cial development assistance provided in support of the Convention) The Organisation for Economic Co-operation and Development (OECD) brings together the governments of countries committed to democracy and the market economy from around the world to: Support sustainable economic growth; Boost employment; Raise living standards; Maintain financial stability; Assist other countries economic development; Contribute to growth in world trade. OECD provides a setting where governments compare policy experiences, seek answers to common problems, identify good practice and coordinate domestic and international policies. Royal Society for the Protection of Birds (1.2.2 Wild Bird Index) The Royal Society for the Protection of Birds (RSPB) speaks out for birds and wildlife, tackling the problems that threaten our environment. The RSPB is the largest wildlife conservation organisation in Europe with over one million members. Wildlife and the environment face many threats. Its work is focused on the species and habitats that are in the greatest danger. The RSPB s commitment is driven by the passionate belief that: birds and wildlife enrich people s lives; the health of bird populations is indicative of the health of the planet, on which the future of the human race depends; everyone has a responsibility to protect wildlife. The Nature Conservancy (4.3.2 River fragmentation and fl ow regulation) The Nature Conservancy (TNC) is a leading conservation organization working around the world to protect ecologically important lands and waters for nature and people. Thanks to the support of more than 1 million members TNC has built a tremendous record of success since its founding in The Nature Conservancy has protected more than 119 million acres of land, 5,000 miles of rivers, and operates more than 100 marine conservation projects globally. We work in all 50 states of the United States and in more than 30 countries - protecting habitats from grasslands to coral reefs, from China to Alaska, Brazil and Zambia. We address threats to conservation involving climate change, fire, fresh water, forests, invasive species, and marine ecosystems. We use a science-based approach, aided by our more than 700 staff scientists, and we pursue non-confrontational, pragmatic solutions to conservation challenges. TRAFFIC International (4.5.2 Biodiversity for food and medicine) TRAFFIC was established in 1976 and is the world s leading organization monitoring wildlife trade, working to ensure that trade in wild fauna and flora is managed sustainably - conserving biodiversity whilst continuing to make a significant contribution to human needs. It is run as a joint programme of WWF and IUCN (the International Union for the Conservation of Nature) and operates through a network of nine regional programmes, giving TRAFFIC an extensive global reach. It has implemented and enabled a number of wildlife trade monitoring systems, is involved in improving wildlife trade enforcement, works to increase global awareness about trade related conservation and poverty issues and is involved in advocacy at the national and international levels. TRAFFIC has worked with the IUCN/SSC Medicinal Plants Specialist Group (MPSG) on the development of indicators for Food and Medicine. OUTPUTS, EXPERIENCES AND LESSONS LEARNT FROM THE 2010 BIODIVERSITY INDICATORS PARTNERSHIP 169
171 Umeå University (4.3.2 River fragmentation and fl ow regulation) The Landscape Ecology Group at the Department of Ecology and Environmental Science at Umeå University works with ecology and biodiversity issues in a large-scale perspective. The group is focused on running waters and biotic and abiotic processes operating at the scale of landscapes. These studies assist the group in analyzing and understanding the effects of human impacts and in providing suggestions on how such effects can be avoided or reduced by proper management actions. United Nations Environment Programme Global Environment Monitoring System Water Programme (4.2.1 Water Quality Index for Biodiversity) The United Nations Environment Programme Global Environment Monitoring System Water Programme (UNEP GEMS/Water) develops and maintains a global freshwater quality information system with a series of national and international partners. It provides information on global freshwater quality through a variety of mechanisms including the internet and via CD-ROM to support global and regional environmental assessment and reporting processes in the United Nations system and other international agencies. It works with partners to facilitate the formulation and implementation of programmes to build capacity of developing countries for the acquisition and management of water quality information. United Nations Environment Programme World Conservation Monitoring Centre (Extent of marine habitats, Coverage of protected areas, Protected areas overlays with biodiversity, Management effectiveness of protected areas, Area of forest under sustainable management: certification, Status of species in trade, Wild Commodities Index, Forest Fragmentation, Health and well being of communities directly dependent on local ecosystem good & services, Official development assistance provided in support of the Convention) The UNEP World Conservation Monitoring Centre is the biodiversity assessment and biodiversity policy support arm of the United Nations Environment Programme, the world s foremost intergovernmental environmental organization. The Centre has been in operation for 30 years, providing objective, scientifically rigorous products and services to help decision makers recognize the value of biodiversity and apply this knowledge to all that they do. The Centre s core business is locating data about biodiversity and its conservation, interpreting and analysing that data to provide assessments and policy analysis, and making the results available to both national and international decision makers and businesses. United Nations Educational, Scientific and Cultural Organization (5.1.1 Status and trends of linguistic diversity and numbers of speakers of indigenous languages) The United Nations Educational, Scientific and Cultural Organization (UNESCO) works to create the conditions for dialogue among civilizations, cultures and peoples, based upon respect for commonly shared values. It is through this dialogue that the world can achieve global visions of sustainable development encompassing observance of human rights, mutual respect and the alleviation of poverty, all of which are at the heart of UNES- CO S mission and activities. The broad goals and concrete objectives of the international community - as set out in the internationally agreed development goals, including the Millennium Development Goals (MDGs) - underpin all UNESCO s strategies and activities. Thus UNESCO s unique competencies in education, the sciences, culture and communication and information contribute towards the realization of those goals. University of Queensland (1.3.3 Management effectiveness of protected areas) The University of Queensland (UQ) is one of Australia s premier learning and research institutions. It is the oldest university in Queensland and has produced generations of graduates who have gone on to become leaders in all areas of society and industry. The University is a founding member of the national Group of Eight, an alliance of research-strong sandstone universities committed to ensuring that Australia has higher education institutions which are genuinely world class. It belongs also to the global Universitas 21 alliance. This group aims to enhance the quality of university outcomes through international benchmarking and a joint venture e-learning project with The Thomson Corporation. 170 BIODIVERSITY INDICATORS & THE 2010 BIODIVERSITY TARGET
172 World Health Organization (4.4.1 Health and well being of communities directly dependent on local ecosystem good & services) The World Health Organization (WHO) is the directing and coordinating authority on international health within the United Nations system. WHO experts produce health guidelines and standards, and help countries to address public health issues. WHO also supports and promotes health research. Through WHO, governments can jointly tackle global health problems and improve people s well-being. WHO operates in an increasingly complex and rapidly changing landscape. The boundaries of public health action have become blurred, extending into other sectors that influence health opportunities and outcomes. WHO responds to these challenges using a six-point agenda. The six points address two health objectives (Fostering health security, Strengthening health systems), two strategic needs (Promoting development, Harnessing research, information and evidence), and two operational approaches (Enhancing partnerships, Improving performance). WWF (1.2.1 Living Planet Index) WWF s mission is to stop the degradation of our planet s natural environment, and build a future in which humans live in harmony with nature. To achieve this, WWF is working with many partners to: Save biodiversity; Reduce humanity s impact on natural habitats. WWF strategically focuses on conserving critical places and critical species that are particularly important for their habitat or for people. It is also working to reduce humanity s ecological footprint - the amount of land and natural resources needed to supply food, water, fibre and timber, and to absorb CO2 emissions. Affiliate Partners ASEAN Centre for Biodiversity The ASEAN (Association of South-East Asian Nations ) Centre for Biodiversity (ACB) is an intergovernmental regional centre of excellence which facilitates cooperation among the members of ASEAN (Brunei Darussalam, Cambodia, Indonesia, Lao PDR, Malaysia, Myanmar, Philippines, Singapore, Thailand, Vietnam), and with relevant national governments, regional and international organizations on the conservation and sustainable use of biological diversity, guided by fair and equitable sharing of benefits arising from the use of such biodiversity. The Centre supports ASEAN governments in areas identified in Multilateral Environment Agreements such as the CBD, CITES, Ramsar and the Cartagena Protocol on Biosafety, for which majority of the ASEAN Member States are parties. Biotrade Initiative UNCTAD s BioTrade Initiative promotes the conservation of biodiversity to further sustainable development through its sustainable commercial use. Since 1996, jointly with regional and national organizations, a variety of sectors are being supported in Africa, Asia and Latin America, including non-timber forest products, wildlife-derived products, sustainable agriculture and tourism. UNCTAD and partners are developing the BioTrade Impact Assessment System (BTIAS) based on the BioTrade Principles and Criteria and the adaptive management, ecosystem, value chain and sustainable livelihood approaches. Through environmental, social, economic and governance indicators, BioTrade s contribution to sustainable development and in particular to the objectives of the CBD is measured. Center for International Earth Science Information Network The mission of the Center for International Earth Science Information Network (CIESIN) is to provide access to and enhance the use of information worldwide, advancing understanding of human interactions in the environment and serving the needs of science and public and private decision making. CIE- SIN was one of the first organizations involved in developing and providing interactive data access and mapping tools via the Internet. Given the great diversity of scientific data and information resources now available, CIESIN continues to implement innovative approaches to data identification, access, visualization, and analysis across distributed data systems. This includes efforts to develop global and regional information systems, create innovative decision-support tools, and provide training and technical support services. OUTPUTS, EXPERIENCES AND LESSONS LEARNT FROM THE 2010 BIODIVERSITY INDICATORS PARTNERSHIP 171
173 Countdown 2010 Countdown 2010 is a network of active partners working together to halt the loss of biodiversity and meet the 2010 Biodiversity Target. One main objective of Countdown 2010 is to demonstrate clearly what progress is being made on the way to The 900 Partners of Countdown 2010 range from national to local governments, and from non-governmental organizations to businesses. As a global initiative, Countdown 2010 has hubs in many regions of world, at which work is being conducted with stakeholders to increase the level of action towards the 2010 Biodiversity Target. Circumpolar Biodiversity Monitoring Program The Circumpolar Biodiversity Monitoring Program (CBMP) is working with over 60 partners to harmonize and enhance long-term Arctic biodiversity monitoring efforts in order to improve our ability to detect, understand, report on and respond to significant trends and pressures. The resulting information will be used to assist decision making from the global to local level. A key component of the program is the development of a set of biodiversity indices and indicators that will report on the state and trajectory of key elements of the Arctic s living resources. These indices and indicators contributed to the Global Biodiversity Outlook 3 report. The CBMP is the cornerstone program of the Arctic Council s Conservation of Arctic Flora and Fauna Working Group. ECORA ECORA is a Global Environment Facility (GEF) sponsored project initiated by Conservation of Arctic Flora and Fauna (CAFF) Working Group of the Arctic Council and the Russian Federation. ECORA is using an integrated ecosystem management (IEM) approach to conserve biodiversity and minimize habitat fragmentation in three selected model areas in the Russian Arctic. The Model Areas selected for ECORA are Kolguev Island in Nenets Autonomous Okrug, the Lower Kolyma River Basin in Yakutia (Sakha Republic), and the Beringovsky District in Chukotka Autonomous Okrug. ECORA will help to secure the integrity of some of the world s last remaining pristine areas and support livelihoods of indigenous and local peoples. Global Biodiversity Information Facility Global Biodiversity Information Facility (GBIF) enables free and open access to biodiversity data online. GBIF provides three core services and products: An information infrastructure - an Internet-based index of a globally distributed network of interoperable databases that contain primary biodiversity data - information on museum specimens, field observations of plants and animals in nature, and results from experiments. Community-developed tools, standards and protocols - the tools data providers need to format and share their data Capacity-building - the training, access to international experts and mentoring programs that national and regional institutions need to become part of a decentralised network of biodiversity information facilities. Global Reporting Initiative The Global Reporting Initiative (GRI) is a network-based organization that has pioneered the development of the world s most widely used sustainability reporting framework and is committed to its continuous improvement and application worldwide. In order to ensure the highest degree of technical quality, credibility, and relevance, the reporting framework is developed through a consensus-seeking process with participants drawn globally from business, civil society, labor, and professional institutions. The G3 Guidelines include a series of indicator categories, including those on economic, social and environmental matters. Within the latter, indicators exist addressing the status and impact of commercial activities directly on local biodiversity, as well as other influences on abiotic aspects. GRI is working with the 2010 BIP in considering relevant indicators on ecosystem services for the private sector. Regional Strategic Biodiversity Monitoring and Evaluation Program for Central America (PROMEBIO) By creating a scientifically-based tool to track and evaluate regional biodiversity and provide easy access to this critical information for leaders, policy makers and others can promote the conservation and sustainable use of natural resources. Via the Integrated System of Central America (SICA), the institutional framework for collaboration among the Central American governments, and more specifically through the Central American Commission on Environment and Development (CCAD), the seven nations have been advancing a unified and actionable management strategy which will respond to the CBD goals. 172 BIODIVERSITY INDICATORS & THE 2010 BIODIVERSITY TARGET
174 International Centre for Integrated Mountain Development The International Centre for Integrated Mountain Development (ICIMOD) is a regional knowledge development and learning centre serving the eight regional member countries of the Hindu Kush-Himalayas - Afghanistan, Bangladesh, Bhutan, China, India, Myanmar, Nepal, and Pakistan - and based in Kathmandu, Nepal. We support regional transboundary programmes through partnership with regional partner institutions, facilitate the exchange of experience, and serve as a regional knowledge hub. Biodiversity conservation and management is an important component of the centre that works on analysis of biodiversity status and gaps, conservation and management effectiveness of the existing protected areas, policy analysis and long term monitoring at transboundary landscapes. International Indigenous Forum on Biodiversity The International Indigenous Forum on Biodiversity (IIFB), formed during the third Conference of the Parties (COP 3) to the Convention on Biological Diversity (CBD) in November 1996, is a collection of representatives from indigenous governments, indigenous non-governmental organizations and indigenous scholars and activists that organize around the CBD and other important international environmental meetings. It aims to help coordinate indigenous strategies at these meetings, provide advice to the government parties, and influence the interpretations of government obligations to recognize and respect indigenous rights to their knowledge, territories and resources. The Institute for Water, Environment and Health The Institute for Water, Environment and Health (UNU-INWEH) is the UN think tank on water, and is a part of the United Nations University. It was created in 1996 with its core funding provided by the Government of Canada, and is hosted at the McMaster University, Hamilton. Its core concern is the global water crisis. It aims to contribute, through capacity development and directed research, to efforts to resolve pressing global water problems that are of concern to the United Nations, its member states and their peoples. UNU-INWEH s programme structure represents a proactive, selective and longer-term strategy to programme development, reflecting the water-environment-health mission, while ensuring progressively greater coherence in the programme of work. Three core functions are: (a) capacity development through the strengthening of scientific, managerial, educational and institutional capacity in developing countries; (b) enhancing and mobilizing knowledge to address policy issues and to fill critical knowledge gaps; and (c) directed science and policy bridging - achieved through application of research and focused on water policy and governance innovations. UNU-INWEH is also actively involved in indicator development and is a partner of the Global Environment Facility project entitled Ensuring Impacts from SLM: Development of the Global Indicator System. Under this medium-sized project, indicators to demonstrate the benefits derived from actions on sustainable land management will be developed. Land Degradation Assessment in Drylands The Land Degradation Assessment in Drylands project (LADA) develops tools and methods to assess and quantify the nature, extent, severity and impacts of land degradation on dryland ecosystems, watersheds and river basins, carbon storage and biological diversity at a range of spatial and temporal scales. It also builds the national, regional and international capacity to analyze, design, plan and implement interventions to mitigate land degradation and establish sustainable land use and management practices. The social, economic and environmental impacts of land management practices which are inventoried during LADA national level assessments are analyzed to provide estimates of the CBD indicator areas of agricultural ecosystems under sustainable management, index of fragmentation, and level of public aid for environment. Nordic Biodiversity Indicators 2010 The Nordic countries agreed on a common goal to halt the decline in biodiversity by The NordBio2010 project aims to evaluate the 2010-target by developing indicators that can describe the state of biodiversity in the Nordic countries. Also, it aims at improving future work on national nature monitoring programmes. NordBio2010 is commissioned by the Nordic Council of Ministers and led by the National Environmental Research Institute of Denmark (NERI). OUTPUTS, EXPERIENCES AND LESSONS LEARNT FROM THE 2010 BIODIVERSITY INDICATORS PARTNERSHIP 173
175 Streamlining European 2010 Biodiversity Indicators The Streamlining European 2010 Biodiversity Indicators (SEBI2010) was launched in 2005 as a pan- European initiative. The aim of this initiative is to develop a European set of biodiversity indicators to assess and inform about progress towards the European 2010 targets. SEBI2010 does not create new monitoring or reporting obligations for countries, but tries to ensure consistency between biodiversity indicator sets at national and international levels. SEBI2010 relies on the contribution of more than 120 experts from across the region and from international intergovernmental organisations and NGOs. The Economics of Ecosystems and Biodiversity The Economics of Ecosystems and Biodiversity (TEEB) study is an international initiative to draw attention to the global economic benefits of biodiversity, to highlight the growing costs of biodiversity loss and ecosystem degradation, and to draw together expertise from the fields of science, economics and policy to enable practical actions moving forward. The study draws together experience, knowledge and expertise from all regions of the world in the field of science, economics and policy to enable practical actions in response to the growing number of indicators on the loss of biodiversity moving forward. Tour du Valat Tour du Valat coordinates the Observatory of Mediterranean Wetlands, which is a Ramsar regional initiative (Medwet) across 26 countries with 6 monitoring themes (including biodiversity, ecosystems, and ecosystem services) and a series of indicators. The wetland indicators follow the CBD and SEBI2010 suites; including, percentage of wetland change of extent, proportion of wetlands totally/partly protected, index of fragmentation, and level of public aid for environment. Water Footprint Network The Water Footprint Network advances the water footprint concept to further sustainable and equitable water use globally through developing standards and tools for water footprint accounting, water footprint impact assessment and the reduction and offsetting of the negative impacts of water footprints. It also supports a variety of stakeholders in implementing appropriate accounting systems, promoting sustainable and fair water related policy and strategy, and promoting the exchange, communication and dissemination of knowledge on water footprint. The assessments couple the water footprint with environmental, social and economic indicators, and is currently being applied is the environmental flow requirement of a river needs to sustain its ecosystems and biodiversity. Wetlands International Wetlands International is a global organisation that works to sustain and restore wetlands and their resources for people and biodiversity. It is an independent, not-for-profit, global organisation, supported by government and NGO membership from around the world. Wetlands International works in over 100 countries and at several, very different scales to tackle the most pressing problems affecting wetlands. Its work ranges from research and community-based field projects to advocacy and engagement with governments, corporate and international policy fora and conventions. Wetlands International works through partnerships and is supported by contributions from an extensive specialist expert network and tens of thousands of volunteers. 174 BIODIVERSITY INDICATORS & THE 2010 BIODIVERSITY TARGET
176 ANNEX 3. The following information is taken from the document, Guidance for National Biodiversity Indicator Development and Use available to view online: DEVELOPMENT OF GUIDANCE MATERIALS FOR NATIONAL IMPLEMENTATION The ideas and experience reported in this guidance have been developed and tested in capacity building workshops for national government and NGOs agencies from over 45 countries, as explained in section 6.1. Much of the thinking on biodiversity indicator development presented here was first developed through a GEF project from 2002 to 2005 called Biodiversity Indicators for National Use (BINU), working with partners in Kenya, Ukraine, Philippines and Ecuador and at PBL (Netherlands). Key messages for developing and using biodiversity indicators An indicator can be defined as, a measure based on verifiable data that conveys information about more than itself. This means that indicators are purpose-dependent - the interpretation or meaning given to the data depends on the purpose or issue of concern. Since indicators are purpose-dependent their development or selection should start with identifying the issue or decision-making need that the indicator will address. Describing this need in the form of a key question helps to guide indicator selection and communication. There are almost always some relevant data available to start producing biodiversity indicators. Understand your data - their strengths, their limitations, and where they have come from. The same data can be used in an indicator for multiple purposes. When selecting and presenting indicators think about the story or narrative that you want to tell to the user about the subject. An indicator fact sheet helps to guide the development of an indicator and helps others to continue its production in the future. Indicators are part of a process and should lead on to informed decisions - they are not ends in themselves. Introduction This guidance is designed to help the development of biodiversity indicators at the national level for uses such as reporting, policy-making, environmental management, and education. It is intended principally for the people who produce biodiversity indicators, whether they are in government agencies, academia or NGOs. In some cases biodiversity indicators are developed on a one-off basis to meet the needs for a particular study or report, or they can be developed for long-term reporting and decision-making. This guidance can be used for both situations. This document has been separated into two sections for ease of use. The first defines what an indicator is and then examines the multiple uses of biodiversity indicators, such as for reporting and management The second section should be considered as the implementation component and is organised around the Biodiversity Indicator development Framework (inside cover) which presents a series of key steps in successful indicator development. These steps may be used as a guideline for the production of an individual indicator, or for a suite of indicators brought together to answer a specific question. Detailed information is provided for each step, including identifying indicator needs and key questions, gathering and analysing data, testing results, and the communication of indicators. The focus of the guidance is on the process aspects of producing and using indicators, rather than technical aspects such as different measures of biodiversity. OUTPUTS, EXPERIENCES AND LESSONS LEARNT FROM THE 2010 BIODIVERSITY INDICATORS PARTNERSHIP 175
177 The overall aim is to assist in the production of successful biodiversity indicators at the national level. By successful we mean indicators that are actually used to support policy and decision making, whether this be in reports on progress towards targets, analysis of important issues, or in education and the news media. Successful indicators are also produced on a regular basis, so that they can be used to track change over time. This guidance covers the range of such factors that contribute to the success of indicators, including scientific validity, sensitivity to change in the issue of concern, and the existence of a champion institution responsible for their continued production and communication. Sometimes biodiversity indicators are developed within frameworks for analysis and reporting such as the Pressure-State-Response framework, or the framework of focal areas and global headline indicators for the Convention on Biological Diversity s 2010 Target. We do not describe all these frameworks, but will make reference to them. This document complements the information available on the National Biodiversity Indicators Portal ( Section 1: Key concepts What is an indicator? For the purpose of this guidance we define an indicator as, a measure based on verifi able data that conveys information about more than itself. Examples of indicators from subjects other than biodiversity are a person s body temperature as an indicator of his or her health, or the level of unemployment as an indicator of the status of a country s economy and the well-being of its population. In some cases information from several different measures or data sets can be combined to form an index, such as the Consumer Price Index which indicates the inflation rate of a national economy. Biodiversity indicators can also be simple measures or more complex indices. For example, population estimates of the large cat species in a country could be a relatively simple indicator of the integrity or health of terrestrial ecosystems. The Marine Trophic Index can be an indicator, or proxy, of the integrity of marine ecosystems, calculated from data of harvested fish and their average trophic level (such as herbivores and carnivores) in the food web. The general term biodiversity indicators as used in this document and by the Convention on Biological Diversity (CBD) covers more than direct measures of biodiversity itself, such as species populations and extent of ecosystems. It also covers actions to ensure biodiversity conservation and sustainable use, such as the creation of protected areas and regulation of the harvesting of species, and pressures or threats to biodiversity such as habitat loss. Since indicators are measures of something they can usually be presented in a numerical or quantitative form. A line graph is perhaps the most common form of presentation, but other forms such as a pie chart or map may sometimes be clearer and have greater impact. Probably the most important part of the indicator definition is that the data conveys information about more than itself. This means that indicators are purpose-dependent - the interpretation or meaning given to the data depends on the purpose or issue of concern. One of the key messages in this guidance document is that since indicators are purpose- dependent their development or selection should start with identifying the issue or decision-making need that the indicator is expected to address. Who uses biodiversity indicators? Biodiversity indicators can be used by almost any sector of society and the following are some typical uses. National and regional governments use indicators to help make policies for biodiversity conservation and sustainable use. They can also use the indicators to seek support and justification for their decisions, and to report on the impact of their policies. The news media may also use these indicators in their reports on environmental issues and government actions. Non-governmental organisations may use indicators produced by the government or from their own work to raise awareness about biodiversity issues, and to hold governments to account on their policies. Universities and other educational institutions may use biodiversity indicators as part of their teaching on biodiversity. Research institutions and commercial consultancies may produce and use indicators as part of their analyses and reporting of environmental issues, including for environmental impact assessments. 176 BIODIVERSITY INDICATORS & THE 2010 BIODIVERSITY TARGET
178 Who develops biodiversity indicators? Some governments have specific units or staff responsible for the production of national biodiversity indicators, with a mandate to gather data and publish the indicators on a consistent basis over time. Such government indicators may be validated by the national statistical agency and also included in their reports. Other governments may produce biodiversity indicators on a less systematic basis as demand arises, such as reporting to an international environmental agreement or developing a new policy. If they do not have sufficient capacity themselves, the government department responsible for biodiversity issues may contract a consultancy or university to assist in the production of indicators and biodiversity reports. Most governments will also produce some biodiversity indicators or biodiversity-relevant indicators in departments such as forestry, fisheries and maybe agriculture and land use planning. Some national and international biodiversity non-governmental organisations (NGOs) produce indicators. This may be to raise awareness and provide evidence for issues of their concern, and to demonstrate the impact of their actions and get more support. Such NGOs usually have a few technical staff responsible for the gathering, analysis and communication of their scientific and survey data, including the use of indicators. Universities and other research institutes also may develop biodiversity indicators, although this is more likely to be on ad-hoc basis for specific studies rather than a regular and long-term monitoring and reporting of the same indicators. The production and reporting of biodiversity indicators may be most successful by working in partnerships, to provide the necessary capacity, data and technical expertise. Some partners may be directly involved in the development of the indicator and the provision of data. Other partners may be external to the development process as providers of funding or users of the end products. The skills required for biodiversity indicator development include: a science-based understanding of the biodiversity issue of interest, understanding the scientific and statistical strengths and weaknesses of the data being used, a basic competency in the processing of data to produce graphs and maps, etc with a scientific and statistical validity, writing and presentation skills to communicate the indicator results to the intended users. Uses of indicators Indicators are a central part of effective decision-making and adaptive management. They can provide measures of the progress and success of policies, as well as form part of an early warning system to detect the emergence of problems. They can also be used to raise awareness about an issue and put responses to it into context. Through all these functions indicators provide an important interface between policy and biodiversity-related science, to help simplify this complex subject. In some cases biodiversity objectives and policies result from scientific research which identifies new and emerging issues, such as climate change or the impacts of invasive alien species. Indicators can play a central role in the communication of these new concepts and increase the effectiveness of responses to mitigate changes. Indicators by themselves, however, provide little understanding of an issue. They always need some analysis and interpretation of what they are indicating. Indicators with their interpretative text can then be part of the definition of targets or objectives. Caution is required, though, if targets are set on the basis of a desired value of an existing indicator, especially if the indicator has been chosen principally because it is something for which there is existing data. It is important to determine the desired state of the subject which the indicator is just an indicator of! For example, a certain abundance of lions in an area may be selected as a target, when actually the desired aim is a savannah ecosystem able to sustain all native wildlife species as well as livestock grazing and tourism. A management target for just a desired lion population may result in actions that conflict with other objectives for the area. One of the common uses of biodiversity indicators is to track progress towards global and national targets. These targets range from action plans at a local level, through National Biodiversity Strategies and Action Plans (NBSAPs), to the decisions of international agreements such as the CBD. The use and the international profile of biodiversity indicators has increased considerably since the Parties to the CBD committed themselves in 2002 to, achieve by 2010 a significant reduction of the current rate of biodiversity loss at the global, regional and national level as a contribution to poverty alleviation and to the benefit of all life on Earth. At the national and regional scales, the requirement to report on progress in meeting the 2010 Biodiversity Target has been a major force in promoting the development of biodiversity indicators. In some cases countries have adapted existing data and indicators to the CBD framework of goals, targets, focal areas and global indicators for their reports to the CBD. This impulse to produce biodiversity indicators is likely to continue with the adoption of post-2010 targets by the CBD. OUTPUTS, EXPERIENCES AND LESSONS LEARNT FROM THE 2010 BIODIVERSITY INDICATORS PARTNERSHIP 177
179 What is a successful indicator? The participants in the 2010 BIP capacity building workshops identified that a successful indicator should be: Scientifi cally valid - a) there is an accepted theory of the relationship between the indicator and its purpose, with agreement that change in the indicator does indicate change in the issue of concern; b) the data used is reliable and verifiable. Based on available data - so that the indicator can be produced over time. Responsive to change in the issue of interest. Easily understandable - a) conceptually, how the measure relates to the purpose, b) in its presentation, and c) the interpretation of the data. Relevant to user s needs. Used! - for measuring progress, early-warning of problems, understanding an issue, reporting, awareness-raising, etc. Section 2: Developing and using indicators This section covers the different stages of the Biodiversity Indicator Development Framework, which contains the key steps or components in the production of successful biodiversity indicators, based on the experience of UNEP-WCMC and its partners. This section provides guidance on each of these steps. Although tested and refined over ten years, it is important to recognise that the framework represents an ideal situation and it may not be necessary to cover every step. However, in our experience, successful indicators are most likely to be achieved when all the steps have been considered. Although presented in a logical sequence from top to bottom, there are other possible starting points and directions for using the framework. Indicator developers are encouraged to think of indicator development as an iterative process, which requires movement back and forth between the steps. For example, the steps identify possible indicators and gather and review data are often undertaken simultaneously. It must be remembered that the purpose of the framework is not to produce indicators for their own sake, but to support informed, effective decision making and action for biodiversity conservation and sustainable use. Identify and consult stakeholders and the target audience Indicators should be chosen to meet the needs of specifi c users It is strongly recommended that stakeholders are consulted as early in the indicator development process as possible in order to determine the purpose of the indicator and its audience. These stakeholders may be direct users of the indicator, those with a broader interest in the issues surrounding it, and those holding relevant data. Consulting with these groups Identify & consult stakeholders/ audience Determine key questions & indicator use Identify possible indicators Gather & review data Calculate indicators Communicate & interpret indicators Test & refine indicators with stakeholders Identify management objectives & targets Develop conceptual model Develop monitoring & reporting systems and identifying their needs will also help to define how simple or complicated the indicator can be, and the most appropriate ways of communicating and interpreting it. There are many different groups with interests in biodiversity who could use information generated from biodiversity indicators. Some of these are obvious, such as government biodiversity conservation agencies, conservation-focused non-governmental organizations (NGOs), and relevant departments in universities and research institutions. Others, including government agencies responsible for agriculture and land-use planning, agencies involved in rural 178 BIODIVERSITY INDICATORS & THE 2010 BIODIVERSITY TARGET
180 development, and indigenous peoples groups, may be less apparent. Many groups also have an important direct or indirect impact on biodiversity without necessarily having a conscious interest in it, such as those involved with road construction or energy supplies. These are potentially some of the most important groups to reach in communicating information about biodiversity and involving them in relevant decision-making, but can also be some of the hardest stakeholders to engage with. Some important groups may be surprising at first sight, for example in Ukraine the military have been engaged in the production of agrobiodiversity indicators as they had responsibility for large areas of land whose management is important for species in agricultural landscapes. Many stakeholders may not in the first instance be clear what questions they have regarding biodiversity-related policies and management. They may also differ widely in their awareness and understanding of the relationships between biodiversity and their own interests. The presentation of existing biodiversity information and potential indicators can help to stimulate stakeholders thinking and awareness of questions that may be important to them. This requires the teams leading the process to take a proactive role, which inevitably means that their own values and interests will come to the fore. This is not necessarily a problem provided that it is openly acknowledged and that teams make every effort to respond to others ideas. One major barrier between indicator development teams and other stakeholders can be a lack of common concepts and understanding of what biodiversity is and why it is important to each group. It is therefore essential to discuss these issues from the beginning of the indicator development process so that stakeholders, including the indicator development team, understand these concepts as clearly as possible. Because of the multidimensional nature of the term biodiversity and the different value sets of each group involved, ultimate agreement on all terms and issues may never be reached. Consultations need to manage stakeholder expectations The consultation process should include managing the expectations of stakeholders regarding the level of detail of analyses and indicators that will be produced, if any input is required from them, and whether the indicator will result in new resources being made available. Consultations with stakeholders may well overlap in time and purpose with the indicator development step Identify management objectives and targets. Both of these steps will enable the following step Determine key questions and indicator use. Some stakeholders, such as a national statistical agency, may want to be consulted at every stage of indicator development. After the initial consultations most stakeholders will only have the time or interest to be consulted again on the utility of the final products for their needs, which is the step at the bottom of the indicator development framework: Test and refine indicators with stakeholders. Questions to ask during this step: Who are the relevant stakeholders, and do they all need to be consulted? What questions do the stakeholders want answers to regarding the biodiversity issue of concern? How will the stakeholders want to use the indicator(s)? (e.g., for decision-making, for reporting, for education). Have the inputs, expectations and outputs of the indicator development process been clearly defined for the stakeholders? How much ownership and decision-making power are different stakeholders going to have over the choice of indicators? Quotes from indicator developers: Make sure that key stakeholders (government and other relevant interested parties) are involved and have a shared sense of ownership of the process. Ed Mackey, Scottish Natural Heritage (SNH) Identify management objectives and targets An important role of indicators is to support adaptive management to achieve objectives and targets Some indicators are designed to encourage awareness and understanding about an issue but different indicators may well be needed for decision-making on objectives and management actions. For example, the Living Planet Index (LPI) provides a single index value of the trends in abundance and distribution of selected vertebrate species for which there are suitable data sets. Changes in the LPI are an indicator of overall biodiversity loss or gain and this information is important for raising public and policy makers awareness of the issue, but the index value alone does not explain why there is biodiversity loss or gain or what objectives or actions there should be to address this. OUTPUTS, EXPERIENCES AND LESSONS LEARNT FROM THE 2010 BIODIVERSITY INDICATORS PARTNERSHIP 179
181 When biodiversity indicators are developed to support decision making and management the definition of the purpose and users of such indicators should start with identifying already agreed objectives and targets. All countries have management objectives and policies with direct or indirect impacts on biodiversity and reporting on progress towards these is a major role for biodiversity indicators. Key biodiversity management policies include National Biodiversity Strategies and Action Plans (NBSAPs), protected areas systems plans and endangered species legislation. Relevant documents in other natural resource management sectors include national forest plans, fisheries policies, water policies, land-use plans and environmental impact legislation. Some national objectives may have been adapted from the targets and plans of international agreements such as the CBD or the Millennium Development Goals. Indicators are a key part of reporting on national progress to such international agreements. In reality, national biodiversity-relevant policies and management are scattered across a wide variety of sectors. However, a common problem is that policies often lack clearly stated objectives, explicit targets or specified mechanisms for measuring progress, so the definition of indicator needs is not always straightforward. In such cases indicators may still serve to raise awareness and understanding of the policy issue and support future definition of objectives and strategies. If this step has not identified relevant management objectives and targets then it may need to be combined with the step Identify and consult stakeholders/audience to obtain more information to define the purpose of the indicator(s). This indicator development step leads onto the step Determine key questions and indicator use. Questions to ask during this step: What are the existing biodiversity-relevant management objectives and targets in our country? Who wants to know about progress in reaching these objectives and targets? Determine key questions and indicator use Indicators are best designed and communicated to help answer users key questions Determine key questions It is strongly recommended to develop and communicate biodiversity indicators in response to key questions. A key question describes what the user or audience for the indicator wants to know about the subject. It helps to define what the purpose of the indicator is, and since indicators are purpose dependent this is very important. Key questions can be very general, such as: How many species are there in our country? Which species are threatened with extinction? What are the priority areas for biodiversity conservation? Is biodiversity increasing or decreasing in our country? There may be several indicators and data sets that help to answer a single key question. One of the benefits of defining a key question is that it naturally encourages the selection and communication of the indicators in a form that aids their interpretation. Usually some form of narrative text accompanies the presentation of an indicator, to explain the significance of a trend line on a graph, for example. The writing of this explanation is easier when it is in response to a key question. The logic of addressing a key question also encourages further analysis and the use of more than one indicator to explain complex issues. If key questions are more precise and specific to a situation this gives more guidance for the selection and development of suitable indicators. More specific key questions are often about management issues, such as: What are the main threats to biodiversity in our area? What is the sustainable catch level for this fishery? What is the status of the important wildlife for our tourism industry? Objectives and targets can be rephrased as questions to help identify indicators for them. For example: Have we achieved the CBD s 2010 Target to achieve a significant reduction in the rate of loss of biodiversity? Is our elephant population within the target range of 15,000 to 20,000 animals? Have we achieved our target of at least 10% of all our ecosystems included in our protected areas system? 180 BIODIVERSITY INDICATORS & THE 2010 BIODIVERSITY TARGET
182 The definition and prioritisation of key questions should ideally be an iterative process of consultations with the stakeholders and audience for the indicator(s). Initially a great variety of questions may be identified, and some of them may so broad or complex in their scope that they may not be best answered using indicators. The indicator development team may need to build shared understandings of the issue and manage the expectations of all involved. It may be that the agreed need is not just the development of indicators, but for their use as part of a detailed analysis and report in response to the key questions, or the need is first for the gathering of field data. Analytical and Reporting Frameworks Sometimes biodiversity indicators are selected and presented within frameworks for analysis and reporting such as the Pressure-State-Response (PSR) framework, or the DPSIR framework which includes driving forces and impacts of environmental change. The PSR framework is based on a model of the world that human activities exert pressures (such as pollution emissions or land use changes) on the environment, which can induce changes in the state of the environment (for example, pollutant levels, habitat diversity, water flows). Society then responds to changes in environmental pressures or state with policies and programs intended to prevent or reduce environmental damage. The structure of many reports on the state of the environment, and the framework of focal areas and indicators for reporting on the CBD s 2010 Target (see have been organised using a PSR framework and its variants. Analytical and reporting frameworks such as PSR can be helpful in identifying important questions which indicators can help to answer. However, there is often a tendency to try and assign particular indicators to one or other of the categories of the framework. Unless particular indicators have been specified for use in a report (in which case this guidance is not relevant), it is strongly recommended that such frameworks are used only to help identify and group key questions, but not for the classification or selection of indicators. This is because indicators are purpose-dependent and so the same measure can be used in two or more of the PSR categories. For example, data on forest extent could be used as an indicator of rates of habitat loss (pressure), as an indicator of habitat suitable for forest-dependent species (state), and as an indicator of the effectiveness of policies to stop deforestation (response). Determine indicator use The definition of a key question helps to determine the use of an indicator. Will it be used for measuring progress, early-warning of problems, understanding an issue, reporting, or awareness-raising? If it is to be used for management decision-making, will it be used on specific occasions when decisions are made or progress reported, such as an annual review of a programme of work? Who specifically will be using this information? What levels of education and familiarity with the subject does the intended audience already have? The more the intended use of an indicator can be detailed the easier the subsequent steps of indicator development and communication will be, and the greater likelihood of the indicator having an impact and being used over time. Questions to ask during this step: What are the key questions that the intended user or audience have about the biodiversity issue? Can the key questions be made more specific or focused? How will the indicator be used? Who will be using the indicator? What levels of education and familiarity with the subject does the intended audience already have? Quotes from indicator developers Keep to a small number of indicators, making sure you only have indicators that answer a specific question or meet a clearly-defined need. Jessica Grobler, SANBI Develop a conceptual model A conceptual model helps to select and communicate indicators in response to key questions. As biodiversity indicators are purpose-dependent the relationship between the measure chosen as an indicator and the indicator s purpose needs to be scientifically valid and easy to understand. This is especially important for such a complex concept as biodiversity, which is open to multiple interpretations and is often difficult to communicate. To help determine and explain the relationship between an indicator and its purpose a conceptual model of the issue of concern is very helpful. A conceptual model is basically a diagram that represents the main issues of concern and how they are related to each other. Typically the diagram has each issue in a box or circle and the relationships between them are shown by arrows or lines. Accompanying text can give further explanation of the diagram. OUTPUTS, EXPERIENCES AND LESSONS LEARNT FROM THE 2010 BIODIVERSITY INDICATORS PARTNERSHIP 181
183 A conceptual model diagram helps to clarify the subject being addressed for all involved and aids in the selection and communication of appropriate indicators. It helps in assessing the suitability of potential indicators to answer the key question(s) and their scientific validity, considering how effectively they represent the issue of concern and respond to any change. A conceptual model can also guide how to structure the explanation of an issue and the meaning of the indicators. The model may be presented as a diagram in a final report to assist to help develop the narrative. Conceptual model development starts with clarification of the key questions The starting point in the production of a conceptual model is the key question(s) of the indicator users and any management objectives that have been identified. From these the scope or boundaries of the subject (e.g., site-specific or national) can be defined. The main subjects or issues in addressing the key question(s) are then identified. These issues and their relationships are then drawn on a preliminary diagram for discussion by the indicator developer team, and ideally with the users of the indicator. The conceptual model is then reworked and refined, helping to build a clearer and shared understanding of the subject. This process may lead to changes or further definition of the key questions. At the stage of indicator selection there could potentially be indicators for each of the issues in the conceptual model and for the lines or linkages between them. For a very specific key question the conceptual model can be a simple one. For example, for the question, Have we achieved our target of at least 10% of all our ecosystems included in our protected areas system? Figure A30 could be a conceptual model of the issues involved. Data could be gathered for each of the boxes or issues and the indicator is for the relationship between the issues, which would probably involve a GIS overlay analysis. Distribution of Protected Areas Distribution of Ecosystems (Vegetation Types) Figure A30. An example conceptual model to guide indicator development for the key question, Have we achieved our target of at least 10% of all our ecosystems included in our protected areas system? Figure A31 is an example conceptual model diagram produced to examine some more general key questions about a country s protected areas (PAs) system, such as, what is the status of our protected areas (PAs)?, what benefits do our PAs provide for local communities?, and, what are the management priorities for our PAs?. Indicators could potentially be produced to describe each box or issue in the diagram, The interpretation of the indicator values and trends will be helped by considering the relationships between the boxes or issues. Figure A31. An example conceptual model diagram of the issues in management of a protected areas (PAs) system. PA Extent PA Location PA Management Objectives PA Visitor Numbers & Activities Flow & Quality of Water from PAs Populations of Key Species in PAs Extent & Quality of Vegetation Types in PAs Harvesting of Goods from PAs - Legal & Illegal Illegal Human Settlement in PAs PA Management Capacity: - budgets - plans - staff - equipment 182 BIODIVERSITY INDICATORS & THE 2010 BIODIVERSITY TARGET
184 A conceptual diagram can be confused with analytical and reporting frameworks such as Pressure-State-Response (PSR). The difference between them is essentially one of scale, as there is some overlap in their use. Analytical frameworks such as PSR are a very broad guide to help organise key questions and analysis of a wide subject, such as the state of the environment. A conceptual model diagram as described in this guidance is a more detailed representation of the specific issues resulting from addressing a key question. A very general key question may be first explored with a general conceptual model of the subject of the question to give an overview, and then more detailed models of the individual issues. Questions to ask during this step: Which are the most important or over-arching key questions that can be examined with the aid of a conceptual model? What level of detail is required for the conceptual model? Who should be involved in the definition of the conceptual model? Identify possible indicators Both new and existing indicators can help to answer a key question. Their feasibility and sustainability need to be assessed. Identifying indicators that respond to specific key questions and user needs is most successful with a combination of creative thinking and scientific rigour. Creative thinking may be a surprising skill in this context, but the indicators with the greatest impact are often produced by using and presenting data in novel ways, including combining different kinds of data in ways that may not seem immediately obvious. Scientific rigour is necessary to identify indicators that are conceptually valid and defensible for their purpose. Appropriate indicators also need to be responsive to change in the issue of interest and easily understandable to the user. This step will probably be carried out in combination with the step gather and review data, as the data searches will be guided by needs for possible indicators, whilst actual data availability and suitability will limit the number of feasible indicators. A conceptual model diagram helps to guide the selection of suitable indicators and data sets. It is important to consider indicator presentation One consideration in the identification and creation of possible indicators is how they will be presented to the users. Most biodiversity indicators can be classified into two fundamental types: either map-based and spatial indicators or graph and index-based indicators. Map-based indicators often have a considerable initial appeal to end-users. However, because much GIS work is relatively new, map-based data sets often do not exist as time series, but rather as single data sets that cannot demonstrate change over time. Nonetheless, reliable snapshot maps can be useful as baselines against which to monitor future change. An important aspect of indicator development and use it to think of this work in terms of a story or narrative that you want to tell to the user about the subject. The previous steps in the process will have started to outline the scope of the story that will seek to answer the key question(s). The selection and creation of indicators should consider how they can detail and communicate the story. It is also important to remember that one indicator will never tell you all you want to know, as it is just indicating another, often more complex, issue. Although a country needs to select indicators firstly to meets its own needs, there can be advantages to choosing indicators that are also used for reporting on global targets or which are used by neighbouring countries. On a practical level, using tried and tested methods potentially reduces the time spent on indicator development. On a broader level, contributing national level data or indicators to regional or global scale initiatives benefits both parties. The regional or global initiative is strengthened by the addition of national scale data and the results of the national level indicator initiative can be put into a broader context. A strong example of a regional scale indicator process is the Streamlining European 2010 Biodiversity Indicators (SEBI2010) project, which has developed a set of 26 proposed indicators to monitor and report on progress to achieve the European target to halt biodiversity loss by OUTPUTS, EXPERIENCES AND LESSONS LEARNT FROM THE 2010 BIODIVERSITY INDICATORS PARTNERSHIP 183
185 The selection of the most suitable indicator or indicators may be the responsibility of a single institution, or it might be decided by a committee with representatives from multiple organisations or research groups, such as a steering or advisory committee. Each stakeholder may have a different perspective and there may be many different suggestions of how to approach the problem and how best to answer the key question. Input and critique of this kind is always valuable, but ultimately an indicator or suite of indicators must be decided upon and an approach agreed before the project can move forwards to the next stage. It is worth bearing in mind throughout this development step that no solution or approach is perfect and there will probably always be some criticisms of it. It is important for a single institution, group or individual to have an overview of the indicator development process or project as a whole and to be able to make a final decision about which indicator or approach will be selected. Questions to ask during this step: Are there existing indicators that can help to answer the key question(s)? How well does each of the potential indicators help to answer the key question(s)? Is the relationship between the measure used as an indicator and the indicator s purpose scientifically supported and easy for the user to understand? Are potential reasons for change in the value of the indicator well understood? How easily will it be understood by the intended users? Is there suitable data for each of the possible indicators? Can existing data be transformed into appropriate indicators? What are the resources available now and in the future for producing the possible indicators? Who will decide which indicators will be calculated? Quotes from indicator developers: Indicators should provide telling insights into the natural world. They must be policy-relevant but also realistic in terms of data availability. Ed Mackey, Scottish Natural Heritage (SNH) There will always be critics, but if they can t suggest a better way of doing it that is actually practically possible, don t take them too seriously Jessica Grobler, SANBI The idea of a headline suite of indicators, easily understood and communicated to all, supported by a lower tier to aid interpretation and provide more detail, has proved to be a robust model and the most effective solution for communicating such a difficult subject to such a wide audience. James Williams, JNCC, UK Gather and review data Some relevant data are usually available, but need to be reviewed for their suitability Since the production of indicators is dependent on data this step is likely to be conducted with the step identify possible indicators. Data searches will be guided by the key questions and possible indicators. Each potentially useful dataset will need to be reviewed to determine their suitability. For example, if an indicator is required to indicate change, the data should be collected with a sufficient frequency and using a method appropriate to give the necessary sensitivity to change. The review process could also include standardising the data to common units and scales, and ensuring that the methods used to collect it are comparable. Such a review should ideally be carried out periodically to maintain the quality and consistency of the data. Consistency is essential, not only between datasets, but between years in the same dataset, so that valid comparisons can be made between different points in time. Relevant data for biodiversity indicators can be found in many different forms, including spatially mapped data (often in the form of digital geographic information systems (GIS)), downloadable databases, statistical compendia, survey results or embedded within online documents or books. Data in different formats may need to be combined before they are analysed, and if data are from a range of sources this may be both challenging and time consuming. Designing a common format or series of databases to store the data at the start of the project can help to solve this problem, so that data can be added to it as it is collected. If data are gathered from multiple sources, a rigorous referencing system is essential to be able to keep track of data sources and be able to refer back to the original source data if needed. If multiple institutions are collecting data, this process needs to be standardised across all of the institutions. 184 BIODIVERSITY INDICATORS & THE 2010 BIODIVERSITY TARGET
186 Look for data in other sectors Lack of suitable data is widely identified as a major constraint to the production of biodiversity indicators. Whilst this is undoubtedly the case, it is worth considering that many aspects of biodiversity conservation and sustainable use overlap with other sectors that depend on or affect the natural environment, such as farming, forestry, fishing, outdoor recreation, tourism and infrastructure development. Such sectors are likely to have policy-making and management procedures that produce information that either directly impacts biodiversity, or can help to answer aspects of key questions. For example, fish catch statistics from Lake Victoria in Uganda could be an indicator for the quality of the water in the lake, for how dependent people are on fisheries for their livelihoods, for whether the lake s resources are being used sustainably, or for how the introduced Nile perch (Lates niloticus) may be affecting the ecosystem. Such indicators not only have the advantage of using already existing information, they can help to develop cross-sectoral interactions and awareness of issues related to biodiversity. It may also be possible to make use of existing expertise and experience in the field to generate information for building indicators. This is especially true where systematic field data are lacking but researchers and managers have large amounts of accumulated experience of the ecosystems and species of interest. For example, indicator developers within the government of Ukraine asked a body of experts to estimate population levels of species in the agricultural landscape relative to a fixed baseline, and were able to combine the resulting data into a single species trend index. While it is important to track the uncertainty in these kinds of data, such soft or qualitative approaches have the additional advantage of preserving knowledge that is often unrecorded in any formal sense and which may disappear as individuals change jobs. Questions to ask during this step: Collaborations and agreements to support indicator development Part of the key to successful indicator collaborations is managing the expectations of all those involved, such as how and when they can input into the indicator and what the outputs will be. If the collaboration involves the exchange or use of data it is essential that all partners are clear and agree on how, where and why the data will be used. This can be agreed upon informally in meetings. However, in the experience of UNEP-WCMC and many national indicator partners, written agreements in the form of terms of reference, data sharing agreements, letters of agreement or even s are very useful. Such documentation states the expectations of the partners and is a reference point if there are any questions later. Data sharing agreements can also contain clauses to limit how the data will be used, how it should be acknowledged and whether any outputs need to be reviewed by other parties. The larger the number of partners involved in indicator development the greater the need for such formalised agreements and governance structures. Partners may have defined roles or form groups such as a user group or a client group. How does the available data relate to the key questions and possible indicators? Is the data for an appropriate time period and geographical area for the users needs? Are the data accessible and likely to continue to be produced in the future? Are the data collected in a consistent and comparable manner over time? If an indicator is required to detect change, are the data collected with sufficient frequency, or is the data collection method appropriate to give the desired sensitivity to change? Are the necessary agreements in place to allow the data to be collected and used? Quotes from indicator developers: One of the biggest challenges to date has been securing the data needed in formats that facilitate the development of the indicator or index. In involves developing close relationships with multiple researchers and organisations and continual communication to develop a trusting relationship Mike Gill, CBMP Focus on making sure that your indicators can be repeated over and over again to build a time series Jessica Grobler, SANBI OUTPUTS, EXPERIENCES AND LESSONS LEARNT FROM THE 2010 BIODIVERSITY INDICATORS PARTNERSHIP 185
187 Calculate indicators Converting data into indicators is an iterative process of exploring different methods. The methods used should be documented. Indicator calculation is an iterative process The actual calculation of indicators through the use and presentation of data is an iterative process to explore different methods and find the most suitable ones. Since this an iterative and creative process, in many ways this step overlaps with the previous ones to identify possible indicators and review the data, as well as the communication of indicators. The starting point for calculating an indicator is the key question that is being addressed, the definition of the use of the indicator, and the conceptual model of the issue. An example key question could be, Are we effectively conserving the wildlife in our protected areas? For this example, the indicator will be used in annual reports by the national wildlife agency to the Ministers for environment and tourism. The data available are annual surveys of large mammals for most protected areas for most years in the period 1963 to A key part of indicator calculation is to understand the data, such as their strengths, their limitations, and where they have come from. In this example, the data is not for all wildlife but just for large mammals and this could be accepted as sufficient for the desired purpose. The data collection methods should be examined to see if they are total counts or samples, and what are the confidence limits on the results. Another question could be if there are sufficient counts of all species for all of them to be included in the indicator(s)? Once the strengths and limitations of the data have been assessed then ways of calculating the indicator(s) can be tried. A simple method may be to produce a bar chart of the total number of animals counted per year. It may well be more appropriate to also present bar charts for individual species over time, and for individual protected areas. This may help to identify different trends that are lost in the overall aggregation of data. Alternatively, the combined population counts could be converted into a moving average figure of say five-yearly periods if the survey methods are appropriate for this, to help identify any changes. The indicator calculation could use a method to produce an index value, such as the Living Planet Index method. Other ways that the data could be reworked to help answer the key question might be to convert animal numbers to biomass, or to subdivide the data into herbivores and predators. Different indicator calculation methods are likely to vary in their validity as a scientifically-based indicator of the issue of concern, as well as the statistical validity of the use of the data. This is one reason why indicator development is best done as an iterative process, to identify the most appropriate method. The initial calculation of an indicator may indicate some significant changes in the issue of interest, such as population declines, but the indicator by itself doesn t explain why this situation is observed. With the aid of the conceptual model, and perhaps in consultation with the data providers, further questions and hypotheses could be explored to interpret the changes. Other data sets and indicators could complement this examination of the issue, such as declines of large mammals in relation to hunting pressure, habitat change, annual rainfall, or food availability. The methods used should be documented The calculation of an indicator must be accompanied by documentation of the methods used and data sources. This ensures that the calculation is transparent and open to scrutiny and can be repeated in the future for consistent production of the indicator. Potentially suitable data may often require some form of editing or transformation to make it suitable for the selected indicator calculation method. For example, data points from various sources may need reworking into certain time periods, or formatting for analysis using a GIS. Whatever methods are used it is of fundamental importance that they are scientifically defensible, particularly as many issues related to biodiversity are contentious and may involve disputes between different interest groups. Indicators that are pressed into service in such conflicts are likely to be subjected to close scrutiny. In general, procedures used in indicator generation must be transparent and testable, sources of data verifiable and any potential weaknesses or biases acknowledged. The Indicator Fact Sheet (Table A2) is a very useful template for documenting the methods for calculating an indicator. 186 BIODIVERSITY INDICATORS & THE 2010 BIODIVERSITY TARGET
188 Questions to ask during this step: Are the methods of data collection and analysis scientifically valid and defensible (considering the conceptual model)? Have all the steps for calculating the indicator been documented so that someone without prior experience of the indicator can follow them? Quotes from indicator developers Keep clear, complete records of where you obtained all data and how all the calculations were performed in a way that someone else could understand if they needed to repeat what you have done. Jessica Grobler, SANBI Table A2. Indicator Development Fact Sheet template Subject Notes Response Indicator Name Lead Agency Key question(s) which the indicator helps to answer Users of the indicator Scale of appropriate use Potential for aggregation Possible reasons for upward or downward trends Implications for biodiversity management of change in the indicator Units in which it is expressed Description of source data Calculation procedure Most effective forms of presentation Limits to usefulness and accuracy Updating the indicator Closely related indicators Additional information and comments Institution & person responsible for calculating and communicating the indicator. Meaning of upward or downward trends ( good or bad ) E.g., km 2, number of individuals, % change Origins, dates, units, sample size and extent, custodians Include appropriate methods and constraints for aggregation Graph types, maps, narratives, etc. - give examples where possible E.g., slow change in response to pressures, poor quality data, limited scope for updating How often? What is the process? OUTPUTS, EXPERIENCES AND LESSONS LEARNT FROM THE 2010 BIODIVERSITY INDICATORS PARTNERSHIP 187
189 Communicate and interpret indicators Indicators are communication tools and need investment in their presentation and explanation In some ways indicators can be seen primarily as a communication tool to help people understand complex issues. They therefore need to be presented and interpreted appropriately for their intended audience. Several steps in the Biodiversity Indicator Development Framework can help to achieve this. For example, one of the benefits of defining a key question is that it naturally encourages the selection and communication of the indicators in a form that aids their interpretation. Usually some text accompanies the presentation of an indicator, whether it is a graph or a map, and this explanation is easier and more targeted when it is in response to a key question. The explanation may be part of the legend below a figure or within the text surrounding it. Whatever the explanation, it should include the purpose of the indicator and how to interpret any trends. Use indicators to communicate stories Overall, it is recommended that the communication of indicators be designed in the form of a story or narrative about the subject, in response to the key question(s). The narrative surrounding an indicator is essential, as indicators by themselves provide only a partial understanding (indication) of an issue. They always need some analysis and interpretation of why they are changing and how those changes relate to the system or issue as a whole. Additional information allows the reader to put the indicator in context and see how it relates to other issues and areas. Information to support and explain the indicator should therefore be collected as the indicator is developed. Creative thinking is needed in developing methods for presenting data to non-specialists or those outside the immediate subject field of the indicator. Scientists and technicians used to dealing with large amounts of complex data may find it hard to understand the problems that non-specialists have in dealing with and understanding such data. For example, although complex graphs and densely packed tables with figures to four decimal places can be appropriate for a scientific journal, for non-scientists this may be incomprehensible and even alienating. Simplify indicator messages It is often necessary to simplify information in order to convey useful messages to a wide audience. However, the art in communicating indicators is to simplify without losing scientific credibility. This requires a thorough understanding of the concepts being dealt with and knowledge of the boundaries and limitations of the data and how they can be interpreted. The skills needed for indicator development are not solely in technical areas but also in communication and writing. However, under some circumstances it may be beneficial to enlist external help or expertise in how best to present the indicator. An indicator may be designed for only one audience or user, so the way the results are portrayed and explained can be very much tailored to their information needs and background. It may also be that the results will be communicated to many different audiences, for example policy makers, scientists, businesses and the news media. This presents a challenge for those who communicate the indicator, as they have to choose between producing a single report which will provide general information for all readers, or multiple products tailored to different audiences. Quotes from indicator developers I have learnt that developing key messages from your indicators or indices is crucial and that you need to consult widely with the data providers to ensure that you get the messaging right and that it s not in conflict with individual datasets. Mike Gill, CBMP The success of an indicator initiative can be determined by its communication strategy. We have paid special attention in design of the indicators fact sheets and the communication tools to reach the public. Cesar Rodriguez-Ortega. General Direction for Environmental Information and Statistics, Ministry of the Environment and Natural Resources of Mexico. Examples of good and poor communication of indicators can be found in many reports about biodiversity and the environment, and it is worth studying this aspect of different reports. Participants in 2010 BIP regional biodiversity indicator capacity building workshops have identified the following: 188 BIODIVERSITY INDICATORS & THE 2010 BIODIVERSITY TARGET
190 Ten lessons learnt from communicating and presenting indicators: 1. Indicators should target a particular audience and the way the indicator is presented depends on this audience. For example a complex scientifically presented indicator may not be suitable for a lay or policy maker audience. 2. The level of information in the indicator must be appropriate to the question you want to answer. This level may be global, national or local, depending on how the indicator is going to be used. 3. Simplifying the information within the indicator is key to conveying a clear message. 4. An indicator does not necessarily have to show continuous change through time. Maps and other spatial data can be a very useful way to communicate a message Maps can present multiple snapshots over time, for example to show priority areas 5. Combining or including too many types of information within a single indicator makes it hard to interpret. If there are a number of different types of data, then a number of figures can then be used together to convey the message. 6. Categories and symbols used within the indicator must be clear and well defi ned, either as part of the fi gure or in the fi gure legend. 7. Use of colour is very helpful to being able to convey the messages clearly. Contrasting colours should be used and combinations of red/green should be avoided because some people have colour-blindness. Graded colours can be very effective in showing trends on maps or differences between areas, but they should be clearly explained and easy to interpret. 8. Comparisons between timepoints or conditions must be clear. 9. The presentation of an indicator should clearly state the purpose of the indicator and how to interpret on the fi gure and in the accompanying text. 10. Often a single indicator is not enough to tell a full story. Additional information is often needed and should be chosen carefully with both the key messages and the primary audience in mind. Questions to ask during this step: Target audience Who is the target audience? Is there more than one target audience? Why are they being targeted? How familiar with the subject is the audience? Strengthening how the messages are communicated What other information is available for the indicator subject? What medium will be used to communicate from indicator? Will there be a printed report, a document on a website, a static or interactive web-page, or a short summary within a larger chapter or report? Quotes from indicator developers The target audience [for the indicators we produce] is mainly an informed, interested public. Although accessible to the general public, the focus to-date has been on those within and outside government with a professional / technical / research interest in biodiversity. Ed Mackey, Scottish Natural Heritage (SNH) Keep it simple - try not to have too many indicators, or the audience will be confused by conflicting messages James Williams, JNCC OUTPUTS, EXPERIENCES AND LESSONS LEARNT FROM THE 2010 BIODIVERSITY INDICATORS PARTNERSHIP 189
191 Test and refine the indicators with stakeholders Check that the indicators are understood by the intended users and are useful In the experience of UNEP-WCMC and its partners, a key step in the production of successful biodiversity indicators is to test and refine the indicators with the stakeholders who will use them. For indicators which involve the development of new methods or new combinations of datasets this testing and refining is a central part of indicator development. The presentation of draft or preliminary indicators is useful for both indicator developers and stakeholders. For stakeholders it allows them to see how the indicator is progressing, whether it answers their questions and how it might be used in decision making. Those producing and presenting the indicators should be ready to make changes in response to this feedback. This consultation should therefore be regarded as an ongoing, iterative process. Stakeholder expectations may need to be balanced If the development of the indicator involves a number of stakeholders, each may have differing expectations of the degree to which they expected to be involved in ongoing review of the indicator. For example, during the development of wetland biodiversity indicators in Kenya, four categories of stakeholder had distinct expectations of their involvement. Local wetland communities and resource users were mainly interested in just the resulting indicators and interpretation of the issues, to empower them in decision making and resource use. Policy makers and regulators were also primarily interested in the end results of the process as it provided them with background information on the state of the resource. In contrast, government wetland management and research institutions, who were actively involved in the indicator development process, used it to build their own capacity and understanding. Non-governmental organizations were also often interested in the process as much as in the end-product, seeing it as a possible way of enhancing the participation of the wider community in decision making. The opinions or needs of stakeholder organisations may differ and there are practical limits to the extent to which indicator developers can make changes to accommodate all their needs. It is important for the organisation or group leading the development of the indicator to manage these expectations, and to coordinate the review of the indicator in such a way so that stakeholders provide appropriate input and review it in constructive and positive way. Questions to ask during this step: Does the indicator answer the users key questions(s)? Is the indicator fit for purpose? Is the indicator understood in the intended manner by the users? What improvements could be made to the indicator and its presentation? Quotes from indicator developers One of the biggest achievements of the SEBI2010 indicator initiative] is the fact that the work is acknowledged by high level decision makers and political levels Frederik Schutyser, European Environment Agency (EEA) 190 BIODIVERSITY INDICATORS & THE 2010 BIODIVERSITY TARGET
192 Develop monitoring and reporting systems Monitoring provides consistent data over time and a reporting system enables regular production of the indicator(s) A lack of suitable data, especially data with comparable time series, is often given as a reason preventing the production of biodiversity indicators. If valuable biodiversity indicators are identified and chosen for use over time then an investment is required in the monitoring systems to produce trustworthy and accessible data. The ongoing production and reporting of biodiversity indicators also requires establishing the institutional and technical capacity for this work. This capacity may not exist within a single agency, and may involve both NGOs and government agencies working in partnerships to generate indicators. The need for capacity may not solely be in scientific analysis but also in such areas as communication and writing skills. Therefore, teams with diverse backgrounds and training may be most effective in generating and communicating indicators. Indicator factsheets can aid the inclusion of consistent data Working in partnerships and different organizational configurations makes even more important the need to document carefully the work that is done, and especially the data that are collated. Careful management of data and their associated metadata is a vital part of this process. National Indicator developers have found that producing an indicator fact sheet (Table A2) is a powerful way to guide and support all stages of indicator development and its ongoing production. The consistent production and reporting of an indicator over time requires one institution to have this responsibility, although this may not be the same institution that produces and uses the indicator. One way to promote the sustainable production of an indicator is for it to be recognised and adopted by a national statistical agency. This endorsement and demand for its regular calculation provides a strong case for the necessary long-term investment of resources. This investment must include the maintenance of a monitoring system to produce reliable data over time. Furthermore, the more an indicator meets a real decision-making need and it is effectively communicated then the greater the likelihood that resources will be found for its continued production. Questions to ask during this step: Is there sufficient institutional technical capacity and resources to produce the indicator now and in the future? Is there a clear institutional responsibility for the continued production and reporting of the indicator? Do data collection and monitoring systems or agreements need to be strengthened? OUTPUTS, EXPERIENCES AND LESSONS LEARNT FROM THE 2010 BIODIVERSITY INDICATORS PARTNERSHIP 191
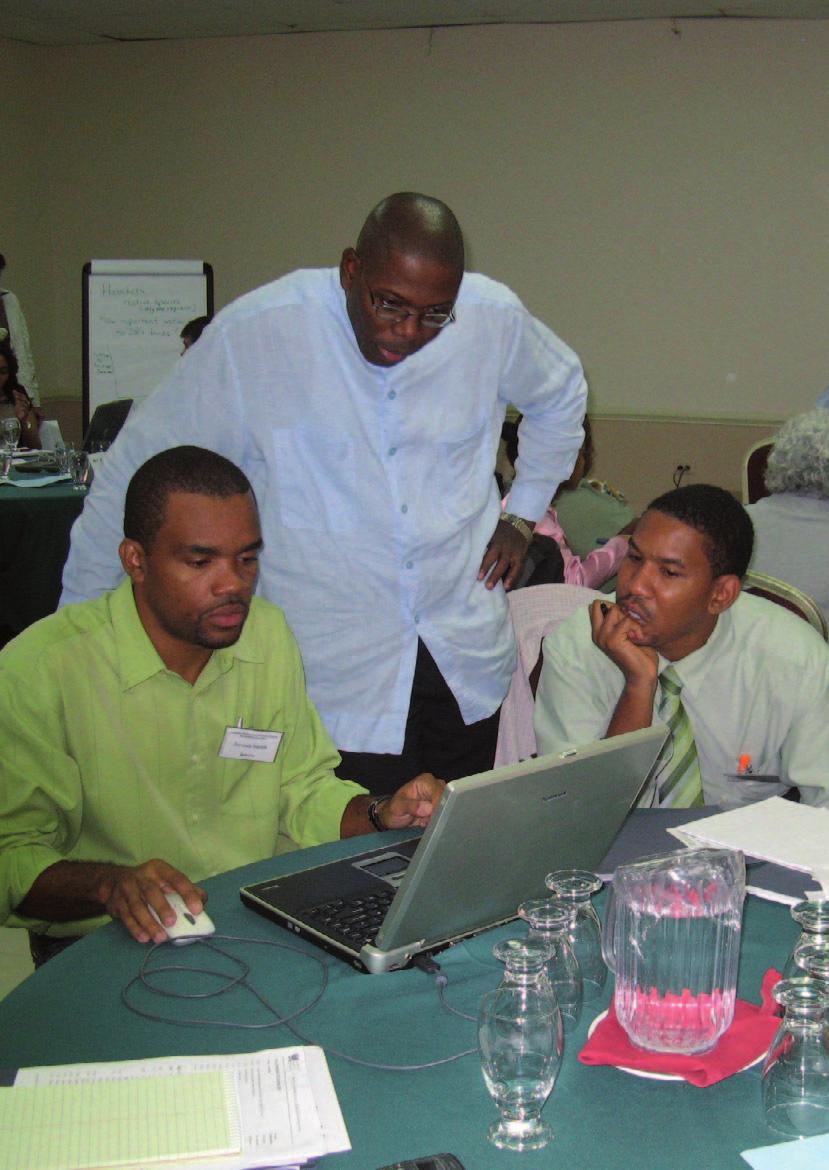
193
194 ANNEX 4. PARTICIPATION AT MAJOR INTERNATIONAL MEETINGS Support to MEA meetings The 2010 BIP is working to communicate links between the partnership s work and all potential users, including highlighting the utility of components of the CBD indicator suite for other multilateral environmental agreements. The 2010 BIP has presented results and hosted side events at major international meetings of the following MEAs: the Convention on Biological Diversity (CBD), the United Nations Convention to Combat Desertification (UNCCD), the International Treaty on Plant Genetic Resources for Food and Agriculture (ITPGRFA), the Convention on Migratory Species (CMS) and the Ramsar Convention on Wetlands. CBD COP 9: The 2010 Biodiversity Indicators Partnership The 2010 Biodiversity Indicators Partnership held a side event at the ninth meeting of the Conference of the Parties to the Convention on Biological Diversity (CBD COP 9) on Friday, 23 May Chaired by SBSTTA s Spencer Thomas of Grenada, with presentations from Linda Collette of FAO, Sarah Simons of the Global Invasive Species Programme (GISP) and Gordon Shepherd of WWF, it was well attended and provoked a lively discussion. In summary it was clear that the suite of indicators will vary in their readiness to show trends by The delivery of outputs and products from the 2010 BIP needs to take into account the timetable for SBSTTA-14 and the GBO-3 process, but the Partnership must also look beyond 2010 to inform the process of any new target setting. Ensuring the best possible communication efforts from the Partnership will be critical to its achievements. CMS COP 9: Biodiversity Indicators - their applicability to the CMS and its Parties The 2010 BIP Secretariat held a side event at the ninth meeting of the Conference of the Parties to the Convention of Migratory Species (CMS COP 9) in Rome, Italy on 3rd December The meeting, entitled Measuring Progress: The 2010 Biodiversity Indicators Partnership, the 2010 Target and their applicability to CMS and its Parties, was attended by several of the 2010 BIP Partners and other interested parties. Dr Nick Davidson, the Deputy Secretary General of the Ramsar Convention on Wetlands, kindly agreed to chair the event. The meeting included presentations about aspects of indicator development relevant to CMS. Dr Rob Clay, of Bird- Life International, discussed the successful application of the IUCN Red List Index in classifying migratory species in terms of extinction risk. Julia Latham, of the Zoological Society of London, discussed the applicability of filtering the Living Planet Index for migratory species. Both presentations detailed how the indicators can be applied to the CMS and its daughter agreements. Discussion was not solely limited to indicator applicability for migratory species. Dr Damon Stanwell-Smith, of UNEP-WCMC and the Project Coordinator of the 2010 BIP, outlined the progress of the Partnership and its planned outputs, including contribution to the third Global Biodiversity Outlook (GBO-3) report. Dr James Williams, of the UK s Joint Nature Conservation Committee (JNCC), discussed the UK s experience in applying the CBD biodiversity indicators. Liz Mclellan, of WWF International, highlighted the requirement of social indicators to be discussed in context with biodiversity indicators. Third Governing Body of the ITPGRFA: Biodiversity Indicators for Policy Makers: The 2010 Biodiversity Indicators Partnership and its Relevance to Governments The 2010 BIP Secretariat has an ongoing programme of awareness raising and establishing links between biodiversity initiatives at global, regional and national levels. Activities include sharing the Partnership s activities with those involved with other multilateral environmental agreements such as the Convention on Migratory Species (CMS) and the Ramsar Convention on Wetlands. We were therefore delighted to accept an invitation from the International Treaty on Plant Genetic Resources for Food and Agriculture (ITPGRFA) to host a side event at its 3rd Session of the Governing Body in Tunis, Tunisia. The 2010 BIP side event, entitled Biodiversity Indicators for Policy Makers: The 2010 Biodiversity Indicators Partnership and its Relevance to Governments was held at 13:00, 4th June It provided the opportunity to promote the work of the 2010 BIP, with particular focus on its relevance to the ITPGRFA. OUTPUTS, EXPERIENCES AND LESSONS LEARNT FROM THE 2010 BIODIVERSITY INDICATORS PARTNERSHIP 193
195 Mr Álvaro Toledo Chávarri, from the Secretariat of the Commission on Genetic Resources for Food and Agriculture, kindly agreed to chair the event; with opening remarks about the importance of biodiversity indicators to multilateral environmental agreements. Anna Chenery, the Communications focal point for the 2010 BIP, then gave an introduction to the Partnership, its aims and objectives, and its work to enhance the use of biodiversity indicators at national and regional levels. The side event included presentations on 2010 BIP indicators specifically related to the ITPGRFA. Elcio Guimarâes, of FAO, gave an update of the Ex-situ crop collections indicator. Susanne Heitmüller, of the CBD Secretariat, discussed the current status of indicators of Access and Benefit Sharing within the framework of the CBD. CBD SBSTTA 14: National Biodiversity Indicators - African Examples and Needs The side event hosted by the 2010 BIP took place on 11 May. The event was run in collaboration with a number of partners and provided an opportunity to present work from the United Nations Development Account project Biodiversity Indicators Capacity Strengthening in Africa, lead by the Global-National Linkages component of the 2010 BIP. Project partners from Botswana, Zimbabwe, Uganda, Kenya, Ethiopia and Burundi presented their experiences and Alfred Oteng Yeboah, CBD Focal Point Ghana, kindly chaired the event. The event highlighted that significant progress can be made in producing national biodiversity indicators with existing data sets, but the lack of suitable or accessible data is a major problem. Whilst the project partners found that even simple indicators, such as forest coverage and trends in key wildlife species, to be of major value, there is often little awareness of biodiversity indicators in scientific and policy arenas. The event also discussed the value of networking and collaboration in producing indicators. CBD SBSTTA 14: Lessons Learnt and Recommendations for post 2010 The second 2010 BIP side event took place on 12 May, to highlight global indicator development. The event was co-hosted by the 2010 BIP and CBD Secretariat; and once again kindly chaired by Alfred Oteng Yeboah. Five short presentations were made, together with discussion. The side event provided an opportunity to share the results of the Partnership, and discuss the future of the indicators post Attention was drawn to the importance of strengthening the linkages between the 2010 BIP and other MEAs, such as the Ramsar Convention. Future methods of linking indicators to tell more coherent story about the state of biodiversity generated interest amongst participants with consensus on the need for alternative ways to communicate biodiversity messages to policy makers. CBD WGRI 3: Lessons Learnt and Recommendations for post 2010 The WGRI side event took place on the 25th May and although similar in title to the SBSTTA event supported discussions under WGRI agenda item 5.1, Revising and updating of the Strategic Plan beyond The event was kindly chaired by Leon Bennun from BirdLife International and consisted of four short presentations and a lively discussion. As well as highlighting the work of the Partnership the side event provided a platform to discuss the future of the indicator suite post The latter generated much discussion on the current disconnect between the use of the CBD indicators at the global and national levels and how this can be avoided. There was also interest in how the existing indicators will fit within the future framework of CBD targets and how the experience of the 2010 BIP can feed into an IPBES process if implemented. 194 BIODIVERSITY INDICATORS & THE 2010 BIODIVERSITY TARGET
196 Appearances at other International Meetings IUCN World Conservation Congress The IUCN World Conservation Congress (WCC), the world s largest conservation event, took place from the 5-14 October at the Centre Convencions Internacional de Barcelona (CCIB) in Barcelona, Spain. The 2010 BIP was well in attendance at the WCC with 35 partners represented. More than 800 events, ranging from alliance workshops to knowledge cafes, took place at the WCC Forum: the open section of the Congress aimed at encouraging knowledge sharing and the formation of new alliances and partnerships. Over 140 of these events were organised by 2010 BIP Partners, with 13 relating specifically to the biodiversity indicators. Twelve of the Partners hosted exhibition booths throughout the Forum. The 2010 BIP exhibition booth hosted by the Secretariat generated welcome interest from visitors to the Congress and provided an ideal location for 2010 BIP Partners to meet. Major events for the Partnership included the launch of the 2008 IUCN Red List of Threatened Species, the launch of the redeveloped UNEP/IUCN World Database on Protected Areas, and an informal 2010 BIP social event. The latter enabled both Partners and interested parties to meet in a relaxed atmosphere to converse and discover more about the 2010 BIP. International Expert Workshop on the 2010 Biodiversity Indicators and Post-2010 Indicator Development In October 2010, CBD COP 10 will review progress in meeting the 2010 Target and agree on a new set of targets and indicators. To initiate the process of making recommendations for the post-2010 indicators, the CBD Secretariat convened a meeting from 6-8 July 2009, facilitated by UNEP WCMC. It was hosted by the UK Government s Department for Environment, Food and Rural Affairs (Defra) in Reading, UK and brought together 70 experts from biodiversity-related conventions, UN agencies, academic and research institutions, intergovernmental and nongovernmental organizations. Existing targets and indicators were reviewed and the following recommendations for post-2010 were considered most important: a) Simplify framework into four focal areas : Threats to Biodiversity, State of Biodiversity, Ecosystem services, Policy Responses; and produce a new framework to cater for national/regional needs. b) Make clearer links to policy actions with additional measures of biodiversity threats, status, extent and services. c) Improve national capacity to strengthen countries ability to develop, monitor and communicate indicators. d) Maintain a flexible and inclusive partnership for post-2010 indicator development, including resourcing of increased collaboration in quality control, implementation and communication. e) Create a strong communication strategy for the post-2010 targets and indicators to inform policy. f) Clearly link targets, sub-targets and indicators using storylines to produce compelling, policy relevant messages. Financial support was provided by the United Nations Environment Programme (UNEP), the European Commission (EC) and the UK Joint Nature Conservation Committee (JNCC). 6th Trondheim Conference on Biodiversity Since 1993, the Trondheim Conferences have provided a platform for policy makers, managers and scientists to come together to consider the key issues being discussed under the Convention on Biological Diversity (CBD). The Conferences, a collaboration between the Secretariat of the CBD, the United Nations Environment Program (UNEP) and the Government of Norway, are held every 3-4 years in Trondheim, Norway. The sixth Trondheim Conference on Biodiversity (1-5 February 2010) brought together over 300 participants from 100 countries, and focused on the need for speeding up implementation of the CBD by setting new targets for the future. Participants considered the current status of biodiversity to propose how implementation of the Convention can be improved. The 2010 BIP was repeatedly referred to throughout the conference, including the results from indicator development, and lessons learnt through the global process. The Partnership was highlighted as a good example of both efforts to generate global collaborations, and in supporting the harmonization of biodiversity-related indicator initiatives across multilateral environmental agreements. OUTPUTS, EXPERIENCES AND LESSONS LEARNT FROM THE 2010 BIODIVERSITY INDICATORS PARTNERSHIP 195
197 196 BIODIVERSITY INDICATORS & THE 2010 BIODIVERSITY TARGET
198
中国经销领域的变化 J O H N D I X O N, V I C E P R E S I D E N T, G L O B A L D I S T R I B U T I O N N O V E M B E R
 中国经销领域的变化 J O H N D I X O N, V I C E P R E S I D E N T, G L O B A L D I S T R I B U T I O N N O V E M B E R 2 0 1 8 经销商的角色 Technical Support Financial Terms Operations Supplier Distributor Customer 2 传统的经销网络
Why Care? 因何关注. Thoughts for the two great economic superpowers and those who aspire to such power 有关两个经济超级大国及其追随者的思索
 Why Care? 因何关注 Thoughts for the two great economic superpowers and those who aspire to such power 有关两个经济超级大国及其追随者的思索 Gerry Stokes, Battelle Beijing October 2007 My topic 我的议题 Why should the United States
启德产品中心. The school is going to offer some course for students to cultivate their
 2019 年 1 月 5 日托福口语写作独立题范文 启德产品中心 Speaking Independent Tasks 口语独立题 Task 1 [Question] The school is going to offer some course for students to cultivate their interests and talents in different fields. Which
Introduction To Shipping Intelligence Network (SIN)
") Introduction To Shipping Intelligence Network (SIN) www.clarksons.net Shanghai Maritime University November 2014 www.clarksons.com 1 Clarkson Database for student? 1 Dissertation / Coursework 2 Job Interview
Introduction To Shipping Intelligence Network (SIN) www.clarksons.net Shanghai Maritime University November 2014 www.clarksons.com 1 Clarkson Database for student? 1 Dissertation / Coursework 2 Job Interview
ZHANG Xin. National Center for Climate Change Strategy and International Cooperation
 ZHANG Xin National Center for Climate Change Strategy and International Cooperation 2017.9 1 2 3 4 Important requirement and work on Climate Change in China National Greenhous Gas Inventory and methodology
BSCI Audit Summary Report
 BSCI Audit Summary Report All rights reserved. part of this publication may be reproduced, translated, stored in a retrieval system, or transmitted, in any form or by any, means electronic, mechanical,
SOCIETY OF ENVIRONMENTAL TOXICOLOGY AND CHEMISTRY TRADEMARK GUIDELINES
 SOCIETY OF ENVIRONMENTAL TOXICOLOGY AND CHEMISTRY TRADEMARK GUIDELINES Using SETAC Trademarks: Name, Acronym, Logo, and Slogan The Society of Environmental Toxicology and Chemistry (SETAC) is known for
Production and Education
 Dr. Steffen Kersten Fakultät Erziehungswissenschaften, Institut für Berufspädagogik und Berufliche Didaktiken Production and Education Beijing, September 2018 Influence factors of vocational education
Promoting the Nexus Approach of Climate, Ecosystems and Livelihoods in Africa through China-Africa Cooperation
 May, 2018 Journal of Resources and Ecology Vol. 9 No.3 J. Resour. Ecol. 2018 9(3) 232-236 DOI: 10.5814/j.issn.1674-764x.2018.03.002 www.jorae.cn Promoting the Nexus Approach of Climate, Ecosystems and
Prefabricated Buildings in Europe -
 Groß & Partner Prefabricated Buildings in Europe - Assessment of Ecological Aspects with LCA Green Building & Prefabrication Forum Beijing 2.11.2018: Johannes Kreissig, German Sustainable Building Council
隐私声明. Workday 是武田用来管理招聘和录用流程并跟踪职位申请的人才招聘系统 该系统允许候选人提交特定职位申请, 或允许武田向申请人发布符合个人技能 经验和教育的工作机会
 Takeda s Talent Acquisition System 武田人才招聘系统 Workday is the talent acquisition system used by Takeda to manage the recruitment and hiring process and track job applications. The system allows candidates
华新水泥股份有限公司董事会审计委员会 Audit Committee of the Board of Directors of Huaxin Cement Co., Ltd 年度履职情况报告 2014 Work Report
 华新水泥股份有限公司董事会审计委员会 Audit Committee of the Board of Directors of Huaxin Cement Co., Ltd. 2014 年度履职情况报告 2014 Work Report 根据中国证监会 上海证券交易所上市公司董事会审计委员会运作指引 上市公司治理准则 上海证券交易所股票上市规则 和公司的有关规定, 华新水泥股份有限公司 ( 以下简称
Shanghai. Trainee Data Processing Executive. MMR is a Global Market Research company specialising in Food, Drink and Personal Care research
 150 employees 12 employees 15 employees MMR is a Global Market Research company specialising in Food, Drink and Personal Care research Our clients rely on high quality data to make informed business decisions
Design of demand-oriented vocational education for modern structures of production and service
 Dr. Steffen Kersten Fakultät Erziehungswissenschaften, Institut für Berufspädagogik und Berufliche Didaktiken Design of demand-oriented vocational education for modern structures of production and service
Low-Carbon City Planning Tools. Abigail Watrous, Ph.D. Senior ORISE Fellow, EERE International
 Low-Carbon City Planning Tools Abigail Watrous, Ph.D. Senior ORISE Fellow, EERE International Abigail.Watrous@ee.doe.gov 城市需要生态低碳发展 Cities today... 城市占...cover 2% of the earth s surface 地球表面积的 2%...contain
Past, Present and Future Directions with Open Demand Response Communications
 Past, Present and Future Directions with Open Demand Response Communications Mary Ann Piette Director, Demand Response Research Center Lawrence Berkeley National Laboratory 2018 OpenADR Alliance Member
Smart phone 产业领域机器人应用解决方案
 Smart phone 产业领域机器人应用解决方案 25th, August 2016 Page: 1 Content 1. KUKA 2. Electronics Market/Division 3. Applications 4. Products and Services 5. Future and Innovation 6. References 7. Summary Page: 2 KUKA
The sixth anniversary reviews of The Food Safety Law and some comments of its results in the case of risk monitoring and evaluation
 5 5 Vol. 5 No. 5 2014 5 Journal of Food Safety and Quality May., 2014 罗汉高 *, 陈真亮 (, 311300) 摘要 : 2009, 6,,,,,, 6, 关键词 : ; ; ; The sixth anniversary reviews of The Food Safety Law and some comments of its
Machine Learning and Analytics. Machine Learning. Data Lake Analytics. HDInsight (Hadoop, Spark, Storm, HBase Managed Clusters) Stream Analytics
 Stream Analytics") 微软云上数据平台概括 Data Sources Information Management Big Data Stores Machine Learning and Analytics Intelligence People Data Factory Data Lake Store Machine Learning Cognitive Services Data Catalog SQL Data
微软云上数据平台概括 Data Sources Information Management Big Data Stores Machine Learning and Analytics Intelligence People Data Factory Data Lake Store Machine Learning Cognitive Services Data Catalog SQL Data
Martin Linking professional training. Shanghai, China Date: 26 th and 27 th, November, Your International Facilitator:
 Global Sourcing Management Best Practices The aim of this two-day workshop is to assist sourcing professionals, managers and directors to improve management A skill and value offering for enterprise in
The Current Condition and Development Trend of the Urban Water Supply and Drainage Facilities of China
 The Current Condition and Development Trend of the Urban Water Supply and Drainage Facilities of China 中国城市供水排水设施现状和发展趋势 Zhendong Li President of China Urban Water Association 中国城镇供水排水协会会长李振东 I. The current
植物提取物微生物限量标准及检测技术进展 1,2 1,2* 祖元刚. Advance in Microbiological Limit and Detection Technique of Plant Extracts
 微生物学通报 MAR 20, 2008, 35(3): 426~431 Microbiology tongbao@im.ac.cn 专论与综述 2008 by Institute of Microbiology, CAS 植物提取物微生物限量标准及检测技术进展 1,2 牟璠松 1,2 罗猛 1,2* 祖元刚 1,2 付玉杰 (1. 150040) (2. 150040) 摘要 : 植物提取物的微生物检测是保证植物产品安全性的重要手段,
中国最佳实践讨论会 China Best Practice 零售策略 Retailing Strategy. October, 2013
 中国最佳实践讨论会 China Best Practice 零售策略 Retailing Strategy October, 2013 日程 Agenda 概要 Session Overview 当前零售行业定价策略和促销管理的特点 Recent Developments in Pricing Strategy and Promotion Management 业务挑战 Business Challenges
Shaping Digitalization Industry 4.0
 Shaping Digitalization Industry 4.0 Andreas Glogowsky Head of Key Account Management Siemens Ltd. China June 15 Frankfurt Unrestricted Siemens AG 2018 Siemens Ltd. China New business models in the internet
Decision Support Systems for District Heating Networks and Plants Optimisation 区域供热网络和设备优化决策支持系统. Optit, 2016
 Decision Support Systems for District Heating Networks and Plants Optimisation 区域供热网络和设备优化决策支持系统 Optit, 2016 WHO WE ARE 我们是谁 Op#t srl is a spinoff of the Opera/ons Research team of the University of Bologna
This instruction applies to Chinese suppliers delivering to Vestas companies based in China.
 1 Invoicing Requirements 发票开具要求 This instruction applies to Chinese suppliers delivering to Vestas companies based in China. 本要求适用于中国供应商向中国维斯塔斯开具发票 To ensure prompt and timely settlement of your invoices,
Delivering Remarkable Customer Experiences. Edwin Ong Director, Marketing APAC & Middle East
 Delivering Remarkable Customer Experiences Edwin Ong Director, Marketing APAC & Middle East rev: Mar 2013 It is Now More Important than Ever to Evolve Your Contact Center to Meet the Needs of Today s Customers
A Study of Government e-services Quality and Its Effect on Public Satisfaction
 A Study of Government e-services Quality and Its Effect on Public Satisfaction Tao Zhang Ph. D., Assistant Professor Faculty of International Tourism Macau University of Science and Technology Avenue Wai
仓储优化系列之如何优化仓库空间, 提高仓储利用率?
 仓储优化系列之如何优化仓库空间, 提高仓储利用率? S-Council China Supply Chain Executive Council 供应链价值研究院 24 th Sep, 2014, Shanghai 2014 年 9 月 24 日, 中国上海 1 电话会议安排 课程设置 第一部分 :14:05-14:50 主题演讲 : 优化仓库空间, 提高仓储利用率 Storage Business
国家开放大学 ( 中央广播电视大学 )2017 年秋季学期 " 开放专科 " 期末考试 注意事项
2017 年秋季学期 开放专科 期末考试 注意事项") 试卷代号 :3936 国家开放大学 ( 中央广播电视大学 )2017 年秋季学期 " 开放专科 " 期末考试 商务英语 2 试题 2018 年 1 月 注意事项 一 将你的学号 姓名及分校 ( 工作站 ) 名称填写在答题纸的规定栏内 考试结束后, 把试卷和答题纸放在桌上 试卷和答题纸均不得带出考场 监考人收完考卷和答题纸后才可离开考场 二 仔细读懂题目的说明, 并按题目要求答题 答案一定要写在答题纸的指定位置上,
试卷代号 :3936 国家开放大学 ( 中央广播电视大学 )2017 年秋季学期 " 开放专科 " 期末考试 商务英语 2 试题 2018 年 1 月 注意事项 一 将你的学号 姓名及分校 ( 工作站 ) 名称填写在答题纸的规定栏内 考试结束后, 把试卷和答题纸放在桌上 试卷和答题纸均不得带出考场 监考人收完考卷和答题纸后才可离开考场 二 仔细读懂题目的说明, 并按题目要求答题 答案一定要写在答题纸的指定位置上,
如何将目标消费者转换成购买者 课程内容 尼尔森大学大中华区 2012 课程
 尼尔森大学大中华区 2012 课程 如何将目标消费者转换成购买者 为什么有的品牌知名度高, 市场份额却不尽人意? 如何影响消费者在货架前的决策, 提高我产品的购买率和频次? 在大量媒体 信息和促销活动的炮轰下, 如何获得消费者的关注, 让我的产品脱颖而出? 这一切都使真正地了解购买者变得尤为重要 目标 本课程将使您完整地学习如何真正懂得您的购买者, 如何运用您对购买者的了解来提高经营业绩 通过对整套理论
自动化提高设计质量的最佳实践 The MathWorks, Inc.
 自动化提高设计质量的最佳实践 吴菁 2015 The MathWorks, Inc. 1 嵌入式系统日益增长的复杂性 稳定性控制 紧急制动 电池管理 自动泊车 自适应巡航控制 仪表盘 气囊 智能接线盒 车身控制模块 电动助力转向 16 M 语音识别 信息娱乐系统 DC/DC Converter 推进电机控制 导航 发动机管理 传动控制 电动窗 Vehicle-toInfrastructure 前向摄像头
CCUS in Guangdong Province. Development and Reform Commission of Guangdong Province (GDDRC)
") in Guangdong Province Development and Reform Commission of Guangdong Province (GDDRC) Sept.2013 一 广东省委 省政府高度重视 High Attention from Guang dong Provincial Committee and Government 广东省低碳试点工作实施方案的通知 ( 粤府函
in Guangdong Province Development and Reform Commission of Guangdong Province (GDDRC) Sept.2013 一 广东省委 省政府高度重视 High Attention from Guang dong Provincial Committee and Government 广东省低碳试点工作实施方案的通知 ( 粤府函
inemi STUDY ON BOARD CREEP CORROSION inemi 关于电路板爬行腐蚀的研究 Project chairs: Xiaodong Jiang (Alcatel-Lucent) Mason Hu (Cisco) Simon Lee (Dow Chemical)
 Mason Hu (Cisco) Simon Lee (Dow Chemical)") inemi STUDY ON BOARD CREEP CORROSION inemi 关于电路板爬行腐蚀的研究 Project chairs: Xiaodong Jiang (Alcatel-Lucent) Mason Hu (Cisco) Simon Lee (Dow Chemical) Haley Fu, inemi CEEDI Meeting, Beijing April 24, 2012 Outline
inemi STUDY ON BOARD CREEP CORROSION inemi 关于电路板爬行腐蚀的研究 Project chairs: Xiaodong Jiang (Alcatel-Lucent) Mason Hu (Cisco) Simon Lee (Dow Chemical) Haley Fu, inemi CEEDI Meeting, Beijing April 24, 2012 Outline
AUSTRALINK AUSTRALIA DAIRY DIVISION COMPANY INTRODUCTION
 AUSTRALINK AUSTRALIA DAIRY DIVISION COMPANY INTRODUCTION A MEMBER OF THE AUSTRALIA CHINA BUSINESS COUNCIL COMPANY OVERVIEW 公司简介 Australink Australia and its subsidiary companies have been operating in
Enhancing Nature-Culture Synergies for Sustainable Development
 Prepared for International Congress on: Culture Key to Sustainable Development Enhancing Nature-Culture Synergies for Sustainable Development 加强自然文化融合, 促进可持续发展 Jian Liu, 刘健 Director, UNEP-IEMP, 联合国环境署
Advances and Applications of Single-CellSequencing Technologies 小组成员 : 高帮良 冯圣宇 丁雄飞
 Advances and Applications of Single-CellSequencing Technologies 小组成员 : 高帮良 冯圣宇 丁雄飞 Introduction 同一组织中的细胞往往被认为是具有相同状态的功能单位, 传统的检测手段分析的是细胞群体的总体平均反应 然而通过对单个细胞的 DNA 或 RNA 进行测序, 表明组织系统层面的功能是由异质性细胞构成的 单细胞测序以单个细胞为单位,
依托伙伴关系, 推动长三角空气质量管理 上海 2012 年 6 月 20 日
 依托伙伴关系, 推动长三角空气质量管理 上海 2012 年 6 月 20 日 Outline 大纲 Who is CAI-Asia : 关于 CAI-Asia About the YRD AQM Project: 长三角区域 AQM 项目 2 About the Clean Air Initiative for Asian Cities 关于亚洲城市清洁空气行动 (CAI-Asia) 亚洲城市清洁空气行动
Meeting Agenda. November 1, 2012
 Meeting Agenda November 1, 2012 Agenda 1 China Media and Entertainment Industry Trends 2 2 SMG s Potential Evolution 7 3 Key Projects 10 4 Open Discussion 11 1 1 China Media and Entertainment Industry
International Comparison of Product Certification and Verification Methods for Appliances
 International Comparison of Product Certification and Verification Methods for Appliances Nan Zhou, John Romankiewicz, David Fridley, Nina Zheng China Energy Group Environmental Energy Technologies Division
商业分析的思路和流程 课程内容 尼尔森大学大中华区 2012 课程
 尼尔森大学大中华区 2012 课程 商业分析的思路和流程 如何从数以万计的数据信息中, 寻找它们的价值? 如何有机地结合数据信息和企业的策略, 为企业面临的问题提出解决方案? 对在公司中负责数据分析的年轻营销和销售专业人士来说, 如何理清思路, 找到问题的关键, 不是一件容易的事情 然而, 分析数据的技能是从市场情报中得到投资回报的重要因素, 甚至是公司的核心竞争力所在 目标 本课程旨在通过引入简单却有力的分析方法,
Oracle 的电信行业整体解决方案与策略
 Oracle 的电信行业整体解决方案与策略 许诗敏 Annie Hui Oracle 大中华区电信行业解决方案高级经理 2010 年 2 月 25 日 Oracle 的行业化策略在原有基础上扩展纵向的行业化方案, 提供最完整的端到端行业解决方案 高科技 制造 汽车 消费品 政府 零售 电信 保险 金融 19 of the top 20 Global High-Tech
HOW TO DEVELOP A SUCCESSFUL JOINT-VENTURE IN ASIA. is a business unit of
 HOW TO DEVELOP A SUCCESSFUL JOINT-VENTURE IN ASIA WHAT IS A JOINT-VENTURE SIMPLY PUT, A JOINT VENTURE (JV) IS NOTHING MORE THAN AN ECONOMIC COOPERATION, OR BUSINESS COMBINATION, OF TWO OR MORE PEOPLE,
Water and Economics 水和经济学. Annette Huber-Lee visiting scholar
 Water and Economics 水和经济学 Annette Huber-Lee visiting scholar Overview 概览 Why use an economic approach? 为什么遵循经济的途径? Are water markets the answer? 水市场是有效的方法吗? Role for economic analysis 经济分析的作用 Application
Curriculum Plan for the CEPM Program of Jiangsu University (CEPM 2011 Batch and later)
") Curriculum Plan for the CEPM Program of Jiangsu University (CEPM 2011 Batch and later) Duration of Study The four-year Civil Engineering and Project Management (CEPM) undergraduate program consists of
Curriculum Plan for the CEPM Program of Jiangsu University (CEPM 2011 Batch and later) Duration of Study The four-year Civil Engineering and Project Management (CEPM) undergraduate program consists of
This instruction applies to Chinese suppliers delivering to Vestas companies based in China.
 Invoicing Requirements 发票开具要求 This instruction applies to Chinese suppliers delivering to Vestas companies based in China. 本要求适用于中国供应商向中国维斯塔斯开具发票 To ensure prompt and timely settlement of your invoices,
Air pollution in large cities Bjarne Sivertsen Norwegian Institute for Air Research. Sino-Norwegian cooperation, EXPO 2010
 Air pollution in large cities Bjarne Sivertsen Sino-Norwegian cooperation, EXPO 2010 城市化 Urbanization 导致人口对空气污染的曝露和健康损害上升 causes increased population exposure and health effects Rise of megacities 2015
Sustainable Urban Transport Development in China
 Sustainable Urban Transport Development in China Ministry of Transportation Zeng Jia Contents Background Current Status and Issues Policies and Gaps 1 Background 1 Background The 18th National Congress
中美清洁能源研究中心 中重载卡车联合研究工作计划 卡车利用协作知识研究联盟 (CERC TRUCK)
") U.S.-China Clean Energy Research Center (CERC) Joint Work Plan for Research on Medium and Heavy Duty Trucks under the Truck Research Utilizing Collaborative Knowledge (TRUCK) Consortium (CERC TRUCK) Introduction
U.S.-China Clean Energy Research Center (CERC) Joint Work Plan for Research on Medium and Heavy Duty Trucks under the Truck Research Utilizing Collaborative Knowledge (TRUCK) Consortium (CERC TRUCK) Introduction
在处理生态系统 人类住区 水资源和健康问题的适应规划进程中学到的良好做法和经验教训, 以及使国家和地方适应规划相联系的各种进程和架构方面的良好做法和经验教训 :
 联合国 气候变化框架公约 FCCC/SBSTA/2015/4 Distr.: General 20 November 2015 Chinese Original: English 附属科学技术咨询机构第四十三届会议 2015 年 12 月 1 日至 4 日, 巴黎临时议程项目 3 关于气候变化影响 脆弱性和适应的内罗毕工作方案 在处理生态系统 人类住区 水资源和健康问题的适应规划进程中学到的良好做法和经验教训,
水肥一体化系统在农业生产中的应用. 北京派得伟业科技发展有限公司 Beijing PAIDE Science and Technology Development Co. Ltd. 吴建伟 WU Jianwei
 Application of the integrated system of water and fertilizer in the agricultural production 水肥一体化系统在农业生产中的应用 北京派得伟业科技发展有限公司 Beijing PAIDE Science and Technology Development Co. Ltd. 吴建伟 WU Jianwei 一 单位介绍
Manage and grow a portfolio of clients who need financial services and customized products
 Job Title: Senior Relationship Manager/Relationship Manager Unit / Department: Commercial Banking Execute strategies to meet business targets set by the Bank Manage and grow a portfolio of clients who
Chapter 4 Project Integration Management
 PAGE - 1 - Chapter 4 Project Integration Management PAGE - 2 - Time Management 1. Activity Definition 2. Activity Sequencing 3. Activity Resource Estimating 4. Activity Duration Estimating 5. Schedule
中国最佳实践 全渠道零售. China Best Practice. Omni-Channel Retailing 年 10 月 October, 2013
 中国最佳实践 China Best Practice 全渠道零售 Omni-Channel Retailing 2013 年 10 月 October, 2013 日程 Agenda 概要 Session Overview 全渠道零售方案概览 Omni-Channel Retailing in a glance 业务挑战 Business Challenges 全渠道订单管理 Omni-Channel
HOW TO DEVELOP A SUCCESSFUL JOINT-VENTURE IN CHINA. is a business unit of
 HOW TO DEVELOP A SUCCESSFUL JOINT-VENTURE IN CHINA CHINA: NO LONGER AN EMERGING MARKET China CHINA IS TODAY THE WORLD S LARGEST OR SECOND-LARGEST CONSUMER OF A VARIETY OF PRODUCTS: GLOBAL RANKING #1 GLOBAL
厦门大学博硕士论文摘要库
 本学位论文得到两岸关系和平发展协同创新中心研究资助, 谨致谢意! 摘要 休闲农业是指利用农村设备和空间 生产场地 农产品 经营活动 自然生态 自然环境 农村人文资源等, 经过规划和设计, 发挥农业与农村休闲旅游功能, 增进民众对农村与农业的体验, 提高农民收入, 从而促进农村发展的一种新型产业 休闲农业作为产业的一种形式, 其发展也会符合产业发展的一般规律, 休闲农业又是一种依托农事活动而展开的一切休闲活动集合,
Financing clean energy projects in Malaysia 马来西亚清洁能源项目融资 Market signals, opportunities and challenges 市场信号 机遇与挑战
 Financing clean energy projects in Malaysia 马来西亚清洁能源项目融资 Market signals, opportunities and challenges 市场信号 机遇与挑战 Ernest Navaratnam, CEO of Cenergi SEA October 2018 2018 年 10 月 马来西亚 Cenergi 公司首席执行官 About
Model-Based Design From Rapid Prototyping to Production
 Model-Based Design From Rapid Prototyping to Production 基于模型的设计 从快速原型到产品 Paul Smith Director Consulting Services MathWorks 2014 The MathWorks, Inc. 1 Prototyping to Production 原型到产品 Production Code Generation
CHINA WHERE MINDS MEET. The bank for a changing world
 PROGRAMME CATALOGUE 2017 1 CHI WHERE MINDS MEET The bank for a changing world 2 LEARNING AND DEVELOPMENT FRAMEWORK There are four pillars on which Learning and Development is built on: Business Outcomes
Internet Retailing in Hungary
 Internet Retailing in Hungary Customer Service Hotline:400-666-1917 Page 1 of 9 一 调研说明中商情报网全新发布的 Internet Retailing in Hungary 主要依据国家统计局 国家发改委 商务部 中国海关 国务院发展研究中心 行业协会 工商 税务 海关 国内外相关刊物的基础信息以及行业研究单位等公布和提供的大量资料,
China Customs Higher Education & PICARD Professional Standards
 China Customs Higher Education & PICARD Professional Standards 1908 2008 by Yu Shen May.16th.2008 SCC A regular 4-year college Directly affiliated to GACC In 1908, Customs College was founded in Beijing
Homeshopping in Ireland
 Homeshopping in Ireland Customer Service Hotline:400-666-1917 Page 1 of 9 一 调研说明中商情报网全新发布的 Homeshopping in Ireland 主要依据国家统计局 国家发改委 商务部 中国海关 国务院发展研究中心 行业协会 工商 税务 海关 国内外相关刊物的基础信息以及行业研究单位等公布和提供的大量资料, 结合深入的市场调研资料,
GOC/WB/GEF China: Urban-Scale Building Energy Efficiency and Renewable Energy Project (P130786)
") Public Disclosure Authorized Public Disclosure Authorized Public Disclosure Authorized Public Disclosure Authorized 91434 GOC/WB/GEF China: Urban-Scale Building Energy Efficiency and Renewable Energy Project
Public Disclosure Authorized Public Disclosure Authorized Public Disclosure Authorized Public Disclosure Authorized 91434 GOC/WB/GEF China: Urban-Scale Building Energy Efficiency and Renewable Energy Project
Direct Selling in Morocco
 Direct Selling in Morocco Customer Service Hotline:400-666-1917 Page 1 of 9 一 调研说明中商情报网全新发布的 Direct Selling in Morocco 主要依据国家统计局 国家发改委 商务部 中国海关 国务院发展研究中心 行业协会 工商 税务 海关 国内外相关刊物的基础信息以及行业研究单位等公布和提供的大量资料,
曲斌 Bin QU. Water chemistry and greenhouse gases emissions in the rivers of the Third Pole / Water Tower of Asia. Nanjing
 Water chemistry and greenhouse gases emissions in the rivers of the Third Pole / Water Tower of Asia 曲斌 Bin QU Email: Nanjing 11.03.2017 bin.b.qu@outlook.com 学习工作经历 发展历程 山东师范大学 2006 年 多次青藏高原冰川考察 ( 珠峰 )
土木工程专业本科人才培养计划. Undergraduate Program for Specialty in Civil Engineering
 土木工程与力学学院 土木工程与力学学院下设 5 个系, 即工程力学系 建筑工程系 道路与桥梁工程系 工程管理系和交通工程系 设有四个本科专业 : 土木工程 工程管理 工程力学 交通工程 全院共有教职工 180 余人, : 中国工程院院士 1 人 ( 双聘 ), 中国科学院院士 1 人 ( 双聘 ), 国家级教学名师 1 人, 国家杰出青年基金获得者 1 人, 长江学者特聘教授 2 人, 长江学者讲座教授
CHENIERE ENERGY, INC.
 CHENIERE ENERGY, INC. 美国切尼尔能源公司 US-China Oil and Gas Industry Forum 中美油气工业论坛 November 2017 Forward Looking Statements This presentation contains certain statements that are, or may be deemed to be, forward-looking
Oral Care in the US. Customer Service Hotline: Page 1 of 9
 Oral Care in the US Customer Service Hotline:400-666-1917 Page 1 of 9 一 调研说明中商情报网全新发布的 Oral Care in the US 主要依据国家统计局 国家发改委 商务部 中国海关 国务院发展研究中心 行业协会 工商 税务 海关 国内外相关刊物的基础信息以及行业研究单位等公布和提供的大量资料, 结合深入的市场调研资料,
Concentrates in New Zealand
 Concentrates in New Zealand Customer Service Hotline:400-666-1917 Page 1 of 10 一 调研说明中商情报网全新发布的 Concentrates in New Zealand 主要依据国家统计局 国家发改委 商务部 中国海关 国务院发展研究中心 行业协会 工商 税务 海关 国内外相关刊物的基础信息以及行业研究单位等公布和提供的大量资料,
Post Event Report Of 7th Annual China Social Media & Digital Marketing Forum 2017
 Post Event Report Of 7th Annual China Social Media & Digital Marketing Forum 2017 Post Event Report 7th Annual China Social Media & Digital Marketing Forum 2017 Digital Transformation under the O2O Context
Cyclohexane oxidation: Small organic molecules as catalysts
 Chinese Journal of Catalysis 35 (2014) 279 285 催化学报 2014 年第 35 卷第 3 期 www.chxb.cn available at www.sciencedirect.com journal homepage: www.elsevier.com/locate/chnjc Communication Cyclohexane oxidation:
Health and Beauty Specialist Retailers Romania
 Health and Beauty Specialist Retailers in Romania Customer Service Hotline:400-666-1917 Page 1 of 10 一 调研说明中商情报网全新发布的 Health and Beauty Specialist Retailers in Romania 主要依据国家统计局 国家发改委 商务部 中国海关 国务院发展研究中心
Tourism Flows Outbound in Norway
 Tourism Flows Outbound in Norway Customer Service Hotline:400-666-1917 Page 1 of 9 一 调研说明中商情报网全新发布的 Tourism Flows Outbound in Norway 主要依据国家统计局 国家发改委 商务部 中国海关 国务院发展研究中心 行业协会 工商 税务 海关 国内外相关刊物的基础信息以及行业研究单位等公布和提供的大量资料,
Sanitary Protection in Uruguay
 Sanitary Protection in Uruguay Customer Service Hotline:400-666-1917 Page 1 of 9 一 调研说明中商情报网全新发布的 Sanitary Protection in Uruguay 主要依据国家统计局 国家发改委 商务部 中国海关 国务院发展研究中心 行业协会 工商 税务 海关 国内外相关刊物的基础信息以及行业研究单位等公布和提供的大量资料,
Bath and Shower in Latvia
 Bath and Shower in Latvia Customer Service Hotline:400-666-1917 Page 1 of 9 一 调研说明中商情报网全新发布的 Bath and Shower in Latvia 主要依据国家统计局 国家发改委 商务部 中国海关 国务院发展研究中心 行业协会 工商 税务 海关 国内外相关刊物的基础信息以及行业研究单位等公布和提供的大量资料,
计算机化系统验证 Computerized System Validation. 陈国笋 Brant Chen 上海朗脉 Macroprocess
 计算机化系统验证 Computerized System Validation 陈国笋 Brant Chen 上海朗脉 Macroprocess 1 计算机化系统的分类 Category of Computerized system 2 制药企业的计算机化系统 Computerized System in Pharmaceutical Company 生产 Process/Manufacturing
Supplier Workplace Accountability (SWA) Assessment
 Assessment") Supplier Workplace ccountability (SW) ssessment Facility: IWU XING WEVING MILL CO.,LTD ddress: XUFENG INDUSTRIL RE, SUXI ROD IWU, 322000 China ( 中国 ) Company ID: CMP-086470 Primary Contact: Min Leng Phone
Supplier Workplace ccountability (SW) ssessment Facility: IWU XING WEVING MILL CO.,LTD ddress: XUFENG INDUSTRIL RE, SUXI ROD IWU, 322000 China ( 中国 ) Company ID: CMP-086470 Primary Contact: Min Leng Phone
General Provisions of Investment Invitation for
 General Provisions of Investment Invitation for 2016 Fantastic Art China I. Duration of Investment Invitation September 19 December 31, 2015 II. Principle Investment Invitation is classified into Premier
职责要求 具有学士学位, 至少 10 年, 硕士或博士学位至少 8 年最新制药行业无菌注射剂仿制药物, 包括冻干产品的配方研发, 项目管理, 药品生产,ANDA 文件申报及 QBD 药品开发经验
 If interested, please send your resume to HR@kluspharma.com Director -Formulation Development Direct and manage formulation team to develop generic sterile injectable products including formulation & process
Polishes in Romania. Customer Service Hotline: Page 1 of 10
 Polishes in Romania Customer Service Hotline:400-666-1917 Page 1 of 10 一 调研说明中商情报网全新发布的 Polishes in Romania 主要依据国家统计局 国家发改委 商务部 中国海关 国务院发展研究中心 行业协会 工商 税务 海关 国内外相关刊物的基础信息以及行业研究单位等公布和提供的大量资料, 结合深入的市场调研资料,
Social Re-Audit Report
 Social Re-Audit Report March 2004 BSCI 6-03/04 All rights reserved. No part of this publication may be reproduced, translated, stored in a retrieval system, or transmitted, in any form or by any means,
关联设施 (Associated Facilities)
") English Glossary A Accessibility Accessibility refers to the identification and elimination of obstacles and barriers to provide access to the physical environment, to transportation, to information and
English Glossary A Accessibility Accessibility refers to the identification and elimination of obstacles and barriers to provide access to the physical environment, to transportation, to information and
The Sustainable Development of FMCG Supply Chain Via Pallet Pooling FMCG 供应链通过托盘共享租赁模式的可持续发展优势
 The Sustainable Development of FMCG Supply Chain Via Pallet Pooling FMCG 供应链通过托盘共享租赁模式的可持续发展优势 What Is Pallet Pooling? 什么是托盘共享租赁体系 Service Center 托盘服务中心 Share resources while reducing total supply chain
DFS HONG KONG LIMITED
 Please submit below documents to process 1 Application form Official Use: 2012 DFSMT - 2 English CV 3 English Cover Letter 4 Academic results and Transcripts DFS HONG KONG LIMITED APPLICATION FORM FOR
Medicated Skin Care in Vietnam
 Medicated Skin Care in Vietnam Customer Service Hotline:400-666-1917 Page 1 of 9 一 调研说明中商情报网全新发布的 Medicated Skin Care in Vietnam 主要依据国家统计局 国家发改委 商务部 中国海关 国务院发展研究中心 行业协会 工商 税务 海关 国内外相关刊物的基础信息以及行业研究单位等公布和提供的大量资料,
热能与动力工程专业本科培养方案. Undergraduate Program for Specialty in Thermal Energy and Power Engineering
 热能与动力工程专业本科培养方案 Undergraduate Program for Specialty in Thermal Energy and Power Engineering 一 修业年限及授予学位名称 Ⅰ Length of Schooling and Degree 四年 ; 工学学士 二 培养目标 Ⅱ Educational Objectives 本专业培养基础扎实 知识面宽 能力较强
of Business) 组织行为学及人力资源管理博士学位 张教授凭借她出色的学术成果斩获佩恩杰出研究成就奖 (Paine Award) 以及若干教学奖项
 组织行为学及人力资源管理博士学位 张教授凭借她出色的学术成果斩获佩恩杰出研究成就奖 (Paine Award) 以及若干教学奖项") 张晓萌 马里兰大学帕克分校史密斯商学院博士高层管理教育项目副院长领导力与激励研究中心主任长江商学院组织行为学副教授 教授简介 张晓萌博士现为长江商学院副院长, 主管高层管理教育项目 ; 领导力与激励研究中心主任 ; 管理学系组织行为学副教授 加入长江商学院之前, 张教授曾在位于美国华盛顿特区的美利坚大学 (American University) 科歌德商学院 (Kogod School of Business)
张晓萌 马里兰大学帕克分校史密斯商学院博士高层管理教育项目副院长领导力与激励研究中心主任长江商学院组织行为学副教授 教授简介 张晓萌博士现为长江商学院副院长, 主管高层管理教育项目 ; 领导力与激励研究中心主任 ; 管理学系组织行为学副教授 加入长江商学院之前, 张教授曾在位于美国华盛顿特区的美利坚大学 (American University) 科歌德商学院 (Kogod School of Business)
Oral Care in Canada. Customer Service Hotline: Page 1 of 9
 Oral Care in Canada Customer Service Hotline:400-666-1917 Page 1 of 9 一 调研说明中商情报网全新发布的 Oral Care in Canada 主要依据国家统计局 国家发改委 商务部 中国海关 国务院发展研究中心 行业协会 工商 税务 海关 国内外相关刊物的基础信息以及行业研究单位等公布和提供的大量资料, 结合深入的市场调研资料,
张晓萌博士现为长江商学院副院长, 主管高层管理教育项目 ; 管理学系组织行为学副教授 加入长江商学院之前, 张教授曾在位于美国华盛顿特区的美利坚大学 (American University)
") 张晓萌 马里兰大学帕克分校史密斯商学院博士 高层管理教育项目副院长 长江商学院组织行为学副教授 教授简介 张晓萌博士现为长江商学院副院长, 主管高层管理教育项目 ; 管理学系组织行为学副教授 加入长江商学院之前, 张教授曾在位于美国华盛顿特区的美利坚大学 (American University) 科歌德商学院 (Kogod School of Business) 担任管理学副教授, 并拥有终身教授教职
张晓萌 马里兰大学帕克分校史密斯商学院博士 高层管理教育项目副院长 长江商学院组织行为学副教授 教授简介 张晓萌博士现为长江商学院副院长, 主管高层管理教育项目 ; 管理学系组织行为学副教授 加入长江商学院之前, 张教授曾在位于美国华盛顿特区的美利坚大学 (American University) 科歌德商学院 (Kogod School of Business) 担任管理学副教授, 并拥有终身教授教职
Digestive Remedies in Malaysia
 Digestive Remedies in Malaysia Customer Service Hotline:400-666-1917 Page 1 of 9 一 调研说明中商情报网全新发布的 Digestive Remedies in Malaysia 主要依据国家统计局 国家发改委 商务部 中国海关 国务院发展研究中心 行业协会 工商 税务 海关 国内外相关刊物的基础信息以及行业研究单位等公布和提供的大量资料,
Travel Retail in Germany
 Travel Retail in Germany Customer Service Hotline:400-666-1917 Page 1 of 9 一 调研说明中商情报网全新发布的 Travel Retail in Germany 主要依据国家统计局 国家发改委 商务部 中国海关 国务院发展研究中心 行业协会 工商 税务 海关 国内外相关刊物的基础信息以及行业研究单位等公布和提供的大量资料, 结合深入的市场调研资料,
Commissioning in a LEED & GOBAS Evaluated Green Building
 Commissioning in a LEED & GOBAS Evaluated Green Building 张永宁 Yongning Zhang School of Architecture Tsinghua University November, 2006 建筑概况 Building Information 地理位置 : 北京城区 Location: Downtown Beijing 类型
Surface Care in Estonia
 Surface Care in Estonia Customer Service Hotline:400-666-1917 Page 1 of 9 一 调研说明中商情报网全新发布的 Surface Care in Estonia 主要依据国家统计局 国家发改委 商务部 中国海关 国务院发展研究中心 行业协会 工商 税务 海关 国内外相关刊物的基础信息以及行业研究单位等公布和提供的大量资料, 结合深入的市场调研资料,
Comparison of Different Foreground and Background Selection Methods in Marker-Assisted Introgression
 遗传学报 Acta Genetica Sinica, December 006, 33 (1):1073 1080 ISSN 0379-417 Comparison of Different Foreground and Background Selection Methods in Marker-Assisted Introgression BAI Jun-Yan 1,, ZHANG Qin,1,
Men's Grooming in Malaysia
 Men's Grooming in Malaysia Customer Service Hotline:400-666-1917 Page 1 of 9 一 调研说明中商情报网全新发布的 Men's Grooming in Malaysia 主要依据国家统计局 国家发改委 商务部 中国海关 国务院发展研究中心 行业协会 工商 税务 海关 国内外相关刊物的基础信息以及行业研究单位等公布和提供的大量资料,
Car Rental in Portugal
 Car Rental in Portugal Customer Service Hotline:400-666-1917 Page 1 of 9 一 调研说明中商情报网全新发布的 Car Rental in Portugal 主要依据国家统计局 国家发改委 商务部 中国海关 国务院发展研究中心 行业协会 工商 税务 海关 国内外相关刊物的基础信息以及行业研究单位等公布和提供的大量资料, 结合深入的市场调研资料,
REDUCE THE COOLING DEMAND IN YEMENI OFFICE BUILDING BY USING NIGHT VENTILATION IN ADEN AND HODEIDAH CITIES 能源世界 - 中国建筑节能网
 REDUCE THE COOLING DEMAND IN YEMENI OFFICE BUILDING BY USING NIGHT VENTILATION IN ADEN AND HODEIDAH CITIES Aymen Aklan, Panyu Zhu, Marlon Leão, Érika Borges Leão, Volker Huckemann (IGS - Institut für Gebäude-
ACCOUNTING AND ALLOWANCES: TO DEVELOP A COMPLIANCE STRATEGY 从核算与配额到企业合规战略开发
 ACCOUNTING AND ALLOWANCES: TO DEVELOP A COMPLIANCE STRATEGY 从核算与配额到企业合规战略开发 B-PMR SHANGHAI MISSION 市场准备伙伴关系 - 上海 CHARLIE CAO 曹晓磊 2013/10/23 B-PMR SHANGHAI MISSION, 29 OCTOBER 2013 1 BLOOMBERG & BLOOMBERG
Data Analytics for Business Decision Making 数据驱动下的商业决策分析
 Data Analytics for Business Decision Making 数据驱动下的商业决策分析 陈玉旺 Dr Yu-wang Chen 英国曼彻斯特大学决策科学高级讲师 Alliance Manchester Business School (AMBS), The University of Manchester (UoM) Email: yu-wang.chen@manchester.ac.uk
Preparation for Huawei UAE Recruitment (Kampar & Sungai Long Campus)
") Preparation for Huawei UAE Recruitment (Kampar & Sungai Long Campus) Date: The week 8 of Jan 2016 trimester (7-11 March 2016) (to be confirmed) Time: 10:00am to 4pm. Venue: to be confirmed Kindly send
Preparation for Huawei UAE Recruitment (Kampar & Sungai Long Campus) Date: The week 8 of Jan 2016 trimester (7-11 March 2016) (to be confirmed) Time: 10:00am to 4pm. Venue: to be confirmed Kindly send