Examine annual or seasonal scale changes in
|
|
|
- Violet Poole
- 6 years ago
- Views:
Transcription
1 Primary production approach 5: Estimate Net community production based on in situ variations in oxygen, nutrients, carbon, or biomass (often chlorophyll) Examine annual or seasonal scale changes in O 2, NO 3, CO 2, Chl a concentrations in the upper ocean. As long as exchange, diffusive losses, and grazing g( (for Chl a) ) can be accounted for this approach should provide an estimate of NCP. 1


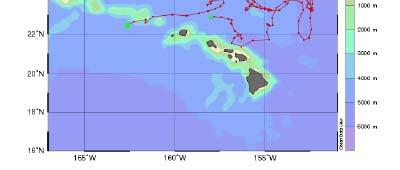
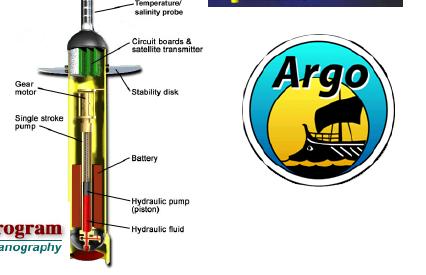
2 Mixed layer O 2 is in equilibrium with the atmosphere Rate of subsurface O 2 accumulation provides information on NCP Riser and Johnson (2008) 2
3 3


4 4


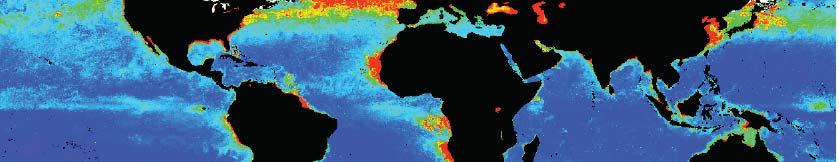
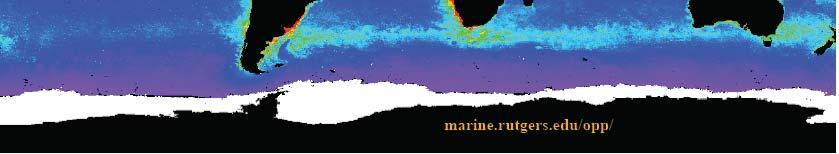
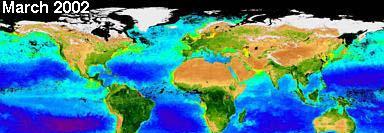
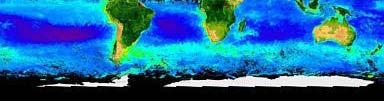
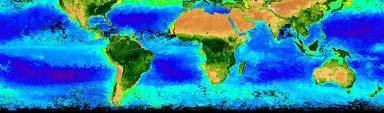
5 Satellites to the rescue but we don t measure production from space Temperature PAR Satellites can provide measurements of temperature, sea surface irradiance, and chlorophyll. Need models that relate these to primary production. Chlorophyll 5


6 Deriving Photosynthesis Irradiance Relationships A photosyntheron th can be used to quantify photosynthesis th as a function of irradiance. 14 C bicarbonate is added to whole seawater samples, samples are placed in temperature and light controlled incubation. After short incubations (<2 hrs) rates of photosynthesis are derived. 6
7 Photosynthetic responses to irradiance = P/ I = initial slope of the P vs. I relationship varies based on physiological changes to the cellular photosynthetic machinery P max varies depending on environmental conditions such as nutrients and temperature Photo osynthesis ( g C L 1 1 hr 1 ) + 0 P max P gross P Net P/ I Irradiance ( mol quanta m 2 s 1 ) Photoinhibition Compensation point 7
8 Satellites measure chlorophyll, temperature, and light ~1 km resolution Need models that relate photosynthesis to these remotely sensed variables. Nontrivial iilchallenges hll with ihremote sensing: stability and accuracy of sensors, correction for atmospheric interferences, and conversion from ocean color to chlorophyll. Depth dependent descriptions of phytoplankton Depth dependent descriptions of phytoplankton productivity generally include the following terms: vertical light attenuation, biomass normalized productivity, photoperiod length, and incident light flux. 8
9 9
10 10


11 North Atlantic Spring Bloom 47 o N 11
12 Trapezoidal integration 0 50 Depth (m) Production ( g C L -1 d -1 ) Depth (m) m Int. 363 mg C m -2 d C-assimialtion rate ( g C L -1 d -1 ) Area of trapezoid = Height * avg. base [(25 m 5 m) * ((6.5 mg C m 3 d mg C m 3 d 1 )/2)] = 129 mg C m 2 d 1 [(45 m 25 m) * (6.4 mg C m 3 d mg C m 3 d 1 )/2] = 114 mg C m 2 d 1 [(75 m 45 m) * ((5.0 mg C m 3 d mg C m 3 d 1 )/2)] = 120 mg C m 2 d 1 Sum 5 75 m = 363 mg C m 2 d 1 12
13 Conditions for net primary productivity 50 Gross Photosynthesis Depth (m) Compensation depth (P cell = R cell ) Respira ation Z 0 1/p dp/dt >0 Critical depth (P water = R water ) Z 0 1/p dp/dt <0 13
 Critical depth")


14 The Spring Bloom Sverdrup (1953) Critical depth Mixed layer Winter mixing introduces nutrients to the upper ocean; seasonal increases in irradiance results in deepening of the critical depth and shoaling of the mixed layer. The result: net accumulation of biomass. 14
15 Where does primary production go? Export Bacteria Grazing Dissolved organic matter 15
16 The Microbial Loop Classic Food web Phytoplankton Inorganic Nutrients A simplified depiction of the microbial loop Ht Heterotrophic t hibacteria Herbivores Dissolved organic matter Higher trophic levels (zooplankton, fish, etc.) Protozoa 16
17 What other components of the biological pump are important? The majority of organic material in the ocean is in the dissolved phase (operationally defined as <0.7 m or 0.2 m) 17
18 Why dissolved organics matter Dissolved organic matter constitutes the largest global reservoir of fixed carbon ~700 x g C. Oxidation of even 1% of the seawater DOC pool in a 1 year period would exceed annual anthropogenic CO 2 emissions. DOC can also serve as an important component of new production. 18


19 Upper ocean total organic carbon at BATS Remember DOC = ~98% of the TOC. Late winter (January March) deep mixing Note the build up in DOC through the spring and summer, with subsequent export the following winter. Figure courtesy of Craig Carlson, UCSB 19
20 Upper ocean total organic carbon at BATS Remember DOC = ~98% of the TOC. Note the build up in DOC through the spring and summer, with subsequent export the following winter. Figure courtesy of Craig Carlson, UCSB 20


21 TOC Profiles at BATS Figure courtesy of Craig Carlson, UCSB 21
22 Typical DOC profile : elevated in near surface water, decreasing through the thermocline, stable at depth. Labile pools cycle over time scales of hours to days. Semi labile pools persistfor weeks to months. Refractory material cycles over on time scales ranging from decadal to multi decadal perhaps longer 22
23 Contribution of different sources to marine DOM Sources of DOM to ocean ecosystems 1. Direct algal excretion 2. Zooplankton (sloppy feeding, excretion) 3. Viral lysis 4. Bacterial release 5. Solubilization of POM % carbon released Ex udation Zoop lankton Viral Solubil lization Bacterial Exudation % 14 C primary production, zooplankton % carbon ingested, solubilization % C released from aggregates, bacterial % release from 14 C labeled organic substrate. Sources: Nagata (2001), Carlson (2002). 23

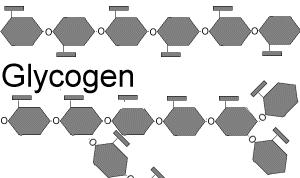
24 Amino acids Identified DOM compound classes Peptides Nucleotides and nucleic acids Lipids Vitamins Monosaccharides Polysaccharides 24
25 The vast majority of organic matter in the sea remains chemically uncharacterized Carbohydrates, neutral sugars, amino acids, and amino sugars make up ~20% of the bulk DOC pool in the upper ocean 25
 Some salts collected")
26 Isolation of DOM by ultrafiltration Size selective concentration of DOM Typically solutes > 1nm are concentrated for subsequent analyses Selects for HMW fraction (about 30 35% TOC) Some salts collected also 26


27 Ultrafiltration high molecular weight DOM (HMWDOM) filter membrane >1000 D DOM fraction 30 35% TOC < 1000 D DOM fraction 65 70% TOC Photos from Dan Repeta 27


28 Final product 30 35% of total DOC 28


29 Spectral and chemical analyses of HMWDOC 13 CNMR Carbohydrate 50-70% of HMWDOC O O Acid hydrolysis followed by Monosaccharide analyses yields 7 major neutral sugars that represent 5-10% of surface water DOM Acid hydrolysis R F A X Gl M Ga 29


30 NMR and carbohydrate analyses of deep sea HMWDOC surface monosaccharide distribution relative % relative % deep 30


31 Bomb 14 C Fossil fuel dilution Atmosphere Cosmogenic 14 C production Air Sea Exchange Surface Ocean Deep Ocean Factors controlling 14 C in atmospheric and oceanic reservoirs 14 C half life is 5730 years 31


32 DOC cycling via DO 14 C Williams, Oeschger, and Kinney; Nature v224 (1969) UV photooxidation 1000L Depth 14C( ) Age 1880m ybp 1920m ybp 32
 Deep ocean values of DOC are equal to a radiocarbon age of 4000 5000 yrs Either there is a source of old DOC, or DOC persists for several")
33 Radiocarbon in the Atlantic and Pacific Oceans Peter M. Williams and Ellen Druffel; Nature 1987, JGR 1992 DIC 14 C in surface waters of the Atlantic and Pacific has the same isotopic value. DOC is always older than DIC (by 4 kyrs in surface water) Deep ocean values of DOC are equal to a radiocarbon age of yrs Either there is a source of old DOC, or DOC persists for several ocean mixing cycles 33
Where does primary production go? Export Bacteria Grazing Dissolved organic matter
 Where does primary production go? Export Bacteria Grazing Dissolved organic matter The Microbial Loop Classic Food web Phytoplankton Inorganic Nutrients A simplified depiction of the microbial loop Heterotrophic
Aquatic respiration and ocean metabolism
 Aquatic respiration and ocean metabolism Remember what life is all about: Energy (ATP) Reducing power (NADPH) Nutrients (C, N, P, S, Fe, etc., etc.) Photosynthetic organisms use sunlight, H 2 O, and dissolved
11/9/2010. Stoichiometry of POM and DOM. DOC cycling via DO 14 C Williams, Oeschger, and Kinney; Nature v224 (1969)
") DOC cycling via DO 1 C Williams, Oeschger, and Kinney; Nature v22 (1969) UV photooxidation Radiocarbon in the Atlantic and Pacific Oceans Peter M. Williams and Ellen Druffel; Nature 1987, JGR 1992 DIC
DOC cycling via DO 1 C Williams, Oeschger, and Kinney; Nature v22 (1969) UV photooxidation Radiocarbon in the Atlantic and Pacific Oceans Peter M. Williams and Ellen Druffel; Nature 1987, JGR 1992 DIC
Marine Primary Productivity: Measurements and Variability. Matt Church Department of Oceanography MSB 612
 Marine Primary Productivity: Measurements and Variability Matt Church Department of Oceanography MSB 612 Sunlight CO 2 + 2H 2 O CH 2 O + O 2 + H 2 O + heat Gross Primary Production (GPP): The rate of organic
Deep sea gradients in [DOC]
![Deep sea gradients in [DOC]](/thumbs/72/66709491.jpg "Deep sea gradients in [DOC]") Deep sea gradients in [DOC] NMR and carbohydrate analyses of deep sea HMWDOC monosaccharide distribution surface relative % 5200m relative % NMR and carbohydrate analyses of deep sea HMWDOC 13 C- and 1
Deep sea gradients in [DOC] NMR and carbohydrate analyses of deep sea HMWDOC monosaccharide distribution surface relative % 5200m relative % NMR and carbohydrate analyses of deep sea HMWDOC 13 C- and 1
Bacterial production and the cycling of DOC
 Bacterial production and the cycling of DOC Why does DOC accumulate in surface seawater? The chemical characterization of reactive DOC? How is recalcitrant DOC degraded? What is bacterial production and
Carbonate rocks 60 x 10 6 GT C. Kerogen 20 x 10 6 GT C. Atmospheric CO GT C. Terrestrial Plants 900 GT C. Uplift, exposure and erosion
 Atmospheric CO 2 750 GT C Uplift, exposure and erosion Terrestrial Plants 900 GT C Soils 2000 GT C Carbonate rocks 60 x 10 6 GT C Terrestrial Primary Production 50-100 GT C yr -1 River flux 0.5 GT C yr
Deep sea gradients in [DOC]
![Deep sea gradients in [DOC]](/thumbs/72/66709616.jpg "Deep sea gradients in [DOC]") Deep sea gradients in [DOC] NMR and carbohydrate analyses of deep sea HMWDOC monosaccharide distribution surface relative % 5200m relative % NMR and carbohydrate analyses of deep sea HMWDOC 13 C- and 1
Deep sea gradients in [DOC] NMR and carbohydrate analyses of deep sea HMWDOC monosaccharide distribution surface relative % 5200m relative % NMR and carbohydrate analyses of deep sea HMWDOC 13 C- and 1
DOC and major carbon reservoirs and fluxes
 The Composition and cycling of Dissolved organic matter-i Review of DOC distribution Review of radiocarbon in DOC Sources of DOC Seasonal cycling of DOC above the permanent thermocline Composition of DOC
Microbial cycling of dissolved organic matter
 Microbial cycling of dissolved organic matter MOG Lecture 8 March 1 st, 2011 8.1 Microbial cycling of dissolved organic matter The inclusion of microbes in marine food webs Microbial production (from 2
Trophic Structure & Food Webs
 Trophic Structure & Food Webs 1946, Riley published a simple food web model: PP = 153T - 120P - 7.3N - 9.1Z + 6713 1947, simplified it to: dn/dt = N(Ph - R) - G Trophic Structure & Food Webs 1946, Riley
Trophic Structure & Food Webs
 Trophic Structure & Food Webs 1946, Riley published a simple food web model: PP = 153T - 120P - 7.3N - 9.1Z + 6713 1947, simplified it to: dn/dt = N(Ph - R) - G Trophic Structure & Food Webs 1946, Riley
Production and Life OCEA 101
 Production and Life OCEA 101 Overview Photosynthesis Primary production Phytoplankton biomass Controls on primary production and biomass Food webs Photosynthesis Photosynthesis requires: (i) sunlight (ii)
Microbial biomass in the sea: Methods, limitations, and distributions
 Microbial biomass in the sea: Methods, limitations, and distributions Matt Church (MSB 612 / 956-8779 / mjchurch@hawaii.edu) Marine Microplankton Ecology OCN 626 E. F. DeLong The tripartite goals of microbial
Carbon Cycling or. perspective. CE5508 Biogeochemistry
 Carbon Cycling or the importance of methods & perspective CE5508 Biogeochemistry Spring 2006 Topics to cover GPP vs. NPP vs. NEP (NCP) Carbon flow paths Allochthonous (exogenous) vs. autochthonous (endogenous)
Oceanic Carbon Cycle
 An Intro to the Oceanic Carbon Cycle Oceanic Carbon Cycle Why is C an important element? Cellular level essential for macromolecular synthesis Trophodynamics- important in energy flow between trophic levels.
10 Productivity and Food Webs in the Sea. Notes for Marine Biology: Function, Biodiversity, Ecology By Jeffrey S. Levinton
 10 Productivity and Food Webs in the Sea Notes for Marine Biology: Function, Biodiversity, Ecology By Jeffrey S. Levinton Microbial Loop 2 Larger consumers Microbial loop DOC & POC Viruses Bacteria Herbivores
Chemical and Physical Analysis of the Cape Fear Estuary
 The Cape Fear River Chemical and Physical Analysis of the Cape Fear Estuary The Cape Fear River (CFR), the most industrialized of all North Carolina s rivers, winds for over miles through the heart of
Why carbon? The Struggle for Composition 9/9/2010. Microbial biomass in the sea: Methods, limitations, and distributions
 Microbial biomass in the sea: Methods, limitations, and distributions Key concepts in biological oceanography Matt Church (MSB 614 / 956-8779 / mjchurch@hawaii.edu) Marine Microplankton Ecology OCN 626
25 years of Hawaii Ocean Time-series carbon flux determinations: Insights into productivity, export, and nutrient supply in the oligotrophic ocean
 25 years of Hawaii Ocean Time-series carbon flux determinations: Insights into productivity, export, and nutrient supply in the oligotrophic ocean MATTHEW CHURCH, ROBERT BIDIGARE, JOHN DORE, DAVID KARL,
SUNLIGHT & OCEAN ZONATION
 PLANKTON, PRIMARY PRODUCTIVITY, AND BIOGEOCHEMISTRY EPSS 15 Fall 2017 LAB #7 SUNLIGHT & OCEAN ZONATION Sunlight is critical to the distribution of oceanic life The base of the food chain (phytoplankton)
The Hawaii Ocean Time-series (HOT): Highlights and perspectives from two decades of ocean observations
: Highlights and perspectives from two decades of ocean observations") The Hawaii Ocean Time-series (HOT): Highlights and perspectives from two decades of ocean observations MATTHEW CHURCH UNIVERSITY OF HAWAII OCB SCOPING WORKSHOP SEPTEMBER 2010 A Dedicated HOT Team NSF What
The Hawaii Ocean Time-series (HOT): Highlights and perspectives from two decades of ocean observations MATTHEW CHURCH UNIVERSITY OF HAWAII OCB SCOPING WORKSHOP SEPTEMBER 2010 A Dedicated HOT Team NSF What
Alfred J. Lotka (1911)
") Distributions, abundance, and activities of marine bacteria Matt Church (MSB 612 / 956-8779 / mjchurch@hawaii.edu) Marine Microplankton Ecology OCN 626 The evolution of a given material system is a process
Distributions, abundance, and activities of marine bacteria Matt Church (MSB 612 / 956-8779 / mjchurch@hawaii.edu) Marine Microplankton Ecology OCN 626 The evolution of a given material system is a process
Phytoplankton and bacterial biomass, production and growth in various ocean ecosystems
 Phytoplankton and bacterial biomass, production and growth in various ocean ecosystems Location Bact. Biomass (mg C m -2 ) Phyto. Biomass (mg C m -2 ) BactB: PhytoB BactP (mg C m -2 d -1 ) 1 o Pro (mg
Ocean Production and CO 2 uptake
 Ocean Production and CO 2 uptake Fig. 6.6 Recall: Current ocean is gaining Carbon.. OCEAN Reservoir size: 38000 Flux in: 90 Flux out: 88+0.2=88.2 90-88.2 = 1.8 Pg/yr OCEAN is gaining 1.8 Pg/yr Sum of the
Producers. living systems need energy to function. autotrophs. Sunlight is the main energy source for life on Earth.
 Producers living systems need energy to function. Sunlight is the main energy source for life on Earth. sources of energy sunlight inorganic chemical compounds. autotrophs. capture energy from sunlight
LIMNOLOGY. Inland Water Ecosystems. JACOB KALFF McGill University. Prentice Hall. Upper Saddle River, New Jersey 07458
 LIMNOLOGY Inland Water Ecosystems JACOB KALFF McGill University Prentice Hall Prentice Hall Upper Saddle River, New Jersey 07458 Contents CHAPTER 1 Inland Waters and Their Catchments: An Introduction and
Oceanic Microbial Observatory Objectives
 Connecting Heterotrophic Microorganisms to the Ocean C cycle at the Sargasso Sea Microbial Observatory Craig Carlson Steve Bob Giovannoni Morris Dennis Steve Hansell Giovannoni Alexander Treusch Bob Morris
The Carbon cycle. Atmosphere, terrestrial biosphere and ocean are constantly exchanging carbon
 The Carbon cycle Atmosphere, terrestrial biosphere and ocean are constantly exchanging carbon The oceans store much more carbon than the atmosphere and the terrestrial biosphere The oceans essentially
Marine Primary Productivity: Measurements and Variability
 Why should we care about productivity? Marine Primary Productivity: Measurements and Variability Photosynthetic activity in oceans created current O 2 -rich atmosphere Plankton form ocean sediments & fossil
Chemical and biological effects on mesopelagic organisms and communities in a high-co 2 world
 Chemical and biological effects on mesopelagic organisms and communities in a high-co 2 world Louis Legendre Villefranche Oceanography Laboratory, France Richard B. Rivkin Memorial University of Newfoundland,
WHY CARBON? The Carbon Cycle 1/17/2011. All living organisms utilize the same molecular building blocks. Carbon is the currency of life
 The Carbon Cycle WHY CARBON? Inventories: black text Fluxes: purple arrows Carbon dioxide (+4) AN = 6 (6P/6N) AW = 12.011 Oxidation: -4 to +4 Isotopes: 11 C, 12 C, 1 C, 14 C Methane (-4) Carbon is the
Nitrogen Cycling in the Sea
 Nitrogen Cycling in the Sea Matt Church (MSB 612 / 9568779/ mjchurch@hawaii.edu) Marine Microplankton Ecology / OCN 626 NH 4 N0 2 N0 2 NH 4 Outline Nitrogen species in marine watersdistributions and concentrations
Global Biogeochemical cycles and Ocean Productivity
 Global Biogeochemical cycles and Ocean Productivity Biological Oceanography Recall: goal is not to understand the biology of one particular organism (or group), but to understand organisms fit into the
Ecosystems. Trophic relationships determine the routes of energy flow and chemical cycling in ecosystems.
 AP BIOLOGY ECOLOGY ACTIVITY #5 Ecosystems NAME DATE HOUR An ecosystem consists of all the organisms living in a community as well as all the abiotic factors with which they interact. The dynamics of an
Measurements and Models of Primary Productivity
 Measurements and Models of Primary Productivity Supported by NSERC 1 including OTN John J. Cullen! Department of Oceanography, Dalhousie University Halifax, Nova Scotia, Canada B3H 4R2! 2014 C-MORE Summer
Production vs Biomass
 Patterns of Productivity OCN 201 Biology Lecture 5 Production vs Biomass Biomass = amount of carbon per unit area (= standing stock * C/cell) Units (e.g.): g C m -2 Primary Production = amount of carbon
Lakes, Primary Production, Budgets and Cycling Schlesinger and Bernhardt (2013): Chapter 8, p
: Chapter 8, p") OCN 401-Biogeochemical Systems Lecture #12 (10.8.13) Angelos Hannides, hannides@hawaii.edu Lakes, Primary Production, Budgets and Cycling Schlesinger and Bernhardt (2013): Chapter 8, p. 288-308 1. Physical
OCN 401-Biogeochemical Systems Lecture #12 (10.8.13) Angelos Hannides, hannides@hawaii.edu Lakes, Primary Production, Budgets and Cycling Schlesinger and Bernhardt (2013): Chapter 8, p. 288-308 1. Physical
Patterns of Productivity
 Patterns of Productivity OCN 201 Biology Lecture 8 Primary Production - the production of autotrophic biomass Secondary Production - the production of heterotrophic biomass Production vs Biomass Biomass
Oceanic CO 2 system - Significance
 OCN 401 Biogeochemical Systems (10.25.18) (10.30.18) (Schlesinger: Chapter 9) (11.27.18) Oceanic Carbon and Nutrient Cycling - Part 2 Lecture Outline 1. The Oceanic Carbon System 2. Nutrient Cycling in
Lecture 13 - Primary Production: Water Column Processes
 12.742 - Marine Chemistry Fall 2004 Lecture 13 - Primary Production: Water Column Processes Prof. Scott Doney Somewhat different organization from years past - start with surface productivity and work
3 2 Energy Flow Slide 1 of 41
 1 of 41 Producers Producers Without a constant input of energy, living systems cannot function. Sunlight is the main energy source for life on Earth. 2 of 41 Producers In a few ecosystems, some organisms
Includes the coastal zone and the pelagic zone, the realm of the oceanographer. I. Ocean Circulation
 Includes the coastal zone and the pelagic zone, the realm of the oceanographer I. Ocean Circulation II. Water Column Production A. Coastal Oceans B. Open Oceans E. Micronutrients F. Harmful Algal Blooms
10/17/ Energy Flow. Producers. Where does the energy for life processes come from?
 2 of 41 Where does the energy for life processes come from? 3 of 41 Without a constant input of energy, living systems cannot function. Sunlight is the main energy source for life on Earth. 4 of 41 1 Only
(Brief) History of Life
 History of Life") Oldest fossils are 3.5 Ga Cyanobacteria (?) from the Australian Warraroona Group (ancient marine sediments) Bacteria represent the only life on Earth from 3.5 to ~1.5 Ga - and possibly longer Hard to kill
Oldest fossils are 3.5 Ga Cyanobacteria (?) from the Australian Warraroona Group (ancient marine sediments) Bacteria represent the only life on Earth from 3.5 to ~1.5 Ga - and possibly longer Hard to kill
Biology. Slide 1 of 41. End Show. Copyright Pearson Prentice Hall
 Biology 1 of 41 2 of 41 Producers Where does the energy for life processes come from? 3 of 41 Producers Producers Without a constant input of energy, living systems cannot function. Sunlight is the main
Marine Microbial Processes
 Marine Microbial Processes Outline size-structured food webs brief history of the development of our current understanding of microbially dominated food webs carbon cycling in marine food webs evolving
TOTAL UNCERTAINTY OF RADIOCARBON MEASUREMENTS OF MARINE DISSOLVED ORGANIC CARBON AND METHODOLOGICAL RECOMMENDATIONS
 TOTAL UNCERTAINTY OF RADIOCARBON MEASUREMENTS OF MARINE DISSOLVED ORGANIC CARBON AND METHODOLOGICAL RECOMMENDATIONS Ellen R M Druffel 1 Sheila Griffin Brett D Walker Alysha I Coppola Danielle S Glynn Department
Ecosystem Ecology. Trophic levels energy flow through ecosystems. Productivity and energy. Autotrophs: primary producers Heterotrophs: consumers
 Ecosystem Ecology 1. Overview of material and energy flows in ecosystems 2. Primary production 3. Secondary production and trophic efficiency 4. Ecological Pyramids Trophic levels energy flow through ecosystems
Studying organisms in their environment
 Studying organisms in their environment organism population community ecosystem biosphere Essential questions What limits the production in ecosystems? How do nutrients move in the ecosystem? How does
Lakes, Primary Production, Budgets and Cycling
 OCN 401-Biogeochemical Systems Lecture #10 (9.22.11) Lakes, Primary Production, Budgets and Cycling (Schlesinger: Chapter 7) 1. Primary Production and Nutrient Cycling in Lakes Physical aspects and nomenclature
Drones: A New Tool for Water Monitoring
 Drones: A New Tool for Water Monitoring Donglai Gong Carl Friedrichs, Ryan Carnegie Outline What are the goals of water monitoring (from marine scientist s perspective)? Healthy ecosystem? Fisheries /
Determining the f ratio 11/16/2010. Incubate seawater in the presence of trace 15
 Plankton production is supported by 2 types of nitrogen: 1) new production supported by external sources of N (e.g. NO 3 and N 2 ), 2) recycled or regenerated production, sustained by recycling of N. Assumptions:
ECOLOGY Energy Flow Packet 2 of 4
 ECOLOGY Energy Flow Packet 2 of 4 3 2 Energy Flow Producers Where does the energy for life processes come from? Producers Producers Without a constant input of energy, living systems cannot function. Sunlight
Productivity and fisheries. Energy flow. Biological pyramids. Why study production processes?
 Productivity and fisheries Why study production processes? Fisheries strongly tied to spatial and temporal variation in primary productivity Better understanding of distribution of fishery resources Interpret
3 2 Energy Flow. Slide 1 of 41. Copyright Pearson Prentice Hall
 1 of 41 Producers Where does the energy for life processes come from? Producers Without a constant input of energy, living systems cannot function. Sunlight is the main energy source for life on Earth.
Biological Oceanography
 Biological Oceanography What controls production in the sea? The BIG 2: 1) Light (energy) 2) Nutrients (matter) Secondarily 3) Temperature 4) Stratification (coupled to 2 & 3) 5) Grazing/predation The
Modelling sea ice biogeochemistry: key findings from 1-D sensitivity experiments and plans for 3-D study
 Modelling sea ice biogeochemistry: key findings from 1-D sensitivity experiments and plans for 3-D study Hakase Hayashida1, Eric Mortenson1, Nadja Steiner2,3, Adam Monahan1 1 School of Earth and Ocean
Patterns of Productivity
 Patterns of Productivity Limitation by Light and Nutrients OCN 201 Biology Lecture 8 Primary Production - the production of biomass by autotrophs Secondary Production - the production of biomass by heterotrophs
Ecosystems: Nutrient Cycles
 Ecosystems: Nutrient Cycles Greeks, Native Peoples, Buddhism, Hinduism use(d) Earth, Air, Fire, and Water as the main elements of their faith/culture Cycling in Ecosystems the Hydrologic Cycle What are
5.0 PHYTOPLANKTON PHYSIOLOGY. Luke Twomey Christopher P. Buzzelli Hans W. Paerl. 5.1 Introduction
 5. PHYTOPLANKTON PHYSIOLOGY Luke Twomey Christopher P. Buzzelli Hans W. Paerl 5.1 Introduction Phytoplankon production is the primary source of organic carbon in the water column of the NRE (Matson and
Review of Biogeosciences Manuscript. doi: /bdg
 Review of Biogeosciences Manuscript doi: 10.5194/bdg-9-485-2012 Title: Photo-lability of deep ocean dissolved black carbon Authors: Stubbins, A., J. Niggerman, and T. Dittmar General comments: Black carbon
How Ecosystems Work Section 1. Chapter 5 How Ecosystems Work Section 1: Energy Flow in Ecosystems DAY 1
 Chapter 5 How Ecosystems Work Section 1: Energy Flow in Ecosystems DAY 1 Life Depends on the Sun Energy from the sun enters an ecosystem when plants use sunlight to make sugar molecules. This happens through
4/28/2013. Transmission of Light in Seawater. Color in the Ocean Color of ocean ranges from deep blue to yellow-green Factors Turbidity from runoff
 1 2 3 4 5 6 7 8 9 10 11 12 13 14 CHAPTER 13 Biological Productivity and Energy Transfer Chapter summary in haiku form Primary produce Sunlight and phytoplankton Ocean is garden Chapter Overview Productivity
5/2/13. Zooplankton! Phytoplankton! Nutrients!
 Phytoplankton! Zooplankton! Nutrients! 1 Phytoplankton! Zooplankton! Critical Depth Recycled Nutrients! Oxidized Nutrients! Detritus! Rest of Ocean Biological and Solubility Pumps 2 New (Export) vs. Regenerated
A functional gene approach to studying nitrogen cycling in the sea. Matthew Church (MSB 612 / March 20, 2007
 A functional gene approach to studying nitrogen cycling in the sea Matthew Church (MSB 612 / 6-8779 mjchurch@hawaii.edu) March 20, 2007 Overview Climate change, carbon cycling, and ocean biology Distributions
Ecosystems and the Biosphere: Energy Flow Through the Ecosystem and the Recycling of Matter
 Name Ecosystems and the Biosphere: Energy Flow Through the Ecosystem and the Recycling of Matter Overview: An ecosystem is: All of the organisms living on Earth need to carry out life processes such as
In situ methods to measure Primary Production and Net Community Production. What have we learned?
 In situ methods to measure Primary Production and Net Community Production What have we learned? Time Series Sites Time series sites provide: - test bed for new PP methods - evaluation of the annual carbon
Effects of ocean acidification & warming on organic matter production
 Effects of ocean acidification & warming on organic matter production : Possible changes in biological carbon pump efficiency Ja-Myung Kim PICES 2015 Annual Meeting October 14-25 Qingdao China Atmosphere
Lecture # 4b- Stable Isotopes Part II. 1) More Focus on C & N Isotopes 2) Brief bit on molecular-level isotopes?
 More Focus on C & N Isotopes 2) Brief bit on molecular-level isotopes?") Lecture # 4b- Stable Isotopes Part II 1) More Focus on C & N Isotopes 2) Brief bit on molecular-level isotopes? recall: δ notation H = (H/L)spl - (H/L)std x1000 (H/L)std Primary Standards Isotope Ratios
Lecture # 4b- Stable Isotopes Part II 1) More Focus on C & N Isotopes 2) Brief bit on molecular-level isotopes? recall: δ notation H = (H/L)spl - (H/L)std x1000 (H/L)std Primary Standards Isotope Ratios
CO 2. and the carbonate system II. Carbon isotopes as a tracer for circulation. The (solid) carbonate connection with. The ocean climate connection
 carbonate connection with. The ocean climate connection") CO 2 and the carbonate system II Carbon isotopes as a tracer for circulation The (solid) carbonate connection with ocean acidity Climate The ocean climate connection The carbon cycle the carbon cycle involves
CO 2 and the carbonate system II Carbon isotopes as a tracer for circulation The (solid) carbonate connection with ocean acidity Climate The ocean climate connection The carbon cycle the carbon cycle involves
Class XII Chapter 14 Ecosystem Biology
 Question 1: Fill in the blanks. (a) Plants are called as because they fix carbon dioxide. (b) In an ecosystem dominated by trees, the pyramid (of numbers) is type. (c) In aquatic ecosystems, the limiting
Another cause of diversity may be the creation of different habitats within a region by periodic disturbance A community that forms if the land is
 Another cause of diversity may be the creation of different habitats within a region by periodic disturbance A community that forms if the land is undisturbed and that perpetuates itself for as long as
Food Webs. March 16, Photosynthesis and Respiration on ecosystem scales
 Lecture 18 Productivity and Food Webs March 16, 2005 Photosynthesis and Respiration on ecosystem scales Analysis of global productivity Energy flow through trophic levels and ecosystems Three weeks in
Phytoplankton! Zooplankton! Nutrients!
 Phytoplankton! Zooplankton! Nutrients! Phytoplankton! Zooplankton! Critical Depth Recycled Nutrients! Oxidized Nutrients! Detritus! Rest of Ocean Biological and Solubility Pumps New (Export) vs. Regenerated
MORE), University of Hawaii, Honolulu, HI, 96822, USA. * These authors contributed equally to this work
, University of Hawaii, Honolulu, HI, 96822, USA. * These authors contributed equally to this work") In the format provided by the authors and unedited. Marine methane paradox explained by bacterial degradation of dissolved organic matter Daniel J. Repeta 1*, Sara Ferrón 2*, Oscar. Sosa 2*, Carl G. Johnson
In the format provided by the authors and unedited. Marine methane paradox explained by bacterial degradation of dissolved organic matter Daniel J. Repeta 1*, Sara Ferrón 2*, Oscar. Sosa 2*, Carl G. Johnson
Continued from Lecture 20a
 IV. Primary Production (p.p.) Continued from Lecture 20a C. Biomass & Productivity 1. Biomass = mass of organic matter (in grams) a. Gross primary production = total amount of organic material synthesized
CHEMICAL: CARBON and OXYGEN (read 44-45; in Dodson)
") BIOE 155, Fall BACKGROUND INFORMATION CHEMICAL: CARBON and OXYGEN (read -5; 3-39 in Dodson) Types of molecules Organic: compounds containing Carbon-Hydrogen bonds Inorganic: everything else. Photosynthesis
BIOE 155, Fall BACKGROUND INFORMATION CHEMICAL: CARBON and OXYGEN (read -5; 3-39 in Dodson) Types of molecules Organic: compounds containing Carbon-Hydrogen bonds Inorganic: everything else. Photosynthesis
Biology. Slide 1 of 41. End Show. Copyright Pearson Prentice Hall
 Biology 1 of 41 2 of 41 Producers Where does the energy for life processes come from? 3 of 41 Producers Producers Without a constant input of energy, living systems cannot function. Sunlight is the main
observatory framework
 From marine terrestrial interactions to the warm blob : integrating land-oceanatmospheric research in a coastal observatory framework Brian Hunt, Jennifer Burt, Wiley Evans, William Floyd, Ian Giesbrecht,
Nutrients, biology and elemental stoichiometry
 Nutrients, biology and elemental stoichiometry Subtropics and tropics: oligotrophic = low nutrient, low biomass. Equatorial upwelling regions: Elevated nutrients (1 10 MNO 3 ) and biomass (relative to
OCEANOGRAPHY Chapter 13
 OCEANOGRAPHY Chapter 13 Biological Productivity and Energy Transfer part 3: Regional Productivity Energy and Nutrients in Marine Ecosystems, Fisheries Notes from the textbook, integrated with original
Equatorial Pacific HNLC region
 Equatorial Pacific HNLC region Another region with high nitrogen left over after the growing season Iron and grazing constraints on primary production in the central equatorial Pacific: An EqPac synthesis
EOC Review. a. Dominant b. Recessive c. Codominant d. Incompletely Dominant
 EOC Review Consider the reactions shown below. Which of the following statements is not true concerning these reactions? 6CO 2 + 6H 2 O + light à C 6 H 12 O 6 (glucose) + 6O 2 C 6 H 12 O 6 (glucose) +
4th International Zooplankton Production Symposium Hiroshima, Japan, 31 May 2007 An aspect of functional groups of zooplankton in oceanic ecosystems
 4th International Zooplankton Production Symposium Hiroshima, Japan, 31 May 2007 An aspect of functional groups of zooplankton in oceanic ecosystems Akira Taniguchi Tokyo University of Agriculture Okhotsk
MAR 650-Lecture 1: Influences of Light on Biological Production. Importance: In the ocean: 1) Photosynthesis and Primary Production
 Photosynthesis and Primary Production") MAR 650-Lecture 1: nfluences of Light on Biological Production 1) Photosynthesis and Primary Production photosynthesis CO 2 H 2 O Carbohydrate O 2 respiration mportance: Photosynthesis requires lights,
MAR 650-Lecture 1: nfluences of Light on Biological Production 1) Photosynthesis and Primary Production photosynthesis CO 2 H 2 O Carbohydrate O 2 respiration mportance: Photosynthesis requires lights,
Phytoplankton and Upper Ocean Biogeochemical Cycles Along Line P
 Phytoplankton and Upper Ocean Biogeochemical Cycles Along Line P Angelica Peña Institute of Ocean Sciences, Fisheries & Oceans Canada. Contribution: Diana Varela, Department of Biology & School of Earth
Siyuan Wang, Eric Apel, Louisa Emmons, Rebecca Hornbrook, Jean-François Lamarque, Simone Tilmes, and ATOM team
 Siyuan Wang, Eric Apel, Louisa Emmons, Rebecca Hornbrook, Jean-François Lamarque, Simone Tilmes, and ATOM team National Center for Atmospheric Research (NCAR) Chemistry in the middle of nowhere 2 Oxygenated
Modelling the carbon fluxes and budgets on the northwest European continental shelf and beyond
 Modelling the carbon fluxes and budgets on the northwest European continental shelf and beyond Jason Holt, Sarah Wakelin, Roger Proctor, Graham Tattersal, James Harle: POL Tim Smyth, Jerry Blackford, Icarus
The supplementary section contains additional model details and an additional figure presenting model results.
 1 1. Supplementary materials The supplementary section contains additional model details and an additional figure presenting model results. 1.1. Carbon chemistry implementations The OCMIP carbon chemistry
AP Biology. Ecosystems
 Ecosystems Studying organisms in their environment organism population community ecosystem biosphere Essential questions What limits the production in ecosystems? How do nutrients move in the ecosystem?
CANDYFLOSS, Work Module 3 The Autotrophs
 2014 SSB AGM Liverpool CANDYFLOSS, Work Module 3 The Autotrophs Alex Poulton (NOC) Anna Hickman (University of Southampton) CANDYFLOSS, WM3: The Autotrophs WM3 - THE AUTOTROPHS (Hickman/Poulton) Focuses
POPULATION- RELATED PROCESSES
 THE ROLE OF FLOW CYTOMETRY IN MARINE BIODIVERSITY AND ECOSYSTEM FUNCTION UNTREATED WATER FLUORESCENT DYE PRESERVED WATER FLUORESCENT PROBE POPULATION- OUTPUTS2 OUTPUTS1 FLOW MULTI- SORTING DATA VARIATE
ereefsoptical and biogeochemical model. CSIRO OCEANS AND ATMOSPHERE FLAGSHIP
 ereefsoptical and biogeochemical model. CSIRO OCEANS AND ATMOSPHERE FLAGSHIP 2 Presentation title Presenter name BGC state variables: - 10 dissolved - 22 living particulate - 11 non-living part. -6 epibenthic.
How Ecosystems Work Section 1. Chapter 5 How Ecosystems Work Section 1: Energy Flow in Ecosystems DAY 1
 Chapter 5 How Ecosystems Work Section 1: Energy Flow in Ecosystems DAY 1 Life Depends on the Sun Energy from the sun enters an ecosystem when plants use sunlight to make sugar molecules. This happens through
Carbon/Oxygen Cycle. By Ethan Hempel, Jess Meyers, Hannah Park, and Kelly Chan
 Carbon/Oxygen Cycle By Ethan Hempel, Jess Meyers, Hannah Park, and Kelly Chan Background When animals breathe, they take in oxygen and exhale carbon dioxide. Plants use carbon dioxide (along with water
Dissolved Organic Matter and the Carbon Cycle - Arabian Sea and Indian Ocean
 Dissolved Organic Matter and the Carbon Cycle - Arabian Sea and Indian Ocean Dennis Hansell University of Miami DOC analyses in the Arabian Sea conducted in collaboration with Dr. Ed Peltzer Fundamental
A sense of place N, W LNLC region two layered system. < 50m mixed layer ~125 m euphotic zone/nutricline. Station ALOHA (1988 onwards)
") STATION ALOHA 1. Introduction to the region 2. Types of blooms (enhanced biomass/growth emphasis on the mixed layer) 3. Drivers of variability 4. Beyond biomass towards productivity angelicque white, oregon
STATION ALOHA 1. Introduction to the region 2. Types of blooms (enhanced biomass/growth emphasis on the mixed layer) 3. Drivers of variability 4. Beyond biomass towards productivity angelicque white, oregon
Zu-Tao Ou-Yang Center for Global Change and Earth Observation Michigan State University
 Zu-Tao Ou-Yang Center for Global Change and Earth Observation Michigan State University Ocean Color: Spectral Visible Radiometry Color of the ocean contains latent information on the water qualitycdom,