Factsheet: Town of Deep River Water Quality and Stormwater Summary
|
|
|
- Molly Briggs
- 6 years ago
- Views:
Transcription

1 79 Elm Street Hartford, CT Affirmative Action/Equal Opportunity Employer Factsheet: Town of Deep River Water Quality and Stormwater Summary This document was created for each town that has submitted monitoring data under the current Small Municipal Separate Storm Sewer System (MS4) General Permit. What follows is information on how stormwater can affect water quality in streams and rivers and a summary of data submitted by your town. This factsheet is intended to help you interpret your monitoring results and assist you in compliance with the MS4 program. Water Quality in Connecticut Surface waters are important resources that support numerous uses, including water supply, recreation, fishing, shellfishing and sustaining aquatic life. Water quality conditions needed to support these uses are identified within the Connecticut Water Quality Standards (WQS). In order to protect and restore these uses, we need acceptable environmental conditions (physical, chemical and biological) to be present within surface waters. To assess and track water quality conditions, CT DEEP conducts monitoring across the State. The data is synthesized into a biennial state water quality report called the Integrated Water Quality Report. Currently, specific water quality monitoring in the state encompasses about 50% of rivers, 47% of lakes, and 100% of estuary/coastline. In addition, CT DEEP may have information about certain land uses or discharges which could indicate a potential for water quality to be impacted, even if the waterbody has not been fully monitored and assessed. To find more detailed information on water quality in your town, please see the Integrated Water Quality Report (IWQR) on the CT DEEP website at Information on water quality within your town is also presented on the maps included in this fact sheet. Impacts of Impervious Cover on Water Quality Impervious cover (IC) refers to hard surfaces across the landscape such as roads, sidewalks, parking lots and roofs. Studies have focused on the amount of hard surfaces to evaluate the impacts of stormwater runoff from these hard surfaces on water quality and found that IC affects both the quantity and quality of stormwater. IC forces rain to runoff the land, carrying pollutants quickly and directly to lakes and streams instead of soaking into the ground and being filtered by the soil. For more information on impervious cover, please see the CT DEEP web page and EPA s web page In general, the higher the percentage of IC in a watershed, the poorer the surface water quality. Research in Connecticut strongly suggests that aquatic life will be harmed when the IC within a 1

2 watershed exceeds 12%. Stormwater pollution from IC is a likely cause of impairment for these waterbodies. Town of Deep River: Impervious Cover Data This chart shows the amount of area within your town that contains IC. Data is grouped by acres and percent IC. While all levels of IC can contribute stormwater to streams, it is important to note that land with IC greater than 12% in town is likely to be contributing enough stormwater to streams to have a negative impact on water quality. Towns should aim to make stormwater improvements in areas with IC greater than 12% in an effort to reduce the amount of stormwater pollution reaching surface waters which will protect and improve water quality. For more information on areas of impervious cover within your town, please see the maps at the back of this factsheet. Amounts of Impervious Cover within the Town of Deep River Pollution Reduction Waterbodies often can handle a certain amount of pollutants and still maintain good water quality. However, impaired waterbodies have too much pollution impacting their water quality and therefore the streams do not support all uses for the waterbody. Total Maximum Daily Loads (TMDLs) are pollution reduction budgets developed for impaired waterbodies in order to meet 2
3 water quality. If the pollution budget is achieved through the recommended pollution reduction measures, then the waterbody is expected to meet water quality. CT DEEP also supports impaired waters restoration through watershed based plans ( which provide more specific non-point source pollution control measures. The following TMDLs or pollution reduction strategies have been developed and apply to areas within your town. TMDLs or Strategies Applicable to the Town of Deep River Name of TMDL or Strategy Statewide Bacteria TMDL A TMDL Analysis to Achieve Water Quality Standards for Dissolved Oxygen in Long Island Sound Northeast Regional Mercury TMDL Pollutant Waterbody Name Link Bacteria Connecticut River dl/statewidebacteria/connecticutriver 4000.pdf Nitrogen Long Island Sound and contributing watersheds water_quality/nitrogen_control_progr am/tmdl.pdf Mercury All CT Inland waters dl/tmdl_final/ne_hg_tmdl.pdf Interim Phosphorus Reduction Strategy Phosphorus Certain CT Inland waters er_quality_standards/p/interimmgntp hosstrat_ pdf For more information on these TMDLs or strategies please go to our website 3
4 Stormwater Quality Monitoring Regular monitoring for targeted pollutants in stormwater provides an indication of potential for water quality impacts and helps identify sources and unlawful discharges. Annual monitoring at 6 locations from different areas of town has been a requirement of the MS4 permit since CT DEEP uses that information to evaluate the quality of stormwater and the potential for impacts to surface waters as well as to make sure that stormwater is managed properly. Below are 5 graphs tracking stormwater results submitted by your town for 5 parameters reported under the current MS4 General Permit. The results of each stormwater test submitted to CT DEEP by your town is shown. Individual sample results are shown in grey while the average of the samples collected on a particular day is shown in blue, with a line connecting the averages for the various sample dates. The bars show the statistical range of samples for each day with the red squares showing results which are considered to be outliers, that is, very different from the other samples collected on that day. The chart on the graph lists the sample dates and some basic statistics: Statistic N Mean Standard Deviation (StdDev) Minimum Maximum Description Number of stormwater samples collected on that date Average of the results reported for that sample date A measure of the variability of the results for the sample date The lowest sample result for the sample date The highest sample result for the sample date Bacteria Escherichia coli (E. coli) is a bacteria that lives in the intestines of humans and other warmblooded animals and is used to indicate the presence of fecal matter in surface waters. Some strains of E. coli and other pathogens found in fecal material cause serious illness in people coming in contact with it. For this reason, high amounts of bacteria will cause authorities to close beaches for swimming. Bacteria is measured as the number of colony forming units, or CFU, per 100 ml of water. Any result that was reported as to numerous to count is included on the chart as 800,000 CFU/100 ml. 4
5 Results of annual stormwater monitoring under MS4 permit for E.coli (CFU/ 100 ml of sample) Town of Deep River Individual Value Plot of E. coli by Date Summary Report Distribution of Data by Group Compare the center and the variability across samples. Identify any outliers (marked in red) E. coli /13/06 11/30/09 05/18/10 10/19/11 10/27/11 Date 11/16/11 05/01/12 08/13/14 11/06/14 Individual Value Plot of E. coli by Date Descriptive Statistics Report Date N Mean StDev Minimum Maximum 12/13/ /30/ /18/ /19/ /27/ /16/ /01/ /13/ /06/ To support recreational uses of surface waters, the CT DEEP Water Quality Standards indicate that the average amount of E. coli found in a freshwater water body should be less than 126 CFU/100 ml and that a single sample tested for E. coli should be less than 235 CFU/100 ml at a designated swimming area and less than 410 CFU/100 ml in other areas. Monitoring for E. coli is currently required in the MS4 permit. Enterococci is another bacteria used to indicate the presence of fecal material in salt water environments. For recreation in salt water the Water Quality Standards indicate that average amount of Enterococci should be less than 35 CFU/100 ml in a designated swimming area and that a single sample tested for Enterococci should be less than 104 CFU/100 ml and in all other areas less than 500 CFU/100 ml. These targets have been included in the statewide bacteria TMDLs. In the Draft MS4 permit, E.coli results higher than 235 CFU/100 ml at a designated swimming area or greater than 410 CFU/100 ml in other areas requires a follow-up investigation. Individual stormwater sample results that exceed the applicable single sample maximum value for bacteria could impact water quality, so the associated outfalls should be evaluated for additional stormwater management. 5
6 Total Suspended Solids Total Suspended Solids (TSS) is a measurement of the amount of solids (including sand and silt) found in the stormwater sample. High concentrations of TSS can lower water quality in the receiving stream by transporting various pollutants to the waterbody where they can directly affect aquatic life or affect aquatic life by absorbing light, reducing photosynthesis, and by making the water warmer. TSS can also clog fish gills and smother fish eggs and suffocate the organisms that fish eat. TSS comes from erosion and is found in agricultural, urban and industrial runoff. TSS can be reduced by protecting land from erosion and allowing stormwater time to settle before discharging to surface waters. Results of annual stormwater monitoring under the MS4 general permit for TSS (mg/l) Town of Deep River Individual Value Plot of TSS by Date Summary Report 150 Distribution of Data by Group Compare the center and the variability across samples. Identify any outliers (marked in red). 100 TSS /13/06 11/30/09 05/18/10 10/19/11 10/27/11 Date 11/16/11 05/01/12 08/13/14 11/06/14 Individual Value Plot of TSS by Date Descriptive Statistics Report Date N Mean StDev Minimum Maximum 12/13/ /30/ /18/ /19/ /27/ /16/ /01/ /13/ /06/ Currently, there is not a water quality based target for TSS in stormwater but TSS is a general indicator of water quality and, lower amounts of TSS are better. For comparison purposes, the average MS4 stormwater result reported for TSS by all towns covered by this permit is 48 mg/l. Areas within your town which have elevated TSS may be places to consider additional stormwater management efforts. 6
7 Total Nitrogen Nitrogen is an important nutrient in marine and estuarine waters such as Long Island Sound, as well as a concern in fresh water lakes and rivers. High amounts of nitrogen can lead to excessive growth of water plants and algae which then reduces the amount of oxygen available to living things in these waters. Unlawful discharges, animal waste, failing septic systems, leaves, litter and fertilizers are common sources of high nitrogen in stormwater. Responsible use of fertilizers, maintaining septic systems and proper disposal of pet waste will help reduce nitrogen in stormwater. Results of annual stormwater monitoring under MS4 general permit for total nitrogen (Total N mg/l) Town of Deep River Individual Value Plot of Total N by Date Summary Report 200 Distribution of Data by Group Compare the center and the variability across samples. Identify any outliers (marked in red). Total N /13/06 11/30/09 05/18/10 10/19/11 10/27/11 Date 11/16/11 05/01/12 08/13/14 11/06/14 Individual Value Plot of Total N by Date Descriptive Statistics Report Date N Mean StDev Minimum Maximum 12/13/ /30/ /18/ /19/ /27/ /16/ /01/ /13/ /06/ The TMDL for Long Island Sound requires a 10% reduction of nitrogen in stormwater discharges to prevent low oxygen conditions in Long Island Sound. Each town should be working to reduce the amount of nitrogen in their stormwater to address this issue. Under the current draft MS4 permit, any result for total nitrogen greater than 2.5 mg/l will require a follow-up investigation. Areas within your town which have elevated nitrogen may be places to consider additional stormwater management activities. 7
8 Total Phosphorus Phosphorus is an important nutrient necessary for growth in plants and animals in freshwater. Too much phosphorus in the water can throw off the balance of aquatic ecosystems causing excessive growth of water plants and algae blooms, which reduces the amount of oxygen in the water, potentially harming the fish. Sometimes these algae blooms can contain toxic forms of algae which are harmful to people and animals that come into contact with it. Sources of high phosphorus can be unlawful discharges, fertilizers, litter, leaves, erosion and animal waste. Results of annual stormwater monitoring under MS4 permit for total phosphorus (mg/l) Town of Deep River Individual Value Plot of TP by Date Summary Report 4.5 Distribution of Data by Group Compare the center and the variability across samples. Identify any outliers (marked in red). 3.0 TP /13/06 11/30/09 05/18/10 10/19/11 10/27/11 Date 11/16/11 05/01/12 08/13/14 11/06/14 Individual Value Plot of TP by Date Descriptive Statistics Report Date N Mean StDev Minimum Maximum 12/13/ /30/ /18/ /19/ /27/ /16/ /01/ /13/ /06/ CT DEEP is actively working with many towns to reduce the amount of phosphorus reaching Connecticut s streams and rivers. Under the current draft MS4 permit, a total phosphorus result greater than 0.3 mg/l will require a follow-up investigation. Areas of your town that have elevated levels of phosphorus in the stormwater are good places to develop additional stormwater controls. 8
9 Turbidity Turbidity measures the clarity of the stormwater sample. It measures how much material (soil, algae, pollution, microbes etc.) is suspended in the sample. High turbidity lowers the water quality of a surface water by blocking sunlight for the plants and makes food harder for the fish to find and may be an indication of a higher amounts of other pollution in the water. Surface waters with high turbidity are visually less appealing for recreational use. High turbidity can be caused by erosion, failing septic systems, decaying plants or animals, and excessive algae growth. Turbidity is reported in Nephelometric Turbidity Units (NTU) which is related to how easily light passes through the water sample. Results of annual stormwater monitoring under MS4 permit for turbidity (NTU) Town of Deep River Individual Value Plot of Turbidity by Date Summary Report Distribution of Data by Group Compare the center and the variability across samples. Identify any outliers (marked in red). 75 Turbidity /13/06 11/30/09 05/18/10 10/19/11 10/27/11 Date 11/16/11 05/01/12 08/13/14 11/06/14 Individual Value Plot of Turbidity by Date Descriptive Statistics Report Date N Mean StDev Minimum Maximum 12/13/ /30/ /18/ /19/ /27/ /16/ /01/ /13/ /06/ The Water Quality Standards have a criterion that indicates turbidity should not to exceed 5 NTU above ambient levels. In the draft MS4 permit, a turbidity result greater than 5 NTU over instream conditions will require a follow-up investigation. While there is not a fixed statewide criterion for turbidity, lower results are better for the health of the surface waters in town. Areas with higher levels of turbidity in stormwater would be a good place to develop additional stormwater controls. 9
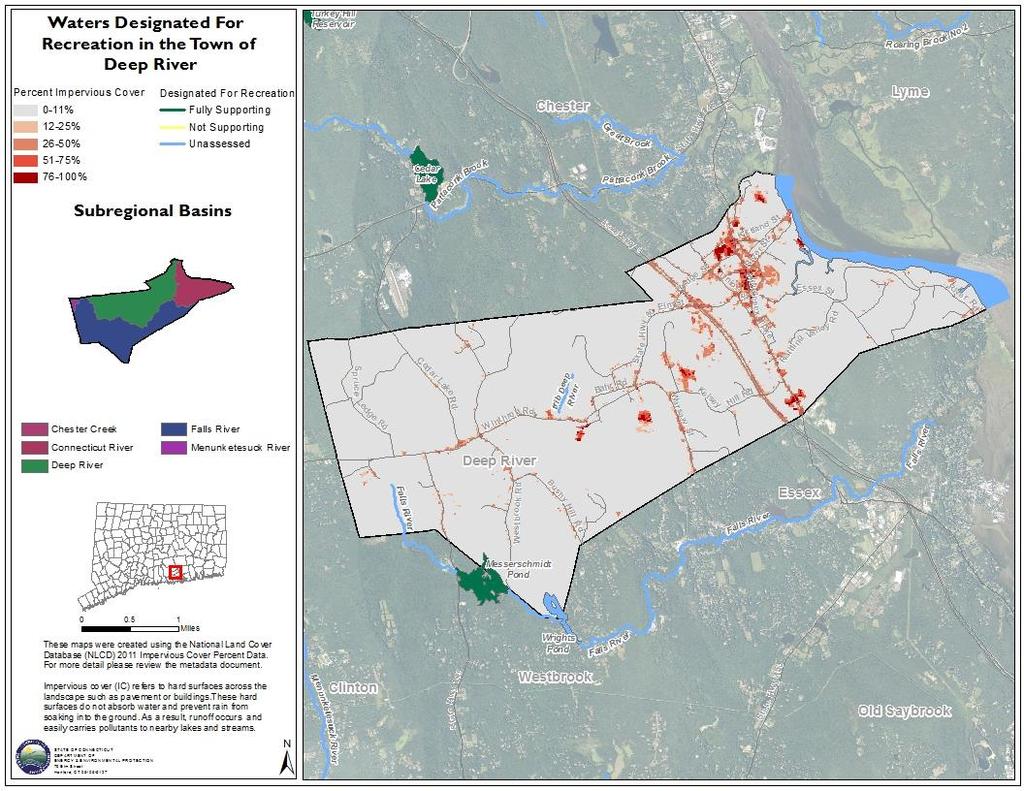
10 Town Maps The following maps were created to show the impervious cover (IC) in your town as well as the water quality in the rivers, streams, lakes and estuaries in and around your town. Impervious Cover on the Town Maps IC is shown in red on the maps. Dark red areas indicate a higher percentage of IC, lighter red areas have less IC, while the grey areas indicate very little or no IC. Water Quality on the Town Maps Separate maps are provided for the different uses of the waterbodies such as Aquatic Life Uses, Recreation, and Shellfishing (in coastal towns). The waterbodies are colored to show the health of the waterbody. Green means that the waterbody meets the water quality requirements to fully support the specified use. Yellow means that water quality is poor and that the specified use is not met. Blue means that there is not enough information to know whether or not water quality is good or bad to support the specified use. Additionally, a small map is provided on the left side of each larger map to show which watersheds are within your town. 10
11 11
12 12
13 13
Factsheet: City of West Haven Water Quality and Stormwater Summary
 79 Elm Street Hartford, CT 06106-5127 www.ct.gov/deep Affirmative Action/Equal Opportunity Employer Factsheet: City of West Haven Water Quality and Stormwater Summary This document was created for each
Factsheet: Town of East Lyme Water Quality and Stormwater Summary
 79 Elm Street Hartford, CT 06106-5127 www.ct.gov/deep Affirmative Action/Equal Opportunity Employer Factsheet: Town of East Lyme Water Quality and Stormwater Summary This document was created for each
Factsheet: Town of Hamden Water Quality and Stormwater Summary
 79 Elm Street Hartford, CT 06106-5127 www.ct.gov/deep Affirmative Action/Equal Opportunity Employer Factsheet: Town of Hamden Water Quality and Stormwater Summary This document was created for each town
Factsheet: Town of Trumbull Water Quality and Stormwater Summary
 79 Elm Street Hartford, CT 06106-5127 www.ct.gov/deep Affirmative Action/Equal Opportunity Employer Factsheet: Town of Trumbull Water Quality and Stormwater Summary This document was created for each town
Environmental Services
 215 Environmental Services River Water Quality Summary for the Twin Cities Metropolitan Area In 215, Metropolitan Council Environmental Services (MCES) river monitoring was conducted at six automated and
Acidity and Alkalinity:
 Evaluation of Pollution Sources to Lake Glenville Quarterly Report December 2018 Kimberlee K Hall, PhD Environmental Health Program, Western Carolina University Summary Chemical and microbial analysis
Beaches and Bacteria. Issuing a Beach Advisory or Closure
 SCIENCE BEHIND THE NEWS Beaches and Bacteria Bacteria Keep Newport News Beach Closed, Newport News Daily Press, June 2, 2004. Beach Closed Again, Fredericksburg Free Lance-Star, June 25, 2004. Norfolk
Environmental Services
 Environmental Services 14 River Water Quality Summary for the Twin Cities Metropolitan Area This document is a summary of the 14 water quality of major rivers in the Twin Cities metropolitan area (metro
Water Monitoring in Spa Creek: A Summary
 Water Monitoring in Spa Creek: A Summary Written by: Alexis Jones & Blake Harden Edited by: Hannah Krauss Water monitoring is very important in order to determine the health of the Chesapeake Bay and its
Impacts to Aquatic Habitats from Land-Use or Is It Polluted?
 Impacts to Aquatic Habitats from Land-Use or Is It Polluted? Water Pollution is: The addition of excessive carbon to a system The addition of large amounts of materials to water that causes adverse changes
PROTECTING OUR WATERWAYS: STORMWATER POLLUTION REDUCTION EFFORTS
 PROTECTING OUR WATERWAYS: STORMWATER POLLUTION REDUCTION EFFORTS Public Information Meeting ~ May 2, 2018 Public Works Stormwater Management Division OVERVIEW Surface Water Quality Protection Municipal
Activity 1: Using the Level of Oxygen- Saturation Chart graph Dissolved Oxygen vs. Temperature at 100% saturation. Start by making a 2 column table.
 Activity 1: Using the Level of Oxygen- Saturation Chart graph Dissolved Oxygen vs. Temperature at 100% saturation. Start by making a 2 column table. Number the first column with temperatures from 0 to
Fact Sheet. Chesapeake Bay Water Quality
 Fact Sheet Chesapeake Bay Water Quality Water quality is a critical measure of the Chesapeake Bay s health. For the Bay to be healthy and productive, the water must be safe for people and must support
Norwalk Harbor Report Card
 Norwalk Harbor Report Card C+ Following the water s trail from your house, into the river, and to the Harbor The way land is used in a watershed has a significant effect on water quality. In areas where
2017 Water Quality Year in Review
 Lake Pontchartrain Basin Foundation Water Quality Program Pontchartrain Basin Sampling Program How Clean is Lake Pontchartrain s Water? 2017 Water Quality Year-in-Review In 2017, LPBF Water Quality Program
DC STORMWATER PLAN CONSOLIDATED TOTAL MAXIMUM DAILY LOAD (TDML) IMPLEMENTATION PLAN
 IMPLEMENTATION PLAN") DC STORMWATER PLAN CONSOLIDATED TOTAL MAXIMUM DAILY LOAD (TDML) IMPLEMENTATION PLAN CONTENTS Introduction 1 The Challenge 5 The Solution 7 Tracking Progress 11 What can you do? 15 INTRODUCTION The DC Stormwater
DC STORMWATER PLAN CONSOLIDATED TOTAL MAXIMUM DAILY LOAD (TDML) IMPLEMENTATION PLAN CONTENTS Introduction 1 The Challenge 5 The Solution 7 Tracking Progress 11 What can you do? 15 INTRODUCTION The DC Stormwater
City of Texarkana, Arkansas. Storm Water Pollution
 City of Texarkana, Arkansas Storm Water Pollution STORM WATER GUIDE What is Storm Water Pollution? Stormwater can provide a toxic discharge which can enter into a lake, river or coastal water system. As
Henderson Watershed WRIA 13. Chapter Includes: Tanglewilde Stormwater Outfall Woodard Creek Woodland Creek
 Henderson Watershed WRIA 13 Chapter Includes: Tanglewilde Stormwater Outfall Woodard Creek Woodland Creek 146 Tanglewilde Stormwater Outfall PART OF HENDERSON WATERSHED PRIMARY LAND USES: Urban residential
Santa Rosa Creek Water Quality Results 2004
 Santa Rosa Creek Water Quality Results 24 Community Clean Water Institute Site Description: SRC4: Off 3rd Street in downtown Santa Rosa. Behind the Vineyard Hotel just West of Highway 11 along the Prince
Water Quality in the Upper Cohansey Watershed
 Slide 1 Water Quality in the Upper Cohansey Watershed Salvatore Mangiafico County Environmental and Resource Management Agent Cooperative Extension of Salem and Cumberland Counties This talk will present
Water Pollution and Water Quality (Nazaroff & Alvarez-Cohen, Sections 6.A and 6.B) (with additional materials)
 (with additional materials)") Water Pollution and Water Quality (Nazaroff & Alvarez-Cohen, Sections 6.A and 6.B) (with additional materials) Water is a basic necessity of nature and humans. We use water for: -drinking - food preparation
Water Pollution and Water Quality (Nazaroff & Alvarez-Cohen, Sections 6.A and 6.B) (with additional materials) Water is a basic necessity of nature and humans. We use water for: -drinking - food preparation
South Carolina Water Quality Standards. Heather Preston DHEC Bureau of Water October 14, 2008
 South Carolina Water Quality Standards Heather Preston DHEC Bureau of Water October 14, 2008 The Water Quality Standards 303 (c) of the Clean Water Act requires all states to have water quality standards
Narrow River Water Quality: Trends and Findings Spanning a Quarter Century!
 Narrow River Water Quality: Trends and Findings Spanning a Quarter Century! By Annette DeSilva and Veronica Berounsky In 1992, NRPA kicked off their River Watch program and since that time volunteers have
Phosphorus Goal Setting Process Questions and Answers 2010
 Lake Winnipesaukee Watershed Management Plan Phase I: Meredith, Paugus, Saunders Bays 1. What is phosphorus? Phosphorus (P) is a naturally occurring element and a major nutrient required for biological
Water Quality Assessment for the Town of Caswell Beach, 2008
 Water Quality Assessment for the Town of Caswell Beach, 2008 UNCW-CMS Report 08-02 Report to: Town of Caswell Beach 1100 Caswell Beach Rd. c/o Mr. Jim Carter, Town Administrator Caswell Beach, N.C. 28465
Mr. Leach Science Burrillville High School
 Mr. Leach Science Burrillville High School The Clear River subwatershed, is located in northwestern Rhode Island. This subwatershed is a component of the Lower Blackstone River Watershed, the Blackstone
The Clean Water Act: Phase I
 Nearly 40 percent of all surveyed bodies of water in the U.S. do not meet the Environmental Protection Agency s (EPA s) water quality standards because of untreated polluted runoff that is often discharged
Linda Cooper, Eno River State Park, Durham, NC
 Linda Cooper, Eno River State Park, Durham, NC 2 Rivers and Streams All 50 states, 2 interstate river commissions, American Samoa, Guam, Puerto Rico, the District of Columbia (collectively referred to
Nonpoint Source Pollution A Challenge to Control
 Nonpoint Source Pollution A Challenge to Control Connecticut Envirothon Aquatics Workshop January 14, 2017 Presented by Denise Savageau Conservation Director, Town of Greenwich Point Source Pollution is
Long Prairie River Watershed Restoration and Protection Strategies (WRAPS) Report Summary
 Report Summary") Long Prairie River Watershed Restoration and Protection Strategies (WRAPS) Report Summary Minnesota has adopted a watershed approach to address the state s 80 major watersheds (denoted by 8-digit hydrologic
Long Prairie River Watershed Restoration and Protection Strategies (WRAPS) Report Summary Minnesota has adopted a watershed approach to address the state s 80 major watersheds (denoted by 8-digit hydrologic
Presentation to Surfside Stormwater Committee. 8/21/2012 Ken Harth, Surfside Beach VM Field Leader Susan Libes, Coastal Carolina University
 Presentation to Surfside Stormwater Committee 8/21/2012 Ken Harth, Surfside Beach VM Field Leader Susan Libes, Coastal Carolina University Surfside Volunteer Water Quality Monitoring Program Goals Why
Water Pollution Overview. Sewage dumping
 Water Pollution Water Pollution Overview Sewage dumping Ocean Pollution Water Pollution Overview Urban Water Pollution Water Pollution Overview Water Pollution Overview Urban Runoff Water Pollution Overview
Pollutants in our Waters
 Pollutants in our Waters CARIWIN Advanced Course in IWRM September 17, 2007 Apurva Gollamudi Brace Centre for Water Resources Management McGill University It isn t the pollution that s harming the environment.
PROTECTING THE WACCAMAW WATERSHED. Water Quality Monitoring. Christine Ellis. Waccamaw RIVERKEEPER A Program of Winyah Rivers Foundation
 PROTECTING THE WACCAMAW WATERSHED Water Quality Monitoring Christine Ellis Waccamaw RIVERKEEPER A Program of Winyah Rivers Foundation Focusing on the Waccamaw Waccamaw RIVERKEEPER Program Citizen-Based
Redwood Shores Lagoon August Monthly Water Quality Monitoring Report
 Redwood Shores Lagoon August Monthly Water Quality Monitoring Report Prepared for Redwood City Public Works Services Department 1400 Broadway Redwood City, CA 94063-2594 Prepared by Clean Lakes, Inc. P.
River Monitoring and Water Resource Terms
 River Monitoring and Water Resource Terms Baseflow: River discharge or flow composed of ground water drainage and delayed surface drainage. Baseflow is typically characterized as that portion of river
WATER QUALITY MONITORING IN THE LOXAHATCHEE ESTUARY
 WATER QUALITY MONITORING IN THE LOXAHATCHEE ESTUARY Rebecca Wilder Town of Jupiter Utilities Bud Howard Loxahatchee River District TOWN OF JUPITER UTILITIES PRESENTATION OUTLINE Loxahatchee River District
subsurface gases, it oozes rather than flows. "Anyone who falls into the Cuyahoga does not drown," Time Magazine, August 1969
 STORM WATER POLLUTION PREVENTION Some river! Chocolate-brown, oily, bubbling bbli with subsurface gases, it oozes rather than flows. "Anyone who falls into the Cuyahoga does not drown," Cleveland's citizens
Water Quality indicators and How Human Activities Affect Water Quality
 Water Quality indicators and How Human Activities Affect Water Quality Name: Online Assignment: Period: Date: Purpose: to learn how to evaluate water quality and how pollution can make water unavailable
Stormwater Management in Your Backyard: Stormwater 101
 Stormwater Management in Your Backyard: Stormwater 101 Gregory Rusciano Program Associate, Water Resources Rutgers Cooperative Extension New Jersey Sea Grant Extension Program How much water do we have?
Water Quality: Is Our Bay Safe?
 Grades 7-10 : Is Our Bay Safe? Background. Pollution is change in the estuary environment that has a negative impact on any of the living things in the estuary. The quality of an estuary can be measured
2009 Columbia River Water Quality Monitoring Data Report
 2009 Columbia River Water Quality Monitoring Data Report Table of Contents Page Introduction......3 Map of Columbia Basin....4 Maps of Portland and Wenatchee Area Sites..5 Maps or Columbia Gorge East and
Science Enhanced Scope and Sequence Grade 6. Water Quality
 Water Quality Strand Topic Living Systems Investigating water quality Primary SOL 6.7 The student will investigate and understand the natural processes and human interactions that affect watershed systems.
New Hampshire s Impaired Waterbodies and BMP s for Treating Nitrogen and Phosphorus
 New Hampshire s Impaired Waterbodies and BMP s for Treating Nitrogen and Phosphorus Bethann McCarthy, P.E. Alteration of Terrain Bureau Deb Loiselle Watershed Assistance Section Let s start from the beginning
Water Quality Monitoring in the Upper Winooski River Headwaters 2017
 Water Quality Monitoring in the Upper Winooski River Headwaters 2017 E. coli, chloride, alkalinity, phosphorus, nitrogen, and turbidity levels in the streams of Cabot-Marshfield-Plainfield Elderberry plantings
Redwood Shores Lagoon November 2016 Monthly Water Quality Monitoring Report
 Redwood Shores Lagoon November 2016 Monthly Water Quality Monitoring Report Prepared for Redwood City Public Works Services Department 1400 Broadway Redwood City, CA 94063-2594 Prepared by Clean Lakes,
Redwood Shores Lagoon February 2019 Monthly Water Quality Monitoring Report
 Redwood Shores Lagoon February 2019 Monthly Water Quality Monitoring Report Prepared for Redwood City Public Works Services Department 1400 Broadway Redwood City, CA 94063-2594 Prepared by Clean Lakes,
TOOLS FOR MS4s: REGULATIONS FOR E. COLI
 INTRODUCTION Fecal indicator bacteria, such as E. coli (Escherichia coli), are used to determine whether streams and lakes are suitable for recreational use. Most E. coli bacteria are harmless, occur naturally
Oso Creek and Oso Bay Data Report
 Oso Creek and Oso Bay Data Report February 2011 Prepared by: Texas Stream Team River Systems Institute Texas State University San Marcos This report was prepared in cooperation with the Texas Commission
Contractors, Illicit Discharges, & Best Management Practices. Chris Allen Stormwater Inspector
 Contractors, Illicit Discharges, & Best Management Practices Chris Allen Stormwater Inspector What is an Illicit Discharge? Georgetown County Stormwater Ordinance defines an Illicit Discharge as: Any activity
MEMORANDUM Project Specific:
 Information Only MEMORANDUM Project Specific: 5-829-007 Policy Memo - File With TO: Robert Flaherty, Bullitt County Deputy Judge Executive FROM: Adam Connelly DATE: RE: 2006 Wet Weather Water Quality Monitoring
Introduction to Water Quality Parameters
 Introduction to Water Quality Parameters Directions: Your group will be assigned one or two Water Quality (WQ) parameters to read about and present to the class. 1. Read the explanations for your assigned
Monitoring Stormwater Best Management Practices: Why Is It Important and What To Monitor
 Monitoring Stormwater Best Management Practices: Why Is It Important and What To Monitor Scott D. Struck, Ph.D. US EPA, Urban Watershed Management Branch New Jersey Water Monitoring Workshop 4/20/2006
Aquatic Science Unit 2. Water Quality and Water Pollution
 Aquatic Science Unit 2 Water Quality and Water Pollution What is a healthy water body? In your own words, take a moment to describe what you believe are some of the characteristics of a healthy stream
Understanding the 2014 NC Water Quality Assessment for the Integrated Report / 305(b)
") Understanding the 2014 NC Water Quality Assessment for the Integrated Report / 305(b) The Integrated Report/305(b) 1. Assessment Unit (AU) description information 2. AU water quality parameter assessment
Understanding the 2014 NC Water Quality Assessment for the Integrated Report / 305(b) The Integrated Report/305(b) 1. Assessment Unit (AU) description information 2. AU water quality parameter assessment
Redwood Shores Lagoon May 2017 Monthly Water Quality Monitoring Report
 Redwood Shores Lagoon May 2017 Monthly Water Quality Monitoring Report Prepared for Redwood City Public Works Services Department 1400 Broadway Redwood City, CA 94063-2594 Prepared by Clean Lakes, Inc.
Water Pollution. Chapter 20
 Water Pollution Chapter 20 Water Pollution Comes from Point and Nonpoint Sources Water pollution Any chemical, biological, or physical change in water quality that harms living organisms or makes water
Water Chemistry Monitoring
 Chicago River Fieldtrip Activity Summary Students use basic to advanced water quality monitoring kits and probes to assess the water quality of the Chicago River. Water chemistry kits available for loan
Indian River Lagoon (IRL) Basin Management Action Plans (BMAPs) Fact Sheet
 Basin Management Action Plans (BMAPs) Fact Sheet") Indian River Lagoon (IRL) Basin Management Action Plans (BMAPs) Fact Sheet Improving Water Quality and Seagrass Bed Coverage in the Lagoon Overview of Total Maximum Daily Loads A Total Maximum Daily Load
Indian River Lagoon (IRL) Basin Management Action Plans (BMAPs) Fact Sheet Improving Water Quality and Seagrass Bed Coverage in the Lagoon Overview of Total Maximum Daily Loads A Total Maximum Daily Load
Lake Washington. Water Quality Assessment Report. Copyright 2012 PLM Lake & Land Management Corp.
 Lake Washington 2012 Water Quality Assessment Report Copyright 2012 PLM Lake & Land Management Corp. Water Quality Report On May 22nd, June 18th, July 30th, August 29th, and September 27 th, 2012, PLM
City of Daphne, Alabama Water Quality Monitoring Plan For Phase II MS4
 City of Daphne, Alabama Water Quality Monitoring Plan For Phase II MS4 2016-2021 Permit # ALR 040039, Expiration Date: September 30, 2021 I. Introduction This document presents the City of Daphne s Stormwater
The Status of Pompeston Creek, : From Data to Action. Pompeston Creek Watershed Association
 Pompeston Creek Watershed Association P.O. Box 2883 Cinnaminson, NJ 08077 (856) 235-9204 www.pompestoncreek.org The Status of Pompeston Creek, 1998-2008: From Data to Action Pompeston Creek Watershed Association
PRESENTATION OUTLINE. Stormwater Program Update Stormwater Overview. Education Program Discussion. Sources and consequences of pollutants
 PRESENTATION OUTLINE Stormwater Program Update Stormwater Overview Sources and consequences of pollutants Education Program Discussion Why Stormwater? 1972 Clean Water Act Established permitting program
Chapter 3 Water Quality Assessment
 Chapter 3 Water Quality Assessment High quality water is more than the dream of the conservationists, more than a political slogan; high quality water, in the right quantity at the right place at the right
Florida Watersheds Video Southwest Florida Water Management District
 Teacher s Guide Florida Watersheds Video Download at: http://www.watermatters.org/watershedvideo Middle School Video Length: 11 minutes Lesson Time: One block or class period (approximately 45 minutes)
The Next Generation of Stormwater Management and Site Design. Melanie R. Grigsby, P.E. Stormwater Resource Manager, City of Fort Myers
 The Next Generation of Stormwater Management and Site Design Melanie R. Grigsby, P.E. Stormwater Resource Manager, City of Fort Myers History of WMD Stormwater Rule Florida passed the first rule requiring
Coastal Wetlands. About Coastal Wetlands. Contact Us. Water: Wetlands. You are here: Water Our Waters Wetlands Coastal Wetlands
 Contact Us Water: Wetlands You are here: Water Our Waters Wetlands Coastal Wetlands Coastal Wetlands About Coastal Wetlands Coastal Wetlands Initiative Managing Stressors Tools & Links About Coastal Wetlands
Transparency A Water Clarity Measure
 Volunteer Monitoring Factsheet Series 2010 Transparency A Water Clarity Measure Why are we concerned? Water clarity is one of the most obvious measures of water quality. Water clarity can be a useful indicator
Los Angeles Fresh Water Testing LAB
 Los Angeles Fresh Water Testing LAB Background: Freshwater is placed in Los Angeles from precipitation. The water either goes into the ground (which percolates into groundwater reservoirs) or runs off
FINAL 2014 BACTERIAL AND TURBIDITY TOTAL MAXIMUM DAILY LOADS FOR OKLAHOMA STREAMS IN THE LOWER ARKANSAS RIVER AREA (OK220100, OK220200, OK220600)
") FINAL 2014 BACTERIAL AND TURBIDITY TOTAL MAXIMUM DAILY LOADS FOR OKLAHOMA STREAMS IN THE LOWER ARKANSAS RIVER AREA (OK220100, OK220200, OK220600) Oklahoma Waterbody Identification Numbers Poteau River
FINAL 2014 BACTERIAL AND TURBIDITY TOTAL MAXIMUM DAILY LOADS FOR OKLAHOMA STREAMS IN THE LOWER ARKANSAS RIVER AREA (OK220100, OK220200, OK220600) Oklahoma Waterbody Identification Numbers Poteau River
The effects of pollution. What is stormwater runoff? Why is stormwater runoff a problem?
 What is stormwater runoff? Stormwater runoff occurs when precipitation from rain or snowmelt flows over the ground. Impervious surfaces like driveways, sidewalks, and streets prevent stormwater from naturally
Summary. River. 5 th 8 th. about the. Chemical. anteceden. Grade Level: 5 th. 12 th. Objectives: instructions to. determine the. Chicago River Field
 Water Chemistry Monitoring Chicago River Field Trip Activity Summary Students use basic to advanced water quality monitoring kits and probes to assess the water quality of the Chicago River. Water chemistry
Water Resources/Water Quality
 Water Resources/Water Quality From where does your drinking water come? How much land should be set aside for aquifer protection? Why should we care about Barton Springs? What are the effects (if any!)
Water Quality. New Standards on the Way? by Marty P. Lamia and Albert R. Capellini, P.E., BCEE
 Water Quality New Standards on the Way? by Marty P. Lamia and Albert R. Capellini, P.E., BCEE Water quality is a critical component having a direct effect on the physical and economic well-being of the
OKLAHOMA DEPARTMENT OF ENVIRONMENTAL QUALITY
 FINAL 2014 BACTERIAL AND TURBIDITY TOTAL MAXIMUM DAILY LOADS FOR OKLAHOMA STREAMS IN THE ARKANSAS RIVER AND NORTH CANADIAN RIVER STUDY AREA (OK621200, OK621210, OK720500) Oklahoma Waterbody Identification
Cut lines. Definition: Source Examples: Common examples
 (name with color banner for parameter type Chemical (yellow), Biological (green) or physical (blue) (name with color banner for parameter type Chemical (yellow), Biological (green) or physical (blue) Common
DNR Coastal Resources Division Coastal Resources Management Programs. Brad Gane Assistant Director Coastal Resources Division
 DNR Coastal Resources Division Coastal Resources Management Programs Brad Gane Assistant Director Coastal Resources Division Ecological Services Section Coastal Management Coastal Incentive Grants Water
GULF OF MEXICO - SEGMENT 2501
 GULF OF MEXICO - SEGMENT 2501 GULF OF MEXICO - SEGMENT 2501 LAND COVER BACTERIA CHLOROPHYLL A Impairment Concern No Impairments or Concerns GULF OF MEXICO - SEGMENT 2501 OTHER IMPAIRMENTS Bays & Estuaries
City of Fairmont Storm Water Pollution Prevention Plan (SWPPP) January 23, 2017
 January 23, 2017") City of Fairmont Storm Water Pollution Prevention Plan (SWPPP) January 23, 2017 Why is Water Quality Important? Water has always been important to Minnesota and is a key part of our history, culture, economy
City of Fairmont Storm Water Pollution Prevention Plan (SWPPP) January 23, 2017 Why is Water Quality Important? Water has always been important to Minnesota and is a key part of our history, culture, economy
Municipal Stormwater Management Plan Prepared For The Borough of Cape May Point By Van Note-Harvey Associates VNH File No.
 Municipal Stormwater Management Plan Prepared For The Borough of Cape May Point By Van Note-Harvey Associates 2005 VNH File No. 35317-210-21 Table of Contents Introduction... 3 Goals... 3 Storm water Discussion...
Anthropogenic Impacts on Bays and Watersheds. HI-MOES Presentation 2009 The Kohala Center Kohala Watershed Partnership
 Anthropogenic Impacts on Bays and Watersheds HI-MOES Presentation 2009 The Kohala Center Kohala Watershed Partnership Some Common Terms Watershed = An area of land that drains into a common destination
OKLAHOMA DEPARTMENT OF ENVIRONMENTAL QUALITY PUBLIC NOTICE. July 23, 2010
 Steve Thompson Executive Director Brad Henry Governor OKLAHOMA DEPARTMENT OF ENVIRONMENTAL QUALITY PUBLIC NOTICE July 23, 2010 AVAILABILITY OF DRAFT BACTERIA AND TURBIDITY TMDLS FOR THE BEAVER RIVER WATERSHED
Sediment & Bacteria TMDL Technical Advisory Groups in Georgia
 Sediment & Bacteria TMDL Technical Advisory Groups in Georgia William R. Bumback, David E. Radcliffe,, & L. Mark Risse University of Georgia Outline Short history of TAG Bacteria white paper draft Bacteria
Water Quality: The Basics
 Water Quality: The Basics Environmental Science Why is Water Quality Important? Effects all humans Safe drinking water Allows for food productions and SAFE food products Effects Wildlife Health domestic
WASA Quiz Review. Chapter 2
 WASA Quiz Review Chapter 2 Question#1 What is surface runoff? part of the water cycle that flows over land as surface water instead of being absorbed into groundwater or evaporating Question #2 What are
OKLAHOMA DEPARTMENT OF ENVIRONMENTAL QUALITY PUBLIC NOTICE. July 15, 2010
 Steve Thompson Executive Director Brad Henry Governor OKLAHOMA DEPARTMENT OF ENVIRONMENTAL QUALITY PUBLIC NOTICE July 15, 2010 AVAILABILITY OF DRAFT BACTERIA AND TURBIDITY TMDLS FOR THE WASHITA RIVER STUDY
Water Quality in Stormwater Ponds
 Water Quality in Stormwater Ponds Linking Nutrients, Algae and Dissolved Oxygen Erik M. Smith University of South Carolina, Baruch Marine Field Laboratory North Inlet - Winyah Bay National Estuarine Research
CHOWDER TALK OCTOBER 15, 2013
 CHOWDER TALK OCTOBER 15, 213 1 Murrells Inlet Volunteer Water Monitoring Program 25: 33d List Impaired Waters Chronic fecal coliform pollution TMDL issued for 8 sites in Murrells Inlet Mandate: 8% load
FINAL 2012 BACTERIA AND TURBIDITY TOTAL MAXIMUM DAILY LOADS FOR THE RED RIVER, OKLAHOMA (OK311100, OK311200, OK311210, OK311510, OK311600, OK311800)
") FINAL 2012 BACTERIA AND TURBIDITY TOTAL MAXIMUM DAILY LOADS FOR THE RED RIVER, OKLAHOMA (OK311100, OK311200, OK311210, OK311510, OK311600, OK311800) Prepared for: OKLAHOMA DEPARTMENT OF ENVIRONMENTAL QUALITY
FINAL 2012 BACTERIA AND TURBIDITY TOTAL MAXIMUM DAILY LOADS FOR THE RED RIVER, OKLAHOMA (OK311100, OK311200, OK311210, OK311510, OK311600, OK311800) Prepared for: OKLAHOMA DEPARTMENT OF ENVIRONMENTAL QUALITY
TMDL Report for Chesapeake Bay Shellfish Waters: Ware Creek, Taskinas Creek, and Skimino Creek Bacterial Impairments (VADEQ, 2010)
") As part of a long term commitment to environmental stewardship, James City County volunteers and staff have been gathering information about stream health throughout the County since 2008. The goal of
As part of a long term commitment to environmental stewardship, James City County volunteers and staff have been gathering information about stream health throughout the County since 2008. The goal of
Town of Brewster, Massachusetts. Integrated Water Resource Management Plan (IWRMP) Community Meeting No. 3 10:00 AM Saturday September 11, 2010
 Community Meeting No. 3 10:00 AM Saturday September 11, 2010") Town of Brewster, Massachusetts Integrated Water Resource Management Plan (IWRMP) Community Meeting No. 3 10:00 AM Saturday September 11, 2010 Welcome by: Comprehensive Water Planning Committee (CWPC)
Town of Brewster, Massachusetts Integrated Water Resource Management Plan (IWRMP) Community Meeting No. 3 10:00 AM Saturday September 11, 2010 Welcome by: Comprehensive Water Planning Committee (CWPC)
Selena Medrano Water Quality Management Planning
 Selena Medrano Water Quality Management Planning Management Services Legal Fiscal Computer Public Outreach and Education Hazardous Waste Solid Waste Technical Services Mining Air Water Clean Water Act
REQUEST FOR COUNCIL ACTION. Lake Augusta Alum Treatment Lower Mississippi Watershed Management Org. COMMENT:
 REQUEST FOR COUNCIL ACTION DATE: March 7, 2017 TO: FROM: SUBJECT: Mayor, City Council, and City Administrator Ryan Ruzek, P.E., Public Works Director Lake Augusta Alum Treatment Lower Mississippi Watershed
Some Context behind the Implementation of Numeric Nutrient Criteria or Why do we have these Water Quality Regulations?
 Some Context behind the Implementation of Numeric Nutrient Criteria or Why do we have these Water Quality Regulations? Mark W. Clark and Thomas Obreza Soil and Water Science Department University of Florida,
Sebago Lake STATE OF THE LAKE REPORT 2015
 Sebago Lake STATE OF THE LAKE REPORT 2015 PORTLAND WATER DISTRICT 225 DOUGLASS ST / PO 3553 PORTLAND, ME O4104 207.774.5961 WWW.PWD.ORG SEBAGOLAKE@PWD.ORG PHOTO: KATHY MAXSIMIC Introduction Sebago Lake
MS4 Assessment Program to Satisfy Part V. Monitoring Requirements
 MS4 Assessment Program to Satisfy Part V. Monitoring Requirements Submitted by City of Boynton Beach MS4 Permit No. FLS000018-004 The purpose of this document is to outline the City of Boynton Beach Stormwater
OKLAHOMA DEPARTMENT OF ENVIRONMENTAL QUALITY PUBLIC NOTICE. June 24, 2010 AVAILABILITY OF DRAFT BACTERIA TMDL FOR THE BIRD CREEK AREA WATERSHED
 Steve Thompson Executive Director OKLAHOMA DEPARTMENT OF ENVIRONMENTAL QUALITY Brad Henry Governor PUBLIC NOTICE June 24, 2010 AVAILABILITY OF DRAFT BACTERIA TMDL FOR THE BIRD CREEK AREA WATERSHED REQUEST
Lawn and Landscape Management
 Recent tadvances in Lawn and Landscape Management April 24, 2008 Coastal Institute University of Rhode Island Kingston, RI The Storm Water Phase II Education and Outreach Project Acknowledgments The Storm
Draft Bacteria Total Maximum Daily Load Action Plan
 Draft Bacteria Total Maximum Daily Load Action Plan Public Works Department VSMP MS4 Permit # VA0088676 DRAFT June 12, 2018 Draft Bacteria Total Maximum Daily Load Action Plan (Permit VA0088676) Table
Low Dissolved Oxygen HYPOXIA. What is Hypoxia?
 HYPOXIA Low Dissolved Oxygen What is Hypoxia? Hypoxia or low dissolved oxygen has been identified as the most critical issue facing the Sound. Just as we breathe oxygen, the fish and other marine life