Overview Gas & NGL Processing
|
|
|
- Neil Griffin
- 6 years ago
- Views:
Transcription
1 Overview Gas & NGL Processing
2 Topics Energy consumption & natural gas s place Natural gas sources Relationship with petroleum Basic economics of natural gas & NGL Trends for prices What are appropriate margins for the industry? Gas processing as part of total production system 2
3 Energy consumption & natural gas s place
4 Growth of U.S. Energy Consumption Energy Consumed (Quad = BTU) Wood Hydroelectric Power Nuclear Electric Power Coal Natural Gas Petroleum Source: , Energy Perspectives: A Presentation of Major Energy and Energy-Related Data, U.S. Department of the Interior, 1975; , Annual Energy Review 2011, Table
5 World Energy Consumption by Source Growth will not be uniform among all energy sources Renewable & nuclear power projected to be fastestgrowing energy sources, increasing by 2.5% per year Natural gas fastest growing fossil fuel, increasing by 1.7% per year Coal grows faster than petroleum because of China s increasing consumption Source: International Energy Outlook 2013, U.S. Energy Information Agency 5
6 Energy Markets Are Interconnected 6


7 Origins of Oil & Gas Organic life buried in sedimentary rock Transformation to hydrocarbons Migration from source rocks Accumulation of oil & gas Flow of oil & gas through porous media 7


8 Petroleum & Natural Gas Consumption influenced by production & cost of fuels 8

9 Flow of Natural Gas in U.S. Natural Gas Annual,

10 Overview of Natural Gas Gathering & Processing Fundamentals of Natural Gas Processing, 2 nd ed. Kidnay, Parrish, & McCartney 10
11 Natural Gas Resources Petroleum & natural gas formed from decomposing organic matter in source rock Conventional gas & liquids migrate through permeable rock toward the surface until it is stopped by some trapping mechanism Unconventional gas & liquids are trapped at the source rock because of extremely low permeabilities Dec. 5, 2012 update, 11

12 North American Conventional Gas Fields 12

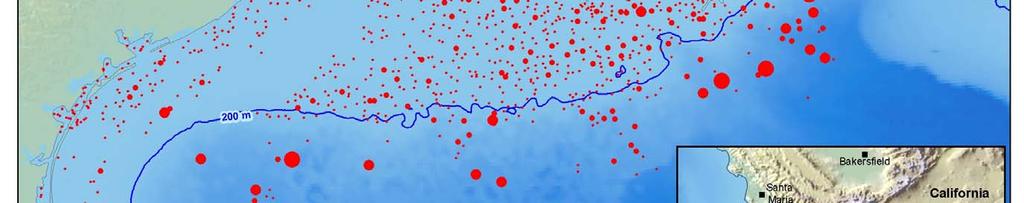
13 North American Offshore Gas Fields 13

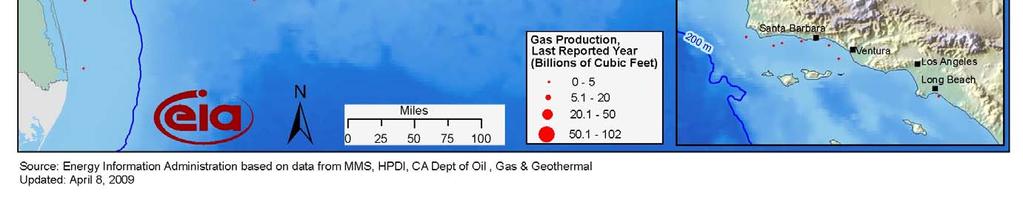
14 North American Shale Gas Plays 14

15 Marcellus & Utica Shale Formation Map 15

16 Worldwide Shale Oil & Gas Shale oil & gas have the potential to dramatically alter world energy markets Source: Supplemental presentation is support of International Energy Outlook 2013, U.S. Energy Information Agency 16

17 Expected Natural Gas Production by Source Retrieved November 26,

18 U.S. Gas Processing & Transportation U.S. Energy Mapping System, retrieved January 10,

19 Gas Plants Capacities in U.S. Lower


20 U.S. Gas Transportation, Storage, & Terminals U.S. Energy Mapping System, retrieved December 31,

21 Interstate Natural Gas Flow Natural Gas Annual,
22 Basic economics of natural gas & NGL
23 Energy & Oil Prices Prices retrieved January 1,

24 Energy & Oil Prices Prices retrieved January 1,
25 Price Changes With Time Prices updated January 1, 2018 Sources: & 25
26 Price Changes With Time Prices updated January 1, 2018 Sources: & 26
27 No Such Thing as a Global Gas Price 27
28 NGLs Can Bring Value Prices updated January 1, 2018 Sources: & 28
29 NGLs Can Bring Value Prices updated January 1, 2018 Sources: & 29
30 NGLs Can Bring Value Prices updated January 1, 2018 Sources: & 30
31 Economic Spreads NGL Frac spread Difference between the value of components in NGL vs. retaining in the natural gas Frac Spread = (Value as liquid product) (Value as component of natural gas) Can include value of mixture of C 2, C 3, ic 4, nc 4, & C 5 + Can be tailored to meet actual NGL compositions Some prices may be difficult to obtain on a daily basis o NYMEX C 2, C 3, nc 4, & C 5+ from Can be expressed as $/MMBtu (ideal gas heating value) or $/bbl (NGL volume) Make use of values for standard liquid density & heating value NGL frac spread requires a definition for NGL composition Spark spread More important to electricity producer rather than gas processor Gross margin of a gas-fired power plant selling a unit of electricity having bought the fuel to produce it 31


32 Example Propane Frac Spread Using (Last) February values: Propane - $ per gal Natural gas - $3.300 per MMBtu Propane conversion factors: 91,563 Btu/gal ideal gas gross heating value & standard liquid density Calculation: Btu 1, 000, 000 $ MMBtu $ Spread gal Btu MMBtu 91, 563 gal $4.372 per MMBtu Values retrieved January 10,
33 NGLs Can Bring Value Prices updated January 1, 2018 Sources: & 33
34 NGLs Can Bring Value Prices updated January 1, 2018 Sources: & 34
35 Gas processing as part of total production system
36 Total Production System CO for EOR 2 Gas Lift and Injection Sales Gas to Pipeline Crude Oil Gas Processing Module Ethane Propane N-Butane LPG I-Butane Natural Gasoline Plant Condensate Sulfur NGLs Field Condensate Compression (optional) Field Treating (optional) Solution Gas Production Separators Oil Well Gas Well Production Separators Gas Well Gas Cap or Associated Gas Non-associated Gas Oil Water Water Water J.M. Campbell & Company Adapted from Gas Processors Association (GPA), Tulsa, Oklahoma 36
37 Overview of Gas Plant Processing Fundamentals of Natural Gas Processing Kidnay, Parish, & McCartney, CRC Press,
38 Summary
39 Summary Natural gas supplies nearly 30% of the US s energy Contribution expected to continue to grow Production May be associated with petroleum production Unconventional sources shale & coal Primary distribution via pipelines Gas processing near the mouth of the pipeline system NGLs bring value Comparison is the value as a liquid vs the heating value as part of the natural gas 39
40 Supplemental Slides

41 How do energy prices compare? 41
LSU Natural Gas Conference
 LSU Natural Gas Conference Presented by: Bob Purgason VP Gulfcoast Region Williams Companies Introduction Structural shift in natural gas pricing The crude to gas ratio: A critical relationship for NGL
AIChE: Natural Gas Utilization Workshop Overcoming Hurdles of Technology Implementation
 AIChE: Natural Gas Utilization Workshop Overcoming Hurdles of Technology Implementation Natural Gas in the United States: An Overview of Resources and Factors Affecting the Market November 2, 216 Justin
North American Midstream Infrastructure Through 2035 A Secure Energy Future. Press Briefing June 28, 2011
 North American Midstream Infrastructure Through 2035 A Secure Energy Future Press Briefing June 28, 2011 Disclaimer This presentation presents views of ICF International and the INGAA Foundation. The presentation
Annual Energy Outlook 2015
 Annual Energy Outlook 215 for Asia Pacific Energy Research Centre Annual Conference 215 Tokyo, Japan by Sam Napolitano Director of the Office of Integrated and International Energy Analysis U.S. Energy
Perspectives on the Impact of Shale Gas and Tight Oil Production on the Global E&C Industry and Vice Versa
 214 RICE GLOBAL E&C ANNUAL FORUM Perspectives on the Impact of Shale Gas and Tight Oil Production on the Global E&C Industry and Vice Versa September 23, 214 www.forum.rice.edu Today s objectives Review
UNDERSTANDING NATURAL GAS MARKETS. Mohammad Naserifard MSc student of Oil & Gas Economics at PUT Fall 2015
 UNDERSTANDING NATURAL GAS MARKETS Mohammad Naserifard MSc student of Oil & Gas Economics at PUT Fall 2015 Table of Contents 3 Overview Natural Gas is an Important Source of Energy for the United States.
Shale Gas Treatment Challenges and Requirements
 Shale Gas Treatment Challenges and Requirements Hanbing Ding 13 th U.S.-China Oil & Gas Industry Forum September 25, 2013 Xi an, China 2013 UOP LLC. All rights reserved. Honeywell s Businesses $37.6 billion
The New Superpower : Emerging Supplies of Gas Liquids from the United States
 The New Superpower : Emerging Supplies of Gas Liquids from the United States Lucian Pugliaresi President Energy Policy Research Foundation, Inc. Washington, DC Energy Policy Research Foundation, Inc. 1031
An INDEPENDENT energy consulting company since 1996 No affiliation with any marketer, broker, agent, utility, pipeline or producer.
 An INDEPENDENT energy consulting company since 1996 No affiliation with any marketer, broker, agent, utility, pipeline or producer. More than two decades of experience in the natural gas and electric industries
CGL Production and Export Facilities
 CGL Production and Export Facilities CGL Transportation CGL Receiving Terminals Building Great Projects: SeaOne Fuels Supply CG/LA 10 th North American Leadership Forum Presentation by Forrest E. Hoglund
Petroleum & Natural Gas Engineering (PNGE) Penn State University
 Penn State University") Petroleum & Natural Gas Engineering (PNGE) Penn State University PNGE Quick Facts Slide 2 Penn State PNGE ranked top-tier program 4 th in the world for petroleum engineering programs by CEOWORLD magazine
Petroleum & Natural Gas Engineering (PNGE) Penn State University PNGE Quick Facts Slide 2 Penn State PNGE ranked top-tier program 4 th in the world for petroleum engineering programs by CEOWORLD magazine
International Energy Outlook 2017
 International Energy 217 for Eighth IEA-IEF-OPEC Symposium on Energy s February 14, 218 Riyadh, Saudi Arabia U.S. Energy Information Administration U.S. Energy Information Administration Independent Statistics
Gas s Pipeline to Sustainability:
 Gas s Pipeline to Sustainability: An Update on Gas Markets September 28, 2017 An INDEPENDENT energy consulting company since 1996 No affiliation with any marketer, broker, agent, utility, pipeline or producer
Finding Global End Use Markets for the Growing LPG Supply
 Finding Global End Use Markets for the Growing LPG Supply March 7, 2017 Dr. Walt Hart, Vice President, IHS Natural Gas Liquids Walt.Hart@ihsmarkit.com 2 Finding Global End Use Markets for the Growing LPG
Applying Sigmafine in LNG and Related Industries
 Applying Sigmafine in LNG and Related Industries MINIMAL BUSINESS PRESENTATION Challenges and Applications Trusting Data for Action Sandeep Kamani Pimsoft Inc. Section 1 Introduction 2 Sigmafine Applications
Coal and Natural Gas The Evolving Nature of Supply and Demand
 Lab4energy International 2014 Coal and Natural Gas Coal and Natural Gas The Evolving Nature of Supply and Demand Dr. Francis O Sullivan February 13 th, 2014 1 Global energy supply Where does it come from?
Energy Introduction and Overview. September 3, 2013
 Energy Introduction and Overview September 3, 2013 Announcements Thursday, September 5, 5:15-6:15 Framing Energy Innovation Policy: Why We Fail to Learn from Experience. Jeffrey Alexander, Associate Director
The New Economic Realities of Fossil Fuels: Implications for the Rail Industry
 The New Economic Realities of Fossil Fuels: Implications for the Rail Industry Presentation to the Northeast Association of Rail Shippers Philadelphia, PA Bernard L. Weinstein, Ph.D. Associate Director,
Energy Classifications
 FOSSIL FUELS Energy Classifications Renewable Energy any source of energy that can be replaced as fast as it is used Examples: wind, hydroelectric, biofuels, solar, others Nonrenewable Energy any source
OECD Non-OECD Total
 Quarterly growth 2019 2018 OECD 48.1 47.8 Non-OECD 52.5 51.4 Total 100.6 99.2 Growth in oil demand is slowing. Growth dominated by China, other non-oecd (developing countries). Source: OGJ Forecast & Review,
Oil and Natural Gas. Adam Simon University of Michigan
 Oil and Natural Gas Adam Simon University of Michigan Global oil consumption fills the University of Michigan stadium every 40 minutes. 107,000 people Hydrocarbon! Oil and natural gas are made of a mixture
Background, Issues, and Trends in Underground Hydrocarbon Storage
 Background, Issues, and Trends in Underground Hydrocarbon Storage David E. Dismukes Center for Energy Studies Louisiana State University Environmental Permitting Class January 29, 2009 Description of the
The American Chemical Society and the American Institute of Chemical Engineers
 1 How to Secure Both Energy and the Environment for Economic Benefit: A Practical Geologic Foundation The American Chemical Society and the American Institute of Chemical Engineers Rayburn House Office
Global Supply and Shale in 2019 and Beyond
 Global Supply and Shale in 219 and Beyond Stephen G. Beck Senior Director, Upstream Gulf Downstream Association December 1, 218 www.stratasadvisors.com UPSTREAM MIDSTREAM DOWNSTREAM FUEL & TRANSPORT Crude
US Oil and Gas Import Dependence: Department of Energy Projections in 2011
 1800 K Street, NW Suite 400 Washington, DC 20006 Phone: 1.202.775.3270 Fax: 1.202.775.3199 Email: acordesman@gmail.com Web: www.csis.org/burke/reports US Oil and Gas Import Dependence: Department of Energy
Energy Task Cards Corrections
 Energy Task Cards Corrections #1 Most of the energy we use originally came from the A) the sun #2What do you call the energy an object has while its in motion? A) kinetic energy #3Which object has the
October U.S. Energy Information Administration Winter Fuels Outlook October
 October 2017 Winter Fuels Outlook EIA forecasts that average household expenditures for all major home heating fuels will rise this winter because of expected colder weather and higher energy costs. Average
11/18/2011. Moderate demand increase High depletion rate. Alfa Laval 1. Sammy Hulpiau Segment Manager Energy & Environment. mb/d.
 Oil & Gas Sammy Hulpiau Segment Manager Energy & Environment Oil production investments are rapidly growing mb/d 120 100 80 60 NGLs Unconventional oil Crude oil fields yet to be developed or found Crude
GWPC Shale Gas and Water Use Presentation September 28, 2010
 GWPC Shale Gas and Water Use Presentation September 28, 2010 Deep Shale Natural Gas and Water Use, Part Two: Abundant, Affordable, and Still Water Efficient Matthew E. Mantell, P.E. Corporate Environmental
************ Day 2 ************ ************ Session 2, Session 3 11:45 and 1:45 ************
 Natural Gas Value Chain: Discussion Questions ************ Day 2 ************ ************ Session 2, Session 3 11:45 and 1:45 ************ Electric Generation What other generation fuels are in the mix?
Current CO 2 EOR Perspectives
 Current CO 2 EOR Perspectives H. Kazemi Professor, CSM CCUS Conference, October 2018 Outline Major EOR Global Statistics CO 2 EOR Process and Statistics Location of Major CO 2 EOR Projects in the US Delaware
Chapter 12 Nonrenewable Energy Resources
 Chapter 12 Nonrenewable Energy Resources Friedland and Relyea Environmental Science for AP, second edition 2015 W.H. Freeman and Company/BFW AP is a trademark registered and/or owned by the College Board,
Overview of Chapter 11
 11 Fossil Fuels Overview of Chapter 11 Fossil Fuels Coal Coal Reserves Coal mining Environmental Effects of Burning Coal Oil and Natural Gas Exploration for Oil and Natural Gas Oil and Natural Gas reserves
AP Environmental Science II. Unit 2-1: Energy Basics and Fossil Fuels
 NOTE/STUDY GUIDE: Unit 2-1, Energy Basics and Fossil Fuels AP Environmental Science II, Mr. Doc Miller, M.Ed. North Central High School Name: ID#: NORTH CENTRAL HIGH SCHOOL NOTE & STUDY GUIDE AP Environmental
ENVI.5720 Energy and Environment
 ENVI.5720 Energy and Environment British thermal unit (Btu) = amount of heat needed to raise one pound of water at maximum density through one degree Fahrenheit. 1Btu = 1.055 10 3 joules tonne of oil
International Energy Outlook: key findings in the 216 Reference case World energy consumption increases from 549 quadrillion Btu in 212 to 629 quadril
 EIA's Global Energy Outlook For The Institute of Energy Economics, Japan October 5, 216 Japan By Adam Sieminski, Administrator U.S. Energy Information Administration Independent Statistics & Analysis www.eia.gov
We ve Seen This Movie Before
 The Dynamic Energy Landscape: Natural Gas in the U.S. We ve Seen This Movie Before October 26, 2015 Production of Natural Gas, NGLs & Crude Oil Bcf/d 75 70 65 60 55 50 U.S. Lower 48 Dry Gas Production
Flare Gas Capture for LNG Production. James Meyer, MBA/PE. Aspen Engineering Services, LLC.
 1 Flare Gas Capture for LNG Production James Meyer, MBA/PE Aspen Engineering Services, LLC jmeyer@aspenesco.com www.aspenesco.com 303-887-2032 2 Flare Gas Capture New technology has been developed to capture
Hydraulic Fracturing Is Industry Standard Practice the Best Practice? The Case for Waterless Fracking
 5 June 2018 Hydraulic Fracturing Is Industry Standard Practice the Best Practice? The Case for Waterless Fracking Christopher Johns Research Manager, Northern Australia and Land Care Research Programme
The Outlook for the Global LPG Market
 The Outlook for the Global LPG Market International LP Gas Seminar 213 Ken Otto February 28, 212 Dai-Ichi Hotel Tokyo, Japan 212, IHS Inc. No portion of this presentation may be reproduced, reused, or
Natural Gas Outlook for Connecticut. March 14, 2012 Connecticut Power and Energy Society
 Natural Gas Outlook for Connecticut March 14, 2012 Connecticut Power and Energy Society 1 1 % of penetration of gas % CT Home Heating Market Connecticut Has High Growth Potential 2 CT Home Heating Market
Winter U.S. Natural Gas Production and Supply Outlook
 Winter 2012-13 U.S. Natural Gas Production and Supply Outlook Prepared for Natural Gas Supply Association by: ICF International Fairfax, Virginia September, 2012 Introduction This report presents ICF s
Oil and natural gas: market outlook and drivers
 Oil and natural gas: market outlook and drivers for American Foundry Society May 18, 216 Washington, DC by Howard Gruenspecht, Deputy Administrator U.S. Energy Information Administration Independent Statistics
Name Class Date. Conventional Energy Resources
 Energy Resources SECTION 25.1 Conventional Energy Resources In your textbook, read about energy resources on Earth. For each statement below, write true or false. 1. The Sun is the ultimate source of most
U.S. Shale Gas in Context
 U.S. Shale Gas in Context Overview of U.S. Natural Gas production and trends For National Conference of State Legislatures Natural Gas Policy Institute September 9, 215 Pittsburgh, Pennsylvania By Grant
Shale Gas Impacts NATURAL GAS
 Shale Energy in the Appalachian Basin Dan Brockett Penn State Extension, MCORE, and ShaleTEC Shale Gas Impacts NATURAL GAS Lawrence County Data 166 wells permitted, located on 35 well sites 70 wells drilled
IHS LATIN AMERICA LPG SEMINAR
 ENTERPRISE PRODUCTS PARTNERS L.P. IHS LATIN AMERICA LPG SEMINAR November 8, 2016 Joseph Fasullo Manager, International NGLs ALL RIGHTS RESERVED. ENTERPRISE PRODUCTS PARTNERS L.P. enterpriseproducts.com
SellSide meeting. Irving, September 17
 2018 SellSide meeting Irving, September 17 This presentation is an amalgamation of our public Outlook for Energy, released on February 2, 2018 and our public March 7, 2018 Analyst Meeting presentation.
Acceptance Natural Gas Demand to Stay High on Cold Weather Forecast
 Mar-17 Apr-17 May-17 Jun-17 Jul-17 Aug-17 Sep-17 Oct-17 Nov-17 Dec-17 Jan-18 Feb-18 Mar-18 8: 8:45 9:3 1:15 11: 11:45 12:3 13:15 14: Prior Day s NYMEX Jan-18 Contract (CT) 2.68 2.67 2.66 2.65 2.64 2.63
Technologies to recover it were refined as natural gas prices rose to $10 per MMBtu Locations of shale gas were known for decades
 Technologies to recover it were refined as natural gas prices rose to $10 per MMBtu Locations of shale gas were known for decades Discovery rates are very high Reduces producer expenses Volume was greatly
Medicine Bow Fuel & Power Project
 Medicine Bow Fuel & Power Project 4 th Annual Wyoming CO 2 Conference 30 June 2010 Project Overview DKRW Advanced Fuels ( AF ) is sponsoring a coal to gasoline project in SE Wyoming The project will use
Midstream Fundamentals in the Oil and Gas Value Stream
 The Rocky Mountain Pipeliners Club Presents: a Midstream Fundamentals in the Oil and Gas Value Stream a March 30, 2016 About the Rocky Mountain Pipeliners Club Formed in April 2015 to provide: Networking
ST98: 2018 ALBERTA S ENERGY RESERVES & SUPPLY/DEMAND OUTLOOK. Executive Summary.
 ST98: 2018 ALBERTA S ENERGY RESERVES & SUPPLY/DEMAND OUTLOOK Executive Summary ST98 www.aer.ca EXECUTIVE SUMMARY The Alberta Energy Regulator (AER) ensures the safe, efficient, orderly, and environmentally
ST98: 2018 ALBERTA S ENERGY RESERVES & SUPPLY/DEMAND OUTLOOK. Executive Summary.
 ST98: 2018 ALBERTA S ENERGY RESERVES & SUPPLY/DEMAND OUTLOOK Executive Summary ST98 www.aer.ca EXECUTIVE SUMMARY The Alberta Energy Regulator (AER) ensures the safe, efficient, orderly, and environmentally
UNECE Expert Group on Resource Classification April, 2016
 UNECE Expert Group on Resource Classification April, 216 Scott W. Tinker Bureau of Economic Geology University of Texas at Austin Framing Conundrum Many people do not know how electricity is made or where
Sunoco Logistics Mariner East Project
 Sunoco Logistics Mariner East Project The Mariner East Project-Overview PA company moving a local product, creating local jobs 2 Approximately $3.0 billion project: Build infrastructure in Pennsylvania
Fast Analysis of Extended Natural Gas using the New Transportable INFICON Micro GC Fusion
 Fast Analysis of Extended Natural Gas using the New Transportable INFICON Micro GC Fusion Debbie Hutt PITTCON 2013 Philadelphia, Pa Wednesday March 20th, 2012 Cologne, Germany Shanghai, China 325 employees
The Energy Consortium Recent Developments and the Outlook for Natural Gas in the Northeast. John R. Bitler October 20, 2010
 The Energy Consortium Recent Developments and the Outlook for Natural Gas in the Northeast John R. Bitler October 20, 2010 Northeast Overview Traditional Sources of Supply Gulf Coast Western Canada (WCSB)
Fortress America. A Resource Rich Island of Stability in a Sea of Turmoil. Presented by Jason Willan Director, Risk Management & Research
 Fortress America A Resource Rich Island of Stability in a Sea of Turmoil Presented by Jason Willan Director, Risk Management & Research Disclaimer The data and information contained in this presentation
Public Service Commission of West Virginia
 Public Service Commission of West Virginia Natural Gas Supply Demand Forecast Report for 2017 2026 Issued February 2017 201 Brooks Street P.O. Box 812 Charleston, WV 25323 1-800-344-5113 Chairman Michael
Name Class Date. The statements below are false. For each statement, replace the underlined term to make a true statement.
 Skills Worksheet Chapter Review USING KEY TERMS The statements below are false. For each statement, replace the underlined term to make a true statement. 1. A liquid mixture of complex hydrocarbon compounds
Natural Gas Abundance: The Development of Shale Resource in North America
 Natural Gas Abundance: The Development of Shale Resource in North America EBA Brown Bag Luncheon Bracewell & Giuliani Washington, D.C. February 6, 2013 Bruce B. Henning Vice President, Energy Regulatory
Annual Energy Outlook 2018 with projections to 2050
 Annual Energy Outlook 218 with projections to 25 February 218 U.S. Energy Information Administration Office of Energy Analysis U.S. Department of Energy Washington, DC 2585 This publication is on the Web
NATURAL GAS 101 THE BASICS OF NATURAL GAS
 NATURAL GAS 101 THE BASICS OF NATURAL GAS April 25, 2014 Natural Gas Basics What is natural gas? Natural gas is a fossil fuel composed primarily of methane, and other hydrocarbons such as ethane, butane
DKRW, Medicine Bow and EOR
 DKRW, Medicine Bow and EOR June 2007 DKRW Energy LLC Current Projects DKRW Wind Energy 505 MW operational in TX; 700 MW total under development 132 MW under development in Maine 800 MW under development
North America Midstream Infrastructure through 2035: Capitalizing on Our Energy Abundance
 North America Midstream Infrastructure through 2035: Capitalizing on Our Energy Abundance Prepared by ICF International for The INGAA Foundation, Inc. Support provided by America s Natural Gas Alliance
I. EXPLORATORY/DRILLING/PRODUCING WELLS #
 UNITED STATES PETROLEUM STATISTICS INDEPENDENT PETROLEUM ASSOCIATION OF AMERICA www.ipaa.org IndEx TABLE I. EXPLORATORY/DRILLING/PRODUCING WELLS # Horizontal Rig Percentage...1 Exploratory Wells...1 Capital
UNITED STATES PETROLEUM STATISTICS
 UNITED STATES PETROLEUM STATISTICS 2016 Data Published October 2017 INDEPENDENT PETROLEUM ASSOCIATION OF AMERICA www.ipaa.org IndEx TABLE I. EXPLORATORY/DRILLING/PRODUCING WELLS # Horizontal Rig Percentage...1
U.S. Natural Gas Market Dynamics
 U.S. Natural Gas Market Dynamics University of Houston Global Energy Management Institute The Future of the Gulf Coast Petrochemical Industry Michael Speltz April 29, 2005 ChevronTexaco 2002 Legal Disclaimer
NEXUS Gas Transmission
 NEXUS Gas Transmission Bringing New Supplies to Market Ohio Manufacturers Association - October 2012 Agenda Project Introduction Utica and Marcellus Gas Supply Michigan and Ontario Markets Conclusion &
DEFINITIONS. EXHIBIT to the GAS GATHERING AGREEMENT (Note Not all definitions are used in each Agreement.)
") DEFINITIONS EXHIBIT to the GAS GATHERING AGREEMENT (Note Not all definitions are used in each Agreement.) Affiliate or Affiliated means, with respect to any specified Person, any other Person which directly
DEFINITIONS EXHIBIT to the GAS GATHERING AGREEMENT (Note Not all definitions are used in each Agreement.) Affiliate or Affiliated means, with respect to any specified Person, any other Person which directly
$40 Billion Ichthys LNG Project Begins Gas Exports US' Range Resources to fill Rover gas pipeline volumes by yearend; processing ramps up
 Oct-17 Nov-17 Dec-17 Jan-18 Feb-18 Mar-18 Apr-18 May-18 Jun-18 Jul-18 Aug-18 Sep-18 Oct-18 8: 8:45 9:3 1:15 11: 11:45 12:3 13:15 14: O C T O B E R 2 5, 2 1 8 3.26 3.24 3.22 3.2 3.18 3.16 3.14 3.12 3.1
Overview of Florida s s Regulatory Environment
 Overview of Florida s s Regulatory Environment October 21 st, 2011 Eduardo Balbis, P.E. Commissioner Florida Public Service Commission Florida Public Service Commission Gubernatorial Appointees Confirmed
Greg Hathaway Energy Source Holdings, LLC
 Greg Hathaway Energy Source Holdings, LLC WEATHER THE PICTURE TO THE RIGHT SHOWS THE 2015-16 WINTER HAS BEEN MUCH ABOVE NORMAL. SINCE 2008 THE NATIONAL TEMPERATURE HAS BEEN BELOW NORMAL SIX TIMES 2013-14
2015 Trilateral Energy Outlook Project
 1 Trilateral Energy Outlook Project Introduction Context & Motivation The energy markets of,, and the United States are becoming increasingly interdependent as physical infrastructure continues to be built
International Energy Outlook 2017
 International Energy Outlook 217 September 14, 217 Table of contents Page Overview 3 Petroleum and other liquids 31 Natural gas 47 Coal 61 Electricity 75 Buildings 91 Industrial 15 Transportation 117 Energy-related
NONRENEWABLE ENERGY SOURCES
 1 2 3 4 5 6 ENERGY Chapter 13 NONRENEWABLE ENERGY SOURCES Two primary categories of nonrenewable energy resources are fossil fuels and nuclear fuels. Fossil fuels are derived from biological material;
Rob Gardner September, 2016
 The Outlook for Energy: A View to 24 Rob Gardner September, 216 The Outlook for Energy includes Exxon Mobil Corporation s internal estimates and forecasts of energy demand, supply, and trends through 24
UNITED STATES PETROLEUM STATISTICS
 UNITED STATES PETROLEUM STATISTICS 2015 Data Published August 2016 INDEPENDENT PETROLEUM ASSOCIATION OF AMERICA www.ipaa.org INDEX TABLE I. EXPLORATORY/DRILLING/PRODUCING WELLS # Horizontal Rig Percentage...1
The Outlook for Energy
 The Outlook for Energy a view to 23 Rob Gardner 33 rd Annual Marine / Offshore Industry Outlook Conference March 25, 21 This presentation includes forward-looking statements. Actual future conditions (including
New England s Energy Mix: Clean, Diverse, Responsive and Getting Even Better
 New England s Energy Mix: Clean, Diverse, Responsive and Getting Even Better ENGIE s Distrigas subsidiary is proud of its 45-year history of supplying New England with LNG a critical component of its energy
Alternative Energy Resources. Environmental Earth Science Rev 2018, Spds 2011
 Alternative Energy Resources Environmental Earth Science Rev 2018, Spds 2011 Energy Sources Sun is the ultimate source of most energy on Earth. The Sun s energy is transferred from photosynthetic organisms
Nonrenewable Energy Sources
 Nonrenewable Energy Sources Fossil Fuels and Nuclear Energy This Photo by Unknown Author is licensed under CC BY-SA Nonrenewable Energy Fossil Fuels coal, oil, natural gas Nuclear Fuels Uranium-235, Plutonium-239
Energy Markets. U.S. Energy Information Administration. for Center on Global Energy Policy, Columbia University November 20, 2015 New York, New York
 Energy Markets for Center on Global Energy Policy, Columbia University New York, New York by Adam Sieminski, Administrator U.S. Energy Information Administration U.S. Energy Information Administration
Chapter 12 Nonrenewable Energy Resources. Monday, February 5, 18
 Chapter 12 Nonrenewable Energy Resources Module 34 Patterns of Energy Use After reading this module, you should be able to describe the use of nonrenewable energy in the world and in the United States.
ENERGY BLUEPRINT. Energy
 Energy ENERGY BLUEPRINT Energy stands as one of the traditional strengths of West Virginia s economy. The state has long been and remains today one of America s leading electricity producers. Two-thirds
Durability of Eagle Ford Investment: How does the Eagle Ford Compare in North America?
 Durability of Eagle Ford Investment: How does the Eagle Ford Compare in North America? March 27, 2013 Unconventional Development Activity North American Shale Plays Source: EIA 2 Converging Consumption
Markets and Opportunities. Paul Burgener March 2015
 Markets and Opportunities Paul Burgener March 2015 Disclaimer Copyright BP Energy Company. All rights reserved. Contents of this presentation do not necessarily reflect the Company s views. This presentation
U. S. Energy sources over time
 Energy Resources Includes food energy and sources of energy used to sustain the activities and structures of modern society Fossil fuels Alternative energy sources Hydroelectic Nuclear New renewables Earth
NASEO WINTER ENERGY OUTLOOK
 ENTERPRISE PRODUCTS PARTNERS L.P. NASEO WINTER ENERGY OUTLOOK October, 2014 Mike Smith Group Sr. Vice President ALL RIGHTS RESERVED. ENTERPRISE PRODUCTS PARTNERS L.P. enterpriseproducts.com DISCLAIMER
The Outlook for Energy: A View to 2040
 The Outlook for Energy: A View to 24 Joost Van Roost, ExxonMobil Benelux Deloitte Dutch Oil & Gas Conference Rotterdam, June 25, 213 This presentation includes forward-looking statements. Actual future
Global energy markets
 For Woodrow Wilson Center Global Energy Forum September 21, 215 Washington, DC by Adam Sieminski, Administrator U.S. Energy Information Administration U.S. Energy Information Administration Independent
Examining the Expansion Potential of the Petrochemical Industry in Canada
 Canadian Energy Research Institute Examining the Expansion Potential of the Petrochemical Industry in Canada Allan Fogwill President and CEO Canadian Energy Research Institute January 2016 1 Canadian Energy
Developments in the Irish Gas Industry
 Developments in the Irish Gas Industry An Irish Producer s Perspective IEI evening lecture February 21, 2006 21 st February 2006 Exploration & Production Overview Marathon s Operations in Ireland (Description
Energy Markets. U.S. Energy Information Administration. for. October 29, 2015 Golden, Colorado. by Adam Sieminski, Administrator
 Energy Markets for The Payne Institute for Earth Resources at the Colorado School of Mines Golden, Colorado by Adam Sieminski, Administrator U.S. Energy Information Administration U.S. Energy Information
BP Energy Outlook 2016 edition
 BP Energy Outlook 216 edition Mark Finley 14th February 216 Outlook to 235 bp.com/energyoutlook #BPstats Economic backdrop Trillion, $21 25 Other 2 India Africa 15 China 1 OECD 5 OECD 1965 2 235 GDP 2
Shale Gas Global. New Zealand LPG
 Shale Gas Global New Zealand LPG New Zealand LPG Where to from here? 2 LPG ('000 Tonnes) 300 LPG Production and Demand to 2018 (calendar year) 250 200 150 100 50 0 2000 2005 2010 2015 Kapuni Kupe McKee/Mangahewa
1 Monday, May 16, 16
 1 Chapter 12 Nonrenewable Energy Resources Nonrenewable Energy Nonrenewable energy resources- fossil fuels (coal, oil, natural gas) and nuclear fuels. U.S. Energy Use 13% 1% 19% 42% 25% Coal Natural Gas
Shale Gas - Transforming Natural Gas Flows and Opportunities. Doug Bloom President, Spectra Energy Transmission West October 18, 2011
 Fort Nelson Gas Plant, British Columbia Shale Gas - Transforming Natural Gas Flows and Opportunities Doug Bloom President, Spectra Energy Transmission West October 18, 2011 Natural Gas Golden Age Natural
Texas Natural Gas Prices Plunge To All-Time Low Column: U.S. natural gas prices unmoved by colder winter, low
 2.69 2.69 2.68 2.68 2.67 2.67 2.66 2.66 2.65 2.65 2.64 Prior Day s NYMEX MAY-19 Contract (CT) 8: 8:45 9:3 1:15 11: 11:45 12:3 13:15 Apr-18 May-18 Jun-18 Jul-18 Aug-18 Sep-18 Oct-18 Nov-18 Dec-18 Jan-19