Module 14: Small Storm Hydrology, Continuous Simulations and Treatment Flow Rates The Integration of Water Quality and Drainage Design Objectives
|
|
|
- Cordelia Page
- 6 years ago
- Views:
Transcription
1 Module 14: Small Storm Hydrology, Continuous Simulations and Treatment Flow Rates The Integration of Water Quality and Drainage Design Objectives Robert Pitt, Ph.D., P.E., DEE Department of Civil, Construction, and Environmental Engineering University of Alabama Tuscaloosa, AL, USA 35487
2 Urban Stormwater Hydrology History Early focus of urban stormwater was on storm sewer and flood control design using the Rational Method and TR-55 (both single event, design storm methods). The Curve Number procedure was developed in the 1950s by the (then) SCS as a simple tool for estimating volumes generated by large storm events in agricultural areas, converted to urban uses in mid 1970s (TR55 in SCS 1976). Data based on many decades of observations of large storms in urban areas, at Corps of Engineers monitoring locations. Data available from the Rainfall-Runoff database report prepared by the Univ. of Florida for the EPA. Water quality focus results form Public Law , the Clean Water Act, Stormwater quality research started in the late 1960s, with a few earlier interesting studies. Big push with Nationwide Urban Runoff Program (NURP) in late 70s and early 80s. Most still rely on earlier drainage design approaches.
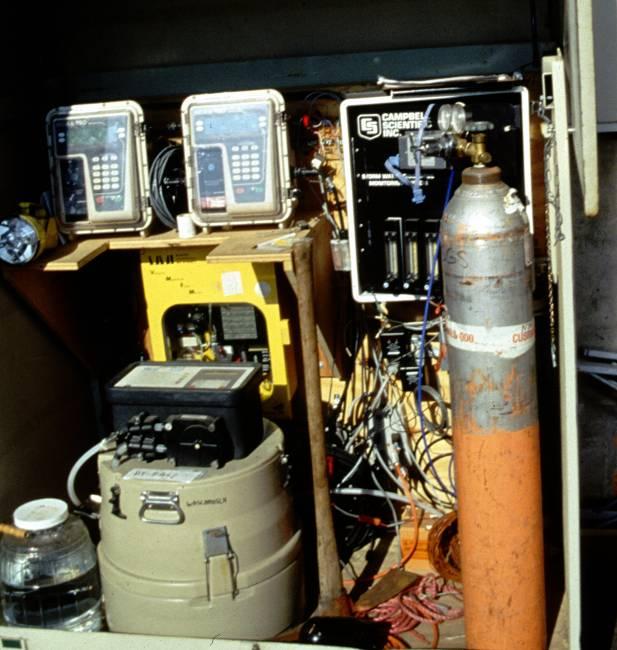
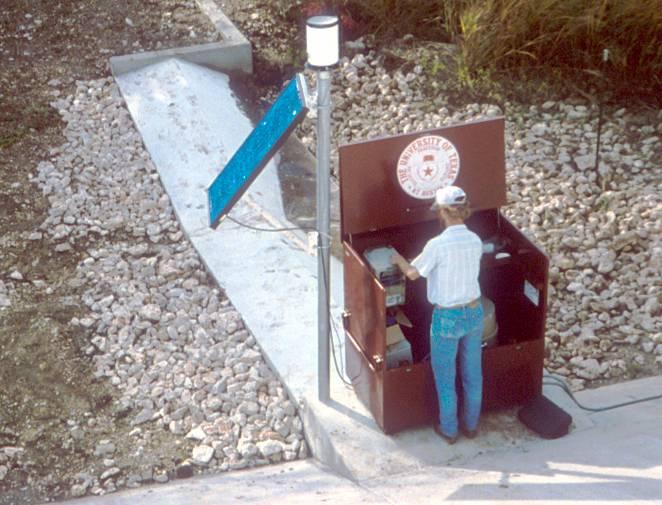
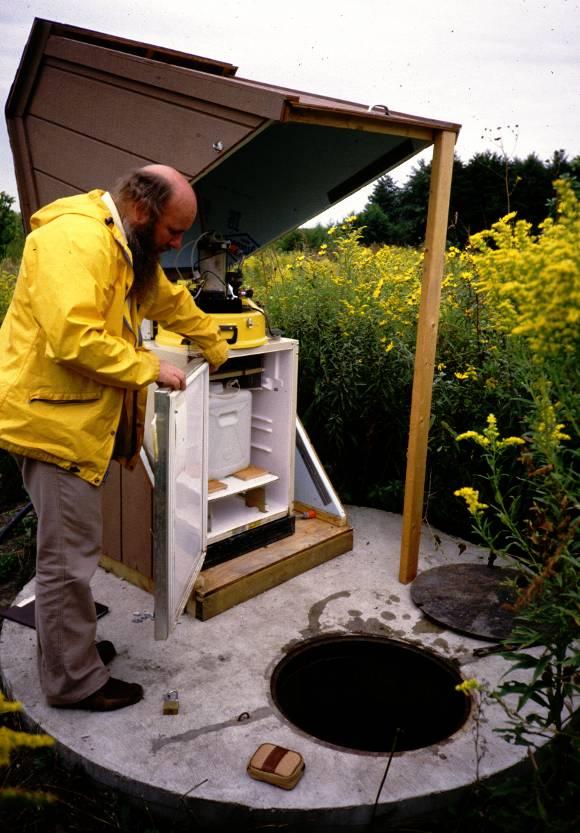
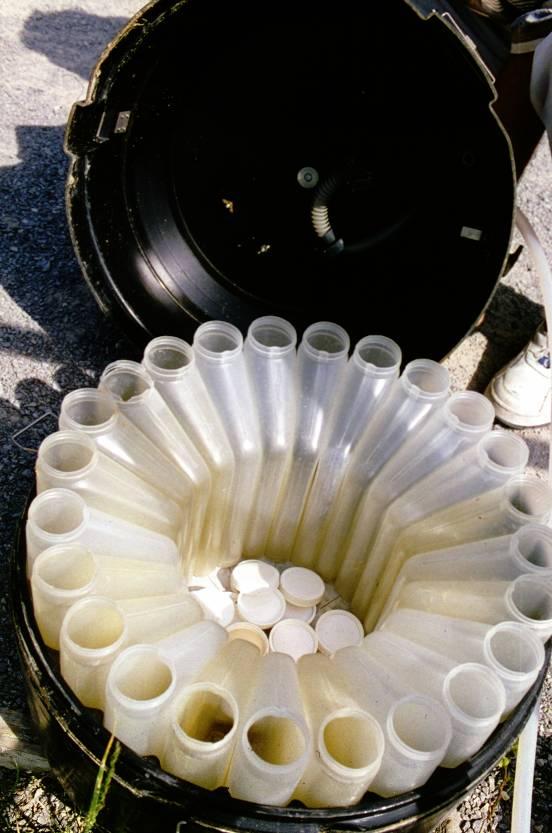
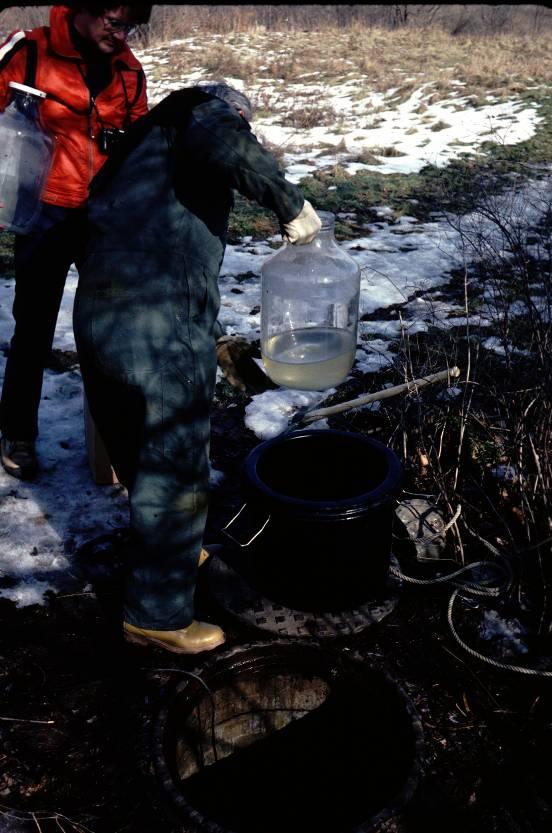
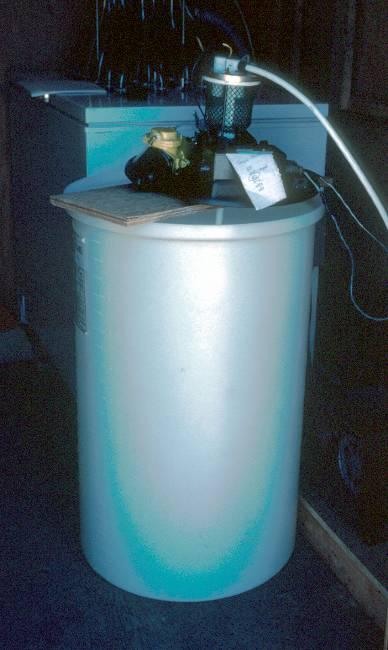
3 Many stormwater monitoring configurations used over the years
4 Importance of Site Hydrology in the Design of Stormwater Controls Design of stormwater management programs requires knowledge of site hydrology Understanding of flows (variations for different storm conditions, sources of flows from within the drainage area, and quality of those flows), are needed for effective design of source area and outfall controls.
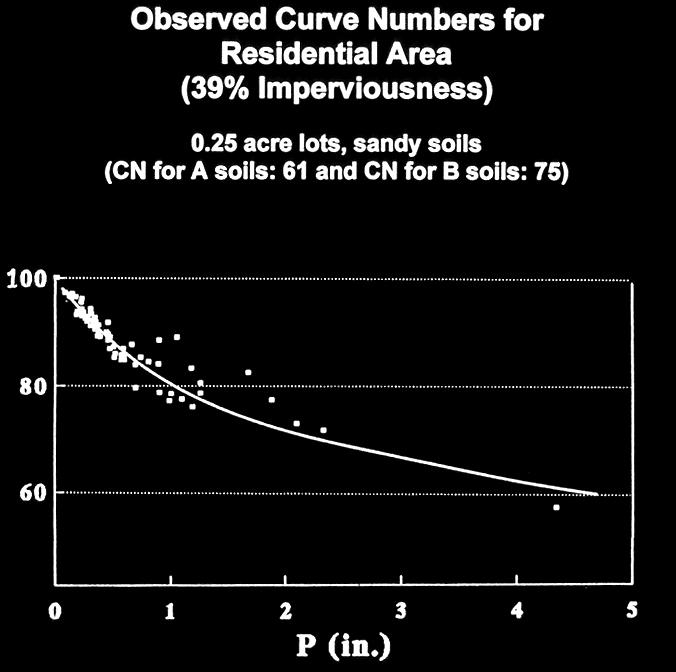
5 The following equation can be used to calculate the actual NRCS curve number (CN) from observed rainfall depth (P) and runoff depth (Q), both expressed in inches: CN = 1000/[10+5P+10Q-10(Q QP) 1/2 ] The following plots use rainfall and runoff data from the EPA s NURP projects in the early 1980s (EPA 1983), and from the EPA s rainfall-runoffquality data base (Huber, et al. 1982).
6
7 Low Density Residential Sites Pitt, et al. (2000)
8 Medium Density Residential Sites
9 High Density Residential Sites
10 Highway Sites
11 Knowing the Runoff Volume is the Key to Estimating Pollutant Mass There is usually a simple relationship between rain depth and runoff depth. Changes in rain depth affect the relative contributions of runoff and pollutant mass discharges: Directly connected impervious areas contribute most of the flows during relatively small rains Disturbed urban soils may dominate during larger rains
12
13 Source Characteristics of Stormwater Pollutants Quality of sheetflows vary for different areas. Need to track pollutants from sources and examine controls that affect these sources, the transport system, and outfall.

14 Street dirt washoff and runoff test plot, Toronto Pitt 1987

15 Runoff response curve for typical residential street, Toronto Pitt 1987


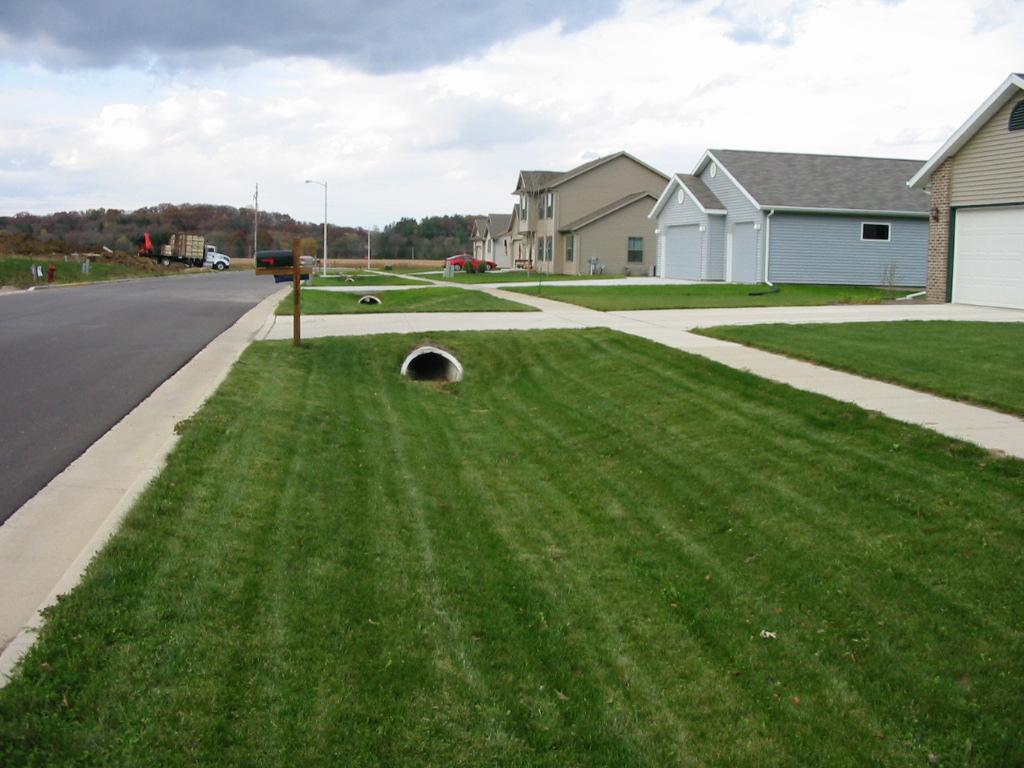
16 Ponding during very intense rain in area having sandy soils.


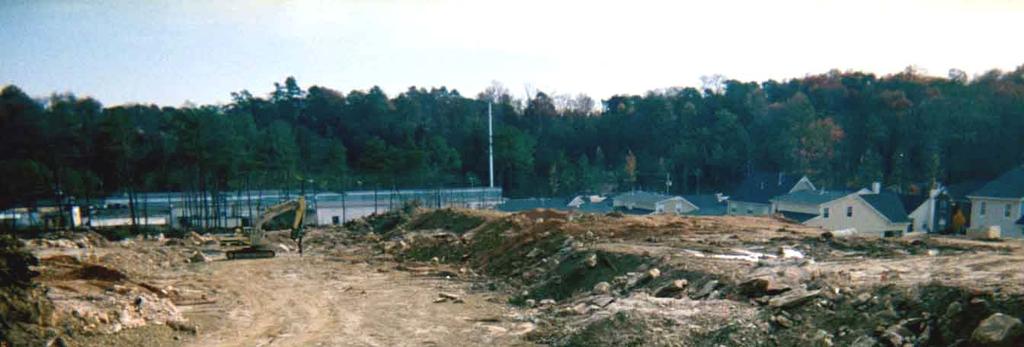
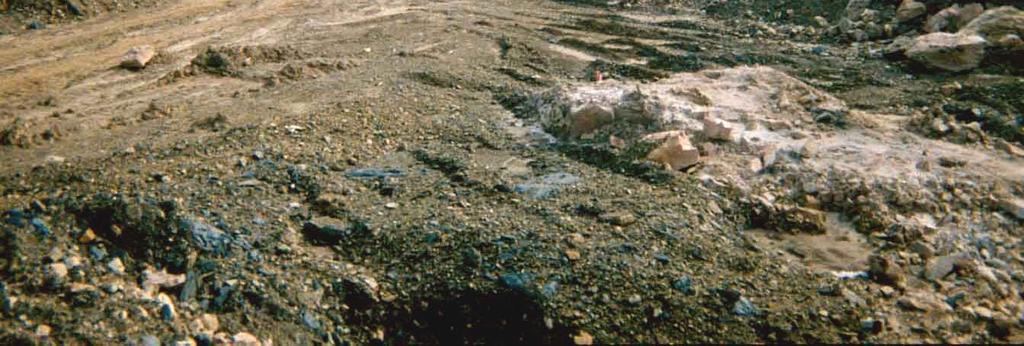
17 Disturbed Urban Soils during Land Development


18 Road shoulder soil compaction due to parked cars along road.


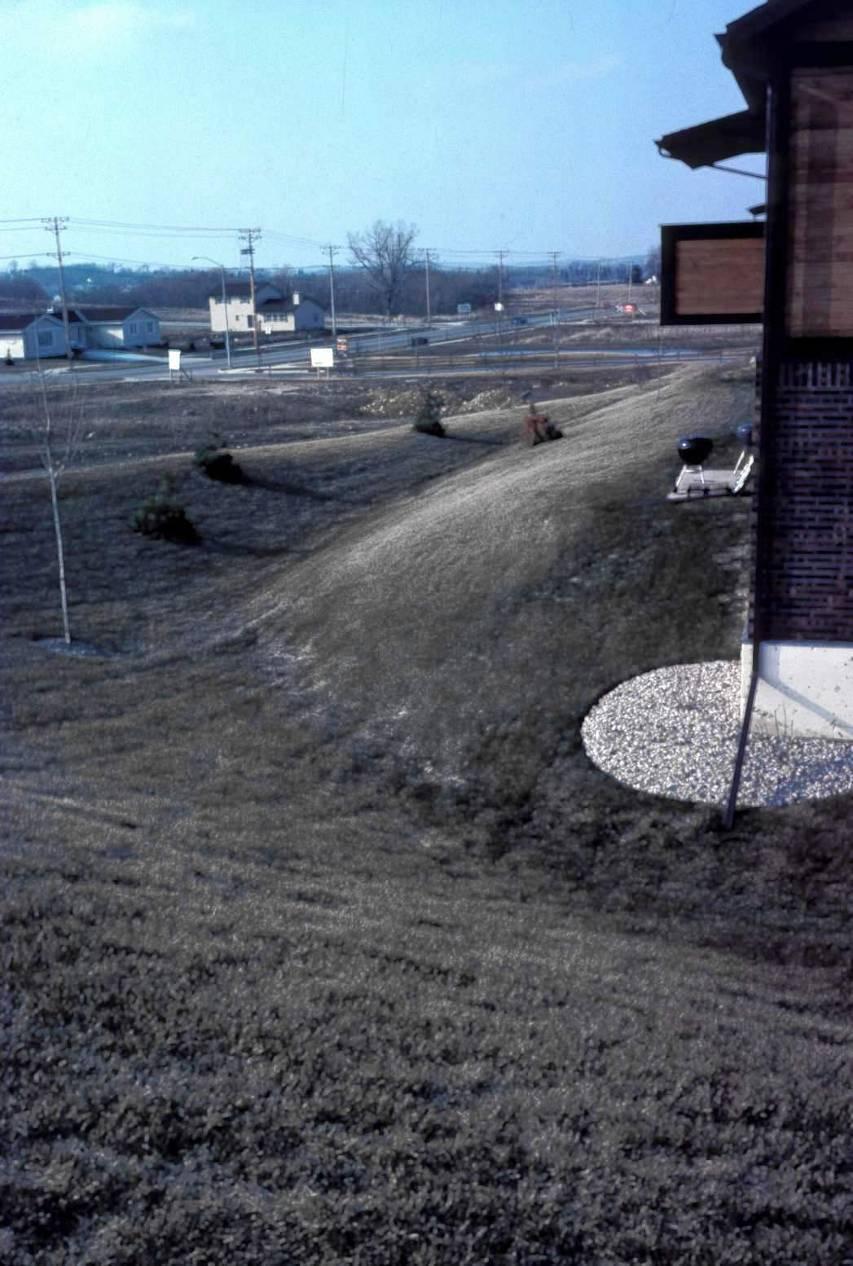
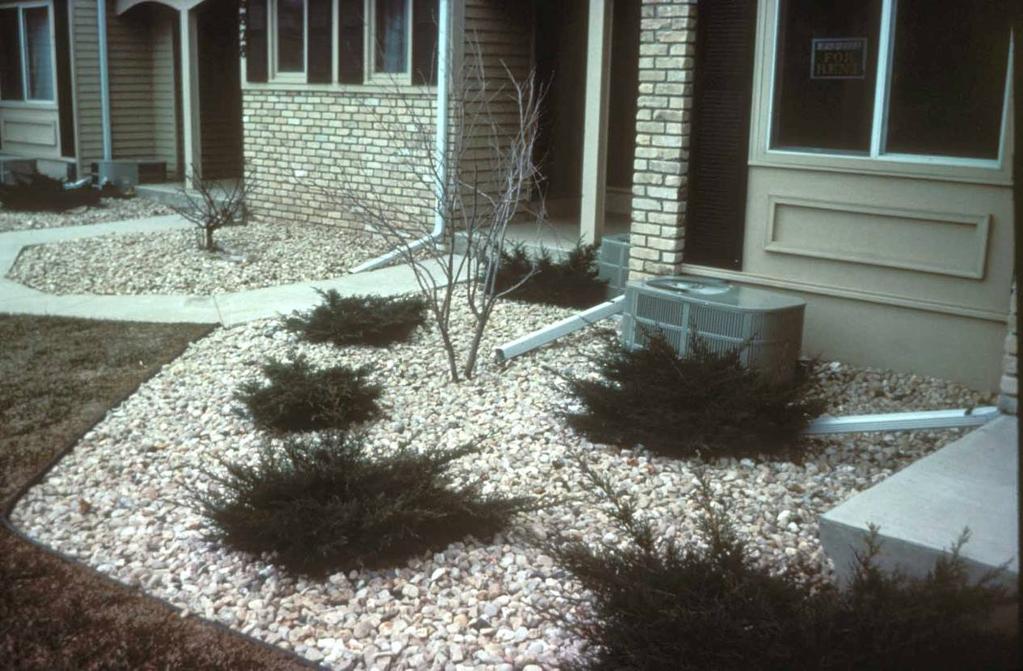
19 Soil modifications can result in greatly enhanced infiltration in marginal soils.


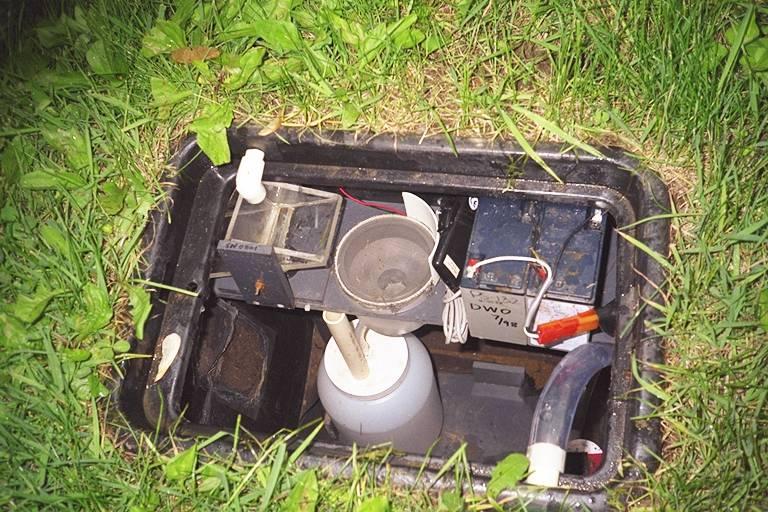
20 Direct measurements of turf runoff for different soil conditions.
21 WI DNR Double-Ring Infiltrometer Test Results (in/hr), Oconomowoc (mostly A and B soils) Initial Rate Final Rate Range of Observed Rates 11 to to to to to to to to to to to to to 0.6 all 0 all 0
22 Infiltration Rates in Disturbed Urban Soils (AL tests) Sandy Soils Clayey Soils Recent research has shown that the infiltration rates of urban soils are strongly influenced by compaction, probably more than by moisture saturation.
23 Infiltration Measurements for Noncompacted, Sandy Soils (Pitt, et al. 1999)
24 Infiltration Rates during Tests of Disturbed Urban Soils Number of tests Average infiltration rate (in/hr) COV Noncompacted sandy soils Compacted sandy soils Noncompacted and dry clayey soils All other clayey soils (compacted and dry, plus all wetter conditions)
25
26 Long-Term Sustainable Average Infiltration Rates (3 of 15 textures tested) Soil Texture Compaction Method Dry Bulk Density (g/cc) Effects on Root Growth (per NRCS) Long-term Average Infilt. Rate (in/hr) Sand Hand Ideal Very high Standard Ideal Very high Modified May affect - 80 Silt Hand May affect 18 Standard May affect Modified Restrict 0.08 Clay Hand May affect 3.0 Standard n/a n/a 0 Modified n/a n/a 0


27 Natural forces and management attempts to increase infiltration in compacted soils. Nature much better at this than we are.
28 Observed vs. Predicted Runoff at Madison Maintenance Yard Outfall Predicted Runoff (in) Observed Runoff (in)
29 Design Issues Related to Storm Size Recognize different objectives of storm drainage systems Recognize associated rainfall conditions affecting different objectives Select the appropriate tools for design Example - 4 major rainfall categories for Milwaukee, WI: <0.5 in (<12 mm) 0.5 to 1.5 in (12 to 40 mm) 1.5 to 3 in (40 to 75 mm) >3 in (>75 mm)
30
31 Probability distribution of rains (by count) and runoff (by depth). Birmingham Rains: <0.5 : 65% of rains (10% of runoff) 0.5 to 3 : 30% of rains (75% of runoff) 3 to 8 : 4% of rains (13% of runoff) >8 : <0.1% of rains (2% of runoff)
32 Same pattern in other parts of the country, just shifted. Pitt, et al. (2000)
33 Design Issues (<0.5 inches) Most of the events (numbers of rain storms) Little of annual runoff volume Little of annual pollutant mass discharges Probably few receiving water effects Problem: pollutant concentrations likely exceed regulatory limits (especially for bacteria and total recoverable heavy metals) for each event


34 Fishing in urban waters also occurs, both for recreation and for food. WI DNR photo

35 Children frequently play in urban creeks, irrespective of their designation as water contact recreation waters WI DNR photo
36 Suitable Controls for Almost Complete Elimination of Runoff Associated with Small Rains (<0.5 in.) Disconnect roofs and pavement from impervious drainages Grass swales Porous pavement walkways Rain barrels and cisterns

37 Roof drain disconnections
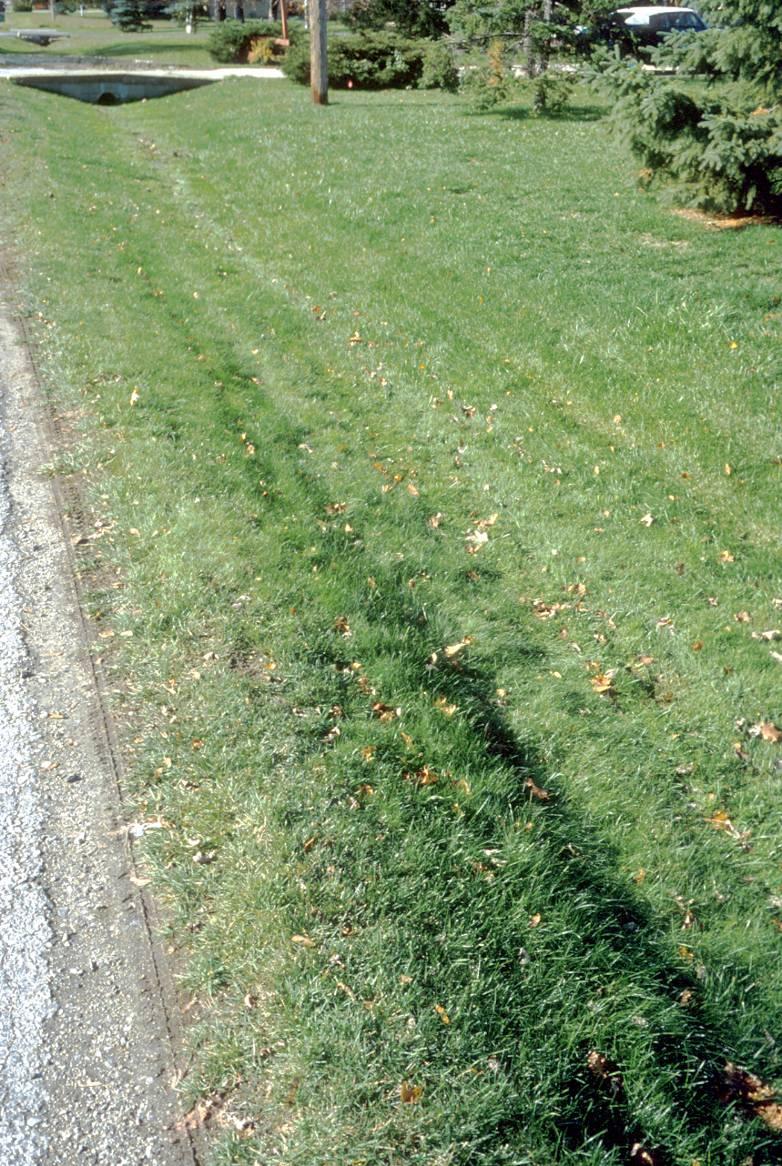
38 Grass-Lined Swales


39 Ponds, rain barrels and cisterns for stormwater storage for irrigation and other beneficial uses. Rural airport and rural home near Auckland, New Zealand, examples


40 Simple porous paver blocks used for walkways, overflow parking, and seldom used access roads.

41 Green roof, Portland, OR
42 Calculated Benefits of Various Roof Runoff Controls (compared to typical directly connected residential pitched roofs) Annual Birmingham, AL, rains (1.4 m) compared to Seattle, WA, rains (0.84 m), and Phoenix, AZ, rains (0.24 m) Flat roofs instead of pitched roofs Cistern for reuse of runoff for toilet flushing and irrigation (3m D x 1.5 m H) Planted green roof Disconnect roof drains to loam soils Rain garden with amended soils (3m x 2m) Annual roof runoff volume reductions 13/21/25% 66/67/88% 75/77/84% 84/87/91% 87/100/96%
43 Design Issues (0.5 to 1.5 inches) Majority of annual runoff volume and pollutant discharges Occur approximately every two weeks Problems: Produce moderate to high flows Produce frequent high pollutant loadings


44 Frequent high flows after urbanization WI DNR photo
45 Suitable Controls for Treatment of Runoff from Intermediate- Sized Rains (0.5 to 1.5 in.) Initial portion will be captured/infiltrated by on-site controls or grass swales Remaining portion of runoff should be treated to remove particulate-bound pollutants


46 Rain Garden Designed for Complete Infiltration of Roof Runoff


47 Soil Modifications for rain gardens and other biofiltration areas can significantly increase treatment and infiltration capacity compared to native soils. (King County, Washington, test plots)


48 Percolation areas or ponds, infiltration trenches, and French drains can be designed for larger rains due to storage capacity, or small drainage areas.
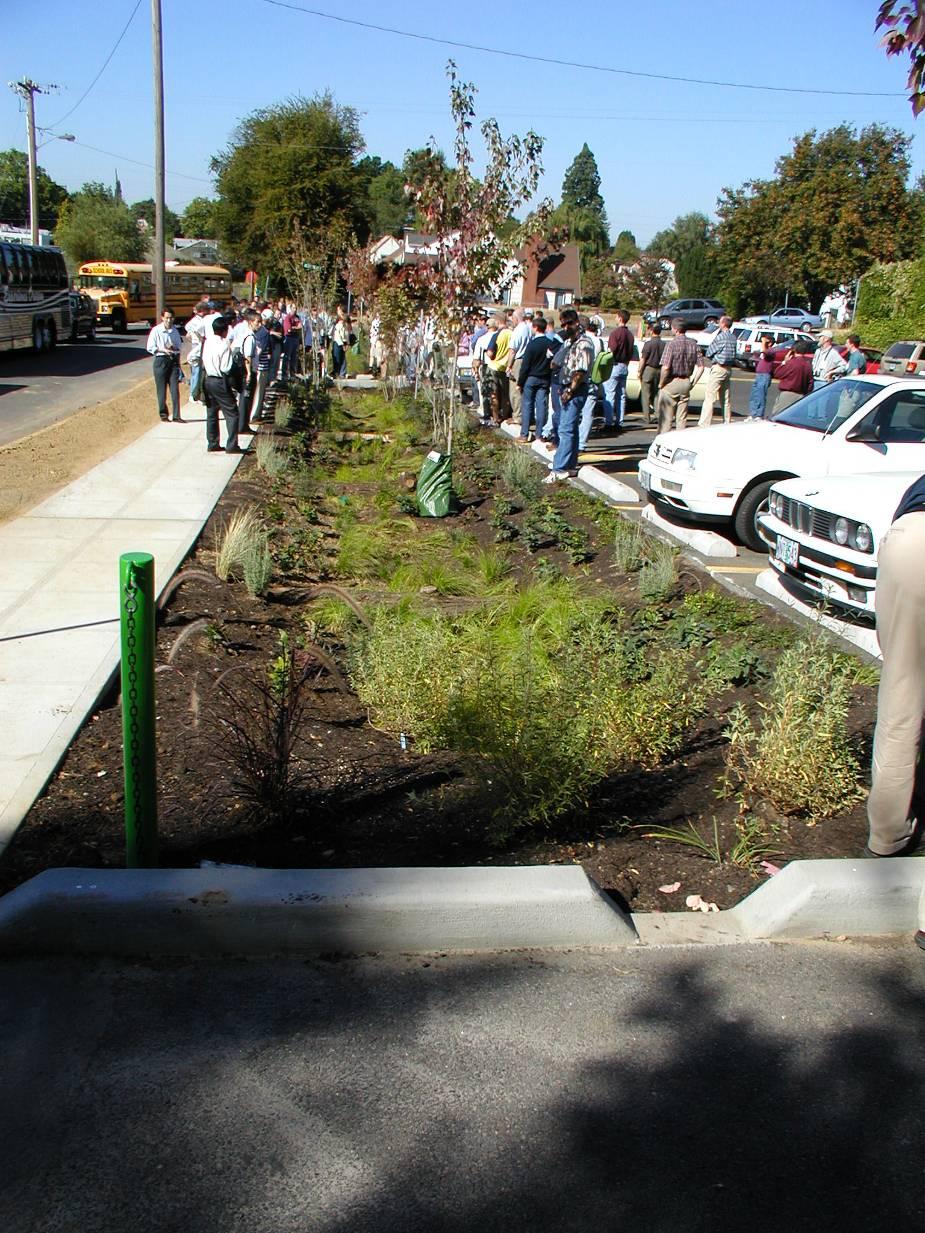
49 Bioretention and biofiltration areas having moderate capacity


50 Temporary parking or access roads supported by turf meshes, or paver blocks, and advanced porous paver systems designed for large capacity.


51 Wet detention ponds, stormwater filters, or critical source area controls needed to treat runoff that cannot be infiltrated.
52 Design Issues (1.5 to 3 inches) Larger events in category are drainage design storms Establishes energy gradient of streams Occurs approximately every few months (once to twice a year) Problems: Unstable streambanks Habitat destruction from damaging flows Sanitary sewer overflows Nuisance flooding and drainage problems/traffic hazards


53 Infrequent very high flows are channel-forming and may cause severe bank erosion and infrastructure damage. WI DNR photos


54 High flows may cause separate sewer overflows (SSOs), resulting in the discharge of raw sewage.
55 Controls for Treatment of Runoff from Drainage Events (1.5 to 3 in.) Infiltration and other on-site controls will provide some volume and peak flow control Treatment controls can provide additional storage for peak flow reduction Provide adequate stormwater drainage to prevent street and structure flooding Provide additional storage to reduce magnitude and frequency of runoff energy Capture sanitary sewage overflows for storage and treatment


56 Storage at treatment works may be suitable solution in areas having SSOs that cannot be controlled by fixing leaky sanitary sewerage. Golf courses can provide large volumes of storage.
57 Design Issues (> 3 inches) Occur rarely (once every several years to once every several decades, or less frequently) Produce relatively little of annual pollutant mass discharges Produce extremely large flows and the largest events exceed drainage system capacity

58 WI DNR photo
59 Controls for Treatment of Runoff from Very Large Events (> 3 in.) Provide secondary surface drainage system to carefully route excess flood water away from structures and roadways Restrict development in flood-prone areas
60 Appropriate Combinations of Controls No single control is adequate for all problems Only infiltration reduces water flows, along with soluble and particulate pollutants. Only applicable in conditions having minimal groundwater contamination potential. Wet detention ponds reduce particulate pollutants and may help control dry weather flows. They do not consistently reduce concentrations of soluble pollutants, nor do they generally solve regional drainage and flooding problems. A combination of bioretention and sedimentation practices is usually needed, at both critical source areas and at critical outfalls.
61 Example of design of integrated program to meet many objectives Smallest rains (<0.5 in.) are common, but little runoff. Exceed WQ standards, but these could be totally infiltrated. Medium-sized storms (0.5 to 1-1/2 in.) account for most of annual runoff and pollutant loads. Can be partially infiltrated, but larger rains will need treatment. Example of monitored rain and runoff distributions during NURP. Similar plots for all locations, just shifted. Large rains (>1-1/2 in.) need energy reduction and flow attenuation for habitat protection and for flood control.
62 EXCELLENT GOOD FAIR POOR Riparian Integrity Biotic Integrity Benthic Index of Biotic Integrity (B-IBI) Watershed Urbanization (%TIA) Relationship between basin development, riparian buffer width, and biological integrity in Puget Sound lowland streams. (From May, C.W. Assessment of the Cumulative Effects of Urbanization on Small Streams in the Puget Sound Lowland Ecoregion: Implications for Salmonid Resource Management. Ph.D. dissertation, University of Washington, Seattle

63 Figure and Table from Center of Watershed Protection Urban Steam Classification Sensitive 0 10% Imperviousness Impacted 11 25% Imperviousness Damaged % Imperviousness Channel Stability Stable Unstable Highly Unstable Aquatic Life Biodiversity Good/Excellent Fair/Good Poor
64 Relationship between Directly Connected Impervious Areas, Volumetric Runoff Coefficient, and Expected Biological Conditions Rv Poor Good Fair Directly Connected Impervious Area (%) Sandy Soil Rv Silty Soil Rv Clayey Soil Rv

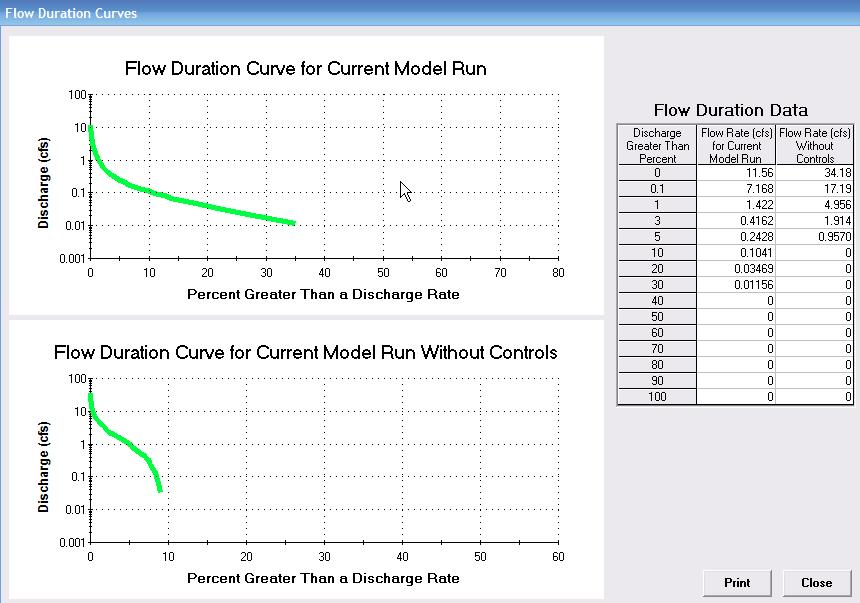
65 WinSLAMM v 9.2 Output Summary
66 Hours of Exceedence of Developed Conditions with Zero Runoff Increase Controls Compared to Predevelopment Conditions (MacRae (1997) Recurrence Interval (yrs) Existing Flowrate (m 3 /s) Exceedence for Predevelopment Conditions (hrs per 5 yrs) Exceedence for Existing Development Conditions, with ZRI Controls (hrs per 5 yrs) Exceedence for Ultimate Development Conditions, with ZRI Controls (hrs per 5 yrs) 1.01 (critical mid-bankfull conditions) (bankfull conditions)
67
68 Poor RES Little Shades Creek Poor COM ALJC 012 Poor Resid. Med. Dens. ALJC 010 Poor Resid. High Dens. ALJC 009 Poor IND ALJC 002 Poor IND ALJC 001 Expected Biological Conditions of Receiving Waters Vol. Runoff Coeff. (Rv) Disconnected Impervious Areas (%) Directly Connected Impervious Areas (%) Pervious Areas (%) Area (ac) Major Land Use Watershed ID
69 Flow-Duration Curves for Different Stormwater Conservation Design Practices 140 Flow Duration Curves are Ranked in Order of Peak Flows Top Set: No Controls Swales Discharge (cfs) Middle Set: Pond Pond and Swales Bottom Set: Biorentention Swales and Bioretention Pond and Bioretention Pond, Swales and Bioretention % Greater than Discharge Rate
70 Cost Effectiveness of Stormwater Control Practices for Runoff Volume Reductions Pond 60 $/1000 cu. Ft Reduced Pond and Swale Swale Pond and Bioretention Bioretention Pond, Swales and Bioretention Swales and Bioretention Max % Runoff Reduced
71 Example of Stormwater Control Implementation No controls Pond Only Swales Only Bioretention Only Pond, Swales and Bioretention Annualized Total Costs ($/year/ac) Runoff Coefficient (Rv) % Reduction of Total Runoff Volume Discharges n/a 1.4% 10% 58% 67% Unit Removal Costs for Runoff Volume ($/ft 3 ) n/a Expected biological conditions in receiving waters (based on Rv) poor poor poor poor fair Site ALJC 012 Area 228 acres = 92.3 ha Bioretention devices give the greatest reduction in runoff volume discharged The biological conditions improved from poor to fair due to stormwater controls
72 These graphs illustrate the relationships between the directly connected impervious area percentages and the calculated volumetric runoff coefficients (Rv) for each land use category (using the average land use characteristics), based on 43 years of local rain data. Rv is relatively constant until the 10 to 15% directly connected impervious cover values are reached (at Rv values of about 0.07 for sandy soil areas and 0.16 for clayey soil areas), the point where receiving water degradation typically is observed to start. The 25 to 30% directly connected impervious levels (where significant degradation is observed), is associated with Rv values of about 0.14 for sandy soil areas and 0.25 for clayey soil areas, and is where the curves start to greatly increase in slope.
73 60 Flow Rate (gpm per acre pavement) Percent of Annual Flow Less than Flow Rate (Seattle 1991) Flow rates for Seattle, WA
74 100 Percent of Annual Flow Treated (Seattle 1991) Treatment Flow Rate (gpm per acre of pavement) Treatment flow rates needed for Seattle, WA
75 450 Flow Rate (gpm per acre pavement) Percent of Annual Flow Less than Flow Rate (Atlanta 1999) Flow rates for Atlanta, GA
76 100 Percent of Annual Flow Treated (Atlanta 1999) Treatment Flow Rate (gpm per acre of pavement) Treatment flow rates needed for Atlanta, GA
77 Annual Flow Rate Distributaries (gpm/acre pavement) Flow Rate Needed for Different Levels of Annual Flow Treatment (gpm/acre pavement) Location 50 th Percentile 70 th Percentile 90 th Percentile 50% 70% 90% Seattle, WA Portland, ME Milwaukee, WI Phoenix, AZ Atlanta, GA
78 Creating Flow-Duration Probability Plots in WinSLAMM Export 6-minute flow increment data (select this as an output option; was created to allow WinSLAMM to interface with hydraulic and drainage models, such as SWMM) Import this *.csv file into Excel (Office 2003 version limits the spreadsheet to about 65,000 rows, allowing only about 9 months of observations, suitable for a typical rain period in a northern area after selecting a typical rain year; Office 2007 allows 1,000,000 rows, allowing about 11 years of observations).
79 WinSLAMM has a rain utility that assists in selecting the typical rain period. This utility sorts the rain years in a large mulit-year rain file by total annual rain totals, and calculates the residuals from the long-term average value. It also shows the monthly totals (depths and numbers of events) and compares those values to the long-term averages. Sort the flow column in descending order and remove all zero values (most of the flow increments will be zero, allowing possible appending new data sets if using older version of Excel to extend the analysis period).
80 If a treatment flow rate is desired, then a candidate treatment flow rate (such as 25 gpm) is subtracted from each increment value (after unit conversions!). All negative results are removed (corresponding to when the treatment flow rates are larger than the actual flow, and all is treated). These excess values (flows that bypass the treatment device) are then summed for the whole analysis period and compared to the total flow that occurred during the period.
81 These calculated percentages for each treatment flow rate are then plotted. If coarser flow-increment data is all that is needed, then the direct model output for the flow-duration option can be directly used, without using the higher resolution flow data and Excel.
82 Summary WinSLAMM output options and many of the built-in utilities enable a stormwater manager to investigate flow-duration conditions in many ways Continuous simulations, especially considering the effects of stormwater controls, over many decades are a very powerful tool.
Land Development and Soil Characteristics Affects on Runoff
 Land Development and Soil Characteristics Affects on Runoff Robert Pitt, Celina Bochis, and Pauline Johnson Department of Civil, Construction and Environmental Engineering The University of Alabama Tuscaloosa,
Hydrology for Drainage Design. Design Considerations Use appropriate design tools for the job at hand:
 Hydrology for Drainage Design Robert Pitt Department of Civil and Environmental Engineering University of Alabama Tuscaloosa, AL Objectives for Urban Drainage Systems are Varied Ensure personal safety
Land Development Characteristics in the Southeastern United States
 Background February 21: BS in Geography from Romania Minor in Meteorology-Hydrology May 27: MSE (Environmental) at UA December 28: Ph.D. in Civil Engineering at UA Concentration: Water Resources / Environmental
Integrated Watershed Management in Urban Areas
 Integrated Watershed Management in Urban Areas Robert Pitt, Ph.D., P.E. Department of Civil, Construction, and Environmental Engineering The University of Alabama Tuscaloosa, AL Typical Urban Receiving
Module 10b: Gutter and Inlet Designs and Multiple Design Objectives
 Module 10b: Gutter and Inlet Designs and Multiple Design Objectives Bob Pitt University of Alabama and Shirley Clark Penn State Harrisburg Evening traffic plows through high water at the intersection of
the 2001 season. Allison brought high winds and street flooding to Houston, after
 Module 10b: Gutter and Inlet Designs and Multiple Design Objectives Bob Pitt University of Alabama and Shirley Clark Penn State Harrisburg Evening traffic plows through high water at the intersection of
Detention Pond Design Considering Varying Design Storms. Receiving Water Effects of Water Pollutant Discharges
 Detention Pond Design Considering Varying Design Storms Land Development Results in Increased Peak Flow Rates and Runoff Volumes Developed area Robert Pitt Department of Civil, Construction and Environmental
The Source Loading and Management Model (SLAMM)
") The Source Loading and Management Model (SLAMM) A Water Quality Management Planning Model for Urban Stormwater Runoff Robert Pitt, P.E., Ph.D., DEE Department of Civil and Environmental Engineering, The
The Source Loading and Management Model (SLAMM) A Water Quality Management Planning Model for Urban Stormwater Runoff Robert Pitt, P.E., Ph.D., DEE Department of Civil and Environmental Engineering, The
Conservation Design Approach for New Development
 Effective Best Management Practices in Urban Areas Chad Christian City of Tuscaloosa, AL Robert Pitt University of Alabama Tuscaloosa, AL Energy Independence and Security Act of 2007 signed into Law on
Stormwater Conservation
 Stormwater Conservation Design Case Study Robert Pitt, P.E., Ph.D., DEE Department of Civil and Environmental Engineering The University of Alabama Photo by Lovena, Harrisburg, PA Receiving Water Effects
Stormwater Effects. The Selection of an Urban Runoff Control Program using Decision Analysis. Birmingham, AL, rains from 1952 through 1989
 The Selection of an Urban Runoff Control Program using Decision Analysis Robert Pitt Department of Civil, Construction, and Environmental Engineering University of Alabama Tuscaloosa, AL, USA 35487 Stormwater
WinSLAMM v 10 Theory and Practice
 WinSLAMM v 10 Theory and Practice Using WinSLAMM v10 to Meet Urban Stormwater Management Goals 1 We will cover... WinSLAMM Purpose, History and Unique Features Model Applications Small Storm Hydrology
Evapotranspiration Calculations for Stormwater Quality Models
 Bob Pitt Cudworth Professor of Urban Water Systems Department of Civil, Construction, and Environmental Engineering University of Alabama Tuscaloosa, AL USA B.S. Engineering Science, Humboldt State University,
Evapotranspiration Calculations for Stormwater Quality Models
 Bob Pitt Cudworth Professor of Urban Water Systems Department of Civil, Construction, and Environmental Engineering University of Alabama Tuscaloosa, AL USA B.S. Engineering Science, Humboldt State University,
Environment, Energy, Security & Sustainability (E2S2)
") Environment, Energy, Security & Sustainability (E2S2) Modeling Your Way Through EISA Patrick N. Deliman, PhD Environmental Laboratory US Army Engineer Research and Development Center US Army Corps of Engineers
Environment, Energy, Security & Sustainability (E2S2) Modeling Your Way Through EISA Patrick N. Deliman, PhD Environmental Laboratory US Army Engineer Research and Development Center US Army Corps of Engineers
Modeling Green Infrastructure Compared with Large-Scale Monitoring at Kansas City, MO
 X Modeling Green Infrastructure Compared with Large-Scale Monitoring at Kansas City, MO Robert Pitt and Leila Talebi The US EPA s Green Infrastructure Demonstration project in Kansas City, MO, is likely
This information can be obtained from good aerial photographs for existing areas, or from project. This area is entered into the main land use screen,
 Module 4: WinSLAMM and Stormwater Controls Robert Pitt University of Alabama, Tuscaloosa, AL Porous pavement and bioretention controls for roof and parking lot runoff, Portland, OR The first step in using
Design Example Residential Subdivision
 Design Example Residential Subdivision Rhode Island Stormwater Design and Installation Standards Manual December 2010 Public Training March 22, 2010 Richard Claytor, P.E. 508-833-6600 Appendix D: Site
Water Resources Management Plan
 B u r n s v i l l e M i n n e s o t a Water Resources Management Plan - Volume Control / Infiltration Worksheet This Appendix contains a worksheet and related information that can be used for evaluating
How Climate Change Impacts Urban Runoff and Water Quality Design
 How Climate Change Impacts Urban Runoff and Water Quality Design by J. C. Hayes, C. Privette, III and S. J. Klaine AWRA Conference Anchorage, AK May 4-7, 2009 Presentation Outline Introduction: Why manage
Water Resources Management Plan Appendix B
 B u r n s v i l l e M i n n e s o t a Water Resources Management Plan Appendix B Appendix B Page B-1 Burnsville, Minnesota STORM WATER LOW-IMPACT DEVELOPMENT GUIDE MANUAL SHORT ELLIOTT HENDRICKSON INC.
EVALUATION OF VOLUME IN TWO BIOSWALE. Judy Horwatich US Geological Survey
 EVALUATION OF VOLUME IN TWO BIOSWALE Judy Horwatich US Geological Survey COOPERATORS Wisconsin Department of Transportation Wisconsin Department of Natural Resources Support Changes to State Technical
2. The Integration of Water Quality and Drainage Design Objectives
 Copyright R. Pitt 2003 August 12, 2003 2. The Integration of Water Quality and Drainage Design Objectives Introduction...1 Rainfall and Runoff Characteristics for Urban Areas...2 Small Storm Hydrology...9
Stormwater Volume and Treatment Methods Simplifying the Numbers. IAFSM March 10, Presented by: Tom Powers P.E., CFM, LEED AP, CPESC
 Stormwater Volume and Treatment Methods Simplifying the Numbers IAFSM March 10, 2011 Presented by: Tom Powers P.E., CFM, LEED AP, CPESC Introduction GOALS: Improve understanding of Rate and Volume (Quantity)
Particulate Transport in Grass Swales
 Particulate Transport in Grass Swales Robert Pitt, P.E., Ph.D., DEE and S. Rocky Durrans, P.E., Ph.D. Department of Civil, Construction, and Environmental Engineering The University of Alabama Yukio Nara
World Environmental and Water Resources Congress, ASCE/EWRI Omaha, Nebraska, May 21 26, Integrated Watershed Management.
 Integrated Watershed Management Robert Pitt 1 1 Department of Civil, Construction, and Environmental Engineering. The University of Alabama, Tuscaloosa, AL 35487 USA; email: rpitt@eng.ua.edu Introduction
10/16/2013. The Big Picture of LID and Green Infrastructure. Learning Objectives
 Low impact development (LID) the basic idea behind LID is to manage stormwater in a way that imitates the natural hydrology of a site. Details Matter Selection, Design, and Implementation of Low Impact
Leila Talebi and Robert Pitt. Department of Civil, Construction, and Environmental Engineering, The University of Alabama, P.O. Box , Tuscaloosa
 Leila Talebi and Robert Pitt Department of Civil, Construction, and Environmental Engineering, The University of Alabama, P.O. Box 870205, Tuscaloosa May 2012 Global consumption of water increases every
Appendix A. Compliance Calculator Guidance
 Compliance Calculator Guidance Appendix A Appendix A. Compliance Calculator Guidance A.1 Introduction The Center for Watershed Protection created the compliance calculator spreadsheet to allow a designer
Shirley E. Clark, Ph.D., P.E. October 5, /30/2012
 Shirley E. Clark, Ph.D., P.E. October 5, 2012 Prior development decisions have led to directly connected impervious areas and pervious areas with heavily-compacted soils. Prince Georges Cty, MD photo 1
Compacted Urban Soils Effects on Infiltration and Bioretention Stormwater Control Designs
 Presented at the 9 th International Conference on Urban Drainage. IAHR, IWA, EWRI, and ASCE. Portland, Oregon, September 8-13, 2002. Compacted Urban Soils Effects on Infiltration and Bioretention Stormwater
Names: ESS 315. Lab #6, Floods and Runoff Part I Flood frequency
 Names: ESS 315 Lab #6, Floods and Runoff Part I Flood frequency A flood is any relatively high flow of water over land that is not normally under water. Floods occur at streams and rivers but can also
Concurrent Session B: LID Design Specifications (Chapter 4 in Draft Manual)
") Concurrent Session B: LID Design Specifications (Chapter 4 in Draft Manual) Should vs. Must In Chapter 4, should means should, and must means must. Poorly Drained Soils Well-Drained Soils Flat Terrain
Concurrent Session B: LID Design Specifications (Chapter 4 in Draft Manual) Should vs. Must In Chapter 4, should means should, and must means must. Poorly Drained Soils Well-Drained Soils Flat Terrain
Modeling Infiltration BMPs
 Modeling Infiltration BMPs CAHILL ASSOCIATES Environmental Consultants West Chester, PA (610) 696-4150 www.thcahill.com Design Goals for Calculations 1. Mitigate Peak Rates 2-Year to 100-Year 2. No Volume
Appendix F. Flow Duration Basin Design Guidance
 Appendix F Flow Duration Basin Design Guidance Appendix F FINAL REPORT F:\SC46\SC46.31\HMP Mar 05\Appendices\Appendix F FLY_HMP.doc MARCH 2005 Appendix F Flow Duration Basin Design Guidance Prepared by
WinSLAMM, the Source Loading and Management Model
 January 17, 2013 WinSLAMM, the Source Loading and Management Model WinSLAMM, the Source Loading and Management Model, was started in the mid-1970 s as part of early EPA sponsored street cleaning and receiving
Jason R. Vogel, Ph.D., P.E. Biosystems and Agricultural Engineering Oklahoma State University
 Stormwater 101 OKLAHOMA STATE UNIVERSITY Biosystems and Agricultural Engineering Department Jason R. Vogel, Ph.D., P.E. Biosystems and Agricultural Engineering Oklahoma State University Stormwater is excess
Effects of Stormwater
 The Science of Stormwater - Effects - Sources and Characterization -Control Robert Pitt Department of Civil, Construction and Environmental Engineering The University of Alabama Tuscaloosa, AL 35487 Issues
LID PLANTER BOX MODELING
 LID PLANTER BOX MODELING Clear Creek Solutions, Inc., 2010 Low Impact Development (LID) planter boxes are small, urban stormwater mitigation facilities. They are rain gardens in a box. WWHM4 provides the
Design of Stormwater Wetlands
 Hydraulic & Hydrologic Stormwater Engineering Design of Stormwater Wetlands Jon Hathaway, EI Extension Associate NCSU Bio. And Ag. Engineering 6 Step Process 1. Watershed Analysis (Runoff Volume and Peak
15A NCAC 02H.1005 STORMWATER REQUIREMENTS: COASTAL COUNTIES
 1 1 1 1 1 1 1 1 0 1 0 1 1A NCAC 0H.0 STORMWATER REQUIREMENTS: COASTAL COUNTIES (a) The following definitions are applicable to this rule: (1) Built upon area as defined in Session Law 00- means that portion
CENTRALIZED BMPS TYPICALLY PUBLICLY OWNED & MAINTAINED BMPS, TREATING A LARGE (>20 ACRES) URBAN DRAINAGE WITH MULTIPLE LAND
 URBAN DRAINAGE WITH MULTIPLE LAND") BMP RAM BMP Type Definitions 1 CENTRALIZED BMPS TYPICALLY PUBLICLY OWNED & MAINTAINED BMPS, TREATING A LARGE (>20 ACRES) URBAN DRAINAGE WITH MULTIPLE LAND USES AND OWNERSHIP STRUCTURAL BMP TYPE OTHER NAMES
BMP RAM BMP Type Definitions 1 CENTRALIZED BMPS TYPICALLY PUBLICLY OWNED & MAINTAINED BMPS, TREATING A LARGE (>20 ACRES) URBAN DRAINAGE WITH MULTIPLE LAND USES AND OWNERSHIP STRUCTURAL BMP TYPE OTHER NAMES
Infiltration Trench Factsheet
 Infiltration Trench Factsheet Infiltration Trench is a practice that provides temporary storage of runoff using the void spaces within the soil/sand/gravel mixture that is used to backfill the trench for
Stormwater Management Studies in Areas Undergoing Reconstruction Following the Tornado that Hit Tuscaloosa, AL
 Stormwater Management Studies in Areas Undergoing Reconstruction Following the Tornado that Hit Tuscaloosa, AL Redahegn Sileshi, Robert Pitt 2, Shirley Clark 3, and Chad Christian 4 PhD Candidate, The
Pennsylvania Stormwater Best Management Practices Manual. Chapter 3. Stormwater Management Principles and Recommended Control Guidelines
 Pennsylvania Stormwater Best Management Practices Manual Chapter 3 Stormwater Management Principles and Recommended Control Guidelines 363-0300-002 / December 30, 2006 Chapter 3 Stormwater Management Principles
Low Impact Development in Western WA Municipal Stormwater Permits
 Low Impact Development in Western WA Municipal Stormwater Permits USGS Tacoma Office September 19, 2012 E-mail: eobr461@ecy.wa.gov ttp://www.ecy.wa.gov/programs/wq/stormwater/municipal/index.html Municipal
Hydrologic Modeling for Green Roofs, Rainwater Harvesting and LID Foundations
 Hydrologic Modeling for Green Roofs, Rainwater Harvesting and LID Foundations Robin Kirschbaum, PE, LEED AP Alice Lancaster, PE May 8, 2013 Presentation Outline Overview of Hydrologic Modeling Performance
WinSLAMM: Integrating Stormwater Management and Green Technologies
 WinSLAMM: Integrating Stormwater Management and Green Technologies Robert Pitt Department of Civil, Construction, and Environmental Engineering The University of Alabama Tuscaloosa, AL 35487 1 Modeling
Pre-Treatment Bioretention Cells Bioswales IOWA STORMWATER MANAGEMENT MANUAL DECEMBER 16, 2015
 Pre-Treatment Bioretention Cells Bioswales IOWA STORMWATER MANAGEMENT MANUAL DECEMBER 16, 2015 Urban Runoff Background How we got here What Problem?? Provenance of the Problem Unified Sizing Criteria What
Using WinSLAMM v10 to Predict Stormwater Pollutant Loads and Evaluate LID Management Approaches Overview
 Evaluating CSO Management Goals through Monitoring and Modeling of Green Infrastructure: Kansas City EPA National Demonstration Project (and some comments from on going Cincinnati Projects) Using WinSLAMM
Drainage Analysis. Appendix E
 Drainage Analysis Appendix E The existing and proposed storm drainage systems have been modeled with Bentley CivilStorm V8 computer modeling software. The peak stormwater discharge was determined for
WinSLAMM v 9.4 User s Guide. Control Devices
 WinSLAMM v 9.4 User s Guide Control Devices Start-Up Hints **Press F1 on any screen within the program to see the corresponding Help File Topic** **Throughout this User s Guide, the text in red walks you
Permeable Pavement Hydrologic Modeling
 Permeable Pavement Hydrologic Modeling Robin Kirschbaum, PE, LEED AP Alice Lancaster, PE April 24, 2013 Presentation Overview Overview of Hydrologic Modeling Performance Standards Modeling Guidelines,
OHIO S NPDES STORMWATER GENERAL PERMIT FOR CONSTRUCTION ACTIVITIES OHC Justin Reinhart, PE Division of Surface Water
 OHIO S NPDES STORMWATER GENERAL PERMIT FOR CONSTRUCTION ACTIVITIES OHC00005 Justin Reinhart, PE Division of Surface Water ASCE Spring Seminar Columbus, Ohio April 26, 2018 Goals / Outline 1. CGP background
Hydrologic Analysis of a Watershed-Scale Rainwater Harvesting Program. Thomas Walsh, MS, PhD Candidate University of Utah
 Hydrologic Analysis of a -Scale Rainwater Harvesting Program Thomas Walsh, MS, PhD Candidate University of Utah 1. Hydrologic analysis of watershed-scale RWH networks targeting stormwater runoff volumes,
6.0 Runoff. 6.1 Introduction. 6.2 Flood Control Design Runoff
 October 2003, Revised February 2005 Chapter 6.0, Runoff Page 1 6.1 Introduction 6.0 Runoff The timing, peak rates of discharge, and volume of stormwater runoff are the primary considerations in the design
SLAMM, the Source Loading and Management Model Robert Pitt and John Voorhees
 Published in: Wet-Weather Flow in the Urban Watershed: Technology and Management. Edited by R. Field and D. Sullivan. CRC Press. Boca Raton, FL. 2002. SLAMM, the Source Loading and Management Model Robert
TMDL and Stormwater Regulations & Policy: Recent Developments and their Implications for MS4 Permit Holders
 14 th Annual EPA Region 6 Stormwater Conference 26 June 2012 TMDL and Stormwater Regulations & Policy: Recent Developments and their Implications for MS4 Permit Holders Michael F. Bloom, PE, CFM, BCEE
Review of State and Federal Stormwater Regulations November 2007
 Review of State and Federal Stormwater Regulations November 2007 By: James T. Spaulding, PE, CPESC Joseph M. Ducharme, Jr., PE TTG ENVIRONMENTAL CONSULTANTS, LLC 27 LOCKE ROAD, CONCORD, NH 03301-5301 TELEPHONE:
Memorandum. MIDS Work Group Barr Engineering Company
 Memorandum To: From: MIDS Work Group Barr Engineering Company Subject: Turf, Phase 2, MIDS Task 2.2: Recommend Credits for MIDS Practices Date: May 31, 2013 Project: 23/62 1050 MIDS Barr was asked to evaluate
WinSLAMM v Program Modifications Final, 3/16/19
 WinSLAMM v 10.4.1 Program Modifications Final, 3/16/19 1. Printing Set up a printing option for.pdf files for input data and output summary data. 2. Added the Pipe input data to the printing input data
Appendix 10-A. Optional Recharge Volume Approach
 Appendix 10-A Optional Recharge Volume Approach Table of Contents APPENDIX SECTION HEADINGS 10-A.0 INTRODUCTION 10-A-2 10-A.1 Horsely Method for Determining Recharge Volumes 10-A-2 10-A.1.1 Basis for Determining
SLAMM, the Source Loading and Management Model Robert Pitt and John Voorhees
 Management of Wet-Weather Flow in the Watershed (Edited by Dan Sullivan and Richard Field). CRC Press, Boca Raton. Publication in 2002. SLAMM, the Source Loading and Management Model Robert Pitt and John
Krista Reininga, PE Hydromodification and What it Means for the Design of Stormwater Facilities
 Krista Reininga, PE Hydromodification and What it Means for the Design of Stormwater Facilities Agenda 1. Evolution of Water Quality Facilities 2. Regulatory Response/MS4 Permit Requirements 3. Change
Site Design Checklist and LID Calculations Worksheet. Draft Revision December 2004
 Site Design Checklist and LID Calculations Worksheet Draft Revision December 2004 Introduction Conventional stormwater management seeks to attenuate flood peaks and treat for stormwater pollutants such
Public Notice U.S. Army Corps of Engineers, Norfolk District
 Public Notice U.S. Army Corps of Engineers, Norfolk District CENAO-REG August 29, 2007 Federal Public Notice Requirement Relative to Low Impact Development On July 22, 2004, August 10, 2006, and February
Process-Based BMP Design Tool for Post-Construction. October 18, 2012
 Process-Based BMP Design Tool for Post-Construction October 18, 2012 EPA s Stated Goal + Reduce, through regulation, the impacts of new development and redevelopment storm water runoff to the Nation s
Contents. R. Pitt July 29, 2011
 Lincoln, Nebraska, Retrofit Stormwater Management Options Performance and Relative Costs Prepared for Wright Waters Engineers, EA Assoc. and the City of Lincoln R. Pitt July 29, 2011 Contents Introduction...
Example 1: Pond Design in a residential development (Water Quantity calculations for a Wet Pond and Wet Extended Detention Pond)
") Chapter 10 Design Examples Example 1: Pond Design in a residential development (Water Quantity calculations for a Wet Pond and Wet Extended Detention Pond) Example 2: Filter Design in a commercial development
Chapter 10 Design Examples Example 1: Pond Design in a residential development (Water Quantity calculations for a Wet Pond and Wet Extended Detention Pond) Example 2: Filter Design in a commercial development
Lesson 37: Low-Impact Urban Development
 Lesson 37: Low-Impact Urban Development 53:171 Water Resources Engineering Low-Impact Development (LID) LID is a site design strategy with a goal of maintaining or replicating the predevelopment hydrologic
CHAPTER 3 Water Quality Standards
 Table of Contents CHAPTER 3 Water Quality Standards 3.1 Water Quality Protection Approach... 3-1 3.2 General Policies... 3-2 3.3 Water Quality Management... 3-2 3.3.1 Minimum Standard and General Policies...3-2
4. Ponds and infiltration BMPs can achieve 60 to 100% removal efficiencies for sediment.
 Landscape BMPs For the purposes of this project, preventive measures have been categorized into two categories: landscape BMPs and source prevention BMPs. Landscape BMPs includes both vegetative practices
DIRECTLY CONNECTED IMPERVIOUS AREAS AS MAJOR SOURCES OF URBAN STORMWATER QUALITY PROBLEMS-EVIDENCE FROM SOUTH FLORIDA
 DIRECTLY CONNECTED IMPERVIOUS AREAS AS MAJOR SOURCES OF URBAN STORMWATER QUALITY PROBLEMS-EVIDENCE FROM SOUTH FLORIDA Joong G. Lee and James P. Heaney Dept. of Civil, Environmental, and Architectural Engineering
HMP 101 Hydromodification Management Plan for Santa Clara Valley Guidance for Local Implementation
 HMP 101 Hydromodification Management Plan for Santa Clara Valley Guidance for Local Implementation Jill C. Bicknell, P.E., EOA, Inc. Assistant Program Manager EOA, Inc. GeoSyntec Consultants Presentation
Runoff Calculations. Time of Concentration (T c or t c ) from one location to another within a watershed. Travel
 from one location to another within a watershed. Travel") Runoff Calculations Bob Pitt University of Alabama and Shirley Clark Penn State Harrisburg Time of Concentration and Travel Time (based on Chapter 3 of TR-55) Time of Concentration (T c ): time required
Runoff Calculations Bob Pitt University of Alabama and Shirley Clark Penn State Harrisburg Time of Concentration and Travel Time (based on Chapter 3 of TR-55) Time of Concentration (T c ): time required
Sustainable Water Resource Practices
 Sustainable Water Resource Practices This section is related to and shoudl be read in conjunction with the Land Use Element, and Conservation Element. Implementing sustainable water resource practices
FORT COLLINS STORMWATER CRITERIA MANUAL Hydrology Standards (Ch. 5) 1.0 Overview
 1.0 Overview") Chapter 5: Hydrology Standards Contents 1.0 Overview... 1 1.1 Storm Runoff Determination... 1 1.2 Design Storm Frequencies... 1 1.3 Water Quality Storm Provisions... 2 1.4 Design Storm Return Periods...
Chapter 5: Hydrology Standards Contents 1.0 Overview... 1 1.1 Storm Runoff Determination... 1 1.2 Design Storm Frequencies... 1 1.3 Water Quality Storm Provisions... 2 1.4 Design Storm Return Periods...
Module 3: Rainfall and Hydrology for Construction Site Erosion Control
 Module 3: Rainfall and Hydrology for Construction Site Erosion Control Robert Pitt Department of Civil, Construction, and Environmental Engineering University of Alabama Tuscaloosa, AL Rainfall and Hydrology
WinSLAMM v Program Modifications Final, 12/12/17
 WinSLAMM v 10.3.4 Program Modifications Final, 12/12/17 1. Corrected an error in the Biofilter caused by an improperly defined variable that caused an overflow during very long model runs. 2. Corrected
APPENDIX F RATIONAL METHOD
 7-F-1 APPENDIX F RATIONAL METHOD 1.0 Introduction One of the most commonly used procedures for calculating peak flows from small drainages less than 200 acres is the Rational Method. This method is most
December 20, MMSD Contract No: M03002P01 MMSD File Code: M009PE000.P7400
 December 20, 2011 MMSD Contract No: M03002P01 MMSD File Code: M009PE000.P7400 Determining the Potential of Green Infrastructure to Reduce Overflows in Milwaukee Prepared for: Milwaukee Metropolitan Sewerage
Section 1 - Introduction
 VERSION 1.0 Stormwater Solutions for Residential Sites Section 1 - Introduction Prepared for EcoWater Solutions A Department of Waitakere City Council 113 Central Park Drive Henderson WAITAKERE CITY November
Urbanizing Watersheds: Green Infrastructure and Hydrologic Function. Jay Dorsey, PE, PhD ODNR-DSWR October 30, 2014
 Urbanizing Watersheds: Green Infrastructure and Hydrologic Function Jay Dorsey, PE, PhD ODNR-DSWR October 30, 2014 Green Infrastructure Objectives Intentional about maintaining/replacing ecosystem functions
Preliminary Drainage Analysis
 Preliminary Drainage Analysis Tanimura and Antle Employee Housing Town of Spreckels County of Monterey, California LIB150205 May 29, 2015 Prepared For: Tanimura and Antle Produce Prepared By: 9699 Blue
Sustainable Urban Stormwater Best Management Practices with InfoSWMM Sustain plus InfoSWMM 2D and SWMMLive
 Sustainable Urban Stormwater Best Management Practices with plus InfoSWMM 2D and SWMMLive Contents 01 Introduction to Sustain What is and How Can it Help Evaluate BMPs and LIDs for sustainability goals?
Rational Method Hydrological Calculations with Excel COURSE CONTENT
 Rational Method Hydrological Calculations with Excel Harlan H. Bengtson, PhD, P.E. COURSE CONTENT 1. Introduction Calculation of peak storm water runoff rate from a drainage area is often done with the
Effectiveness of Non-Structural Measures in Watershed Restoration
 Effectiveness of Non-Structural Measures in Watershed Restoration Bill Frost, PE, D.WRE Sr. Water Resources Engineer KCI Technologies, Inc. Sparks, MD 2011 Low Impact Development Symposium Philadelphia,
Paraprofessional Training Session 1
 Paraprofessional Training Session 1 Part 2: Stormwater Basics November 26, 2012 Rutgers University, Cook Campus Christopher C. Obropta, Ph.D., P.E. Extension Specialist in Water Resources Associate Professor
Sizing Calculations and Design Considerations for LID Treatment Measures
 SCVURPPP C.3 Workshop December 18, 2012 Sizing Calculations and Design Considerations for LID Treatment Measures Jill Bicknell, P.E., EOA, Inc. Santa Clara Valley Urban Runoff Pollution Prevention Program
APPENDIX IV. APPROVED METHODS FOR QUANTIFYING HYDROLOGIC CONDITIONS OF CONCERN (NORTH ORANGE COUNTY)
") APPENDIX IV. APPROVED METHODS FOR QUANTIFYING HYDROLOGIC CONDITIONS OF CONCERN (NORTH ORANGE COUNTY) Hydromodification design criteria for the North Orange County permit area are based on the 2- yr, 24-hr
APPENDIX IV. APPROVED METHODS FOR QUANTIFYING HYDROLOGIC CONDITIONS OF CONCERN (NORTH ORANGE COUNTY) Hydromodification design criteria for the North Orange County permit area are based on the 2- yr, 24-hr
CHELTENHAM TOWNSHIP Chapter 290: WATERSHED STORMWATER MANAGEMENT Article IV: Stormwater Management
 CHELTENHAM TOWNSHIP Chapter 290: WATERSHED STORMWATER MANAGEMENT Article IV: Stormwater Management Online ECode Available on Cheltenham Township Website at: http://ecode360.com/14477578 For all regulated
WinSLAMM v 10.0 User s Guide. Stormwater Control Devices
 WinSLAMM v 10.0 User s Guide Stormwater Control Devices Control Devices Summary Biofiltration Catch Basins Cisterns Media Filters Other Control Device Porous Pavement Filter Strips Street t Cleaning Grass
Decatur, Georgia Stormwater Management Policy Guidelines. DRAFT November 5, 2014
 Decatur, Georgia Stormwater Management Policy Guidelines Stormwater Management Policy Guidelines Decatur, Georgia STORMWATER MANAGEMENT POLICY GUIDELINES 1.0 Introduction... 3 2.0 Determining Predevelopment
Computational Methods in Low Impact Development Stormwater Controls Part 1: Hydrology and Hydraulics Part 2: Case Studies and Models
 2011 Low Impact Development Symposium Computational Methods in Low Impact Development Stormwater Controls Part 1: Hydrology and Hydraulics Part 2: Case Studies and Models Bill Lucas Integrated Land Management
Chapter 6. Hydrology. 6.0 Introduction. 6.1 Design Rainfall
 6.0 Introduction This chapter summarizes methodology for determining rainfall and runoff information for the design of stormwater management facilities in the City. The methodology is based on the procedures
Treatment Volume: Curve Numbers. Composite CN or Not? Treatment Volume: Curve Numbers. Treatment Volume: Calculation. Treatment Volume: Calculation
 Stormwater Engineering Bioretention Design Bill Hunt, PE, Ph.D. Extension Specialist & Assistant Professor NCSU-BAE www.bae.ncsu.edu/stormwater Bioretention Design Six Step Process 1 Determine Volume to
Chapter 3 Calculating the WQCV and Volume Reduction
 Contents 1.0 Introduction... 1 2.0 Hydrologic Basis of the WQCV... 1 2.1 Development of the WQCV... 1 2.2 Optimizing the Capture Volume... 3 2.3 Attenuation of the WQCV (BMP Drain Time)... 4 2.4 Excess
Applying the Water Quality Volume
 Applying the Water Quality Volume Justin Reinhart, PE Division of Surface Water Northeast Ohio Stormwater Training Council Cleveland, Ohio & Richfield, Ohio July 12, 2018 July 25, 2018 Post-Construction
Chapter 12. VIRGINIA RUNOFF REDUCTION METHOD Compliance Spreadsheet User s Guide & Documentation (Version 2.7, April 2013) Table of Contents
 Table of Contents") Virginia Stormwater Management Handbook, Chapter 11 July 2013 Chapter 12 VIRGINIA RUNOFF REDUCTION METHOD Compliance Spreadsheet User s Guide & Documentation (Version 2.7, April 2013) Table of Contents
Virginia Stormwater Management Handbook, Chapter 11 July 2013 Chapter 12 VIRGINIA RUNOFF REDUCTION METHOD Compliance Spreadsheet User s Guide & Documentation (Version 2.7, April 2013) Table of Contents
Chapter 1. Introduction
 Chapter 1 Introduction James P. Heaney, Robert Pitt, and Richard Field Introduction Stormwater has traditionally been considered a nuisance, requiring rapid and complete drainage from areas of habitation.