Western U.S. Air Quality Issues
|
|
|
- Cori Phelps
- 6 years ago
- Views:
Transcription
1 Western U.S. Air Quality Issues Tom Moore Western Regional Air Partnership May 9, 2011
2 Monitoring Emissions Fire Oil & Gas Example Air Quality Assessments & Modeling Gridded Emissions (maybe)
3 Monitoring

4 3-year Average 4 th Highest 8-Hour Ozone value by County AQS Federal Reference Method data from the monitoring site in each County with the highest Ozone values (map revised October 8, 2010)
5 3-year Average 4 th Highest 8-Hour Ozone value for Rural/Class I Sites AQS Federal Reference Method data from rural or Class I area monitoring sites (map revised October 8, 2010)
6 3-year Average 4 th Highest 8-Hour Ozone Design Value for selected Urban Counties currently in Attainment AQS Federal Reference Method data from the monitoring site in each County with the highest Ozone values (map revised October 8, 2010)

7 Average Annual Count of Days with 8-Hour Ozone Averages > 60 ppb for Rural/Class I Monitoring Sites through 2009 AQS Federal Reference Method data from rural or Class I area monitoring sites (map revised October 8, 2010)

8 IMPROVE Monitored Baseline Extinction for 20% Worst Days 8

9 Regional precipitation N trends NO 3 - NH 4 + Lehman et al., 2005
10 Emissions

11 WRAP - before BART
12 Western State Power Plant Emissions Trends 600, ,000 Future 500, , , , , ,000 SO2 (tpy) 200,000 NOx (tpy) 150,000 mmbtu/10, , After BART Ozone Standard
13 105 Projected Change in Anthropogenic NOx Emissions from 2002 to % Change in NOx emissions AZ CA CO ID MT ND NM NV OR SD UT WA WY Point Area + O&G On-Road Mobile Off-Road Mobile Anthro Fire 13

14 NO x Emissions from Western US Power Plants Isolated plants have discrete signatures in satellite retrievals Power plant emissions are measured continuously at each stack Post-combustion NO x controls on large coal-burning plants are now proposed North Valmy Colstrip Intermountain Hunter / Huntington Reid Gardener Dave Johnston/ Laramie River Jim Bridger/ Naughton Craig/Hayden Mohave Bonanza Navajo Four Corners/ San Juan Cholla/Coronado/ Springerville SCIAMACHY satellite instrument, Summer Kim, Frost et al.

15 NO x Emissions from Western US Urban Areas + Likely Ozone Urban and/or High Ambient Concentration Areas Build on satellite-model comparisons for power plants Evaluate urban area emission inventories and monitor changes Warm Season Ozone NAAQS Likely Urban Nonattainment Areas Boise Denver/Northern Front Range, also Colorado Springs? Salt Lake City Reno Sacramento San Francisco Fresno Bakersfield Los Angeles Albuquerque / Santa Fe Las Vegas Phoenix Tucson Kim, Frost et al., modified by Moore El Paso 15 SCIAMACHY satellite instrument, Summer 2005
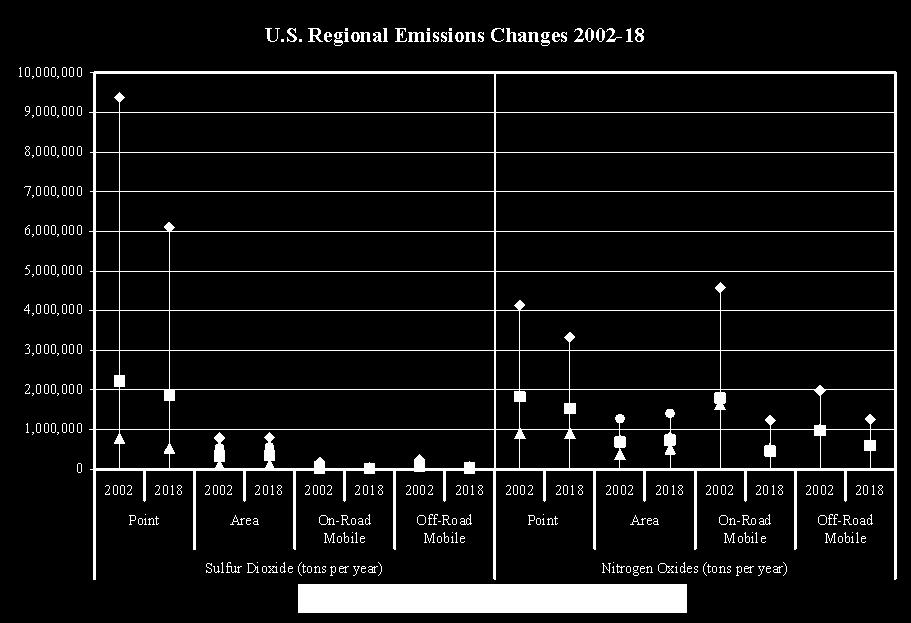
16 Change in SO2 Emissions (tpy) 2002 to 2018 across North America All SO 2 Sources 2002 to 2018 Canada CENRAP Eastern US Mexico Pacific Off-Shore WRAP Tons/year -159, ,526-3,856, , , ,348 % -7% -16% -36% +14% +88% -32% 16

17 Change in NOx Emissions (tpy) 2002 to 2018 across North America All NO x Sources 2002 to 2018 Canada CENRAP Eastern US Mexico Pacific Off- Shore WRAP Tons/year -17,043-1,947,438-4,765, , ,972-1,518,746 % -1% -33% -40% +39% +76% -33% 17

18 Projected Change in WRAP Region Anthropogenic NOx Emissions* from 2002 to 2018 (California removed**) * Does not reflect NOx BART after Spring 2009, O&G growth/controls after Spring 2007, & state/local rules after Spring 2009 ** California too large to show 18
, WRAP O&G Area up 310,648 tons (+71%) Questions & more work needed on methane, speciation, spatial/temporal/source type allocation")
19 Change in WRAP region Gaseous Volatile Organic Compound Emissions (tpy) 2002 to Mobile down 785,779 tons (-50%), Point up 40,176 tons (+15%), Area up 499,144 tons (+38%), WRAP O&G Area up 310,648 tons (+71%) Questions & more work needed on methane, speciation, spatial/temporal/source type allocation 19


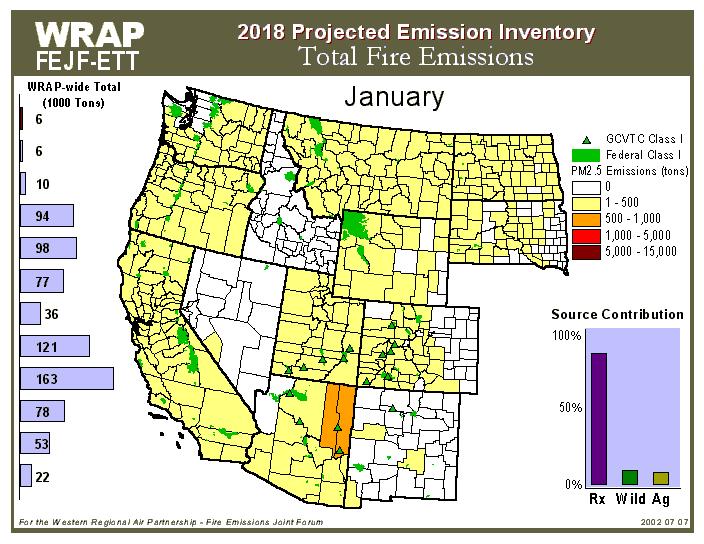
20 Smoke/Fire & the Ozone and PM NAAQS, Regional Haze Rule Fire The Big Picture Technical Products for air quality planning & management as required by the Clean Air Act Future emissions, efforts to avert emissions & health/visibility impacts, & adapt to a changing/varying climate U.S. Wildfire & Prescribed Fires Acres Burned (1990 through 2009) 10,000,000 8,000,000 6,000,000 4,000,000 2,000, Wildfire Acres Prescribed Fire Acres

21 Small (Prescribed) Fires 59% of July events 2% of July fire PM2.5 91% of November events 38% of November fire PM2.5 Emissions from Large Wildfires were analyzed separately with from Small Prescribed Fires with 12km CMAQ model No fires less than 100 acres in timber, 300 acres in grass/brush were in database Large wildfires removed were generally 10,000+ acres Resulting Modeled Visibility Impairment by Fires in 2002 Large Wildfires Small (Prescribed) Fires 21


22 Fires and Ozone (urban contributor to urban impacts, direct formation from fire event(s), precursor transport?) Wildfire Agricultural Fire Prescribed Fire Residential Wood Burning

23 RPO Wildfire emissions estimate
 2002 to 2018 across")
24 Change in Primary Organic PM2.5 Emissions (tpy) 2002 to 2018 across North America 24
25 WRAP Region Fire PM2.5 Emissions Scenarios (tpy) 2,000,000 1,500,000 1,000, , Actual Baseline Average 2018 Planning - Baseline Average with ERTs 2018 Projection A - FLM-proposed activities 2018 Projection B - Climate conditions/ resource limited 2018 Projection C - Max. application of Prescribed Fire Prescribed Fire 71,421 72,218 64, ,020 97, ,206 Wildland Fire Use 81,505 41,171 41, ,594 1,319, ,594 Wildfire 1,489, , , , , ,654 Agricultural Fire 34,571 34,590 34,590 34,590 34,590 34,590 N-F Rangeland Fire 15,454 15,454 15,454 18,643 18,643 18,643
26

27 Dust PM emissions used in WRAP regional haze analysis

28 Oil and Gas Production in the Rocky Mountains Boom in oil and gas production in this region over the last ten years driven by record prices for crude oil and natural gas Colorado gas production in 1996: 572 billion cubic feet Colorado gas production in 2006: 1.2 trillion cubic feet Activity supported by large fleet of equipment at thousands of individual well sites Partial inventory of this equipment through state permitting databases Wide state-to-state variation in permitting thresholds and source categories permitted


29 EASTERN UTAH 2006 Oil and Gas Production BLM proposed leasing for oil shale development BLM proposed leasing for tar sands development Indian Country Regulatory authority controlled by the Tribes and EPA Oil Shale Leasing Tar Sands Leasing Indian Country
30 NOx Emissions from Oil & Gas
31 Example Air Quality Assessments & Modeling
 Tong, D. Q. and Mauzerall, D. L.")

32 California Ozone Transport - Source Apportionment Study Results Ozone Source Apportionment Monthly Mean Results (WRAP region states highlighted) Tong, D. Q. and Mauzerall, D. L. Summertime State-Level Source- Receptor Relationships between Nitrogen Oxides Emissions and Surface Ozone Concentrations over the Continental United States. Environmental Science & Technology, Volume 42, Number 21, 2008.

33 Source: Four Corners Modeling Report 33
34 Evolutional change in National Air Pollution Management Initial CAA Biogenics Regional science 8-hr ozone PM 2.5 (annual driver) Regional Rules New PM Standards Daily/annual drivers Climate-AQ Hemispherical Transport Local/urban Regional Hemispheric 34 R. Scheffe, November 2009

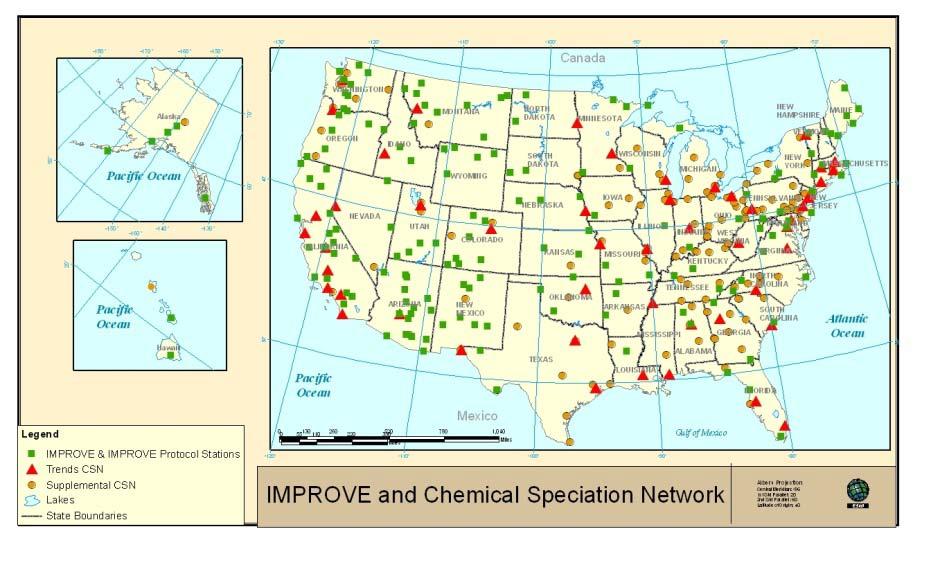
35 National Nitrogen Observation Networks Also SEARCH, NPS SLAMS NADP CASTNET PM speciation NCORE 35
36 Existing and proposed sentinel sites LRTAP 2007 assessment Å Alert Å ZeppelinMt. Å Existingsites Åú Recommended Å Pt.Barrow Å MaunaLoa Å Mt.Batchelor Å TrinidadHead Åú Å WhitefaceMt. Åú Å Pico-NARE Å Izana Å Sodakayla Å Pallas Å MaceHead Å Jungfraujoch Åú Mt. Waliguan Å Åú Å Mt. Tai Å Mt.Huangi Minamitorishima Åú Åú Å 36
37 What s missing 1 st what is adequate (relative terms) Great NO network wet and dry nitrate But, Rural coverage in general especially Western States Virtually no true NO 2 observations Skeleton NOy network Missing routine and sustained vertical profile and aloft data Sentinel transport sites Reliance on occasional intensive studies (2010 CALNEX) 37
38 Rethinking Nitrogen/ozone monitoring in rural/regional scales Opportunities NAAQS New NO2 standard Lead to molecule specific observations N/S secondary standards review Possible growth of NOy observations Increased attention to NH3 catalyze blending models and obs (spatial scarcity and wet-dry anomalies) Tighter primary ozone standards & secondary ozone standard Spread to regional/western locations Greater influence of hemispherical transport Collaborations across agencies, remote sensing Blending models and observations 38
; right - GOME NO2 trends from 1995 2002 (after Richter, 2005). Clear evidence of reductions in midwest U.S.")
 and Sundays (right) indicating weekend/weekday patterns associated with reduced")
39 Satellites provide best source of ambient NO 2 : Accountability and Trends Figure 20. Left - superimposed Eastern U.S. emission and combined GOME and SCIAMACHY NO trends (Kim et al., 2006); right - GOME NO2 trends from (after Richter, 2005). Clear evidence of reductions in midwest U.S. and European NOx emissions, and increased NOx generated in Eastern Asia. Figure OMI NO2 column images aggregated for all Fridays (left) and Sundays (right) indicating weekend/weekday patterns associated with reduced Sunday emissions (source, Husar). 39

40 Global Distribution of Nitrogen Dioxide: Precursors to Ozone Formation (Fishman) Tropospheric NO 2 columns retrieved from the SCIAMACHY satellite instrument for (after Martin et al., 2002) 40
41 Gridded Emissions
42 VOC Emissions from Wildfire
43 VOC Emissions from Oil & Gas
44 VOC Emissions from Biogenics
45 VOC Emissions from Off-Road Mobile Sources

46 VOC Emissions from On-Road Mobile Sources
47 VOC Emissions from Non-Point (Area) Sources
48 NOx Emissions from Biogenics
49 NOx Emissions from Off-Road Sources
50 NOx Emissions from On-Road Sources
51 NOx Emissions from Oil & Gas

52 NOx Emissions from Point Sources
53 NOx Emissions from Non-Point (Area) Sources

54 NOx Emissions from Wildfire
55 Thanks Tom Moore
56
57
WRAP Activities and Regional Transport/Source Apportionment Issues
 WRAP Activities and Regional Transport/Source Apportionment Issues Tom Moore, Air Quality Program Manager WRAP/Western Governors Association Pima Association of Governments Air Quality Forum Tucson, AZ
Revised EPA Ozone Standard Effects in the West. May 15, 2008
 Revised EPA Ozone Standard Effects in the West May 15, 2008 EPA - all Ozone Monitoring Sites during 2004-06 1055 ozone monitoring sites with complete data, 2004-06 240 ozone monitoring sites with incomplete
May 13, Tom Moore WRAP Air Quality Program Manager WESTAR Council WRAP-EPA Western Air Quality Modeling Workshop Boulder, CO
 May 13, 2015 Tom Moore WRAP Air Quality Program Manager WESTAR Council 2015 WRAP-EPA Western Air Quality Modeling Workshop Boulder, CO 1 Topics Overview of the WESTAR/WRAP organization Key issues and areas
April 9, Tom Moore WRAP Air Quality Program Manager WESTAR Council. San Francisco, CA
 April 9, 2015 Tom Moore WRAP Air Quality Program Manager WESTAR Council San Francisco, CA 1 Topics selected Western sources what the monitoring data are telling us interpreting modeling results for ozone
April 14, Tom Moore WRAP Air Quality Program Manager WESTAR Council
 April 14, 2015 Tom Moore WRAP Air Quality Program Manager WESTAR Council EPA 2015 International Emission Inventory Conference "Air Quality Challenges: Tackling the Changing Face of Emissions" San Diego,
April 2, Tom Moore WRAP Air Quality Program Manager WESTAR Council. Fish Camp, CA
 April 2, 2015 Tom Moore WRAP Air Quality Program Manager WESTAR Council Fish Camp, CA 1 Topics Overview of WESTAR and WRAP regional organizations Key issues and areas of focus Ozone analysis: Results from
Upstream Oil and Gas Emission Inventories in the Inter-Mountain West Tom Moore WRAP/WESTAR
 Upstream Oil and Gas Emission Inventories in the Inter-Mountain West Tom Moore WRAP/WESTAR National Tribal Forum on Air Quality Swinomish Indian Tribal Community, Anacortes, WA May 14, 2014 Overview Emission
SCOPE OF WORK: TECHNICAL SUPPORT FOR WRAP ACTIVITIES TO ADDRESS POINT AND AREA SOURCE EMISSIONS October 14, 2004
 SCOPE OF WORK: TECHNICAL SUPPORT FOR WRAP ACTIVITIES TO ADDRESS POINT AND AREA SOURCE EMISSIONS October 14, 2004 1.0 PURPOSE AND GENERAL REQUIREMENTS The purpose of this work is to support WRAP activities
AoH Report Update. Joint DEJF & AoH Meeting, Las Vegas November 15-18, Air Resource Specialists, Inc.
 AoH Report Update Joint DEJF & AoH Meeting, Las Vegas November 15-18, 2004 Air Resource Specialists, Inc. Overview WRAP Strategic Plan, Phases 1 & 2 Review of Phase I report structure Review of Phase I
WESTAR-WRAP Perspectives on Regional Haze
 WESTAR-WRAP Perspectives on Regional Haze 118 Class 1 areas >85 monitors Causes of Haziest Days - 2014 Dark edge indicates urban reference monitor 2016 Midwest and Central States Air Quality Workshop June
WESTAR - WRAP Regional Analysis and Planning. Tom Moore WESTAR - WRAP
 WESTAR - WRAP Regional Analysis and Planning Tom Moore WESTAR - WRAP Western Class 1 area Environment PRELIMINARY DESIGN VALUE by COUNTY* (using AQS data 2013-2015) Alaska and Hawaii at reduced scale Class
TSS Project Update and Demo of Selected Tools
 TSS Project Update and Demo of Selected Tools WRAP IWG Meeting Santa Fe, NM December 7, 2006 Outline WRAP Technical Information Centers TSS Overview Status of TSS functionality Future TSS work TSS training
OAQPS Modeling, monitoring, emissions (AQAD) Updates. Rich Scheffe US EPA Office of Air Quality Planning and Standards
 Updates. Rich Scheffe US EPA Office of Air Quality Planning and Standards") OAQPS Modeling, monitoring, emissions (AQAD) Updates Biogenic 2005 Fires EGU NonEGU Onroad Nonpoint Nonroad Rich Scheffe US EPA Office of Air Quality Planning and Standards 1 Example Benefits to EPA headquarters
OAQPS Modeling, monitoring, emissions (AQAD) Updates Biogenic 2005 Fires EGU NonEGU Onroad Nonpoint Nonroad Rich Scheffe US EPA Office of Air Quality Planning and Standards 1 Example Benefits to EPA headquarters
EPA Regional Modeling for National Rules (and Beyond) CAIR/ CAMR / BART
 CAIR/ CAMR / BART") EPA Regional Modeling for National Rules (and Beyond) CAIR/ CAMR / BART 1 Emissions & Modeling Contacts Pat Dolwick Meteorology and Episodic Ozone Modeling Brian Timin Speciated Modeled Attainment Test
EPA Regional Modeling for National Rules (and Beyond) CAIR/ CAMR / BART 1 Emissions & Modeling Contacts Pat Dolwick Meteorology and Episodic Ozone Modeling Brian Timin Speciated Modeled Attainment Test
Visibility, Haze, and Background Air Pollution in the West
 Visibility, Haze, and Background Air Pollution in the West An overview of visibility issues in the Western United States. Unimpeded visibility in the Western United States is strongly valued because of
WRAP Regional Haze Analysis & Technical Support System
 WRAP Regional Haze Analysis & Technical Support System IMPROVE Steering Committee Meeting September 27, 2006 Technical Analysis Status Report WRAP 2003-08 Strategic Plan identifies Fall 2006 to complete
Recommendations for Monitoring and Modeling Research for use in Ozone Planning
 Recommendations for Monitoring and Modeling Research for use in Ozone Planning Gail Tonnesen, EPA Region 8 WESTAR Ozone Background and Transport Workgroup call September 24, 2015 O3 trends at high elevation
6.0 STATE AND CLASS I AREA SUMMARIES
 6.0 STATE AND CLASS I AREA SUMMARIES As described in Section 2.0, each state is required to submit progress reports at interim points between submittals of Regional Haze Rule (RHR) State Implementation
Intermountain West Data Warehouse Western Air Quality Study (IWDW-WAQS) Applicability of the IWDW-WAQS beyond the West
 Applicability of the IWDW-WAQS beyond the West") Intermountain West Data Warehouse Western Air Quality Study (IWDW-WAQS) Applicability of the IWDW-WAQS beyond the West 2 NPS Air Quality Conditions & Trends Tools (nps.gov) Partners: NPS/ARD Databases
Intermountain West Data Warehouse Western Air Quality Study (IWDW-WAQS) Applicability of the IWDW-WAQS beyond the West 2 NPS Air Quality Conditions & Trends Tools (nps.gov) Partners: NPS/ARD Databases
6.0 STATE AND CLASS I AREA SUMMARIES
 6.0 STATE AND CLASS I AREA SUMMARIES As described in Section 2.0, each state is required to submit progress reports at interim points between submittals of Regional Haze Rule (RHR) State Implementation
6.0 STATE AND CLASS I AREA SUMMARIES
 6.0 STATE AND CLASS I AREA SUMMARIES As described in Section 2.0, each state is required to submit progress reports at interim points between submittals of Regional Haze Rule (RHR) State Implementation
SOURCE APPORTIONMENT MODELING FOR AIR QUALITY FOR OIL AND GAS DEVELOPMENTS UNDER NEPA
 SOURCE APPORTIONMENT MODELING FOR AIR QUALITY FOR OIL AND GAS DEVELOPMENTS UNDER NEPA Krish Vijayaraghavan, John Grant, Tejas Shah, Zhen Liu, Ralph Morris Ramboll Environ, Novato, CA PERF Meeting November
Model Evaluation and SIP Modeling
 Model Evaluation and SIP Modeling Joseph Cassmassi South Coast Air Quality Management District Satellite and Above-Boundary Layer Observations for Air Quality Management Workshop Boulder, CO May 9, 2011
March 26, Tom Moore WRAP Air Quality Program Manager WESTAR Council. Tribal Air Program Meeting - EPA Region 8
 March 26, 2014 Tom Moore WRAP Air Quality Program Manager WESTAR Council Tribal Air Program Meeting - EPA Region 8 1 Regional Organizations WESTAR = Western States Air Resources Council 15 state air agencies
12. Ozone pollution. Daniel J. Jacob, Atmospheric Chemistry, Harvard University, Spring 2017
 12. Ozone pollution Daniel J. Jacob, Atmospheric Chemistry, Harvard University, Spring 2017 The industrial revolution and air pollution Pittsburgh in the 1940s Make great efforts to build China into a
USE OF RPO MODELING TO MEET REGIONAL HAZE AND NAAQS REQUIREMENTS
 USE OF RPO MODELING TO MEET REGIONAL HAZE AND NAAQS REQUIREMENTS James W. Boylan Georgia Department of Natural Resources (Chair for Inter-RPO Modeling Workgroup) 2005 CMAS Models-3 Conference Chapel Hill,
Western U.S. Background Ozone and Transport Air Quality Planning Issues. HAQAST5 Phoenix, AZ
 Western U.S. Background Ozone and Transport Air Quality Planning Issues HAQAST5 Phoenix, AZ Mary Uhl Executive Director Western States Air Resources Council January 3, 2019 Air agencies include: 15 states,
Linking regional air pollution with global chemistry and climate: The role of background ozone. Arlene M. Fiore Adviser: Daniel J.
 Linking regional air pollution with global chemistry and climate: The role of background ozone Arlene M. Fiore Adviser: Daniel J. Jacob April 22, 2002 Tropospheric ozone links air pollution & climate change
Utility of Bottom-up and Top-down O&G Emission Inventory estimates for air quality management purposes
 Utility of Bottom-up and Top-down O&G Emission Inventory estimates for air quality management purposes Tom Moore WRAP/WESTAR Data Workshop Spring 2015 Measurements in Oil and Gas Production Regions NOAA
NATS 101 Section 13: Lecture 30. Air Pollution Part I
 NATS 101 Section 13: Lecture 30 Air Pollution Part I How Beijing looked before the 2008 Olympics. Economic growth but at what environmental cost?? China s current industrial development is actually very
USE OF RPO MODELING TO MEET REGIONAL HAZE AND NAAQS REQUIREMENTS
 USE OF RPO MODELING TO MEET REGIONAL HAZE AND NAAQS REQUIREMENTS James W. Boylan* Georgia Department of Natural Resources, Air Protection Branch, Atlanta, GA, USA 1. INTRODUCTION In order to help meet
Particulate Matter Science for Policy Makers: A. Ambient PM 2.5 EXECUTIVE SUMMARY MASS AND COMPOSITION RESPONSES TO CHANGING EMISSIONS
 Particulate Matter Science for Policy Makers: A NARSTO Assessment was commissioned by NARSTO, a cooperative public-private sector organization of Canada, Mexico and the United States. It is a concise and
WestJumpAQMS Progress Report 2008 Base Case and Preliminary Source Apportionment Modeling
 WestJumpAQMS Progress Report 2008 Base Case and Preliminary Source Apportionment Modeling ENVIRON International Corporation Alpine Geophysics, LLC UNC Institute for the Environment Template June 20, 2013
Attribution of Haze. What Are the Pieces and How Do They Fit? s e. a e
 Attribution of Haze What Are the Pieces and How Do They Fit? a n o R s a e E l b Pr r g o s s e One Possible Recipe Describe the area Identify glidepath Break down problem by pollutant Where is the pollutant
Chapter 5 FUTURE OZONE AIR QUALITY
 Chapter 5 FUTURE OZONE AIR QUALITY 5 FUTURE OZONE AIR QUALITY 5.1 INTRODUCTION AND SUMMARY Air quality models are used to predict ozone concentrations in future years. These models simulate the formation,
WRAP Activities Overview
 WRAP Activities Overview September 23, 2009 IMPROVE Steering Committee Meeting Wind Cave National Park Topics Haze Planning Background & Status WRAP work activity planning efforts New Charter Haze Planning
Final Updates to National Ambient Air Quality Standards (NAAQS) for Ozone. October 2015
 for Ozone. October 2015") Final Updates to National Ambient Air Quality Standards (NAAQS) for Ozone October 2015 What we ll cover 2015 Final 8-hour Ozone Standards Primary: 70 ppb Secondary: 70 ppb Areas will meet the standards
Final Updates to National Ambient Air Quality Standards (NAAQS) for Ozone October 2015 What we ll cover 2015 Final 8-hour Ozone Standards Primary: 70 ppb Secondary: 70 ppb Areas will meet the standards
Wildfires: Smoke Impacts and Public Health Protection
 Wildfires: Smoke Impacts and Public Health Protection Julie Hunter, Senior Air Quality Specialist Washoe County Health District, Air Quality Management Division Great Basin Climate Forum December 6, 2018
WESTAR-WRAP Regional Haze analysis and planning efforts
 WESTAR-WRAP Regional Haze analysis and planning efforts Tom Moore EGU Emissions Analysis project workshop November 6, 2018 Salt Lake City, UT Western air quality analysis and planning Regional Haze analysis
Air Managers Committee
 Air Managers Committee Mission: To Bring Air Managers perspective to WRAP processes To provide a place for managers to discuss and resolve air program management issues related to regional haze To provide
UINTA BASIN AIR QUALITY STUDY (UBAQS) Prepared for
 Prepared for") UINTA BASIN AIR QUALITY STUDY (UBAQS) Prepared for Ms. Kathleen Sgamma Independent Petroleum Association of Mountain States 410 17 th Street, Suite 700 Denver, Colorado 80202 June 30, 2009 EXECUTIVE SUMMARY
UINTA BASIN AIR QUALITY STUDY (UBAQS) Prepared for Ms. Kathleen Sgamma Independent Petroleum Association of Mountain States 410 17 th Street, Suite 700 Denver, Colorado 80202 June 30, 2009 EXECUTIVE SUMMARY
Deposition of Reduced Nitrogen (NH x ) in California and Other Western Regions: Prevalence and Ecological Importance
 in California and Other Western Regions: Prevalence and Ecological Importance") Deposition of Reduced Nitrogen (NH x ) in California and Other Western Regions: Prevalence and Ecological Importance M.E. Fenn 1, A. Bytnerowicz 1 and S.B. Weiss 2 1 USDA Forest Service, Forest Fire Laboratory,
Deposition of Reduced Nitrogen (NH x ) in California and Other Western Regions: Prevalence and Ecological Importance M.E. Fenn 1, A. Bytnerowicz 1 and S.B. Weiss 2 1 USDA Forest Service, Forest Fire Laboratory,
Emission and Air Quality Trends Review
 Emission and Air Quality Trends Review 1999-2011 New Mexico July 2013 1 Project Objective p To develop and present publicly available information on trends in emissions and ambient air quality in the U.S.
Nitrogen Deposition at Rocky Mountain National Park: the RoMANS Study
 Nitrogen Deposition at Rocky Mountain National Park: the RoMANS Study Mike Barna Bill Malm Bret Schichtel Kristi Gebhart Air Resources Division National Park Service National Park Service U.S. Department
Satellite Products, the AQAST process, and EPA/OAQPS Air Quality Management Needs
 Satellite Products, the AQAST process, and EPA/OAQPS Air Quality Management Needs Rich Scheffe, Kirk Baker, Carey Jang, Pat Dolwick, James Kelly, Norm Possiel, Venkatesh Rao, Heather Simon (ack: J. Szykman,
Southern New Mexico Ozone Modeling Study Summary of Results: Tasks 9 and 10
 Summary of Results: Tasks 9 and 10 Ramboll-Environ (RE) University of North Carolina (UNC-IE) June 3, 2016 SNMOS Background and Objectives The southern Doña Ana County region has the highest ozone levels
MEMORANDUM. SUIT O&G Well Site Emissions. September 5, 2017
 September 5, 2017 MEMORANDUM To: From: Subject: Dale Wells, Lisa Devore, Gordon Pierce; CDPHE Mark Jones, Kerwin Singleton, Rita Bates; NMED Daniel Powers, Tom Johnson, Mark Hutson; SUIT Tom Moore; WESTAR-WRAP
Use of Satellite Data to Support Regulatory Air Quality Decisions
 Use of Satellite Data to Support Regulatory Air Quality Decisions Richard Payton Scott Jackson EPA Region 8 Air Program Workshop on Satellite and Above-Boundary Layer Observations for Air Quality Management
Evaluation of Options for Addressing Secondary PM 2.5 and Ozone Formation. Bruce Macdonald, PhD Jason Reed, CCM
 Evaluation of Options for Addressing Secondary PM 2.5 and Ozone Formation Bruce Macdonald, PhD Jason Reed, CCM 1 Overview Timeline and reasoning Regulatory drivers in the U.S. Emerging approaches Qualitative
Proposed Repeal of Volatile Organic Compounds (VOC) Regulations for Pulaski County
 Regulations for Pulaski County") Proposed Repeal of Volatile Organic Compounds (VOC) Regulations for Pulaski County Overview History of the Pulaski County VOC Regulations Pulaski County Air Quality Monitoring Trends Air Quality Modeling
Proposed Repeal of Volatile Organic Compounds (VOC) Regulations for Pulaski County Overview History of the Pulaski County VOC Regulations Pulaski County Air Quality Monitoring Trends Air Quality Modeling
Chapter 17 Air and Air Pollution
 Chapter 17 Air and Air Pollution The Atmosphere Each layer characterized by abrupt changes in temperature, the result of differences in the absorption of incoming solar energy. Troposphere: Weather Breeder
Docket ID Number EPA-HQ-OAR /9/2015 Page I. March 9, 2015 CERTIFIED MAIL#
 Docket ID Number EPA-HQ-OAR-2008-0699 Page I March 9, 2015 CERTIFIED MAIL# 91 7108 2133 3939 6313 1045 EPA Docket Center (EPA/DC) ATTN: Docket ID Number EPA-HQ-OAR-2008-0699 U.S. Environmental Protection
Analysis of Data from West-wide Jump Start Air Quality Modeling Study (WestJumpAQMS) Excerpt from Alpine Geophysics Review dated September 8, 2015
 Excerpt from Alpine Geophysics Review dated September 8, 2015") Analysis of Data from West-wide Jump Start Air Quality Modeling Study (WestJumpAQMS) Excerpt from Alpine Geophysics Review dated September 8, 2015 Background Alpine Geophysics was part of a modeling team
Analysis of Data from West-wide Jump Start Air Quality Modeling Study (WestJumpAQMS) Excerpt from Alpine Geophysics Review dated September 8, 2015 Background Alpine Geophysics was part of a modeling team
Ozone forms from NOX+VOC+Sun. Source:
 1 2 Ozone forms from NOX+VOC+Sun Source: www.montgomerycountymd.gov/dep/resources/images/outreach/air/ozoneformation.jpg 3 4 Tons per day Progress: Reduced in O 3 precursors 600 500 519 400 300 200 351
The Role of Coal in the West
 The Role of Coal in the West Western Interstate Energy Board Benjamin Lim and Max Vilgalys 1 EIA Baseload Definitions Base load: The minimum amount of electric power delivered or required over a given
Co-Benefits of Renewable Energy and Energy Efficiency in Utah
 Co-Benefits of Renewable Energy and Energy Efficiency in Utah Air Quality, Health and Water Benefits A Report to the State of Utah March 15, 2010 Jeremy Fisher, PhD; Jon Levy, ScD; Yurika Nishioka, ScD;
Clean Air Act History
 Clean Air Act Compliance Clean Air Act Compliance Clean Air Act History 1940s serious smog in LA, CA and Donora, PA raised concerns about air quality. 1955, Air Pollution Control Act was the 1st national
Identification of Significant Sources and Categories Contributing to Regional Haze in Colorado
 Identification of Significant Sources and Categories Contributing to Regional Haze in Colorado November 16, 2017 Regional Haze Teach-In #5 Curt Taipale Planning and Policy Program RP Analysis of Significant
Overview of Four Corners Air Quality. WRAP Oil and Gas Work Group April 9, 2018 Mark Jones, NM Environment Department
 Overview of Four Corners Air Quality WRAP Oil and Gas Work Group April 9, 2018 Mark Jones, NM Environment Department Outline Four Corners Air Quality Group Task Force Current Activities Regional Studies
Ozone smog in surface air: Background contributions and climate connections. Arlene M. Fiore
 Haze over Boston, MA http://www.airnow.gov/index.cfm?action=particle_health.page1#3 Ozone smog in surface air: Background contributions and climate connections Arlene M. Fiore www.ldeo.columbia.edu/~amfiore
Climate Change and Air Quality in US National Parks: a new project sponsored by NPS
 Climate Change and Air Quality in US National Parks: a new project sponsored by NPS Colette L. Heald & Maria Val Martin Colorado State University NPS Report June 16, 2011 OBJECTIVE: Investigate impact
Assessing the Impacts of Emissions from Oil and Gas Extraction on Urban Ozone and Associated Health Risks
 Assessing the Impacts of Emissions from Oil and Gas Extraction on Urban Ozone and Associated Health Risks Shannon L. Capps 1, Rene Nsanzineza 1, Matthew D. Turner 1, Daven K. Henze 1, Shunliu Zhao 2, Matthew
Preparation of Fine Particulate Emissions Inventories. Lesson 1 Introduction to Fine Particles (PM 2.5 )
") Preparation of Fine Particulate Emissions Inventories Lesson 1 Introduction to Fine Particles (PM 2.5 ) What will We Discuss in Lesson 1? After this lesson, participants will be able to describe: the general
Preparation of Fine Particulate Emissions Inventories Lesson 1 Introduction to Fine Particles (PM 2.5 ) What will We Discuss in Lesson 1? After this lesson, participants will be able to describe: the general
State Implementation Plans for Federal 8-Hour Ozone and PM2.5 Standards San Joaquin Valley Eastern Kern County
 State Implementation Plans for Federal 8-Hour Ozone and PM2.5 Standards San Joaquin Valley Eastern Kern County Public Meeting January 4, 2005 Fresno, Bakersfield, Modesto 1 San Joaquin Valley Air Pollution
Modeling and Analysis of Oil & Gas Emissions Data University of North Carolina (UNC IE) ENVIRON International Corporation (ENVIRON)
 ENVIRON International Corporation (ENVIRON)") Western States Air Quality Study Intermountain West Data Warehouse Western States Air Quality Study Modeling and Analysis of Oil & Gas Emissions Data University of North Carolina (UNC IE) ENVIRON International
Western States Air Quality Study Intermountain West Data Warehouse Western States Air Quality Study Modeling and Analysis of Oil & Gas Emissions Data University of North Carolina (UNC IE) ENVIRON International
Lightning NOx Emissions and the Implications for Surface Air Quality over the Contiguous United States
 Lightning NOx Emissions by Daiwen Kang and Kenneth Pickering Lightning NOx Emissions and the Implications for Surface Air Quality over the Contiguous United States As one of the largest natural sources
Daily to decadal variability in sources of springtime ozone over the western U.S.: Stratospheric intrusions, Asian pollution, and wildfires
 WESTAR/Western Ozone Transport Conference, Oct 10-12, 2012 Daily to decadal variability in sources of springtime ozone over the western U.S.: Stratospheric intrusions, Asian pollution, and wildfires Meiyun
Emissions Data Review
 Emissions Data Review 2002 Attribution Inputs AoH Workgroup Meeting November 16-17, 2005 Today s talk EI data and model inputs SMOKE modeling results Display on 2002 attribution pages for AoH Phase II
2006 Area Source Emissions Inventory Methodology 670 NON-AGRICULTURAL OPEN BURNING
 San Joaquin Valley AIR POLLUTION CONTROL DISTRICT 2006 Area Source Emissions Inventory Methodology 670 NON-AGRICULTURAL OPEN BURNING I. Purpose This document describes the Area Source Methodology used
Identification of Ozone Sources in the Western US Dan Jaffe, University of Washington. Mt. Bachelor Oregon 2.8 km or 9000 above sea level
 Identification of Ozone Sources in the Western US Dan Jaffe, University of Washington Mt. Bachelor Oregon 2.8 km or 9000 above sea level Acknowledgements The Challenge: New O 3 Standard in Light of Increasing
Atmospheric Nitrogen Measurements with a focus on a possible NOx/SOx secondary standard. NADP Conference October 21, 2010 Rich Scheffe, U.S.
 Atmospheric Nitrogen Measurements with a focus on a possible NOx/SOx secondary standard NADP Conference October 21, 2010 Rich Scheffe, U.S. EPA OAQPS Acknowledge Adam Reff Jason Lynch Tara Greaver Nealson
EvaluaJon of U.S. NO x Emissions with Satellite- based ObservaJons and Model SimulaJons
 EvaluaJon of U.S. NO x Emissions with Satellite- based ObservaJons and Model SimulaJons Gregory Frost*, Si- Wan Kim*, Stuart McKeen*, Eirh Yu Hsie*, Claire Granier*, & Michael Trainer Chemical Sciences
Merging space, time, chemistry and environmental media: Monitoring challenges
 Merging space, time, chemistry and environmental media: Monitoring challenges WRAP Monitoring Workshop Chandler, Arizona May 15, 2008 Rich Scheffe, EPA-OAR Acknowledgments Everyone WRAP-RPO s National
Update on trends in background ozone concentrations
 Update on trends in background ozone concentrations Owen R. Cooper CIRES, University of Colorado, Boulder, USA NOAA Earth System Research Laboratory, Boulder, USA Modeling Air Quality from the Global to
Nested Global/Regional Modeling of Background Ozone Over the US
 Nested Global/Regional Modeling of Background Ozone Over the US Chris Emery ENVIRON International Corporation, Novato, CA WESTAR Western Ozone Transport Conference October 10-12, 2012 Template Introduction
Northwest-AIRQUEST & AIRPACT-3 Regional Modeling Studies
 Northwest-AIRQUEST & AIRPACT-3 Regional Modeling Studies Joseph Vaughan, Farren Thorpe, Ying Xie, Serena Chung, Brian Lamb and George Mount Laboratory for Atmospheric Research Washington State University,
Global dimensions to ground-level ozone: Transboundary transport and climate change
 Global dimensions to ground-level ozone: Transboundary transport and climate change Health Effects Institute 2018 Annual Conference Chicago, IL, April 29, 2018 c/o Jean Guo (Columbia University) Arlene
Applications of Source Contribution and Emissions Sensitivity Modeling to Assess Transport and Background Ozone Attribution
 Applications of Source Contribution and Emissions Sensitivity Modeling to Assess Transport and Background Ozone Attribution April 2014 Kirk Baker, Norm Possiel, Brian Timin, Pat Dolwick 1 Source Sensitivity
Air Emissions 101. What are Some Types of Emissions? Oil & Gas Emissions: In Context VOC
 Oil & Gas Emissions: In Context Air Emissions 101 What are Some Types of Emissions? CO2 - Carbon dioxide is a greenhouse gas and is formed as one of the major products of combustion. CH4 - Methane, also
Policies for Addressing PM2.5 Precursor Emissions. Rich Damberg EPA Office of Air Quality Planning and Standards June 20, 2007
 Policies for Addressing PM2.5 Precursor Emissions Rich Damberg EPA Office of Air Quality Planning and Standards June 20, 2007 1 Overview Sources of direct PM2.5 and SO2 must be evaluated for control measures
Southern New Mexico Ozone Modeling Study Project Summary
 Project Summary Ramboll-Environ (RE) University of North Carolina (UNC-IE) June 29, 2016 http://www.wrapair2.org/snmos.aspx SNMOS Background and Objectives The southern Doña Ana County region has the highest
State of the Air in Arkansas
 State of the Air in Arkansas 2017 2017 State of the Air Report Purpose Acknowledgments Present data about the state of air quality in Arkansas Provide overview of programs implemented by ADEQ Office of
Air Quality Issues in the Phoenix Metro Area
 Air Quality Issues in the Phoenix Metro Area Ira Domsky, Planning Consultant Maricopa County Air Quality Department HAQAST Annual Meeting, Madison WI July 17, 2018 Major Air Pollution Issues PM 10,
Southern New Mexico Ozone Modeling Study Summary of Results: Tasks 4-6
 Summary of Results: Tasks 4-6 Ramboll-Environ (RE) University of North Carolina (UNC-IE) February 22, 2016 SNMOS Background and Objectives The southern Doña Ana County region has the highest ozone levels
VISTAS Highlights. November 10, 2005
 VISTAS Highlights November 10, 2005 Demonstrating Reasonable Progress For each VISTAS Class I area: 1. Identify pollutants contributing to PM2.5 and visibility 2. Identify probable source areas using back
Southern New Mexico Ozone Modeling Study Task 11: Emission Sensitivity Modeling
 Task 11: Emission Sensitivity Modeling Ramboll-Environ (RE) University of North Carolina (UNC-IE) August 11, 2016 SNMOS Background and Objectives The southern Doña Ana County region has the highest ozone
AQAST Tiger Team. Gabriele Pfister
 AQAST Tiger Team Air Quality and Health Impacts from the Colorado Wildfires in June 2012 Gabriele Pfister David Edwards, Louisa Emmons, Arthur Mizzi, Christine Wiedinmyer National Center for Atmospheric
FLM ISSUES AROUND THE COUNTRY EPA, STATE, LOCAL AIR QUALITY MODELERS WORKSHOP 2016
 FLM ISSUES AROUND THE COUNTRY EPA, STATE, LOCAL AIR QUALITY MODELERS WORKSHOP 2016 Disclaimer The following presentation represents the current views and ideas of the federal land management agencies staff
Improving Visibility at Class I Areas Regional Haze SIP Requirements
 Improving Visibility at Class I Areas Regional Haze SIP Requirements Susan S.G. Wierman, MARAMA MARAMA Permits Managers Workshop Wilmington, DE February 7, 2006 Objectives of presentation What s regional
APPENDIX I RECORD OF NON APPLICABILITY
 APPENDIX I RECORD OF NON APPLICABILITY RECORD OF NON-APPLICABILITY FOR CLEAN AIR ACT CONFORMITY (RONA) AND AIR QUALITY DATA SIO/UCSD MARFAC BERTHING WHARF AND PIER REPLACEMENT UCSD Project Number: 963990/4425
Comparison of photochemical
 Comparison of photochemical modeling for California by U.S. EPA and the California ARB James T. Kelly and Kirk R. Baker Office of Air Quality Planning & Standards, U.S. Environmental Protection Agency
ROcky Mountain Atmospheric Nitrogen and Sulfur study (ROMANS)
") ROcky Mountain Atmospheric Nitrogen and Sulfur study (ROMANS) STATEMENT OF THE PROBLEM Rocky Mountain National Park (ROMO) is experiencing a number of deleterious effects due to atmospheric nitrogen and
ROcky Mountain Atmospheric Nitrogen and Sulfur study (ROMANS) STATEMENT OF THE PROBLEM Rocky Mountain National Park (ROMO) is experiencing a number of deleterious effects due to atmospheric nitrogen and
Visibility Trends.
 CHAPTER 6 Visibility Trends http://www.epa.gov/oar/aqtrnd97/chapter6.pdf INTRODUCTION The Clean Air Act (CAA) authorizes the United States Environmental Protection Agency (EPA) to protect visibility, or
The Importance of Forest Management
 The Importance of Forest Management Molly Pitts Rocky Mountain States Director Sacramento Mountains Wood Industry Summit 3/30/16 Background Owner of Pitts Resource Consulting, LLC Rocky Mountain States
Where There s Smoke There s Haze: Estimating the Contribution of Fire Types to PM2.5 and Haze
 Where There s Smoke There s Haze: Estimating the Contribution of Fire Types to PM2.5 and Haze Bret A. Schichtel (NPS), William C. Malm (NPS), Jeffrey L. Collett, Jr. (CSU), Amy P. Sullivan (CSU), Amanda
Madeleine Strum & Alison Eyth 2013 Western Air Quality Modeling Workshop Technical Methods and Applications Boulder, CO July 9, 2013
 Madeleine Strum & Alison Eyth 2013 Western Air Quality Modeling Workshop Technical Methods and Applications Boulder, CO July 9, 2013 2011 NEI Status 2011 Version 1 NEI process to date Categories of Interest
Appendix G. Precursor Demonstration
 Appendix G Precursor Demonstration San Joaquin Valley Air Pollution Control District 2018 PM2.5 SIP Page 1 of 23 Appendix: San Joaquin Valley PM2.5 SIP INTRODUCTION Fine particulate matter (PM2.5) is made
How much does Kansas rangeland burning contribute to ambient O 3 and PM 2.5?
 How much does Kansas rangeland burning contribute to ambient O 3 and PM 2.5? - Analysis of data from 21 to 216 Dr. Zifei Liu zifeiliu@ksu.edu Rangeland burning smoke management and air quality workshop
2016 Midwest and Central States Air Quality Workshop. Air Quality Modeling in the GOMR Study. June 2016
 2016 Midwest and Central States Air Quality Workshop Air Quality Modeling in the GOMR Study June 2016 Holli Ensz Physical Scientist Holli.Ensz@boem.gov BOEM vs. USEPA GOMR Jurisdiction Map Purposes: A.
WESTAR-WRAP Regional Haze Webinar Series #5 November 16, 2017
 WESTAR-WRAP Regional Haze Webinar Series #5 November 16, 2017 Proposed Guidance Focuses on Large Emitters Rank Top 80% of non-mobile Anthropogenic State Inventory List Potential Control Technologies for