Planning Peterborough to 2031: How the Growth Plan for the Greater Golden Horseshoe will affect the City of Peterborough
|
|
|
- Cordelia Imogene Griffith
- 6 years ago
- Views:
Transcription


1 Exhibit C Sheet 1 of 79 Planning Peterborough to 2031: How the Growth Plan for the Greater Golden Horseshoe will affect the City of Peterborough April 20, 2009 Planning Division 1
2 Exhibit C Sheet 2 of 79 EXECUTIVE SUMMARY The Growth Plan for the Greater Golden Horseshoe The Growth Plan for the Greater Golden Horseshoe (GGH) is a provincial plan that came into effect on June 16, 2006 and establishes a policy framework for managing growth in the GGH to the year With a vision to building stronger, more prosperous, and complete communities, the Growth Plan will guide municipal and provincial decisions on a wide range of issues that include transportation, infrastructure planning, land use planning, urban form, housing, natural heritage, and resource protection. The Growth Plan intends to achieve this overall vision through specific policy directions that aim to: Revitalize downtowns to become vibrant and convenient centres Create complete communities that offer more options for living, working, shopping, and playing Provide greater choice in housing types to meet the needs of people at all stages in life Curb urban sprawl and protect farmlands and greenspaces Reduce traffic gridlock by improving access to a greater range of transportation choices Population and Employment Forecasts for Peterborough The Growth Plan provides population and employment projections for all upper and single-tier municipalities in the GGH and requires municipalities to use these projections when planning for future growth. From 2006 to 2031, the City of Peterborough is forecast to grow by: An additional 13,000 people to reach a total population of 88,000 An additional 1,300 jobs to reach a total of 42,000 jobs The Growth Plan s Intensification and Density Targets The Growth Plan contains intensification and density targets that municipalities within the GGH must adopt into their Official Plans and plan to achieve. While these targets represent only a portion of the Growth Plan s requirements that municipalities are expected to adopt into their Official Plans, these targets are its central component intending to create a compact urban form that maximizes the use of our new and existing infrastructure. The Growth Plan specifically requires the City of Peterborough to: Plan to achieve an average density of 150 residents and jobs per hectare in the Downtown Peterborough Urban Growth Centre by 2031 o The existing density of Peterborough s Urban Growth Centre has been estimated to be about 100 residents and jobs per hectare. To achieve 150 residents and jobs per hectare by 2031, an additional 4,800 residents and jobs would be required. This is a 50% increase over the present situation and represents about 33% of the total population and employment growth forecast for the City to the year
3 Exhibit C Sheet 3 of 79 o While the City may not necessarily reach this target by 2031, the redevelopment and revitalization of Downtown Peterborough will nevertheless need to be a central part of the City s future growth strategy. The City s new Central Area Master Plan which was released in draft form to the public in December 2008 has the potential to play a significant role in stimulating growth in the Peterborough s UGC on a scale envisioned in the Growth Plan. o Approximately 13% of the UCG is located within the Jackson Creek Flood Plan and is subject to Special Policy Area in the Official Plan. The City should seek provincial clarification regarding the applicability of these policies in light of Provincial Policy Statement restrictions on development and site alteration in areas subject to flooding hazards. Direct at least 40% of all annual residential development to its Built Area by 2015 and for each year thereafter to 2031 o Peterborough s Built Area boundary includes the area of the City that had been developed as of June 16, 2006 as well as areas that were approved for development but not fully built-out. o It is forecast that approximately 8,800 new residential units will be required within the City to accommodate its existing and new population. This means that of these new units, about 3,500 or 40% will need to be constructed within the Built Area boundary. o The 40% intensification target will become more difficult to achieve over time as existing vacant lands that were included within the Built Area are developed and more emphasis on redeveloping existing under-utilized buildings in the City is required. o To ensure that the 40% intensification target is achieved, the Growth Plan requires Peterborough to develop an intensification strategy that specifically designates nodes, corridors, and areas as places to where growth within the City s Built Area will be accommodated. Deciding which areas of the City s Built Area to designate for these purposes will be determined through a public consultation process. Plan to achieve an average density of 50 residents and jobs per hectare within its Designated Greenfield Area o Peterborough s Designated Greenfield Area (DGA) is the area that is within the City limits but outside of the Built Area boundary. The size of Peterborough s DGA is 1443 hectares once any natural features identified in the City s Official Plan or any applicable provincial plan are removed. o The capacity of Peterborough s entire DGA based on the Growth Plan target of 50 residents and jobs/ha is 72,150 residents and jobs. However, because the City is only forecast to grow by about 14,300 people and jobs between 2006 and 2031, its DGA will not achieve full build out at this density for several decades beyond the Growth Plan planning horizon. However, to remain compliant with the Growth Plan target, the City will 3
4 Exhibit C Sheet 4 of 79 need to ensure that the new areas of the DGA that develop, are planned to do so at an average density of 50 residents and jobs per hectare. o It is forecast that all employment lands and residential areas within the DGA will accommodate an average of 7 jobs per hectare over the entire DGA at full build out. This means that the remainder of the DGA will need to build out an average of 43 people per hectare in order to achieve the target of 50 people and jobs per hectare. However, because large portions of residentially designated areas are typically used for public services such as roads, hydro corridors, parks, schools, and storm water management rather than for residential building lots, on a property-byproperty basis, the actual density of net residential development will be required to be substantially higher than previously noted. o It is forecast that approximately 5,300 residential units, accommodating approximately 12,100 people will be constructed in Peterborough s DGA to To accommodate these people at an average density of 43 people per hectare, about 250 hectares of residential land will be required. This means that only 250 hectares of the 1,230 hectares that are currently available for residential purposes in the City s DGA will be required by o The traditional residential density of Peterborough s greenfield areas has typically been about 29 people or 13 units per hectare. These low-density residential areas are predominantly made up of single-detached homes and are reflective of the strong market demand for lower density housing forms in the City of Peterborough. However, to achieve an average density of least 43 people per net hectare, fewer single detached homes and more multi-unit residential developments that include row housing and multi-storey buildings will need to be built. Peterborough is a Unique Community Within the GGH In many ways stemming from both its geographic location and demographic make-up, the City of Peterborough is a unique community within the Greater Golden Horseshoe. Because of this uniqueness, the City may find it more difficult to achieve the Growth Plan s intensification and density targets than most other urban municipalities in the GGH. Specifically, Peterborough is the most spatially isolated Urban Growth Centre in the GGH, located about 30 kilometres further away from its nearest UGC than any other pair of UGCs. Because of this isolation, Peterborough has generally developed as a self-sustaining community that relies less on economic synergies with neighbouring municipalities to achieve its growth than most other municipalities in the GGH. This self-sustaining nature and geographic isolation is reflected by very low commuting patterns between the City and areas outside of Peterborough County and the City of Kawartha Lakes and by a significantly significantly lower population and employment growth outlook than most other municipalities in the GGH. Additionally, because of its location, Peterborough functions as the principal employment centre for its surrounding area with more than twice as many people 4
5 Exhibit C Sheet 5 of 79 commuting into the City each day for work than leaving. The central place role of Peterborough appears to be further reinforced as more people are working in service industries such as health care and education and less in manufacturing industries when compared to other urban GGH municipalities. Therefore, with Peterborough being the regional service centre for the Kawarthas, it has much more in common with cities outside the GGH such as Belleville and North Bay than it does with cities like Kitchener and Barrie that are located inside the GGH. Demographically, Peterborough has a significantly older population than most other urban GGH communities. Conversely, Peterborough also has a proportionally smaller youth population and a significantly lower average household size than most other areas of the GGH. Therefore, to achieve the same density target for its Designated Greenfield Area of 50 people and jobs per hectare, Peterborough will need to construct more residential units proportionally than any other urban municipality in the GGH. This translates into the City being required to actually achieve a built form in its DGA that reflects a higher density of dwellings than most other areas in the GGH. From an employment and demographic perspective, Peterborough appears to have more in common with slower growing cities located outside the GGH such as Belleville, North Bay, Sudbury and Thunder Bay than it does with rapidly growing cities such as Barrie, Kitchener, and Vaughan that are located within the GGH. From a growth management and land use planning perspective, the dissimilarities between Peterborough and the rest of the GGH could mean that major planning issues affecting the rapidly growing urbanized portions of the GGH are less relevant in the Peterborough context. Consequently, implementing Growth Plan policies that are really tailored to addressing issues relevant to places such as Barrie, Kitchener or Guelph may affect Peterborough s ability to maintain itself as a complete community as it exists today. Therefore, should the opportunity arise, it may be worthwhile to explore Peterborough s place in the provincial Growth Plan framework. At the earliest, this could be done at such a time when a Growth Plan is prepared for eastern Ontario. Overall To conform to the policy directions of the Growth Plan, the City will be required to optimize the land within its existing built areas by strategically intensifying growth through both infill and redevelopment. This marks a significant shift in Peterborough s traditional growth patterns where the majority of its new residential development has been single-detached dwellings built at the edge of the City. If Peterborough is to achieve the Growth Plan s intensification and density targets, more multi-unit residential developments that include row housing and multi-storey buildings will need to be constructed. The City is therefore faced with the challenge of shifting its predominantly low-density residential development patterns into a more compact, transit-supportive urban form. Also, since the Downtown Peterborough UGC needs to absorb a significant amount of the City s future growth, additional focus needs to be placed on revitalizing and redeveloping the central downtown core. The City has already taken significant steps in this direction however, since the implementation of the new Central Area 5
6 Exhibit C Sheet 6 of 79 Master Plan will play a key role in developing policies and programs to focus development in the UGC. While achievement of the Growth Plan s density and intensification targets will not be easy, it is important to remember that the Growth Plan is intended to change the way that land use planning has been traditionally done in the GGH. With aims of limiting urban sprawl so that we can make better use of our existing natural resources and infrastructure investments, the Growth Plan does not anticipate, promote, or facilitate more of the same. The effective implementation of the Growth Plan however, will entirely depend on the extent to which it is embraced by the various stakeholders involved in community development that include developers, politicians, and the general public. 6
7 Exhibit C Sheet 7 of 79 Table of Contents 1.0 INTRODUCTION Purpose What is the Growth Plan for the Greater Golden Horseshoe? Population and Employment Projections for the City of Peterborough Growth Plan projections compared to Peterborough s recent population growth Growth Plan vs. Ministry of Finance population projections for Peterborough Growth Plan projections compared to Peterborough s recent employment growth THE CITY OF PETERBOROUGH CONTEXT Location Population Growth Seniors population Student population Immigration Housing Tenure Suburban housing development Employment Trends Labour force Location of work and commuting patterns Peterborough s employment forecasts compared with the rest of the GGH Potential Drivers of Future Population and Employment Growth Highway 407 extension Pickering International Airport Peterborough Municipal Airport Peterborough Toronto Commuter Railway Greater Peterborough Innovation Cluster Peterborough is a Unique Community Within the GGH THE GROWTH PLAN S INTENSIFICATION AND DENSITY TARGETS Urban Growth Centre (UGC) What is the UGC s existing density? Achieving the 150 r+j/ha target if currently at 100 r+j/ha Built Area What does the 40% intensification target mean for Peterborough? Developing an intensification strategy Designated Greenfield Area (DGA) Lower employment densities require an increase in residential density to achieve the target of 50 residents and jobs per hectare Residential land requirements in the DGA to What is the traditional residential density of Peterborough s greenfields? What housing mix will be required to achieve the Provincial density target in the DGA? OTHER KEY REQUIREMENTS OF THE GROWTH PLAN Where and How to Grow Secondary Suites Settlement Areas and Boundary Expansions Intensification Areas Designated Greenfield Areas
8 Exhibit C Sheet 8 of Employment Lands Infrastructure to Support Growth Transportation Water and Wastewater Systems Community Infrastructure Affordable Housing Protecting What is Valuable Implementation and Interpretation CONCLUSION The overall implications of the Growth Plan on the City of Peterborough APPENDIX: RESEARCH METHODS, SOURCES, AND ASSUMPTIONS Research Methods and Data Sources Land Area Analysis Calculations Residential Density Analysis Employment Density Analysis Major Assumptions
9 Exhibit C Sheet 9 of 79 List of figures and tables Figures Section 1.2: What is the Growth Plan for the Greater Golden Horseshoe? Figure 1: The Inner and Outer Rings of the GGH...13 Figure 2: Urban Growth Centres in the GGH...14 Section 1.3.1: Growth Plan projections compared to Peterborough s recent population growth Figure 3: Population of the City of Peterborough from 1991 to 2006 and projected to Figure 4: The City of Peterborough s population % growth rate trend over five year intervals from 1991 to 2006 and projected to Section 2.1: Location Figure 5: Peterborough s location relative to other major urban centres and its proximity to the Kawarthas tourist region...19 Section 2.3.1: Suburban housing development Figure 6: The three census tracts with the most residential construction in Peterborough from 1986 to Section 2.5.1: Highway 407 extension Figure 7: Impacts of Highway s 407 and 403 on industrial development in Brantford, Vaughan, Brampton, and Markham...37 Section 3.0: The Growth Plan s Intensification and Density Targets Figure 8: The Growth Plan applied to the City of Peterborough...46 Tables Section 2.2: Population Growth Table 1: The City of Peterborough s population, growth rate, and relative isolation compared to other single-tier municipalities in the Outer Ring that have a designated Urban Growth Centre...20 Table 2: The City of Peterborough s population growth rate compared to the regional municipalities of the GTA...20 Table 3: Growth Plan population forecasts, 2001 to Table 4: Population forecasts for the Inner and Outer Rings of the GGH...21 Table 5: Population forecasts for the Outer Ring municipalities...22 Section 2.2.1: Seniors population Table 6: Percentage of the population aged 65 and over, Table 7: The City of Peterborough s demographics, average household size, and units per hectare required to achieve 50 people per hectare compared to the Outer Ring and the GTA...23 Section 2.2.3: Immigration Table 8: Immigration status of all residents in the City of Peterborough, the Province of Ontario and the GGH and its Inner and Outer Rings, Table 9: Proportion of immigrant population by period of settlement in the City of Peterborough, the Province of Ontario, and to the GGH and its Inner and Outer Rings...24 Section 2.3: Housing Tenure Table 10: City of Peterborough s housing tenure compared to the Outer Ring and the GTA,
10 Exhibit C Sheet 10 of 79 Section 2.3.1: Suburban housing development Table 11: Census Tracts with the most residential construction in Peterborough from 1986 to Table 12: The City of Peterborough s housing mix compared with the Outer Ring and the GTA...27 Section 2.4: Employment Trends Table 13: The City of Peterborough s employment activity by industry, as a percentage of all jobs, from 2001 to 2006, compared with the Province of Ontario...27 Table 14: The City of Peterborough s employment activity by primary, secondary, or tertiary industry, as a percentage of all jobs, 1996 to 2006, compared with the Province of Ontario...28 Table 15: The City of Peterborough s employment breakdown by industry compared with the Province of Ontario and the GGH and its Inner and Outer Rings, Table 16: Top 30 employers in the City of Peterborough...29 Section 2.4.1: Labour force Table 17: Size of Peterborough s potential labour force, as a percentage of its population, compared with the Province of Ontario and the GGH and its Inner and Outer Rings, Table 18: The City of Peterborough s participation rate, employment rate, and unemployment rate compared with the Province of Ontario and the GGH and its Inner and Outer Ring s, Table 19: The City of Peterborough s employment activity from 1996 to 2006, compared with the Province of Ontario...30 Table 20: The City of Peterborough s percentage of population under 14 years of age, compared with the Province of Ontario and GGH and its Inner and Outer Ring, Table 21: The City of Peterborough s level of education compared with the Province of Ontario and the GGH and its Inner and Outer Rings, Table 22: The City of Peterborough s median income compared with the Province of Ontario and the GGH its Inner and Outer Rings, Table 23: Average Resale Value of Homes in Select GGH Communities, Section 2.4.2: Location of work and commuting patterns Table 24: City of Peterborough residents place of work compared with the Province of Ontario and the GGH and its Inner and Outer Rings, Table 25: City of Peterborough resident s commuting patterns compared with the Province of Ontario and the GGH and its Inner and Outer Rings, Table 26: Commuters entering and leaving the City of Peterborough, Table 27: The proportion of those working in the City of Peterborough as residents of the City, Peterborough County, or from outside of the County, Section 2.4.3: Employment forecasts for the GGH Table 28: Employment forecasts for the GGH, 2001 to Section 2.5.1: Highway 407 extension Table 29: People commuting into the City of Peterborough, Table 30: People commuting into the City of Peterborough, Section 2.6: Peterborough is a Unique Community Within the GGH Table 31: % Population Change for Ontario Census Metropolitan Areas (CMAs) and Census...42 Agglomerations (CAs), Table 32: Median Age of Ontario CMAs and CAs, Table 33: % of Population Aged 65 and over, Ontario CMAs and CAs, Table 34: Immigrants as % of Total Population, Ontario CMAs and CAs, Table 35: % of All Immigrants Residing in Ontario CMAs and CAs that immigrated between 2001 and
11 Exhibit C Sheet 11 of 79 Table 36: % of Population aged 15 and over that participates in the labour force, Ontario CMAs and CAs, Table 37: % of Population aged 15 and over that is employed, Ontario CMAs and CAs, Table 38: Unemployment rate, Ontario CMAs and CAs, Table 39: Median income for full-time workers, Ontario CMAs and CAs, Table 40: Median Commuting Distance for Workers in Ontario CMAs and CAs, Section 3.1: Urban Growth Centre Table 41: Density of the Downtown Peterborough UGC, according to the MPIR, based on the 2001 Census Section 3.3.3: What is the traditional residential density of Peterborough s greenfields? Table 42: Residential densities of Peterborough s recent subdivisions (2000 to 2008)...53 Section Community Infrastructure Table 43: Affordable housing projects constructed in Peterborough under the Canada-Ontario Affordable Housing Program...63 Table 44:Affordable Housing Production as a Proportion of All Housing Construction, Section 6.0: Appendix Table A1: City of Peterborough Employment Density Analysis...70 Table A2: Projected Population and Housing: 2001 to Table A3: Residential Development in the DGA: 2006 to Table A4: City of Peterborough Housing, Population, and Density Calculation Model
12 Exhibit C Sheet 12 of INTRODUCTION 1.1 Purpose This background report will describe the Growth Plan for the Greater Golden Horseshoe (GGH) and its key structural elements and requirements while outlining what the Growth Plan will mean for the City of Peterborough from a planning perspective. This report will also describe characteristics that distinguish Peterborough from the broader GGH region and discuss how these distinguishing features may pose a challenge to the City as it plans to implement the Growth Plan. The report also includes an Appendix to provide further detail on the research methods, data sources, and major assumptions used to generate its major findings. 1.2 What is the Growth Plan for the Greater Golden Horseshoe? The Growth Plan for the Greater Golden Horseshoe is a provincial plan that came into effect on June 16, 2006, establishing a policy framework for managing growth in the GGH to Prepared by the Province under the authority of the Places to Grow Act (2005), the Plan applies to the Greater Golden Horseshoe area that stretches around the western edge of Lake Ontario from Northumberland County on its northern shore to the Region of Niagara on its southern shore, and as far north as Georgian Bay. As one of the fastest growing urban regions in North America, the GGH is forecast to grow by almost 4 million people and 2 million jobs by In accordance with Subsection 3(5) of the Ontario Planning Act, all municipal planning decisions must conform to the Growth Plan. Accordingly, the Growth Plan will guide municipal and provincial decisions on a wide range of issues including transportation, infrastructure planning, land use planning, urban form, housing, natural heritage, and resource protection, with a vision to building stronger, more prosperous, and complete communities. Overall, the Plan seeks to grow in a more complete and efficient way so that communities can provide residents with the opportunity to live, work, shop, and play without the need to rely on private automobiles. Therefore, one of the main intentions of the Growth Plan is to reduce the adverse effects associated with the rapid urban development that has characterized much of the GGH region since the 1950s. These effects include traffic gridlock, deteriorating air quality, urban sprawl and the continued disappearance of our agricultural lands and natural resources. Within the GGH, the Growth Plan delineates an Inner Ring of municipalities centred on Toronto that will accommodate the majority of the region s anticipated growth to Also, the Plan delineates an Outer Ring of municipalities that will provide some relief to the Inner Ring from its anticipated growth pressure by accommodating a significant share of the region s growth in economically and socially complete communities. Separated by the provincially designated Greenbelt, the Inner Ring is a predominantly urban region while the Outer Ring is predominantly rural with interspersed small and mid-sized urban communities. As seen in Figure 1, the City of Peterborough is located within this Outer Ring. 12
.")
13 Exhibit C Sheet 13 of 79 Figure 1: The Inner and Outer Rings of the GGH (Source: Growth Plan Schedule 1) In order to influence where growth will occur in the GGH to 2031 and reduce infrastructure spending, the Growth Plan specifies that all development must be directed to settlement areas such as cities, towns and villages (except for uses that need to be located in rural areas). Additionally, in order to change the shape of existing GGH communities, the Plan establishes minimum annual requirements for directing development to the existing built-up area of settlements as well as minimum density targets for development on those lands that are within settlements but are located outside the built-up area (known as the Designated Greenfield Area, or DGA). Of all the settlements in the GGH, the Growth Plan designates 25 in particular as Urban Growth Centres (UGC) (see Figure 2). These UGCs are to be planned to accommodate a significant share of the region s anticipated population and employment growth; to serve as focal areas for investment in institutional and region-wide public services as well as commercial, recreational, cultural and entertainment uses; to accommodate and support major transit infrastructure; and to serve as high density major employment centers that will attract provincially, nationally or internationally significant employment uses. Along with establishing UGCs, the plan also establishes a graduated development density target for each UGC based on their capacity for 13
 As seen in Figure 2, there are there are eight designated UGCs in the Outer Ring, one of which is")
14 Exhibit C Sheet 14 of 79 attracting and accommodating development investment and their relative significance within the GGH as a focal point for economic activity. Downtown Peterborough Figure 2: Urban Growth Centres in the GGH (Source: Growth Plan Schedule 4) As seen in Figure 2, there are there are eight designated UGCs in the Outer Ring, one of which is Downtown Peterborough. Of the Outer Ring UGCs, Downtown Peterborough is the most easterly and also the most northerly, with the exception of Downtown Barrie. A key guiding principle of the Growth Plan is to optimize the use of existing and new infrastructure such as roads, highways, transit routes, rail lines, bridges, sewers, and water/wastewater treatment facilities so that they would support growth in a compact, efficient form. The Province believes that a more compact urban form will lead to significant infrastructure cost savings both in terms of the maintenance of our existing facilities and through the reduced need for additional investments because of us maximizing the use of our existing and new infrastructure. Therefore, the Ontario Ministry of Energy and Infrastructure will be prioritizing provincial infrastructure in 14
15 Exhibit C Sheet 15 of 79 accordance with Policy of the Growth Plan which states: Priority will be given to infrastructure investments made by the Province of Ontario that support the policies and schedules of this Plan. Accordingly, municipalities with Official Plans that conform to the Growth Plan may be significantly rewarded with new or renewed infrastructure investments. Based on this, it is strategically important for Peterborough to prepare an OPA that closely aligns the City s future land use planning direction with this new provincial planning legislation. As a part of the Growth Plan s implementation, all upper- and single-tier municipalities within the GGH must ensure their Official Plans comply with the policy directions of the Growth Plan by June 16, In response, the City of Peterborough is developing an Official Plan Amendment (OPA) to reflect these new provincial policy directions. This OPA will provide a locally based strategy and policies to help guide the growth of the City to the year Population and Employment Projections for the City of Peterborough Schedule 3 of the Growth Plan provides population and employment projections for all upper and single-tier municipalities in the Greater Golden Horseshoe. In accordance with Provincial legislation, all affected municipalities must adopt these projections into their Official Plans. For the City of Peterborough, the population and employment projections are as follows: Population , , ,000* ,000* Employment , , ,000* ,000 (*Figures for 2021 and 2031 were negotiated between the City of Peterborough and Peterborough County and approved by the Province) The 2006 Census identified Peterborough s population to be about 75,000. This means that the City is forecast to grow by approximately 13,000 people from 2006 to Annually, this projected growth translates into an average increase of 600 residents per year between 2006 and 2021 and then declining to 400 residents per year between 2022 and Similarly, based on commuting flow and employment data tabulated by the Census, Peterborough s total employment was approximately 40,700 jobs (fixed-location) in Therefore, based on the Growth Plan projection, the City should accommodate an additional 1,300 jobs by Annually, this represents only 0.13% growth in employment throughout the Growth Plan horizon. When combined, the City of Peterborough is forecast to grow by about 14,300 people and jobs from 2006 to
16 Exhibit C Sheet 16 of Growth Plan projections compared to Peterborough s recent population growth Between 1991 and 2006, the City of Peterborough grew at an average rate of 0.61% annually. Based on the Growth Plan forecasts for Peterborough to the year 2031, the City will grow at an average annual rate of 0.66% over the 25-year period from This suggests that Peterborough will grow slightly faster between 2006 and 2031 than it did in the preceding 15 years. This steady rate of population growth is indicated in Figure 3. Population 100,000 90,000 80,000 70,000 60,000 50,000 40,000 30,000 20,000 10, Year Figure 3: Population of the City of Peterborough from 1991 to 2006 and projected to 2031 (Source: 1991 to 2006 Censuses) However, Peterborough s rate of population growth is forecast to slow down over the course of the period from 2011 to This trend is captured in Figure 4 where it is indicated that the City s annual population growth rate will peak at 1.06% between 2006 and 2011 and then decline gradually to 0.48% between 2026 and % increase to to to to to to to to 2031 Year Period Figure 4: Peterborough s population % growth rate trend over five year intervals from 1991 to 2006 and projected to 2031 (Source: 1991 to 2006 Censuses) 16
17 Exhibit C Sheet 17 of 79 Overall, the Growth Plan population forecasts for the City of Peterborough are generally consistent with observed growth trends since Growth Plan vs. Ministry of Finance population projections for Peterborough The Ontario Ministry of Finance projects significantly greater population growth for Peterborough than the Growth Plan does. Whereas the Growth Plan currently forecasts that Peterborough City and County will have a combined 149,000 people by 2031, the Ministry of Finance forecasts that Peterborough City and County will have 159,600 people, a difference of about 10,000. If the existing 60:40 population split between the City and County is assumed to the year 2031, the City of Peterborough will have a population of about 96,000 people. This is 8,000 more than what is currently anticipated for the City based on the existing Growth Plan forecasts. However, since the Ministry of Finance projections have no legal status when it comes to planning legislation, it is the numbers contained in Schedule 3 of the Growth Plan that municipalities in the GGH must incorporate into their Official Plans and use when planning for future growth. Yet, because the Ministry of Finance projections are significantly greater than the Growth Plan forecasts, it is reasonable to question whether the Ministry of Energy and Infrastructure is allocating an adequate amount of growth to both Peterborough City and County. Section 2.5 of this report, which discusses potential drivers of future population and employment in the Peterborough region, provides further reasons to question the Growth Plan s growth allocations for Peterborough Growth Plan projections compared to Peterborough s recent employment growth In 2001, Census figures indicated that there were approximately 36,100 fixed-location jobs within the City. By 2006, this number grew to 40,700. Over the five-year period, this increase represented a 13% growth in the number of jobs, or an average annual growth rate of 2.6%. Moving forward from 2006, if this rate of employment growth were maintained throughout the planning horizon of the Growth Plan, the City of Peterborough would expect to have a total of 67,150 jobs located within its boundaries by This estimate is significantly higher than the Growth Plan forecast of 42,000 jobs by 2031 and is more a reflection of an unusually high rate of employment grwoth experienced between 2001 to In 2004, Hemson Consulting Ltd. prepared a growth forecast for the City of Peterborough as part of the City s Development Charges Background Study based on 2001 Census data. In that study, it was assumed that total employment within the City would be equal to the City s Total Population multiplied by its Employment Rate (the % of Population aged 15 and over that is employed). In 2001 that rate was 55%. If this assumption were applied to the Growth Plan s 2031 forecast population of 88,000, the City would expect to have a total of 48,400 jobs. While this estimate is more in-line with the Growth Plan forecast, it is evident that the Growth Plan has lower expectations for employment growth within the City than previous research would indicate. 17
18 Exhibit C Sheet 18 of 79 As will be discussed in Section 3.3.1, existing zoned employment lands in the DGA can accommodate approximately 7230 jobs. Assuming that all employment growth occurred exclusively in the City s DGA between 2006 and 2031, the City could accommodate approximately 48,000 jobs on existing zoned employment lands without directing job growth to existing built up areas. 18

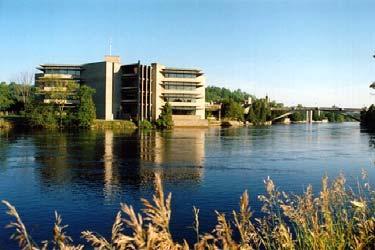
19 Exhibit C Sheet 19 of THE CITY OF PETERBOROUGH CONTEXT The GGH is characterized by a diverse mix of communities that face growth pressures to considerably varying extents. Within this region, the City of Peterborough is forecast to grow at a considerably slower pace than most other areas. This is important to note since many of the policy directions and targets contained in the Growth Plan appear to be intended for, and suited to, managing the development of high growth areas. This section will describe Peterborough, as it exists today, highlighting features that distinguish Peterborough from other areas of the GGH and discussing how these unique characteristics may challenge the City as it attempts to achieve the Growth Plan s policy direction. 2.1 Location Peterborough is located on the Trent Severn Waterway in central-eastern Ontario, about 130 km northeast of the City of Toronto. Peterborough is known as the gateway to the cottage country of the Kawarthas, one of the most popular recreational regions in the province (see Figure 5). Though the City currently has a population of about 75,000 people, it has maintained a traditional small town feel. This is largely because of Peterborough s spatial separation from major provincial transportation corridors and the major urban centres that have consequently developed along them. The City of Oshawa is the closest urban growth centre to Peterborough, about 80 kilometres away (see Figure 2). Figure 5: Peterborough slocation relative to other major urban centres and its proximity to the Kawarthas tourist region (Source: Google Maps, 2009) 19
20 Exhibit C Sheet 20 of Population Growth Compared to the GTA and the other Outer Ring municipalities that have a designated urban growth centre, the City of Peterborough is experiencing considerably less pressure for growth. This relative lack of growth can be attributed largely to Peterborough s spatial separation from other major urban centres which makes commuting between Peterborough and other major centres less desirable. Table 1 compares the population growth rates of Peterborough to other Outer Ring municipalities that also have a UGC. It also highlights Peterborough s relative isolation to the other growth centres amidst the broader GGH region. Table 2 contrasts the population growth rate of Peterborough with the regional municipalities of the GTA. Table 1: The City of Peterborough s population, growth rate, and relative isolation compared to other single-tier municipalities in the Outer Ring that have a designated Urban Growth Centre City of GGH Outer City of City of City of City of City of Variable Peterborough Ring Avg* City of Barrie Brantford Guelph Waterloo Cambridge Kitchener 2001 to 2006 population increase (%) Population 74, , ,430 90, ,943 97, , ,668 Distance to nearest UGC (km) Kitchener/ Nearest UGC Oshawa Newmarket Cambridge Cambridge Kitchener Kitchener Waterloo *excludes City of Peterborough Source: 2006 Census, distances between UGCs measured using Google Maps Table 2: The City of Peterborough s population growth rate compared to the regional municipalities of the GTA City of Region of Region of Region of Region of Variable Peterborough GTA Average* Halton Peel York Durham 2001 to 2006 population increase (%) Population 74, , ,256 1,159, , ,258 *excludes City of Toronto Source: 2006 Census Table 3 presents the population forecasts of the Growth Plan for each upper and singletier municipality in the GGH and indicates that with a projected population increase of only 14.6% from 2001 to 2031, the City and County of Peterborough is forecast to be the slowest growing area in the entire GGH accounting for only 0.5% of the population growth anticipated for the GGH. In contrast, the Region s of Halton and York are forecast to be the fastest growing municipalities in the GGH with both of their populations nearly doubling by Combined they are expected to absorb about 30% of the GGH s population growth to
21 Exhibit C Sheet 21 of 79 Table 3: Growth Plan population forecasts, 2001 to 2031 Population Population % of total 2031 Forecast increase increase GGH pop'n Municipality 2001 Population Population (people) (%) growth Halton Region 390, , , % 10.5% York Region 760,000 1,500, , % 19.9% Durham Region 530, , , % 11.6% Simcoe County/City of Barrie/City of Orillia 392, , , % 7.4% City of Guelph/Wellington County 195, , , % 3.4% Waterloo Region 456, , , % 7.4% Peel Region 1,030,000 1,640, , % 16.4% Dufferin County 53,000 80,000 27, % 0.7% City of Kawartha Lakes 72, ,000 28, % 0.8% City of Brantford/Brant County 129, ,000 44, % 1.2% City of Hamilton 510, , , % 4.0% Haldimand County 46,000 56,000 10, % 0.3% Northumberland County 80,000 96,000 16, % 0.4% Niagara Region 427, ,000 84, % 2.3% City of Toronto 2,590,000 3,080, , % 13.2% City of Peterborough/Peterborough County 130, ,000 19, % 0.5% Total 7,790,000 11,502,000 3,712, % Source: Growth Plan Schedule 3 Table 4 indicates that of the approximately 3.7 million people coming to the GGH by 2031, about 76% or 2.8 million people will locate within the Inner Ring of the GGH. The remaining 24% or 902,000 people are forecast to locate to the Outer Ring of the GGH. Table 4: Population forecasts for the Inner and Outer Rings of the GGH Population Population % of total 2031 Forecast increase increase GGH pop'n 2001 Population Population (people) (%) growth Inner Ring 5,810,000 8,620,000 2,810, % 76% Outer Ring 1,980,000 2,882, , % 24% Total 7,790,000 11,502,000 3,712, % Source: Growth Plan Schedule 3 Of the approximately 902,000 people projected to locate to the Outer Ring, Table 5 indicates that much of this growth will be concentrated in the western and northern areas that include cities such as Waterloo, Guelph, and Barrie. Specifically, nearly 75% of all the population growth forecast for the Outer Ring will occur in the jurisdictions of Simcoe County/City of Barrie/City of Orillia, City of Guelph/Wellington County, and Waterloo Region. In contrast, the additional 19,000 people forecast for Peterborough City and County account for only 2% of the overall population growth projected for the Outer Ring of the GGH. The only Outer Ring municipalities with a lower projected absolute growth are the Counties of Haldimand and Northumberland. Table 5 highlights the comparatively slow growth that the Province envisions for Peterborough. 21
22 Exhibit C Sheet 22 of 79 Table 5: Population forecasts for Outer Ring municipalities Source: Growth Plan Schedule 3 Population increase (people) Population increase (%) % of total OR pop'n growth 2031 Forecast Outer Ring Municipality 2001 Population Population Simcoe County/City of Barrie/City of Orillia 392, , , % 30.5% Waterloo Region 456, , , % 30.3% City of Guelph/Wellington County 195, , , % 14.0% Niagara Region 427, ,000 84, % 9.3% City of Brantford/Brant County 129, ,000 44, % 4.9% City of Kawartha Lakes 72, ,000 28, % 3.1% Dufferin County 53,000 80,000 27, % 3.0% City of Peterborough/Peterborough County 130, ,000 19, % 2.1% Northumberland County 80,000 96,000 16, % 1.8% Haldimand County 46,000 56,000 10, % 1.1% Total 1,980,000 2,882, , % Seniors population As noted previously in Section 1.2 and to be described in more detail in Section 3, the Growth Plan establishes minimum density targets for new development which municipalities must plan to achieve through their Official Plans. However, rather than being measured by residential units per hectare as is currently done in Peterborough s Official Plan, the Growth Plan measures density in terms of residents and jobs per hectare. Measuring density in this way will cause some municipalities difficulty in tracking and achieving the density targets because Census data must be used to establish residential density. A limitation of using Census information to track residential density is that demographic variations between municipalities can translate into varied housing needs among municipalities to achieve the same density target. As will be shown below, this variation could create a greater burden on some municipalities to provide even higher residential densities compared to other municipalities in order to meet the density target. Another limitation, as will be seen in Section 2.2.2, is that certain segments of the population are not counted as usual residents of private occupied dwellings or even as residents of the City at all thus lowering the reported overall average household size in the City and the overall residential density of the City. For Peterborough, these limitations become particularly important when considering seniors and post-secondary students. Seniors comprise a significant proportion of Peterborough s population. Based on the 2006 Census, the Peterborough Census Metropolitan Area (CMA includes City of Peterbrough, and the Townships of Cavan-Monaghan, Douro-Dummer, Otonabee- South Monaghan and Smith-Ennismore-Lakefield) is Ontario s oldest with a median age of This also makes it the fifth oldest CMA in Canada. The CMA also has the highest proportion of seniors in the country at 18.2%. Table 6 indicates that the percentage of the city s population that is aged 65 and over is significantly greater than averages for Ontario and the GGH. Additionally, Table 7 indicates that within the GGH, the City of Peterborough has the highest median age of all single-tier municipalities in the Outer Ring with a designated urban growth centre and all regional municipalities in the GTA. 22
23 Exhibit C Sheet 23 of 79 With a significantly higher proportion of senior citizens, it is not surprising that Table 7 also indicates that Peterborough is characterized by considerably smaller average household sizes than much of the GGH. However, because of the way density is measured in the Growth Plan, with smaller average household sizes, Peterborough will be required to plan for the construction of more residential units per hectare than most other municipalities in the GGH in order to achieve the same Growth Plan density target. Table 6: Percentage of the population aged 65 and over, 2006 Peterborough (City) 19.4% Ontario 13.6% GGH 12.8% Inner Ring 12.2% Outer Ring 14.7% Source: 2006 Census Table 7: The City of Peterborough s demographics, average household size, and units per hectare required to achieve 50 people per hectare compared to the Outer Ring and the GTA Variable City of Peterborough GGH Outer Ring Avg* GTA Avg** Median age of the population % of the population aged 15 and over Average household size (PPU) Total units/ha required to achieve 50 PPU *includes City's of Barrie, Brantford, Guelph, Waterloo, Cambridge, and Kitchener **includes Region's of Halton, York, Peel, and Durham Source: 2006 Census Student population Peterborough is home to Trent University and Sir Sandford Fleming College. Consequently, Peterborough has a large number of post-secondary students living within the City relative to the City s overall population. Presently, about 5,550 students move to Peterborough to attend Trent University during the school year. Of this figure, about 1,050 students live in on-campus residences while approximately 4,500 students live within the community. At Sir Sandford Fleming College, approximately 2200 students relocate to Peterborough during the school year. Overall, between the two institutions, approximately 7,750 students move into the City during the school year. This is approximately 10% of the City s 2006 Census population. Despite housing a large student population, those students who move to Peterborough for the school year are not counted in the census as Peterborough residents because their permanent residence is considered to be in the community from which they have moved. Therefore, because the Growth Plan intends to monitor progress towards achieving the intensification and density targets based on Census data, any residential projects that are built for student purposes, or residential units that are rented by students who are from outside of Peterborough, will not be counted as progress towards these targets. This presents an additional challenge that the City faces in attempting to achieve the Growth Plan s intensification and density targets. 23
24 Exhibit C Sheet 24 of Immigration Compared to other areas in the GGH, the City of Peterborough receives little international immigration. As of 2006, only 10% of the City s residents were born outside of Canada whereas almost 36% of the GGH population were of international origin (See Table 8). Of all municipalities in the GGH, only the City of Kawartha Lakes, Haldimand County and Peterborough County have a lower proportion of immigrant residents. Table 8: Immigration status of all residents in the City of Peterborough, the Province of Ontario and the GGH and its Inner and Outer Rings, 2006 Source: 2006 Census Furthermore, of those immigrants who call Peterborough home, almost 78% of them arrived in Canada prior to Since 1991, Peterborough s rate of immigrant settlement has consistently been lower that the average for the Province, the GGH and both the Inner and Outer Rings of the GGH (See Table 9). Consequently, unlike other areas of the GGH where international immigration is, and will continue to be, a major determinant of population growth, Peterborough is not a major destination for international immigrants and therefore immigration will have a relatively marginal influence on Peterborough s population growth throughout the Growth Plan horizon. Table 9: Proportion of immigrant population by period of settlement in the City of Peterborough, the Province of Ontario, and to the GGH and its Inner and Outer Rings Source: 2006 Census 2.3 Housing Tenure Housing tenure in Peterborough is significantly different than the rest of the GGH. Specifically, the 2006 Census indicates that 36% of all dwelling units are rented, while the remaining 64% are privately owned. As Table 10 indicates, the percentage of rental dwellings in Peterborough is 6% higher than the Outer Ring and 19% higher than the average for the GTA. While the majority of this rental housing is concentrated in the Downtown and the surrounding inner city neighbourhoods, significant concentrations of rental housing are also located near the hospital, the commercial areas near Clonsilla Avenue and The Parkway corridor, and off of Talwood Drive and Hedonics Road. 24
25 Exhibit C Sheet 25 of 79 With a proportionally higher population of both seniors and students, it is reasonable to expect a higher demand for rental accommodation in Peterborough compared to the GGH. Furthermore, as will be seen in Section 2.4.1, income levels in Peterborough are lower than other areas of the GGH. Therefore, more Peterborough residents seem to seek rental accommodations as an affordable alternative to home ownership compared to the rest of the GGH. Rental accomodations tend to be associated with higher density forms of housing (e.g. duplexes, row houses, low and high rise buildings). Relative to other GGH communities, Peterborough s higher demand for rental housing may stimulate a demand for higher density housing that could help the City achieve the Growth Plan s intensification and density targets. However, as noted previously, if new higher density housing is constructed to cater exclusively to student populations or as institutionalized housing for seniors, this construction will not advance the City s progress towards achieving the Growth Plan s residential density targets. This is something that the City will need to discuss with the Ministry to ensure that this type of construction would be adequately counted. Table 10: City of Peterborough s housing tenure compared to the Outer Ring and the GTA Variable City of Peterborough GGH Outer Ring Avg* GTA Avg** % of dwellings owned 64% 72% 83% % of dwellings rented 36% 28% 17% *includes City's of Barrie, Brantford, Guelph, Waterloo, Cambridge, and Kitchener **includes Region's of Halton, York, Peel, and Durham Source: 2006 Census Suburban housing development Like many municipalities in the GGH, a significant portion of Peterborough s new home development has typically been accommodated at the City s edge. Between 1986 and 2006, the three census tracts that have had the highest levels of residential construction are all located at the edge of the City (Census Tracts 9.03, 3.00, and 1.00, see Table 11 and Figure 5). Combined, these areas contain almost 45% of all residential units constructed City-wide during this period. Of all the housing constructed in these areas during the period, approximately 76% was in a low density, single detached form. Based on this, Peterborough s greenfield areas have typically been used to satisfy the local housing market s demand for low density, single detached housing. As the Growth Plan is implemented, this market preference will be challenged by the need to achieve significantly greater minimum residential densities in the City s greenfield areas. 25
26 Exhibit C Sheet 26 of 79 Table 11: The three Census Tracts with the most residential construction in Peterborough from 1986 to 2006 % change % of all in pop'n units units built LOW MEDIUM HIGH Census from 2001 constructed City-wide DENSITY (% DENSITY DENSITY (% Tract to to 2006 since 1986 of units) (% of units) of units) % % % TOTAL 44.4% AVG Source: 2006 Census Figure 6: The three census tracts with the most residential construction in Peterborough from 1986 to 2006 (Source: Statistics Canada, 2006) 26
27 Exhibit C Sheet 27 of 79 Table 12 looks at the various housing forms in the City as a proportion of all dwelling units and compares these figures with similar figures for Outer Ring municipalities that have a UGC and the regional municipalities in the GTA. Overall, Peterborough has a slightly higher proportion of single-detached dwellings than the average for the Outer Ring municipalities studied. Peterborough also has comparatively fewer high-rise apartment units, and more low-rise apartment units. This suggests that Peterborough does not have a strong demand for high-rise apartment buildings and that if the City is to achieve greater densities, it will need to emphasize the construction of more low to mid-rise apartment buildings. Table 12: The City of Peterborough s housing mix compared with the Outer Ring and the GTA Variable City of Peterborough GGH Outer Ring Avg* GTA Avg** single detached (% of dwellings occupied by usual residents) semi detached (%) row houses (%) apartments- duplex (%) apartments- fewer than 5 storeys (%) apartments- greater than 5 storeys (%) other (%) *includes City's of Barrie, Brantford, Guelph, Waterloo, Cambridge, and Kitchener **includes Region's of Halton, York, Peel, and Durham Source: 2006 Census 2.4 Employment Trends In 2006, there were approximately 40,700 fixed-location jobs within the City; up from 36,100 in Of the 4,600 jobs added during this period, the majority were created in the business services and wholesale/retail sales industries (See Table 13). Like the rest of the province, manufacturing employment has been declining in Peterborough in favour of service-oriented industries (see Table 14). Table 13: The City of Peterborough s employment activity by industry, as a percentage of all jobs, from 2001 to 2006, compared with the Province of Ontario Source: 2001 and 2006 Censuses 27
28 Exhibit C Sheet 28 of 79 Table 14: The City of Peterborough s employment activity by primary, secondary, or tertiary industry, as a percentage of all jobs, 1996 to 2006, compared with the Province of Ontario Source: 1996, 2001, and 2006 Censuses After looking in more detail at the nature of the jobs that are located in Peterborough relative to those located throughout the rest of the province and the GGH, it is evident that Peterborough functions as an important service center for its immediate surroundings. Compared to the rest of the GGH, Peterborough has a higher concentration of jobs in health care, education and retail (see Table 15). Given Peterborough s relative isolation from other major urban centers, it is evident that these specialized services have concentrated in Peterborough to serve the large rural area that surrounds the city. However, Peterborough s influence as a business center and employment hub has a lesser effect on other parts of the GGH where manufacturing, finance and business services are more prominent. It is also noteworthy to highlight that the size of Peterborough s manufacturing base compared to the average size for the Outer Ring of the GGH is further indication of the City s relative isolation away from the Province s major transportation routes and its major urban centres. Table 15: The City of Peterborough s employment breakdown by industry compared with the Province of Ontario and the GGH and its Inner and Outer Rings, 2006 Source: 2006 Census As Table 16 indicates, many of the City s largest employers are concentrated in the health care, education, retail, and public administration fields. 28
29 Exhibit C Sheet 29 of 79 Table 16: Top 30 employers in the City of Peterborough Company Sector Employees 1 Peterborough Regional Health Centre Health Care & Social Assistance General Electric Electric Motors/Nuclear Components Public School Board Educational Services City of Peterborough Public Administration Sir Sandford Fleming College Educational Services Ministry of Natural Resources Public Administration Trent University Educational Services PepsiCo Foods (Quaker Oats) Cereals/Beverages/Snacks Separate School Board Educational Services AON Inc. Property Development & Management Teleperformance Telecom - CRM AmeriCredit Financial Corporation Financial Services/Credit - CRM Minacs Worldwide Information Services - CRM Wal-Mart Retail Trade Siemens Milltronics Process Instruments Fairhaven Health Care & Social Assistance Sobey's Retail Trade Coach Canada Transporting & Warehousing ICT Group Financial Services/Marketing McDonald's Food Services Home Depot Retail Trade St. Joseph's at Fleming Health Care & Social Assistance Extendicare Health Care & Social Assistance Canadian Tire Retail Trade Numet/ODIM Specialized Equipment Fabrication GTS Lufthansa Customer Support Services Zellers Retail Trade Costco Retail Warehouse FisherCast Global Zinc Castings/Automotive/Telcom Loblaws Retail Trade 190 Source: 2008 GPAEDC Community Profile, School Boards contacted directly for numbers specific to the City Labour force In 2006, Peterborough had a potential labour force (persons over 15 years of age) of 62,355 people; representing almost 85% of the City s total population. Compared to the province and other areas of the GGH, Peterborough s potential labour force represents a higher proportion of its population than most other areas subject to the Growth Plan (see Table 17). Table 17: Size of Peterborough s potential labour force, 2006, as a percentage of its population, compared with the Province of Ontario and the GGH and its Inner and Outer Rings Source: 2006 Census 29
30 Exhibit C Sheet 30 of 79 Notwithstanding Peterborough s labour force potential, in 2006 its actual labour force was 38,350, which, when expressed as a percentage of the population aged 15 and over (i.e. Participation Rate), is proportionally smaller than the provincial and GGH average. Compared to the province and other areas of the GGH, Peterborough has a smaller proportion of its potential labour force population participating in the labour force and a higher rate of unemployment. Therefore, as shown in Table 18, Peterborough has a much lower proportion of its total population that is actually employed compared to the rest of the GGH. Table 18: The City of Peterborough s participation rate, employment rate, and unemployment rate compared with the Province of Ontario and the GGH and its Inner and Outer Rings, 2006 Source: 2006 Census Peterborough s comparatively low participation rate can largely be attributed to the city s large population of retirees. As previously noted in Table 6, 19.4% of the city s total population is over the age of 65. Proportionally, this represents a much higher concentration of seniors than the rest of the GGH. In fact, the only other GGH municipalities with similar concentrations of seniors are Peterborough County, City of Kawartha Lakes, and Northumberland County. Looking back to 1996, similar patterns of lower labour force participation and higher unemployment were observed in Peterborough compared to the rest of the province: Table 19: The City of Peterborough s employment activity from 1996 to 2006, compared with the Province of Ontario Source: 1996, 2001, and 2006 Censuses As the baby boom generation ages and people live longer, it is expected that Peterborough s high concentration of retirees will grow compared to the GGH and will keep the city s labour force participation rate lower than the provincial and GGH average throughout the course of the Growth Plan. Conversely, Peterborough also has a proportionally smaller youth population compared to the provincial and GGH averages 30
31 Exhibit C Sheet 31 of 79 and therefore Peterborough s labour force will grow at a slower rate than the rest of the GGH. Table 20: The City of Peterborough s percentage of population under 14 years of age, compared with the Province of Ontario and the GGH and its Inner and Outer Rings, 2006 Source: 2006 Census Based on this, it is expected that Peterborough s job market will grow slowly, as forecast by the Growth Plan, unless Peterborough is able to attract significant new employers to the city, or if current employers within the city are able to expand and generate significant new employment. With respect to education, Peterborough s labour force is similar to that of other municipalities in the Outer Ring of the GGH. Specifically, Peterborough has a higher proportion of college-educated residents than both the provincial and Inner Ring and a lower proportion of university graduates (see Table 21). Table 21: The City of Peterborough s level of education compared with the Province of Ontario and the GGH and its Inner and Outer Rings, 2006 Source: 2006 Census Overall, 48% of Peterborough residents aged 15 and over have completed some form of post-secondary education. This level of educational attainment is slightly above the average for the Outer Ring of the GGH (47%) but below the provincial (51%) and Inner Ring (54%) average. This education profile would suggest that Peterborough s labour force is well suited for employment in sectors that require applied skills. Notwithstanding the skilled nature of Peterborough s labour force, employment earnings are somewhat lower in Peterborough when compared to the provincial median and the 31

32 Exhibit C Sheet 32 of 79 average reported median for the municipalities within the GGH (see Table 22). In 2006, the median income reported for Peterborough residents 15 and over working in full time permanent jobs was $40,046; approximately $4,700 less annually than the provincial median. When planning for growth, Peterborough s relatively low labour costs may be viewed as both an attraction to potential employers wishing to establish a business in the city and as a deterrent to potential workers considering relocating to or staying in the city. However, any deterrent that lower income levels may create for potential works may be offset by Peterborough s relatively lower cost for housing compared to most other GGH communities (see Table 23). Table 22: The City of Peterborough s median income compared with the Province of Ontario and the GGH and its Inner and Outer Rings, 2006 Source: 2006 Census Table 23: Average Resale Value of Homes in Select GGH Communities, Source: Canada Mortgage and Housing Corporation, Location of work and commuting patterns In 2006, just over 85% of the city s employed labour force reported working at a fixed location while just over 5% reported working from home. The remaining 10% either reported working at a job with no fixed address or working out of the country. As illustrated in Table 24, compared to provincial and GGH averages, Peterborough has fewer residents working from home and more residents working at a fixed location. 32
33 Exhibit C Sheet 33 of 79 Table 24: City of Peterborough residents place of work compared with the Province of Ontario and the GGH and its Inner and Outer Rings, 2006 Source: 2006 Census Commuting Flow Data For the purpose of planning to achieve the Growth Plan s minimum density targets as measured in persons and jobs, Peterborough s assumed rate of home based employment will be lower than most other areas of the GGH and therefore proportionally more of Peterborough s forecasted employment growth will need to be directed to employment designated areas than other GGH municipalities. Looking at the nature of Peterborough residents jobs, the City s role as a service center for the surrounding area becomes evident. This conclusion is further affirmed when looking at commuting patterns to and from Peterborough. These commuting patterns also provide further evidence of Peterborough s isolation from other areas of the GGH as described previously. In 2006, approximately 80% of Peterborough s employed labour force that reported working at a usual location worked within the city (see Table 25). This proportion is significantly higher than both the provincial and GGH averages and has remained relatively unchanged since Additionally, of those Peterborough residents that do leave the city for work, relatively few of them work outside the County. These figures starkly contrast those reported for residents of the GGH, particularly for residents of the Inner Ring where commuting across City and Regional/County boundaries is common due to a high concentration of municipalities. These figures also exemplify Peterborough s isolation from other major urban centers in the GGH and confirm that Peterborough generally does not act as a bedroom community for employment in other municipalities. 33
34 Exhibit C Sheet 34 of 79 Table 25: City of Peterborough residents commuting patterns compared with the Province of Ontario and the GGH and its Inner and Outer Rings, 2006 Source: 2001 and 2006 Censuses Commuting Flow Data When commuting patterns are considered, Peterborough s role as a central place becomes more apparent. In 2001 and 2006, Census figures indicate that more than twice as many people enter Peterborough on a daily basis for work than leave (see Table 26). Table 26: Commuters entering and leaving the City of Peterborough, 2006 Source: 2001 and 2006 Censuses Commuting Flow Data Additionally, when using commuting flow data available from the Census, it is evident that Peterborough s central place role for employment is limited primarily to its immediate surroundings. In 2001 and 2006, 90% of all jobs located within the City of Peterborough were occupied by either residents of the City or County (see Table 27). Furthermore, of the remaining 10% of jobs that were occupied by people residing beyond the county, people from the City of Kawartha Lakes, immediately west of Peterborough, occupied 50% of them. Table 27: The proportion of those working in the City of Peterborough as residents of the City, Peterborough County, or from outside of the County Source: 2001 and 2006 Censuses Commuting Flow Data Therefore, as a center of employment, Peterborough s labour market is almost exclusively concentrated on its residents and the residents of its immediate surroundings rather than the GGH or even the Outer Ring of the GGH. Given this role, it is anticipated that the new job growth forecast by the Growth Plan for Peterborough will 34
35 Exhibit C Sheet 35 of 79 provide employment primarily for residents of the City and for those people residing just outside of the city in Peterborough County and the City of Kawartha Lakes Peterborough s employment forecasts compared with the rest of the GGH Between 2001 and 2031, both the City and County of Peterborough are forecast to provide an additional 7,000 jobs, representing an increase of 13.2%. Table 28 indicates that of all upper and single tier municipalities in the GGH, this is the lowest employment growth percentage forecast. Again, the greatest employment growth is forecast for the Region s of Halton (105.3%) and York (100%). Table 28: Employment forecasts for the GGH, 2001 to 2031 % of total GGH Forecast Employment Employment employment Municipality Employment Employment increase (jobs) increase (%) growth Halton Region 190, , , % 11.5% York Region 390, , , % 22.3% Durham Region 190, , , % 9.2% Simcoe County/City of Barrie/City of Orillia 154, , , % 5.7% Peel Region 530, , , % 19.5% City of Guelph/Wellington County 99, ,000 59, % 3.4% Waterloo Region 236, , , % 7.4% City of Hamilton 210, ,000 90, % 5.2% Dufferin County 19,000 27,000 8, % 0.5% City of Kawartha Lakes 20,000 27,000 7, % 0.4% City of Brantford/Brant County 55,000 71,000 16, % 0.9% Haldimand County 17,000 20,000 3, % 0.2% Niagara Region 186, ,000 32, % 1.8% City of Toronto 1,440,000 1,640, , % 11.5% Northumberland County 29,000 33,000 4, % 0.2% City of Peterborough/Peterborough County 53,000 60,000 7, % 0.4% Total 3,818,000 5,564,000 1,746, % Source: Growth Plan Schedule Potential Drivers of Future Population and Employment Growth The Growth Plan states that the Province will review the population and employment forecasts contained in Schedule 3 at least every five years and potentially revise the forecasts in consultation with the affected municipalities (policy ). It has already been discussed and explored how the Province currently forecasts a considerably slower rate of growth for Peterborough than much of the GGH. The following will identify current or potential developments within the City and the broader region that may prove to be significant drivers of future population and employment growth in Peterborough. While the exact scale and degree to which these developments may ultimately influence the growth of the City is currently unknown, the point of this discussion will be to identify the potential drivers that may ultimately cause the Province to upwardly revise its growth forecasts for the City of Peterborough during the Growth Plan planning horizon Highway 407 extension The easterly extension of Highway 407 to Highways 35 and 115 in Clarington has the potential to influence population and employment growth in the City of Peterborough since access to a major highway is one of the key location considerations for many 35
36 Exhibit C Sheet 36 of 79 industries. The easterly extension of Highway 407 would offer another east-west route across the GTA to the City of Toronto, York Region, Pearson Airport, and other key GTA/GGH destinations, and would likely reduce congestion along the Highway 401 corridor through Durham Region and beyond. Presently, Peterborough is directly served by Highway 115- a four lane divided Provincial Highway that connects the city to Highway 401 in Durham Region. While Markham is presently about 130 kilometres away from Peterborough along Highway 115 and Highway 401, the Highway 407 extension would shorten this trip to about 100 kilometres. Therefore, with the extension of Highway 407 to Highway 115/35, Peterborough would be suddenly much closer to the rapidly growing north GTA area, and this added transportation accessibility coupled with the City s comparatively cheaper land costs, could result in strong employment growth for the City. Specifically, the Greater Peterborough Area Economic Development Corporation (GPAEDC) states that the price per acre for serviced industrial land in Peterborough is currently $40,000. This is considerably lower than prices for serviced industrial land in the City s of Barrie, London, Kitchener, Cambridge, and Brantford, where prices range from $75,000 to $290,000 per acre. The GPAEDC also states that there is about 54 hectares of serviced industrial land currently available in Peterborough s two industrial parks. This means that based on the existing density of about 33 jobs per hectare in Peterborough s industrial areas, this available serviced industrial land has the potential to accommodate approximately 1,780 jobs. This suggests Peterborough s capacity to accommodate significant employment growth on its existing employment lands in the immediate future. The opening of Highway 407 has significantly changed highway accessibility for residents and industries through the GTA, serving as a significant economic stimulus in both Peel and York Regions. The Highway 407 corridor offers a unique opportunity for business as an alternative route to distribute goods and services throughout the central GGH employment market and beyond. The construction of Highway 407 to Highway 115/35 is expected to be complete in As seen in Figure 7, the construction of a new highway can positively influence employment growth. In the municipalities cited, each had direct access to a newly constructed highway and, as a consequence, each experienced significant employment growth immediately thereafter. Although Peterborough will not have direct access to the newly constructed Highway 407, its construction will significantly reduce travel times between Peterborough and the rapidly growing areas north and west of Toronto. Therefore, while it is clear that major highways positively influence employment growth, the extent to which the Highway 407 extension may stimulate employment growth in Peterborough is unknown, and in fact may have little or no impact because its influence will likely be greatest on the eastern GTA region that includes Oshawa, Whitby, Ajax, and Pickering. 36
 In addition to potentially attracting new employment (and its associated population) to Peterborough, the Highway 407 extension may also decrease the city s")
37 Exhibit C Sheet 37 of 79 Figure 7: Impacts of Highway 407 and 403 on industrial development in Brantford, Vaughan, Brampton, and Markham (Source: Brant County Growth Analysis Study, prepared by Watson & Associates Economists, 2008) In addition to potentially attracting new employment (and its associated population) to Peterborough, the Highway 407 extension may also decrease the city s geographic isolation from the rest of the GTA, making it a more desirable location for people who work in the GTA but prefer to live in a small town setting and for those who live in the GTA but commute to work in Peterborough. While Census figures discussed previously in Tables 25 and 27 indicate that the City of Peterborough has a relatively low commuting interaction with areas outside of the County, the introduction of the eastern extension of Highway 407 could change this pattern and create pressure for the City to grow beyond the forecast in the Growth Plan. As evidenced in Tables 29 and 30 Peterborough experienced modest growth in the number of people commuting from areas south and west of the City and County between 2001 and Table 29: People commuting into the Table 30: People commuting into the City of Peterborough, 2001 City of Peterborough, 2006 Municipality # of people Toronto 200 Clarington 135 Oshawa 100 Whitby 30 Scugog 30 Ajax 25 Hamilton 20 Total 540 Source: 2001 Census Municipality # of people Toronto 240 Clarington 205 Oshawa 160 Whitby 65 Richmond Hill 50 Ajax 45 Mississauga 40 Markham 35 Vaughan 30 Kitchener 20 Scugog 50 Total 940 Source: 2006 Census 37
38 Exhibit C Sheet 38 of Pickering International Airport In 1972 the Federal Government expropriated approximately 7,350 hectares of land in northern Pickering, eastern Markham and southwest Uxbridge for a potential second international airport to serve the GTA. The lands, which have subsequently been leased to residential, farm and commercial tenants for interim use until they are required for airport purposes, are directly served by Highway 407 at its current Brock Road terminus. In 2007, Transport Canada awarded a contract to the Greater Toronto Airports Authority (GTAA) to complete a Needs Assessment for the proposed facility. At the time, Transport Canada did not expect to make a decision regarding an airport on these lands until at least Notwithstanding that a decision has yet to be made, it is expected that a decision will be made during the current horizon of the Growth Plan and that construction of an airport, if approved, will occur prior to Consequently, the planning for and construction of an international airport facility in northern Pickering with direct access to Highway 407 could significantly contribute to population and employment growth in the eastern GTA region between now and Based on an analysis done by the Greater Toronto Airports Authority in 2003 (GTAA), approximately 5,400 to 11,000 new jobs could be created in the airport s vicinity by 2032, depending on the rate of growth in aviation activity at the airport (the study was done based on the assumption that the airport would be completed by 2012). By 2032, the study also suggests that the airport could have an economic impact ranging from about $1.9 billion to about $4.2 billion. While the idea of constructing an airport in Pickering has been around since the 1970s, there is considerable controversy that surrounds its construction and it is unclear whether the Pickering Airport will ever be built. However, due to the large amount of employment that such an airport would provide, it is likely that its construction would also have a positive influence on population and employment growth in the City of Peterborough. With the airport lands being directly served by Highway 407, Peterborough may be viewed as a desirable residential location for commuters who wish to live in Peterborough but work in the airport vicinity. Additionally, with a convenient transportation connection between the city and the proposed facility, Peterborough may attract industries that want to take advantage of the city s low land and labour costs while maintaining easy access to the airport for cargo shipping. Consequently, should a new international airport ever be constructed in Pickering, Peterborough may face population and employment growth pressures that are unforeseen under the current Growth Plan forecast Peterborough Municipal Airport The Peterborough Municipal Airport, which is owned by the City and located just outside the city in the Township of Cavan Monaghan, serves as the center for a municipallyserviced industrial area that currently employs approximately 250 people and indirectly provides an additional 170 full-time equivalent jobs. Presently, the airport accommodates general/recreational flight operations, freight operations, and aircraft 38
39 Exhibit C Sheet 39 of 79 rebuild, support and maintenance operations and generates over $26 million annually in Gross Domestic Product. In 2008, in response to business development opportunities, City Council approved a $7.38 million dollar Airport Development Program to transform the airport from a locally significant employment area to one of regional significance. Starting in 2008, the program calls for advancing the city s progress in implementing the Airport Master Plan to ultimately provide extended and upgraded runways and taxiways to accommodate heavier traffic, additional lands for industrial purposes, a new permanent airport terminal, and expanded facilities for industrial/commercial and recreational flight operations. A report completed by LPS Avia Consulting and presented to Council in March 2009 indicated that this investment has the potential to create about 80 full-time jobs while increasing the annual direct economic impact of the airport by $11.6 million. Additionally, in order to further maximize the regional economic benefit of the airport, LPS Avia recommended that a $21.3 million investment into extending the existing runway be made. The report suggests that this type of an investment has the potential to create an additional 300 jobs and $152 million in economic activity for the region. Although the airport is not located within the city proper, as it grows, it will become both a significant employment area for city residents and an attraction for new residents seeking aviation-related jobs. Furthermore, should a new international airport be constructed in Pickering, it is anticipated that business development at the Peterborough airport will be enhanced, because the cost of operating Aircraft support services in Peterborough will likely be significantly cheaper than in Pickering, and Peterborough s close proximity to Pickering should prove attractive to international repair clientele flying out of Pickering. Therefore, it is expected that expansion of the airport will enhance Peterborough s role as an economic hub for its immediate surroundings and generate population growth pressure in the city that may not be currently considered in the Growth Plan Peterborough Toronto Commuter Railway Between the late 1950s and 1990, Peterborough enjoyed scheduled passenger rail service to and from Toronto. However, in 1990 regular commuter rail service was cancelled. Since that time, local interest has been maintained for the resumption of passenger rail service between Peterborough and Toronto. In the 2008 federal budget, the Canadian Government created the Public Transit Capital Trust with the purpose of supporting public transit infrastructure. Using funding from this trust, the provincial and federal governments committed to jointly undertake a study to assess the merits of re-establishing commuter rail service between Peterborough and Toronto. Although it is uncertain at this time whether Peterborough will see resumed passenger rail service to Toronto, it is anticipated that the provision of any such service would stimulate population growth in Peterborough, as commuting between Toronto, Durham Region and Peterborough would be made easier. 39
40 Exhibit C Sheet 40 of 79 Currently, CP Railway operates a freight rail between Havelock and Toronto, passing through Peterborough. Known as the Havelock Subdivision, this rail was formerly used for passenger service prior to Should this railway be used for passenger service again, it would provide direct service to Peterborough, City of Kawartha Lakes (Pontypool), north Whitby, north Pickering, Markham, and Toronto. Additionally, if the Havelock Subdivision were used for passenger service, it could directly serve the proposed Pickering International Airport since the railway already bisects the federal lands that have been reserved for the airport. Therefore, should passenger service resume on the Havelock subdivision, it could stimulate both population and employment growth in Peterborough as people and businesses take advantage of the increased connectivity that the rail would provide Greater Peterborough Innovation Cluster In 2006, the first phase of an 85-acre research and development park opened at Trent University to focus on the commercialization of applications related to regional DNA and related research. Known as the Greater Peterborough Innovation Cluster, this park is helping the Peterborough area transform itself away from the industrial mass-production economy that characterized the greater part of the 20 th century and into the knowledgebased economy that will increasingly characterize the 21 st century. By capitalizing on Peterborough s presence of prominent public institutions such as Trent University, Fleming College, and the Ontario Ministry of Natural Resources, the cluster intends to provide an institution that will create a synergy between these public institutions that will spawn advances in DNA related research that will also attract private businesses and organizations to the park to also benefit from this synergy and the research and innovation advances that it may provide. Therefore, the ultimate success of the Cluster will be determined by the rate at which private businesses locate to the park. According to a study on the potential economic impact of the Greater Peterborough Innovation Cluster, the degree to which the cluster can contribute to the economic growth of the region is dependent upon two factors. First, the overall growth of the biotechnology industry will determine the level of effective demand for the types of operations that the Cluster will provide support for. Second, the Cluster s ability to facilitate the transfer of knowledge-based advances in the biotechnology field to practical, commercializable applications will have a direct impact on the potential economic growth of the Peterborough region. Moreover, if the Cluster s ability to facilitate new applications and support existing organizations grows at a rate faster than the growth in the biotechnology field in general, a greater share of biotechnology-related organizations will develop in the region. The analysis on the economic impact of the Cluster completed by Professor Thomas Phillips of Fleming College in 2004 projected that in 20 years, the cluster could generate between $152.4 million and $352 million in economic activity directly related to the biotechnology field, representing 2,179 to 5,025 jobs. The analysis also forecast that over the same 20-year period, the construction of additional facilities for biotechnologyrelated activities at the cluster would contribute $144 million or 2058 job equivalents to the region. Therefore, further development at the Cluster has the potential to stimulate 40
41 Exhibit C Sheet 41 of 79 population and employment growth in Peterborough on a scale that the current Growth Plan forecasts may not foresee. 2.6 Peterborough is a Unique Community Within the GGH Geographically, Peterborough is the most isolated municipality with a UGC in the GGH, located approximately 30 kilometres further away from its nearest UGC than any other pair of UGCs. Despite having a good highway connection to the GTA, this isolation is reflected in the Census data with very low commuting interaction between Peterborough and areas outside of Peterborough County and Kawartha Lakes. Because of this isolation, Peterborough has generally developed as a self-sustaining community, relying less on economic synergies with neighbouring municipalities than most other GGH municipalities in order to achieve its growth. As a consequence, Peterborough has a very different population and employment outlook than most other GGH communities. Generally, Peterborough s rate of population and employment growth is forecast to be much slower than the other urban communities in the GGH that have a designated UGC. Proportionally, Peterborough has a much larger senior population and a much smaller youth population compared to the urbanized areas of the GGH. As a result, Peterborough has proportionally lower labour force participation and employment rates than other urban GGH municipalities and a limited ability to replace its retiring workers. Additionally, unlike other GGH municipalities, Peterborough does not rely on international immigration to grow its labour force as most immigrants to the region settle in the heavily urbanized inner ring municipalities. From an economic perspective, Peterborough functions as the Kawartha s principal employment center with more than twice as many people commuting to Peterborough for work each day than leaving. Of those who commute to Peterborough for work, the majority resides within Peterborough County and the City of Kawartha Lakes. Looking at the nature of work performed by city residents, this central place role appears to be reinforced as Peterborough has proportionally more people working in service industries such as health care, education and retail than most other GGH municipalities. With a more locally oriented economy, Peterborough employers generally do not compete with employers in other GGH municipalities for labour and therefore labour costs tend to be lower in Peterborough. Notwithstanding the city s lower labour costs, unemployment has tended to be higher in Peterborough than in most other GGH municipalities. Given this analysis, it would appear that Peterborough actually has very little in common with other urban municipalities in the GGH. While approved projects such as the Highway 407 extension, the Peterborough municipal airport expansion, and the DNA cluster and proposed projects such as the Pickering airport and the Peterborough- Toronto commuter railway could facilitate economic integration with the GGH in the future, for the time being, Peterborough s outlook is defined by its self-sustaining nature. 41


42 Exhibit C Sheet 42 of 79 In fact, looking at other municipalities throughout Ontario, Peterborough appears to have more in common with municipalities that are characterized as locally or regionally significant central places in that they are not integrated within a major metropolitan area. For example, as seen in Table 31, Peterborough s population growth rate is more in line with places like London and Midland, which serve an important central place role for their immediate surroundings or region, however they are removed from the metropolitan areas of Toronto and Ottawa. On the other hand, Peterborough s population change is more positive than comparatively more isolated communities in northern Ontario where resourcebased industries are declining. Overall, in Ontario, the highest rates of population growth are concentrated in communities that have a relatively high degree of economic interaction with Toronto. Table 31: % Population Change for Ontario Census Metropolitan Areas (CMAs) and Census Agglomerations (CAs), Source: 2006 Census Highlight Tables, Statistics Canada, 2008 Another distinguishing feature of Peterborough is its aging population. While all communities are aging in general, Peterborough has a significantly older population than most other GGH communities: Table 32: Median Age of Ontario CMAs and CAs, 2006 Table 33: % of Population Aged 65 and over, Ontario CMAs and CAs, 2006 Source: 2006 Census Highlight Tables, Statistics Canada, 2008 Source: 2006 Census Highlight Tables, Statistics Canada,

43 Exhibit C Sheet 43 of 79 As can be seen in Tables 32 and 33, many of the major urban areas in the GGH have a significantly younger population than Peterborough. Comparatively, Peterborough residents are more similar in age to residents of communities outside the GGH; particularly residents of central and eastern Ontario. As noted previously, Peterborough receives relatively few immigrants compared to most other areas of the GGH. As illustrated in Tables 34 and 35, Peterborough s immigration levels are more similar to urbanized centers outside the GGH. Table 34: Immigrants as % of Total Population, Ontario CMAs and CAs, 2006 Table 35: % of All Immigrants Residing in Ontario CMAs and CAs that immigrated between 2001 and 2006 Source: 2006 Census Highlight Tables, Statistics Canada, 2008 Source: 2006 Census Highlight Tables, Statistics Canada, 2008 Considering labour force activity (see Tables 36, 37 and 38), urban communities in the GGH tend to have higher participation and employment rates than Peterborough and lower unemployment. As with previous comparisons, Peterborough s labour force activity is more similar to that of isolated central places such as Belleville, Sudbury and Thunder Bay than they are with the GGH. 43

44 Exhibit C Sheet 44 of 79 Table 36: % of Population aged 15 and over that participates in the labour force, Ontario CMAs and CAs, 2006 Table 37: % of Population aged 15 and over that is employed, Ontario CMAs and CAs, 2006 Table 38: Unemployment Rate, Ontario CMAs and CAs, 2006 Source: 2006 Census Highlight Tables, Statistics Canada, 2008 With lower labour force participation and employment than the GGH and higher unemployment than the GGH, it is not surprising to find that labour costs in Peterborough are lower than in the GGH. In general, income levels in Peterborough are similar to those in small and mid-size urban communities in central and eastern Ontario that are outside the GGH (see Table 39). Ultimately, a key theme of the Growth Plan is to build complete communities that meet people s needs for daily living throughout an entire lifetime; allowing people to live, shop, work and play within the community. According to the Growth Plan, one important aspect of a complete community is to provide residents with convenient access to an appropriate mix of jobs. In areas that fall short of this goal, people tend to commute farther for work as they need to look outside their community for work. Table 39: Median income for fulltime workers, Ontario CMAs and CAs, 2005 Source: 2006 Census Highlight Tables, Statistics Canada,

45 Exhibit C Sheet 45 of 79 In the GGH, many of the urban areas such as Toronto, Oshawa and Barrie exhibit higher commuting distances as commuting between cities is commonplace due to their close proximity and the integrated nature of transportation system throughout much of the GGH. Notwithstanding this, the longest commuting distances are actually borne by residents in rural municipalities such as Centre Wellington and Kawartha Lakes who work in nearby urban centers. Table 40: Median Commuting Distance for Workers in Ontario CMAs and CAs, 2006 As seen in Table 40, Peterborough s median commuting distance is comparable to small and medium cities throughout the province that are not in the commuter shed of a major urban center (with the exception of Guelph). Commuting distances in these cities are lower because most people do not need to leave their home community for work. Arguably, these places function more as a complete community for their residents than many of the larger cities in the GGH. Overall, looking at factors influencing Peterborough s population growth and labour force, as well as its integration with surrounding communities, Source: 2006 Census Highlight Tables, Statistics Canada, 2008 Peterborough appears to share more characteristics with local or regionally significant communities outside of the GGH than it does with the GGH. In particular, communities such as Belleville, North Bay, Sudbury and Thunder Bay appear to have more in common with Peterborough than do places like Toronto, Hamilton and Kitchener. From a growth management perspective, these dissimilarities between Peterborough and the GGH could mean that major planning issues affecting the rapidly growing urbanized portions of the GGH are less relevant in the Peterborough context. Consequently, implementing Growth Plan policies in Peterborough that are really tailored to address issues that are relevant in places like Barrie, Newmarket, or Oakville may affect Peterborough s ability to maintain itself as a complete community as it exists today. With more in common with communities outside the GGH than inside, it may be worthwhile to explore Peterborough s place in the provincial Growth Plan framework should the opportunity arise. At the earliest, this could be done at such a time as a Growth Plan is prepared for eastern Ontario. 45

46 Exhibit C Sheet 46 of THE GROWTH PLAN S INTENSIFICATION AND DENSITY TARGETS As depicted in Figure 5 below, the City of Peterborough has the following designated areas under the Growth Plan: Urban Growth Centre, Built Area, and Designated Greenfield Area. Each area has a numerical target that the City is expected to incorporate into its official plan and strive to achieve as a part of the Growth Plan s overall vision of creating more compact and complete communities. This section will describe and outline what the numerical requirements for each area will mean for the future development of the City of Peterborough. Figure 8: The Growth Plan applied to the City of Peterborough (Source: Boundaries as delineated by the Ministry of Energy and Infrastructure) 46
CHAIR AND MEMBERS PLANNING & ENVIRONMENT COMMITTEE
 TO: CHAIR AND MEMBERS PLANNING & ENVIRONMENT COMMITTEE FROM: SUBJECT: JOHN M. FLEMING MANAGING DIRECTOR, PLANNING AND CITY PLANNER INFORMATION REPORT REVIEW OF INTENSIFICATION TARGETS IN THE LONDON PLAN
City of Brantford Chapter 3 TABLE OF CONTENTS
 Chapter 3 The Land Use & Transportation Connection TABLE OF CONTENTS 3.1 THE LAND USE & TRANSPORTATION LINK... 1 3.2 POPULATION & EMPLOYMENT GROWTH FORECASTS... 3 3.2.1 Proposed Places to Grow Plan Forecasts
Executive Summary Planning for Health, Prosperity and Growth in the Greater Golden Horseshoe:
 Executive Summary Planning for Health, Prosperity and Growth in the Greater Golden Horseshoe: 2015-2041 Recommendations of the Advisory Panel on the Coordinated Review of the Growth Plan for the Greater
Towards Performance. Preliminary Indicators for Discussion
 Towards Performance Indicators FOR THE Growth Plan for the Greater Golden Horseshoe, 2006 Preliminary Indicators for Discussion Overview Greater Golden Horseshoe How are we doing? This document introduces
Growth Plan for the Greater Golden Horseshoe (2017)
") Growth Plan for the Greater Golden Horseshoe (2017) GROWTH PLAN for the Greater Golden Horseshoe May 2017 Approved by the Lieutenant Governor in Council, Order in Council No 1024/2017. The Growth Plan
Growth Plan for the Greater Golden Horseshoe (2017) GROWTH PLAN for the Greater Golden Horseshoe May 2017 Approved by the Lieutenant Governor in Council, Order in Council No 1024/2017. The Growth Plan
TRANSPORTATION DEMAND FORECASTING INFORMATION SESSION
 GTA WEST CORRIDOR PLANNING AND EA STUDY-STAGE STAGE 1 TRANSPORTATION DEMAND FORECASTING INFORMATION SESSION JUNE 2008 Topics for this Session 1. The Challenge of Growth 2. Overview of GTAW Study 3. The
HEMSON C o n s u l t i n g L t d.
 DEVELOPMENT PHASING STRATEGY: REGIONAL MUNICIPALITY OF NIAGARA FINAL REPORT C o n s u l t i n g L t d. November 4, 2013 TABLE OF CONTENTS EXECUTIVE SUMMARY... 1 I INTRODUCTION... 2 II GROWTH PROSPECTS...
City of Kawartha Lakes Growth Management Strategy and Municipal Master Plan Project
 and Municipal Master Plan Project EXECUTIVE SUMMARY VOLUME 1: VOLUME 2: VOLUME 3: VOLUME 4: VOLUME 5: GROWTH MANAGEMENT STRATEGY MUNICIPAL SERVICING ASSESSMENT TRANSPORTATION MASTER PLAN SOLID WASTE MANAGEMENT
REPORT Meeting Date: Regional Council
 8.2-1 REPORT Meeting Date: 2018-04-12 Regional Council DATE: April 10, 2018 REPORT TITLE: FROM: Janette Smith, Commissioner of Public Works RECOMMENDATION That Regional Council recommend to the Provincial
4 GROWTH PLAN FOR THE GREATER GOLDEN HORSESHOE 2006 OFFICE CONSOLIDATION JANUARY 2012 INCLUDING AMENDMENT 1 TO THE GROWTH PLAN FOR THE SIMCOE SUB-AREA
 Report No. 3 of the Planning and Economic Development Committee Regional Council Meeting of March 22, 2012 4 GROWTH PLAN FOR THE GREATER GOLDEN HORSESHOE 2006 OFFICE CONSOLIDATION JANUARY 2012 INCLUDING
Farmland Loss Trends, Predictions and Potential Action
 Farmland Loss Trends, Predictions and Potential Action By: Wayne Caldwell and Sara Epp Golden Horseshoe Food and Farming Alliance September 26, 2017 Presentation Outline Farmland in Ontario Why protect
APPENDIX F1 Legislative Context
 APPENDIX F1 Legislative Context Halton Region Transportation Master Plan Legislative Context Contents Page 1. LEGISLATIVE CONTEXT...1 1.1 2005 Provincial Policy Statement...3 1.2 Greenbelt Act (2005)...3
Simcoe Area: A Strategic Vision for Growth
 Simcoe Area: A Strategic Vision for Growth June 2009 Table of Contents 1 Introduction 1 1.1 Purpose 1 1.2 Building Strong, Vibrant Communities 4 1.3 Managing Growth in the Simcoe Area 5 2 Guiding Principles
Revised Report as approved by City of Guelph Council on October 4, 2004
 Subject Recommendations Background City of Guelph Response to Places to Grow, Better Choices, Brighter Future That PET Report 04-79 and its appendices titled City of Guelph Response to Places to Grow,
DRAFT TOWN OF MILTON EMPLOYMENT LAND NEEDS ASSESSMENT STUDY PHASE 2 ANALYSES AND RECOMMENDATIONS REPORT EXECUTIVE SUMMARY
 APPENDIX 1 PD-040-16 DRAFT TOWN OF MILTON EMPLOYMENT LAND NEEDS ASSESSMENT STUDY PHASE 2 ANALYSES AND RECOMMENDATIONS REPORT EXECUTIVE SUMMARY REPORT SUMMARY The Town of Milton Employment Land Needs Assessment
Lincoln - OFFICIAL PLAN PART 1 INTRODUCTION 1.1. THE COMMUNITY VISION
 Lincoln - OFFICIAL PLAN PART 1 INTRODUCTION 1.1. THE COMMUNITY VISION The vision for Lincoln is to be a Centre of Excellence for Agriculture; an inclusive community that values diversity, partnerships,
Section 6 Table of Contents. List of Tables. List of Figures
 Section 6 Table of Contents 6. The Study Area... 6-3 6.1 Study Area Environment... 6-3 6.1.1 Natural Environment... 6-3 6.1.2 Socio-Economic... 6-4 6.1.3 First Nations Communities... 6-4 6.1.4 Economic
WELLINGTON NORTH COMMUNITY GROWTH PLAN
 WELLINGTON NORTH COMMUNITY GROWTH PLAN FINAL REPORT Township of Wellington North Final February 2018 WELLINGTON NORTH COMMUNITY GROWTH PLAN FINAL REPORT Township of Wellington North Final February 2018
City of Kingston. Public Information Centre #2. Population, Housing and Employment Projections Study. December 3, 2018
 City of Kingston Population, Housing and Employment Projections Study Public Information Centre #2 December 3, 2018 City of Kingston Population, Housing and Employment Projections Study Jamie Cook DIRECTOR
WELLINGTON NORTH COMMUNITY GROWTH PLAN
 WELLINGTON NORTH COMMUNITY GROWTH PLAN FINAL REPORT Township of Wellington North Draft January 2018 WELLINGTON NORTH COMMUNITY GROWTH PLAN FINAL REPORT Township of Wellington North Draft January 2018 Prepared
DATE: January 20, 2014 REPORT NO. PW Chair and Members Committee of the Whole Operations and Administration
 PUBLIC WORKS COMMISSION DATE: January 20, 2014 REPORT NO. PW2014-007 TO: FROM: Chair and Members Committee of the Whole Operations and Administration Geoff Rae, MBA, P.Eng. General Manager, Engineering
Ontario s Land Use Planning System
 Ontario s Land Use Planning System Economic Developers Council of Ontario February 2017 Marcia Wallace, PhD., MCIP, RPP Ministry of Municipal Affairs Our Work The Ministry of Municipal Affairs (MMA) is
Public Information Centre #1. March 2010
 Public Information Centre #1 March 2010 Purpose of Public Information Centre Halton Region is initiating a Transportation Master Plan (2031) The Road to Change The Plan will develop a sustainable, integrated
Amendment No. 38. An Amendment to Incorporate the Results of Sustainable Halton, Official Plan Review Directions and Other Matters
 Amendment No. 38 to THE REGIONAL PLAN (2006) Official Plan for the Halton Planning Area Regional Municipality of Halton An Amendment to Incorporate the Results of Sustainable Halton, Official Plan Review
Hospital Re-location Analysis
 Hospital Re-location Analysis Background Collingwood General and Marine Hospital is in the early stages of a capital hospital facility redevelopment with the Ministry of Health and Long Term Care. The
Planning Justification Report. 70 Pioneer Trail Fernbrook Homes (Parkside) Ltd. Official Plan Amendment Zoning By-law Amendment.
 Ltd. Official Plan Amendment Zoning By-law Amendment.") 70 Pioneer Trail Fernbrook Homes (Parkside) Ltd Planning Justification Report Official Plan Amendment Zoning By-law Amendment September 2016 The Jones Consulting Group Ltd. #1-229 Mapleview Drive East,
70 Pioneer Trail Fernbrook Homes (Parkside) Ltd Planning Justification Report Official Plan Amendment Zoning By-law Amendment September 2016 The Jones Consulting Group Ltd. #1-229 Mapleview Drive East,
Regional Municipality of Halton: Economic Development Strategy Discussion Paper #1
 Regional Municipality of Halton: Economic Development Strategy 2011-2021 Discussion Paper #1 Business Growth: Economic Development and Employment Lands PREFACE This series of Discussion Papers was produced
PLANNING AND BUILDING SERVICES Planning (Report # 06-14)
") PLANNING AND BUILDING SERVICES Planning (Report # 06-14) Report: TO: Planning, Environment & Transportation Committee DATE: 2006/01/16 SUBJECT: CITY OF GUELPH RESPONSE TO PLACES TO GROW, BETTER CHOICES,
PLANNING AND BUILDING SERVICES Planning (Report # 06-14) Report: TO: Planning, Environment & Transportation Committee DATE: 2006/01/16 SUBJECT: CITY OF GUELPH RESPONSE TO PLACES TO GROW, BETTER CHOICES,
EMPLOYMENT LAND REVIEW
 EMPLOYMENT LAND REVIEW February 2009 EXECUTIVE SUMMARY This report provides a review of the Town of Oakville s employment land supply and recommends policy directions to be considered as part of the Town
EMPLOYMENT LAND NEEDS ASSESSMENT
 1 EMPLOYMENT LAND NEEDS ASSESSMENT HEMSON C o n s u l t i n g L t d. In Association with: June 22, 2018 i EXECUTIVE SUMMARY The influence of the western Greater Toronto Area and Hamilton (GTAH) economy
Introduction... 1 Study Area 1. Population and Demographics... 3 Historic Population Growth 3 Comparator Municipalities 6 Demographics 6
 Growth Study Table of Contents 1.0 2.0 3.0.0 5.0 6.0 7.0 8.0 9.0 Introduction... 1 1.1 Study Area 1 Population and Demographics... 3 2.1 2.2 2.3 Historic Population Growth 3 Comparator Municipalities 6
PLANNING 2005 SERVICE STRATEGY BUSINESS PLAN
 TABLE OF CONTENTS A. Background A.1 Preparing the Service Strategy Business Plan... 1 A.2 Key Contacts... 1 A.3 Additional Information... 1 B. Description of Current Services B.1 Program Location Map...
An Independent Study Commissioned by. Source: Geobase.ca, data acquired February, Survey of Municipal Soil By-laws
 An Independent Study Commissioned by Source: Geobase.ca, data acquired February, 4 2013 Survey of Municipal Soil By-laws March 2013 Survey of Municipal Soil By-laws March 2013 An Independent Study Commissioned
State of the City. Chamber of Commerce November 1, The city that makes a difference
 State of the City Chamber of Commerce November 1, 2007 Overview Snapshot of the city Council s first year: an update Key themes & opportunities for the future Snapshot of the city Population growth Household
May 24, 2016 CL , May 19, 2016 PDC , May 11, 2016 Report PDS
 Administration Office of the Regional Clerk 1815 Sir Isaac Brock Way, PO Box 1042, Thorold, ON L2V 4T7 Telephone: 905-685-4225 Toll-free: 1-800-263-7215 Fax: 905-687-4977 www.niagararegion.ca May 24, 2016
Undelineated Built-Up Areas
 Undelineated Built-Up Areas A gap that could undermine the Growth Plan Date: March 8, 2017 Travis Jonathan Allan Jonathan McGillivray DeMarco Allan LLP Policy gap analysis commissioned by the Neptis Foundation
CITY OF BRANTFORD GROWTH MANAGEMENT STRATEGY MHBC PLANNING
 CITY OF BRANTFORD GROWTH MANAGEMENT STRATEGY MHBC PLANNING April 18, 2006 TABLE OF CONTENTS Executive Summary...i Introduction...1 Part A The Identification of Land Needs...2 Factors Affecting Growth Trends
5 SUTTON/JACKSON'S POINT SECONDARY PLAN
 Report No. 3 of the Planning and Economic Development Committee Regional Council Meeting of March 24, 2011 5 SUTTON/JACKSON'S POINT SECONDARY PLAN The Planning and Economic Development Committee recommends:
Final Report. Town of Ajax. Economic Development + Tourism Strategy
 Final Report Town of Ajax Economic Development + Tourism Strategy May 2010 Contents Executive Summary 1 Introduction 16 1.1 Purpose of the Report 16 1.2 Approach 16 2 Economic Base Analysis 18 2.1 Location
DRAFT. Report C: Area Transportation System Problems and Opportunities. Highway 7&8 Transportation Corridor Planning and Class EA Study
 Ministry of Transportation Highway 7&8 Transportation Corridor Planning and Class EA Study Greater Stratford to New Hamburg Area MTO Group Work Project # 13-00-00 Report C: Area Transportation System Problems
EXECUTIVE SUMMARY 1. OVERVIEW OF TRANSPORTATION PROBLEMS AND OPPORTUNITIES
 EXECUTIVE SUMMARY 1. OVERVIEW OF TRANSPORTATION PROBLEMS AND OPPORTUNITIES The GTA West Corridor has been identified in the Growth Plan for the Greater Golden Horseshoe as a future transportation corridor,
Greater Golden Horseshoe Transportation Plan
 Greater Golden Horseshoe Transportation Plan Transportation Profile Executive Summary October 2017 PREPARED BY Urban Strategies Inc. and HDR for the Ministry of Transportation TRANSPORTATION PROFILE -
City of Burlington 2018 Provincial Pre-Budget Submission
 City of Burlington 2018 Provincial Pre-Budget Submission burlington.ca The City of Burlington s 2018 Pre-Budget Submission The City of Burlington is pleased to submit comments as part of the Province of
COUNTY OF WELLINGTON Official Plan
 COUNTY OF WELLINGTON Official Plan OFFICE CONSOLIDATION This is an office consolidation of the which was adopted by Wellington County Council on September 24, 1998, approved by the Ministry of Municipal
Metrolinx wishes to acknowledge the invaluable contribution of IBI Group to the preparation of this backgrounder.
 Modelling December 2008 1. Introduction This is one in a series of backgrounders that have been produced by Metrolinx to provide further explanation and clarification on the Regional Transportation Plan
Summary Assessment of Provincial Legislative Framework ONTARIO 1
 Summary Assessment of Provincial Legislative Framework ONTARIO 1 The strength of Ontario s legislative framework for protecting farmland is very strong. Most notably, as shown in Table 11, the framework
5-2 A Strong and Diverse Economy
 5-2 A Strong and Diverse Economy A STRONG AND DIVERSE ECONOMY 5.0 CONTENTS 5.1 EMPLOYMENT 5.1.1 General Policies 5.1.2 Protecting Employment Lands 5.1.3 Maintaining a Supply of Diverse Employment Lands
DISCUSSION PAPER, EMPLOYMENT LANDS OFFICIAL PLAN REVIEW, BRADFORD WEST GWILLIMBURY PREPARED FOR THE CORPORATION OF THE TOWN OF BRADFORD WEST
 DISCUSSION PAPER, EMPLOYMENT LANDS OFFICIAL PLAN REVIEW, BRADFORD WEST GWILLIMBURY PREPARED FOR THE CORPORATION OF THE TOWN OF BRADFORD WEST GWILLIMBURY October 14, 2016 This report has been prepared by
EXECUTIVE SUMMARY PLANNING THE NEXT GGH
 PLANNING THE NEXT GGH EXECUTIVE SUMMARY The economic landscape of the Greater Golden Horseshoe (GGH) is in the midst of a dramatic shift. A more balanced pattern of urban and suburban employment growth
4 Economic vitality. Chapter. In this chapter:
 Chapter 4 vitality In this chapter: 4.1 Supporting the York Region Strategy 4.2 City Building 4.3 Planning for Employment Lands 4.4 Planning for Retail 4.5 Financial Management The Regional Municipality
March 7, Background
 March 7, 2018 Protecting Water Ministry of Municipal Affairs and Housing Local Government and Planning Policy Division Provincial Planning Policy Branch 777 Bay Street, Floor 13 Toronto, ON M5G 2E5 RE:
POLICY PAPER. It s Cool to be Smart: How Ontario s Growth Plan can Reduce Greenhouse Gas Emissions. Graham Haines FIRST COAL, NOW TRANSPORTATION
 CBI It s Cool to be Smart: How Ontario s Growth Plan can Reduce Greenhouse Gas Emissions Graham Haines March 21, 2017 Introduced in the past decade, the Greenbelt and Growth Plan represent a pair of Ontario
Stimulating Businesses and Jobs in Urbanizing Communities
 Stimulating Businesses and Jobs in Urbanizing Communities Town of Innisfil Market Saturation Analysis Presented by: Jamie Cook, Watson & Associates Economists Ltd. November 2, 2017 Study Purpose To assess
Planning Department Community Services
 Welcome and Introduction Mayor Chris Friel Background and History Mayor Chris Friel Boundary Adjustment Background and Letter of Intent Discussion Greg Dworak General Manager Community Development Services
AMENDMENTS MADE APRIL 26, 2010 TO: OFFICIAL PLAN AMENDMENTS 19, 21,44, 43, 68, 69, 28 AMENDMENTS MADE JULY 6/10 OPA #71, 72, 56
 AMENDMENTS MADE APRIL 26, 2010 TO: OFFICIAL PLAN AMENDMENTS 19, 21,44, 43, 68, 69, 28 AMENDMENTS MADE JULY 6/10 OPA #71, 72, 56 AMENDMENTS MADE FEBRUARY 12/13 OPA # 7, # 73, #74, #76, #79, #82, COUNTY
6.1 Analysis of Existing Employment Land Supply Local Municipalities
 6. Land Supply 6.1 Analysis of Existing Employment Land Supply Local Municipalities This section discusses employment land supply in Halton with an emphasis on vacant land and future land supply. The discussion
BACKGROUND, ISSUES AND OPTIONS DISCUSSION
 Steering Committee BACKGROUND, ISSUES AND OPTIONS DISCUSSION COUNTY OF DUFFERIN OFFICIAL PLAN PROJECT NOVEMBER 26, 2013 Outline 1. Project Purpose and Impetus 2. Process and Schedule 3. What We ve Heard
DATE: February 13, 2018 REPORT NO. CD Chair and Members Committee of the Whole Operations and Administration
 DATE: February 13, 2018 REPORT NO. CD2018-033 TO: FROM: Chair and Members Committee of the Whole Operations and Administration Paul Moore, General Manager Community Development 1.0 TYPE OF REPORT CONSENT
3. Problem and Opportunity Statement
 3. Problem and Opportunity Statement 3.1 Study Area Halton Region is situated in the west-central portion of the Greater Golden Horseshoe (please refer to Figure 2) and covers 959 square kilometres (370
1. The Concept of More than Conformity
 February 9, 2016 Chair Emmerson and Members of Regional Council Regional Municipality of York 17250 Yonge Street Newmarket, Ontario L3Y 6Z1 Attention: Denis Kelly, Regional Clerk RE: York Region 2041 Preferred
TOWN OF CALEDON PRIORITIES
 TOWN OF CALEDON PRIORITIES CONTEXT The Town of Caledon is Home to 71,600 people as of July, 2017 1 Growing at a rate of about 2.36% per year Land area spans 688.15 km 2 Home to 2,917 businesses 96% of
Simcoe Area Transportation Network Needs Assessment. Executive Summary
 Simcoe Area Transportation Network Needs Assessment Executive Summary June 2002 Simcoe Area Transportation Network Assessment PREFACE A safe, efficient and integrated transportation system supports economic
TOWN OF MILTON. Transit Master Plan MOVING MILTON FORWARD
 TOWN OF MILTON Transit Master Plan 2013-2017 MOVING MILTON FORWARD Appendix B - Strategic Plan Working Paper February 2013 Town of Milton Moving Milton Forward Transit Master Plan Strategic Plan Working
HEMSON C o n s u l t i n g L t d. 30 St. Patrick St., Suite 1000 Toronto, Ontario M5T 3A3 POPULATION AND GROWTH PROJECTIONS
 POPULATION AND GROWTH PROJECTIONS United Counties of Stormont, Dundas and Glengarry HEMSON C o n s u l t i n g L t d. 30 St. Patrick St., Suite 1000 Toronto, Ontario M5T 3A3 January 2013 TABLE OF CONTENTS
FOR DISCUSSION PURPOSES ONLY. Employment Lands Needs
 APPENDIX 1 PD-004-16 DRAFT FOR DISCUSSION PURPOSES ONLY TOWN OF MILTON Employment Lands Needs ASSESSMENT PHASE 1 REPORT File No. 11165B Date: January 2016 Prepared by: MacNaughton Hermsen Britton Clarkson
SUBJECT: Draft New Official Plan: Public Consultation and Engagement Summary
 Page 1 of Report PB-47-17 SUBJECT: Draft New Official Plan: Public Consultation and Engagement Summary TO: FROM: Planning and Development Committee Planning and Building Department Report Number: PB-47-17
Provincial Policy Statement 2014 Training Aid
 This job aid has been developed for education and training purposes as a high-level summary of the policy changes in the PPS 2014. It should not be relied upon as a substitute for specialized legal or
That Capital Region Board APPROVE the Town of Beaumont Municipal Development Plan.
 Statutory Plan Evaluation Report Ville De/Town of Beaumont Municipal Development Plan Board Reference: REF #2017 011 Municipal Bylaw: 887 17 Introduction The Province has adopted the Regional Evaluation
Jeffrey Humble, Director, Planning and Development Services. Official Plan Review Update and Waiving Certain Aspects of the Purchasing Policy
 To: From: Members of the General Committee Jeffrey Humble, Director, Planning and Development Services Meeting Date: February 26, 2018 Subject: Report PLPD18-005 Official Plan Review Update and Waiving
Towards the Next Regional Transportation Plan. Freight Day University of Toronto Peter Paz, Manager of Regional Partnerships
 Towards the Next Regional Transportation Plan Freight Day University of Toronto Peter Paz, Manager of Regional Partnerships 2 Addressing the GTHA s transportation challenges WHO IS METROLINX Metrolinx
Getting Municipalities to Work, or Getting Work to Municipalities: Protection and Conversion of Employment Lands
 Getting Municipalities to Work, or Getting Work to Municipalities: Protection and Conversion of Employment Lands Barnet Kussner Partner WeirFoulds LLP bkussner@weirfoulds.com Introduction Over the course
PLANNING FOR CHILDCARE IN THE GATEWAY DISTRICT NODE: CITY OF MISSISSAUGA
 APPENDIX F APPENDIX G APPENDIX H PROPOSED DRAFT AMENDMENT NO. TO THE OFFICIAL PLAN OF THE REGIONAL MUNICIPALITY OF PEEL 1.0 Statutory Provisions This Amendment No. to the Official Plan for
Recommendation: Oppose the Ministry of Transportation s preferred alternative for
 Page 1 of Report TO: Community Services Committee Community Services SUBJECT: Niagara to GTA (N-GTA) Corridor EA: Area Transportation System Alternatives Report Update Report Number: Report Date: June
REGIONAL PLANNING PROCESS
 Filed: 0-0- Tx 0-0 Rates Tab Schedule Page of REGIONAL PLANNING PROCESS.0 INTRODUCTION On October, 0, the Ontario Energy Board (the Board ) issued its Report of the Board A Renewed Regulatory Framework
City of Hamilton Bayfront Industrial Area
 City of Hamilton Bayfront Industrial Area A Strategy for Renewal Sheila Botting FCMC, FRICS, AACI (Hon) Partner & Canadian Real Estate Leader Antony Lorius CMC, RPP Vice President Deloitte Real Estate
Township of Schreiber Needs/Gap Analysis. Needs/Gap Analysis. Prepared by: With special thanks to our funding partner:
 Needs/Gap Analysis Prepared by: With special thanks to our funding partner: December 2011 Needs/Gap Analysis for the Township of Schreiber Prepared by: McSweeney & Associates 201-900 Greenbank Road Ottawa,
Flamborough Quarry Haul Route Draft Transportation Report. Exhibit 3-9: Existing Transit Routes. October itrans Project # 4313
 Exhibit 3-9: Existing Transit Routes October 2008 36 Table 3-1: Transit Route Schedule Transit System Route Number and Name Frequency During Peak Periods Hamilton Street Railway GO Transit GO Transit GO
407 TRANSITWAY - KENNEDY ROAD TO BROCK ROAD MINISTRY OF TRANSPORTATION - CENTRAL REGION
 Executive Summary 407 TRANSITWAY - KENNEDY ROAD TO BROCK ROAD MINISTRY OF TRANSPORTATION - CENTRAL REGION E. EXECUTIVE SUMMARY E.1. E.1.1. Background 407 Transitway Background and Status The planned 407
4. IDENTIFICATION OF SPECIFIC TRANSPORTATION PROBLEMS WITHIN THE STUDY AREA
 4. IDENTIFICATION OF SPECIFIC TRANSPORTATION PROBLEMS WITHIN THE STUDY AREA 4.1 Introduction The primary function of the inter-regional transportation system is to facilitate the movement of people and
REGIONAL PLANNING AND POLICY FRAMEWORK A Preferred Approach for our Regional Growth
 REGIONAL PLANNING AND POLICY FRAMEWORK A Preferred Approach for our Regional Growth The Regional Comprehensive Plan (RCP) establishes a new approach to planning in the San Diego region. This approach is
A presentation by Frances Frisken Sponsored by The Institute on Metropolitan Finance and Governance with The Neptis Foundation The GTA Forum
 A presentation by Frances Frisken Sponsored by The Institute on Metropolitan Finance and Governance with The Neptis Foundation The GTA Forum Vivian and David Campbell Conference Facility, Munk Centre for
RPP SEPTEMBER 27, 2017 SEPTEMBER
 APPENDIX VI MAYFIELD WEST PHASE 2 STAGE 2 PLANNING JUSTIFICATION REPORT Prepared by Nick McDonald, RPP SEPTEMBER 27, 2017 SEPTEMBER TABLE OF CONTENTS 1.0 OVERVIEW... 3 1.1 PURPOSE OF REPORT... 3 1.2 PLANNING
Moving into the Future Workshop
 Moving into the Future Workshop Importance of Multi-modal Transportation Planning on Ontario s Economy May 9, 2014 1 Municipal Network -Initiatives City of Hamilton Chris Murray, City Manager Region of
Town of Mono Delegation Council Session # Headwaters Food & Farming Alliance Headwaters Food Charter & Action Plan
 Town of Mono Delegation Council Session #5-2017 Headwaters Food & Farming Alliance Headwaters Food Charter & Action Plan Outline Who is HFFA? Why a Food Charter & Action Plan? Process for development Stakeholder
Grand Niagara Secondary Plan
 Source: Google Maps Prepared for: Prepared by: April 28, 2016 Contents 1.0 Introduction and Purpose... 1 2.0 Site Location and Description... 2 2.1 Subject Lands... 2 2.3 Surrounding Area... 4 3.0 Secondary
SCHEDULE A REGION OF PEEL
 SCHEDULE A REGION OF PEEL REGION OF PEEL OFFICIAL PLAN AMENDMENT NUMBER - AMENDMENT TO ESTABLISH THE SOUTH ALBION-BOLTON EMPLOYMENT LANDS AND NORTH HILL SUPERMARKET SETTLEMENT SITE BOUNDARY EXPANSION -1-
Section 9 Implementation
 Section 9 Implementation 9 Section 9: Implementation 9.1 Overview The primary role of Your Bright Future is to provide a community sustainability based framework to direct the future growth and development
PROVINCIAL POLICY STATEMENT COMPARISON
 PROVINCIAL POLICY STATEMENT 2005-2014 COMPARISON TRACKED CHANGES VERSION This document compares Provincial Policy Statement, 2005 and Provincial Policy Statement, 2014. Additions are shown in grey highlighting
SUBJECT: Burlington s Mobility Hubs: Work Plan for Area Specific Planning. Committee of the Whole. Planning and Building Department.
 Page 1 of Report PB-48-16 SUBJECT: Burlington s Mobility Hubs: Work Plan for Area Specific Planning TO: FROM: Committee of the Whole Planning and Building Department Report Number: PB-48-16 Wards Affected:
Report No. 6 of the Planning and Economic Development Committee Regional Council Meeting of June 23, 2005
 8 ASSIMILATIVE CAPACITY STUDY: LAKE SIMCOE AND NOTTAWASAGA RIVER WATERSHED (ACS) PHASE 1 OF THE INTERGOVERNMENTAL ACTION PLAN FOR SIMCOE, BARRIE AND ORILLIA (IGAP) The Planning and Economic Development
Niagara Region Transportation Master Plan Niagara-Hamilton Trade Corridor Technical Paper
 Niagara-Hamilton Trade Corridor Technical Paper 1. Purpose In the report to Council on the Regional Council Strategic Priorities Implementation Plan, pursuing Provincial commitment for the Niagara to Greater
PEEL REGION Bolton Residential Expansion Regional Official Plan Amendment DISCUSSION PAPER
 Bolton Residential Expansion Regional Official Plan Amendment DISCUSSION PAPER The Planning Partnership April 15, 2016 TABLE OF CONTENTS 1.0 Introduction... 2 1.1 Summary of the Application 2 1.2 Purpose
SUSTAINABLE COMMUNITIES STRATEGY
 SUSTAINABLE COMMUNITIES STRATEGY Introduction With each RTP update cycle, BCAG prepares a Sustainable Communities Strategy (SCS) as required under Senate Bill 375 (SB 375). The SCS demonstrates the integration
GTA West Corridor Environmental Assessment. Executive Summary - November Transportation Development Strategy Report
 GTA West Corridor Environmental Assessment Transportation Development Strategy Report Executive Summary - November 2012 GTA West Corridor Environmental Assessment Executive Summary 1 Table of Contents
RER New Stations Initial Business Case BRESLAU STATION. Kitchener Corridor. July Draft
 RER New Stations Initial Business Case BRESLAU STATION Kitchener Corridor July 2016 Draft Draft: v1.2 Metrolinx RER New Stations Initial Business Case BRESLAU Draft Prepared by: IBI Group 55 St. Clair
1 RICHMOND HILL CENTRE / LANGSTAFF URBAN GROWTH CENTRE - TRANSPORTATION STUDY
 Report No. 4 of the Transportation Services Committee Regional Council Meeting of April 22, 2010 1 RICHMOND HILL CENTRE / LANGSTAFF URBAN GROWTH CENTRE - TRANSPORTATION STUDY The Transportation Services
Planning and Growth Management Committee. Chief Planner and Executive Director, City Planning Division
 STAFF REPORT ACTION REQUIRED 2205 Sheppard Avenue East Official Plan Amendment and Zoning By-law Amendment Application Refusal Report Date: August 14, 2007 To: From: Wards: Reference Number: Planning and
Transportation Master Plan Introduction
 1. Introduction Building a Liveable Ottawa 2031 has set out a process to guide the completion of a fiveyear update of the City s Official Plan, Transportation Master Plan, Infrastructure Master Plan, Cycling
THE REGIONAL MUNICIPALITY OF PEEL GROWTH MANAGEMENT COMMITTEE
 THE REGIONAL MUNICIPALITY OF PEEL GROWTH MANAGEMENT COMMITTEE AGENDA GMC - 3/2016 DATE: Thursday, June 16, 2016 TIME: LOCATION: 9:00 AM 10:30 AM Regional Council Chamber, 5th Floor Regional Administrative
REPORT. Mayor Bonnette and Members of Council. Curtis Marshall, Sr. Planner - Policy
 REPORT REPORT TO: REPORT FROM: Mayor Bonnette and Members of Council Curtis Marshall, Sr. Planner - Policy DATE: January 2, 2015 REPORT NO.: RE: PDS-2015-0003 Premier Gateway Phase 1B Employment Area Integrated