Eastern Shore of Virginia Groundwater Resource Protection and Preservation Plan
|
|
|
- Sophie Morgan
- 6 years ago
- Views:
Transcription

1 Eastern Shore of Virginia Groundwater Resource Protection and Preservation Plan By Accomack-Northampton Planning District Commission and the Eastern Shore of Virginia Groundwater Committee December 2013
2 Table of Contents Page 1.0 Introduction Resource Constraints Eastern Shore Dependence on Groundwater as a Resource DEQ Groundwater Management Plan EPA Sole Source Aquifer Groundwater Committee Formation and Mandate Sustainable Approach Report Format Water Resources Surface Water Freshwater Streams and Creeks Freshwater Impoundments Groundwater General Hydrostratigraphy Columbia Aquifer Upper Yorktown Confining Unit Yorktown Paleochannels Upper Yorktown Aquifer Middle Yorktown Confining Unit Middle Yorktown Aquifer Lower Yorktown Confining Unit Lower Yorktown Aquifer Saint Marys Confining Unit Deeper Hydrostratigraphic Layers Chesapeake Bay Impack Crater Recharge Hydraulic Characteristics Colubia Aquifer Upper Yorktown Aquifer Middle Yorktown Aquifer Page TOC -i
3 Table of Contents Page Columbia Aquifer Deeper Aquifers Local and Regional Hydrostratigraphic Features Water Quality Land and Water Resource Use Land Use Historic Land Use Current Land Use Future Land Use Trends Water Use Historic Water Use Current Water Use Water Use by Source Water Use by Source Groundwater Surface Water Use by County Future Water Use Trends Groundwater Surface Water Resource Vulnerability Saltwater Intrusion Water Level Declines Water Resource Sustainability Plan Institutional Mechanisms Federal State Counties Comprehensive Plan Ordinances Page TOC -ii
4 Table of Contents 5.2 Eastern Shore Research Needs Paleochannels Freshwater-Saltwater Transition Aquifer and Confining Unit Hydraulic Characteristics Deep Aquifers Existing Contaminants Agricultural Nutrients (Nitrogen) On-Site Systems Emerging Contaminants Climate Change Monitoring Water Use Groundwater Levels Water Quality Alternate Source Development Columbia (Water Table) Aquifer Brackish Water / Saltwater Treatment (membrane and ultrafiltration) Reuse Enhanced Recharge and Aquifer Storage and Recovery Figures Figure Extent of Sole Source Aquifer Figure Surface Water Impoundments Figure Cross-Section of Eastern Shore Hydrostratigraphic Units Figure Generalized Schematic Diagram of Aquifer, Confining Units, and Generalized Flow Lines of the Virginia Eastern Shore Groundwater System Figure Top Elevation (a) and Thickness (b) of the Upper Yorktown Confining Unit Figure Top Elevation (a) and Thickness (b) of the Yorktown-Paleochannels Figure Top Elevation (a) and Thickness (b) of the Upper Yorktown Aquifer Figure Top Elevation (a) and Thickness (b) of the Middle Yorktown Confining Unit Figure Top Elevation (a) and Thickness (b) of the Middle Yorktown Aquifer Unit Figure Top Elevation (a) and Thickness (b) of the Lower Yorktown Confining Unit Figure Top Elevation (a) and Thickness (b) of the Lower Yorktown Aquifer Figure Top Elevation of the St Marys Confining Unit Page TOC -iii
5 Table of Contents Figure Precipitation Normals for the Eastern Shore of Virginia Figure Recharge Rates on the Eastern Shore Figure Recharge Areas of the Eastern Shore Figure Groundwater Choices Figure Groundwater Bicarbonate Alkalinity Figure Groundwater ph Figure Groundwater Sulfate Figure Groundwater Iron Figure Groundwater Nitrate Figure Land Use in Accomack County Figure Land Use in Northampton County Figure Future Land Use in Accomack County District Figure Future Land Use in Accomack County Districts 2 and Figure Future Land Use in Accomack County Districts 4 and Figure Future Land Use in Accomack County Districts 6 and Figure Future Land Use in Accomack County Districts 8 and Figure Future Land Use in Northampton County Figure Historical Water Use on the Eastern Shore Figure Recent Water Use on the Eastern Shore by Source and End Use Figure Recent Water Use by County Figure Recent Water Use in Accomack County by Source and End Use Figure Recent Water Use in Northampton county by Source and End Use Figure Recent and Projected Withdrawals Figure Trends in Groundwater Use Figure Model Predicted Saltwater Intrusion from Hypothetical 1-MGD Withdrawal Figure Example of Upcoming Figure Saltwater Intrusion in the Town of Caper Charles Production Wells Figure Measured Groundwater Levels - Assawoman Figure Measured Groundwater Levels NW of Melfa Figure Measured Groundwater Levels E of Greenbush Figure Model Predicted Drawdown for All Permitted Withdrawals Tables Table Summary Groundwater Quality on the Eastern Shore of Virginia Table Recent Water Use on the Eastern Shore by Source and End Use Page TOC -iv
6 SECTION 1 INTRODUCTION 1.0 INTRODUCTION The original Groundwater Supply Protection and Management Plan for the Eastern Shore of Virginia was adopted by the Groundwater Committee on May 5, The plan included the following components: A. Identification of the water resources on the Shore focusing on: a. Fresh water aquifers; b. The recharge spine for the Yorktown-Eastover aquifer; and c. Water budget and water balance for the Yorktown-Eastover aquifer B. Identification of contaminant threats with an emphasis on land use activities; C. Plan to monitor groundwater use D. Identification of measures to manage existing and future land use E. Delineation of Groundwater Protection Areas Specific recommendations from the 1992 Plan were: Manage Wellhead Protection and Recharge Areas Restrict Mass Drainfields in Recharge Areas Implement Chesapeake Bay Program Private Well Ordinance Review Zoning, Subdivision Regulations, and Site Plans to address groundwater quality and quantity Registration of ALL USTs Monitor Groundwater Withdrawals Develop Land Use/Water Quality Database Promote Research and Education (Indicates partially or fully complete) (Indicates incomplete) A comprehensive review of Plan implementation was completed by the Groundwater Committee in 2008 and found that of the nine recommendations, three were not completed and, based on current conditions, did not require further action: 1) Restrict mass drainfields in recharge areas: The Virginia Department of Health (VDH) were found to provide adequate protection to the groundwater resource and additional restrictions were unnecessary. Additionally, advancements in on-site treatment technology improves treatment of the wastewater, further reducing the need to restrict this technology in the recharge areas. 2) Private well ordinance: The VDH regulates private wells. Private well ordinances for other communities within the Commonwealth were generally enacted before VDH adopted the private well regulations. These ordinances were found to be largely duplicative of the VDH regulations. With the statutory restrictions on local community implementation of private well ordinances and Page 1.0-1
7 1.0 Introduction VDH regulations already in place, the need to additional private well ordinance was not deemed necessary. 3) Registration of all USTs: This recommendation preceded significant changes in the VDEQ UST regulations that greatly increased both construction and monitoring requirements. The new UST regulations were fund to provide adequate protection of the groundwater resource. Page 1.0-2
8 SECTION 1 INTRODUCTION 1.1 RESOURCE CONSTRAINTS Eastern Shore Dependence on Groundwater as a Resource The Eastern Shore of Virginia depends entirely on ground water for potable water supplies, as well as most non-potable supplies such as irrigation water. Because the peninsula is surrounded by large bodies of saltwater, ground water becomes brackish at relatively shallow depths (< 350 feet) in most areas, and the total available ground water supply is more limited than on the mainland. Threats to ground water on the Eastern Shore may be placed into three general categories: (1) saltwater intrusion; (2) hydraulic head depression; and (3) contamination from surface sources. Intrusion of saltwater into fresh ground water aquifers can be caused by wells that are screened too close to the freshwatersaltwater interface, are too close to the shore, and/or pump at an excessive rate. Depression of the hydraulic head occurs around every pumping well, but if pumping rates are too high or if wells are too close to each other, water levels in some wells can drop so low that well yields are reduced. In extreme cases, the head can fall so low that the aquifer is partially dewatered, which in turn can cause consolidation and a permanent loss of transmissivity (which will also reduce well yield) DEQ Groundwater Management Area Effective November 1, 1976, the Eastern Shore of Virginia was declared a Critical Ground Water Area, (9VAC Repealed) subject to regulation under the Ground Water Management act. On June 17, 2013, the State Water Control Board adopted amendments (9VAC ) that included the Eastern Shore in the Eastern Virginia Groundwater Management Area. This action consolidates all localities in the Coastal Plain of Virginia under one Groundwater Management Area. The declaration of the Eastern Shore as part of the Groundwater Management Area is based on the following findings: Groundwater level declines have been observed in two sections of Accomack County; Interference between wells has been observed in the same two sections of Accomack County; Some evidence of localized groundwater contamination has been observed in the water table aquifer in Accomack County but not in the confined aquifers; Even though groundwater supplies in Accomack County are not overdrawn and are not expected to be in the near future, it should be recognized that they may overdraw in some areas in the future if water withdrawals are not distributed throughout the region. Further, saltwater intrusion has not been observed to date but may occur in the future if heavy groundwater withdrawals are concentrated in any one area. This designation allows the Virginia Department of Environmental Quality to regulate through permits groundwater withdrawals that equal or exceed 300,000 gallons in a single month in order to conserve, protect and beneficially utilize the groundwater resource and to ensure the public welfare, safety and health. The Groundwater Withdrawal Regulations ( Page 1.1-1
9 1.1 Resource Constraints 9VAC25-610) include minimum requirements for applications for a Groundwater Withdrawal Permit that include: 1) documentation of the beneficial use and an evaluation of the lowest quality of water needed; 2) water demand; 3) a Water Conservation and Management Plan; 4) Potential impact to the groundwater resource; and 5) a Mitigation Plan (if the potential impacts extend beyond the applicants property boundary). Minimum reporting requirements for Permitted groundwater withdrawals is monthly water use. Additional requirements that include water quality testing is common for permits on the Shore EPA Sole Source Aquifer The Eastern Shore of Virginia is one of six areas designated as a Sole Source Aquifer within the Mid-Atlantic (Region 3) area. The US Environmental Protection Agency (USEPA) designated the Columbia Yorktown-Eastover Multiaqufier System a sole source aquifer, effective May 9, Information on the designation is provided on the USEPA Region 3 website at columbiayorktown.htm. The Sole Source Aquifer (SSA) Program, which is authorized by Section 1424(e) of the Safe Drinking Water Act, allows communities to petition the USEPA for protection when a community is dependent on a single source of drinking water and there is no possibility of a replacement water supply to be found. USEPA regional offices review the petitions and, if merited, the Regional Administrator will designate an area as a Sole Source Aquifer. The SSA program provides federal overview of federally-funded projects within the designated area. Projects and land uses which are not federally-funded are not subject to federal overview. Useful Definitions: USEPA Sole Source Aquifer (SSA): an aquifer that is the principle or exclusive source or drinking water, supplying at least 50% of the drinking water consumed in the area overlying the aquifer. USEPA guidelines also stipulate that these areas can have no alternative drinking water source(s) which would physically, legally, and economically supply all those who depend upon the aquifer for drinking water. Usage data and other technical and administrative information are required for assessing designation criteria. In general, the designation decision process takes a minimum of 6 months from the time that the petitioner submits a completed petition to USEPA. SSA designations increase the public's awareness on the nature and value of local ground water resources by demonstrating the link between an aquifer and a community's drinking water supply. Often the realization that an area's drinking water originates from a vulnerable Page 1.1-2
10 1.1 Resource Constraints underground supply can lead to an increased willingness to protect it. The public also has an opportunity to participate in the SSA designation process by providing written comments to USEPA or by participating in an USEPA sponsored public hearing prior to the designation decision. Although designation aquifers have been determined to be the "sole or principal" source of drinking water for an area, this does not imply that they are more or less valuable or vulnerable to contamination than other aquifers which have not been designated by USEPA. Many valuable and sensitive aquifers have not been designated simply because nobody has petitioned USEPA for such status or because they did not qualify for designation due to drinking water consumption patterns over the entire aquifer area. Furthermore, ground water value and vulnerability can vary considerably both between and within designated aquifers. Basis for the USEPA decision is: 1. The Columbia and Yorktown-Eastover aquifers are high-yielding aquifers which the service area population relies on for more than 50% of its drinking water needs. 2. There exists no viable economical alternative drinking water source or combination of sources to supply the designated service area. 3. The USEPA has found that the Bi-County Ad Hoc Citizens Committee on Oversight has appropriately delineated the boundaries of the aquifer project review area. 4. While the quality of the Columbia and Yorktown-Eastover aquifer's ground water is considered to be good, it is highly vulnerable to contamination due to its geological characteristics and possible landuse activities. The designated area is a multiaquifer system with a surficial aquifer (Columbia aquifer) consisting of shallow sand and gravel deposits and a deeper confined aquifer (Yorktown- Eastover aquifer) which is recharged by water from the surficial aquifer. The shallow nature of the surficial aquifer allows contaminants to be rapidly introduced into the ground water with minimal assimilation. It is this high vulnerability to contamination, especially on the central "spine" of the peninsula, coupled with the aquifer's value as the principal source of drinking water for the residents served, that could pose a significant public health hazard. 5. Definable Aquifer Boundaries: USEPA guidance allows designations to be made for entire aquifers, hydrologically connected aquifers (aquifer systems), or part of an aquifer if that portion is hydrologically separated from the rest of the aquifer. The Yorktown-Eastover Multiaquifer System boundary is based on hydrological principles and USEPA's interpretation of available data Groundwater Committee Formation and Mandate The Eastern Shore of Virginia Groundwater Committee was formed as a bi-county committee in 1990 by Accomack County and Northampton County. The committee includes elected officials, citizens, and local government staff. Mandate: Assist local governments and residents in understanding, protecting, and managing ground water resources Prepare a ground water resources protection and management plan Page 1.1-3
11 1.1 Resource Constraints Serve as an educational and informational resource Initiate special studies concerning the protection and management of the Eastern Shore ground water resource Coordinate and communicate among parties responsible for ground water protection, management, and research Page 1.1-4

12 1.1 Resource Constraints Figure 1.1-1: Extent of Sole Source Aquifer Page 1.1-5

13 SECTION 1 INTRODUCTION 1.2 SUSTAINABLE APPROACH Sustainability is the capacity to endure. A more formal definition of sustainability, in the context of the present Groundwater Management Plan, is the systematic approach to using and managing the groundwater resource: that meets the needs of the present without compromising the ability of future generations to meet their own needs (United Nation's World Commission on Environment and Development, 1987) subject to the following conditions: 1. Renewable resources such as fish, soil, and groundwater must be used no faster than the rate at which they regenerate. 2. Pollution and wastes must be emitted no faster than natural systems can absorb them, recycle them, or render them harmless. (Herman E. Daly, 1971) Page 1.2-1
14 SECTION 1 INTRODUCTION 1.3 REPORT FORMAT The Groundwater Management Plan (Plan) incorporates a modular design to facilitate frequent updates. As such, the Plan will remain current through routine or periodic modification of specific report sections. The Plan, to the extent possible, references outside sources of information, such as County Comprehensive Plans, such that when the Comprehensive Plans are modified minimal changes to the Plan is required. The Plan directly links to frequently updated information, such as permitted groundwater withdrawals, water use, groundwater level trends, and research activities to maintain current information on Water Resources on the Shore. Page 1.3-1
15 SECTION 2 WATER RESOURCES 2.0 WATER RESOURCES This section of the Groundwater Management Plan describes the freshwater and groundwater resources of the Eastern Shore of Virginia. Page 2.0-1
16 SECTION 2 WATER RESOURCES 2.1 SURFACE WATER Surface features characteristic of the Coastal Plain of the Eastern Shore include terraces, stream channels, drowned valleys, Carolina bays, swamps and marshes, remnant dunes, and bar-like features formed during the Pleistocene time. The central portion of the Eastern Shore peninsula forms a broad, low ridge which trends northeast-southwest and stands at an elevation ranging from about +25 to +50 ft msl. This central highland area is the principal fresh ground water recharge area for the peninsula and is referred to as the recharge spine of the Eastern Shore (Error! Reference source not found.). The terrace has maintained the same strand line for almost the entire length of the Atlantic Coastal Plain and is divided into a lower and upper terrace which directs the drainage of the Eastern Shore. The lower terrace, generally located west of Route 13, consists of broad flats broken by large meandering tidal creeks and bordered by tidal marshes. The topography of the upper terrace, more complex than the lower terrace, is characterized by shallow sand-rimmed depressions known as Carolina bays. The bays, predominantly oval in shape, exert an influence on the infiltration, retardation of runoff, and movement of ground water. Between the mainland and the barrier islands are extensive tidal marshes flooded regularly by saltwater and drained by an extensive system of creeks 1. These systems accept ground water discharge Freshwater Streams and Creeks The Eastern Shore is drained by a total thirty small creeks flowing bayward or seaward from the drainage divide which passes the length of the peninsula. The lower reaches of the creeks form tidal estuaries fed by narrow, meandering branches. Because of the low topography and low inflow of freshwater, the creeks are brackish to saline everywhere except for the upper reaches. The estuaries are more pronounced on the Chesapeake Bay side and receive more of the surface and ground water drainage than the smaller creeks on the ocean side. Numerous drainage basins exist on the shore ranging in size from approximately four to six square miles. These basins consist of several small creeks and interconnected ditches. Primary drainage basins of the Eastern Shore of Virginia are Gargathy Creek, Folloy Creek, Finney Creek, Occohannock Creek, and Pungoteague Creek basins in Accomack County; and Mattawoman Creek and Nassawadox Creek basins in Northampton County. The Pocomoke River basin borders Worcester County, Maryland and Accomack County, Virginia and serves as a major drainage divide for this area Fresh Water Impoundments An important source of water for agricultural and other irrigation supply is from dug farm ponds and, to a much lesser extent impounded creeks and streams (Figure 2.1-1). Most of the impounded creeks and streams are historical, many created before 1980 and most of the dug ponds post-date Source of water in these impoundments is a combination of storm water and groundwater recharge from the Columbia Page 2.1-1

17 2.1 Surface Water aquifer. While the contribution from storm water and groundwater varies widely between impoundments, from a water balance, availability of water from storm water and the Columbia aquifer is far greater than the underlying confined Yorktown-Eastover aquifer. As a consequence, use of these impoundments as a source of water in preference to the Yorktown-Eastover aquifer is far more sustainable. Figure 1.1-1: Surface Water Impoundments Miles Data Source: Virginia Water Use Database System (VWUDS) updated August 2013 Page 2.1-2
18 2.1 Surface Water References 1. Hulme, A. E., The Water Resources of Somerset, Wicomico, and Worcester Counties. Maryland Department of Geology, Mines, and Water Resources: Bulletin 16 Page 2.1-3
19 SECTION 2 WATER RESOURCES 2.2 GROUNDWATER This section provides a description of the groundwater resource system on the Eastern Shore of Virginia General Hydrostratigraphy There have been a substantial number of local and regional studies on the geologic and hydrologic characteristics of the sediments on the Eastern Shore of Virginia and adjacent areas of Maryland. Many of these studies have dealt principally with geologic descriptions of the formational units. The geology of the Eastern Shore consists of unconsolidated deposits of interbedded clay, silt, sand, and gravel, with variable amounts of shell material. These deposits thicken and slope eastward, and form a system of layered aquifers and confining units. The total sediment thickness ranges from approximately 2,000 feet in the western areas to as much as 7,000 feet to the east 1. These sediments generally overlie a bedrock basement that also dips northeastward. The hydrostratigraphic layers of the Eastern Shore are divided into the unconfined Columbia aquifer (water table aquifer), and a series of confined aquifers and intervening semi-confining units (Figure 2.2-1). The low permeability confining units restrict downward groundwater movement. The confined aquifers, in order of increasing depth, are: Yorktown-Eastover (includes upper, middle, and lower Yorktown aquifers), St. Marys- Choptank aquifer, Brightseat aquifer, and upper, middle, and lower Potomac aquifers. Fresh groundwater generally occurs only in the upper 300 feet of sediments and at shallower depths along the coastlines of the Eastern Shore and is limited to the Columbia and Yorktown aquifers where the freshwater forms a Useful Definitions: Hydrostratigraphy: the structure and layering of underground porous materials (gravels, sands, silts, clays, rocks, and other natural materials including shells) in reference to the flow of groundwater. Permeability: the property of a hydrostratigraphic layer which measures the ability of the layer to conduct water and other fluids. Aquifer: an underground layer of waterbearing porous materials (often comprised largely of gravels, sands, and/or shells) which conducts water and from which groundwater can be readily extracted using a well. Confining Unit: an underground layer of fine grained material (often comprised largely of silts and/or clays) which restricts the flow of water between aquifers Water Table Aquifer: the uppermost aquifer which contains groundwater at atmospheric pressure. Confined Aquifer: an aquifer where the groundwater is pressurized due to the presence of a confining unit above. perched lens above the deeper salt-water (Figure 2.2-2). These aquifers have been designated by the EPA as the sole source aquifers for the Eastern Shore, excluding Tangier and Chincoteague Islands. The water supply of Tangier Island consists of groundwater wells screened in the Potomac aquifer since the interface between freshwater from the mainland and saltwater occurs to the east of Tangier Island but west of the Eastern Shore. Page 2.2-1


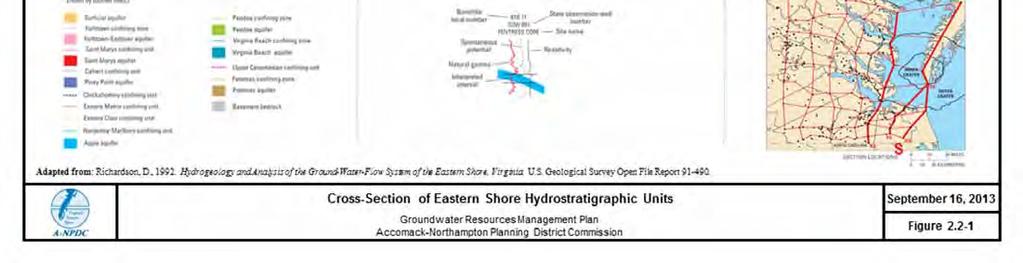
20 Figure 2.2-1: Cross-Section of Eastern Shore Hydrostratigraphic Units Page 2.2-2

21 2.2 Groundwater Figure 2.2-2: Generalized Schematic Diagram of Aquifer, Confining Units, and Generalized Flow Lines of the Virginia Eastern Shore Groundwater System West East Source: Richardson, Page 2.2-3
22 2.2 Groundwater Columbia Aquifer The Columbia aquifer is the uppermost aquifer and is unconfined over most of the area. Sediments comprising this aquifer unconformably overlie the Yorktown aquifers, and are in turn, unconformably overlain by Holocene sediments. The properties of the Columbia aquifer are primarily dependent on the lithology and thickness of the water-producing sands, gravels and shell materials. Thickness of the Columbia aquifer and depth to water vary with topography and the water table is generally subparallel to the land surface. Figure 2.2-3: Thickness of the (surficial) Columbia Aquifer The Columbia Aquifer is present throughout the Eastern Shore of Virginia. Beneath most of the Eastern Shore of Virginia, thickness of the Columbia aquifer generally ranges from 20 feet near the coast to 60 feet inland (Figure 2.2-3). Thickness near the central corridor of the Eastern Shore can exceed 100 feet in some areas, and depth to groundwater is typically within 10 feet of the surface. To the northwest, the Columbia aquifer generally does not exceed 20 feet in thickness, and to the south and east, the aquifer thickness typically ranges from 40 to 140 feet. The Columbia aquifer on the Eastern Shore subcrops into the Chesapeake Bay to the west and Atlantic Ocean to the east. Where it subcrops, freshwater discharges directly from the aquifer into the estuarine and ocean water, respectively. Source: Sanford, et al, Page 2.2-4
23 2.2 Groundwater Upper Yorktown Confining Unit The upper Yorktown confining unit consists predominately of marine fine sandy silt with some clay and averages 15 to 30 ft thick (Figure 2.2-4). These sediments are for the most part reworked sediments from the upper Yorktown Formation and may locally contain fluvial silts and clays. The upper Yorktown confining unit typically consists of a sequence of lenticular interbedded silts, clays, and fine sands and is not massive. In some locations, sandy channel deposits have breached the confining unit and cut into the underlying upper Yorktown aquifer, forming what are known as paleochannels. There are two known paleochannels on the Eastern Shore of Virginia located near Exmore and Eastville. While this unit is aerially extensive, and only locally absent, it serves to restrict vertical movement of groundwater and not effectively preclude it, as evidenced by the fact that the principal source of freshwater recharge and discharge for the Yorktown aquifers on the Eastern Shore is through the confining units. Recharge is discussed in the section below. Figure 2.2-4: Top elevation (a) and thickness (b) of the Upper Yorktown Confining Unit Source: Sandford, et al, Page 2.2-5


24 2.2 Groundwater Yorktown Paleochannels In some locations, sandy channel deposits have breached the Yorktown confining unit and cut into the underlying upper Yorktown aquifer, forming what are known as paleochannels. Two major channels are present onshore the Exmore channel to the north and the Eastville channel to the south. Although the Cape Charles channel is present in the area, the majority of it lies just offshore at the southern end of the peninsula and is not expected to have an significant influence on groundwater. The Exmore channel is estimated to be more than 160 ft deep, and the Eastville channel is more than 120 ft deep. Their thicknesses in the central Eastern Shore are approximately 100 ft and 60 ft, respectively. The Belle Haven channel was only relatedly recently described by Oertel and Foley (1995) and is estimated to be between 110 and 180 ft deep with a thickness less than 70 feet. The exact spatial configuration of these channels is not known in detail. Figure shows approximate locations of the edges of the channels and approximate thicknesses of the deposits within them. Figure 2.2-5: Top elevation (a) and thickness (b) of the Yorktown-Paleochannels Source: Sandford, et al, Source: Hobbs, et. al Page 2.2-6

25 2.2 Groundwater Upper Yorktown Aquifer The upper Yorktown aquifer is the uppermost unit of the Yorktown-Eastover aquifer system, and is generally defined as the first significant sand unit occurring below the unconformity separating the basal Columbia Group sediments from the Chesapeake Group sediments (Figure 2.2-6). Sediments deposited in channel fills which incised into the Yorktown Formation have also been identified as the upper Yorktown aquifer, even though it is not clear if there is a good hydraulic connection between the channel fill sediments and the Yorktown Formation sediments. These channel fill deposits have been identified in the Eastern Shore near Exmore and Eastville. Over most of its extent, the Upper Yorktown aquifer consists of gray fine to medium sand with shell fragments commonly present. Locally, discontinuous coarse sand and gravel layers and thin lenses of blue clayey silt are often present. Figure 2.2-6: Top elevation (a) and thickness (b) of the Upper Yorktown Aquifer Source: Sanford, et al, Page 2.2-7
26 2.2 Groundwater Middle Yorktown Confining Unit The middle Yorktown confining unit is not as continuous or impermeable as the upper Yorktown confining unit, and has been described as allowing substantial leakage between the upper and middle Yorktown aquifers (Figure 2.2-7). In some areas this confining unit is absent, and over most of the Eastern Shore, it consists of a zone of interbedded silts and clays with numerous fine sand layers. Thickness of the middle Yorktown confining unit ranges between 15 and 100 ft, and tends to be thinner to the west and south. Figure 2.2-7: Top elevation (a) and thickness (b) of the Middle Yorktown Confining Unit Source: Sanford, et al, Page 2.2-8
27 2.2 Groundwater Middle Yorktown Aquifer The middle Yorktown aquifer is an aerially extensive hydrologic unit of the Yorktown-Eastover aquifer system. The middle Yorktown aquifer, over most of its extent in the Eastern Shore is a gray fine sand to silty fine sand with shell fragments prevalent. In some areas, such as near the southern tip of the Eastern Shore, the middle Yorktown aquifer is coarser, consisting of gray medium to fine sand. This unit fines toward central Northampton County to a silty fine sand. Thickness of the middle Yorktown aquifer typically ranges between 30 ft and 60 ft, although locally is can be absent or up to 100 feet thick (Figure 2.2-8). The top of the aquifer in the Eastern Shore is between -125 ft msl to -150 ft msl along the western coast increasing to -225 to -250 ft msl to the east. The dip of the middle Yorktown is approximately 6 feet per mile, or roughly twice the dip as the overlying Upper Yorktown aquifer beds. As with the other units, strike is northeast, parallel with the peninsula. Figure 2.2-8: Top elevation (a) and thickness (b) of the Middle Yorktown Aquifer Source: Sanford, et al, Page 2.2-9

28 2.2 Groundwater Lower Yorktown Confining Unit The lower Yorktown confining unit has been described only in the Eastern Shore and has not been identified to the north in Maryland. The confining unit is thickest in central and northern Accomack County, thinning to the south and pinching out to the north in Maryland. Over the Eastern Shore area, the sediments comprising lower Yorktown confining unit tend to be finer grained than sediments from the middle Yorktown confining unit. As such, the lower Yorktown confining unit appears to restrict vertical flow more than the middle Yorktown confining unit (Figure 2.2-9). Figure 2.2-9: Top elevation (a) and thickness (b) of the Lower Yorktown Confining Unit Source: Sanford, et al, Page
29 2.2 Groundwater Lower Yorktown Aquifer The lower Yorktown aquifer in the Eastern Shore typically consists of a fining upward sequence of gray fine sand to silty fine sand with shell fragments. In the Eastern Shore, the lower Yorktown aquifer is usually slightly thicker than the overlying middle Yorktown aquifer, and is generally between 60 and 80 feet thick throughout the area. The top of the lower Yorktown ranges between -175 and -225 ft msl along the western coast to -300 to -350 ft msl along the eastern coast (Figure ). The dip of the lower Yorktown aquifer is approximately 8 feet per mile, continuing the progressive increase in bed dip with depth exhibited by the overlying units. Figure : Top elevation (a) and thickness (b) of the Lower Yorktown Aquifer Source: Sanford, et al, Page

30 2.2 Groundwater Saint Marys Confining Unit The Saint Marys confining unit is defined by the top of the Saint Marys Formation and is the most correlative stratigraphic horizon for the sediments in the Eastern Shore and Maryland. The Saint Marys confining unit consists of offshore marine very fine sandy silts and clays with abundant shells. This unit comprises sediments from the Saint Marys Formation, and separates the lower Yorktown aquifer from the underlying Choptank aquifer. Thickness of the Saint Marys confining unit is greater than 100 feet across the entire area, and in most locations exceeds 150 feet (Figure ). Owing largely to the thickness of this unit, the Saint Marys forms an effective confining layer restricting flow between the two aquifers. Figure : Top elevation of the St Marys Confining Unit Deeper Hydrostratigraphic Layers Information on the deeper hydrostratigraphic units is very limited, with only four borings on the shore penetrating to basement (bedrock), north to south: Jenkins Bridge core, Exmore core, Cape Charles core, and Kiptopeke core. Underlying the Saint Marys confining unit is the Saint Marys aquifer, Calvert confining unit, Pine Point aquifer, the Exmore Matrix confining unit, Exmore Clast confining unit, and Potomac confining zone, and Potomac aquifer. The Saint Marys aquifer was present in only the two northern cores (Exmore and Jenkins Bridge) at depths between 500 and 700 feet BGS and was absent in the Cape Charles and Kiptopeke Core. From this limited information it is likely the Saint Marys aquifer is present throughout Accomack County and is only present over the northern portion of Northampton County. The underlying Piney Point aquifer was present in all four cores, although this aquifer was less than 100-ft thick in all the cores. Top of the Potomac aquifer was encountered in only the northern most core (Jenkins Bridge) at a depth of 1200 ft BGS. This The Exmore core may not did not extend deept Source: Sanford, et al, Chesapeake Bay Impact Crater A large comet or meteor (bolide) crashed into the Earth approximately 35 million years ago near presentday Cape Charles. The resulting impact crater displaced and mixed geologic units from the upper Potomac confining unit down several hundred feet into the basement rock. Page

31 2.2 Groundwater Useful Definitions: Precipitation: water falling from the sky in the form of rain, sleet, snow, and/or hail. Recharge: the amount of precipitation that infiltrates to the water table aquifer. Discharge: the amount of water that flows from groundwater aquifers to surface water bodies, such as streams, rivers, ponds, lakes, bays, and oceans. Source: USGS Circular 1262 Evapotranspiration: the amount of water that evaporates directly from the land surface and shallow soils or indirectly through the leaves of plants Recharge Fresh groundwater on the Eastern Shore of Virginia is replenished solely by precipitation that falls directly on the Shore. There is no fresh water contribution from the aquifers on the Mainland. Average annual precipitation on the Eastern Shore is approximately 44 inches. The precipitation normals vary seasonally between 3.0 and 4.5 inches; with the highest months being March and July and the lowest being June and November (Figure ). While 44 inches of precipitation, on average falls on the Shore, the majority of the precipitation is lost to runoff and evapotranspiration, and only a small fraction reaches the Columbia aquifer (Figure ). The portion of recharge reaching the Columbia aquifer remaining recharge water goes into storage (in the water table aquifer) or recharges the underlying confined aquifers. Page
 4 3 2 1 0 Jan Feb Mar Apr May Jun Jul Aug Sep Oct Nov Dec Source: NOAA, 2002 3. Figure 2.")
32 2.2 Groundwater Figure : Precipitation Normals for the Eastern Shore of Virginia 5 Precipitation Normal (in/month) Jan Feb Mar Apr May Jun Jul Aug Sep Oct Nov Dec Source: NOAA, Figure : Recharge Rates on the Eastern Shore 84% Runoff and Evapotranspiration Discharge to Surface Water Leakage to Yorktown Aquifer 15% 9 MGD 1% 625 MGD Page


33 2.2 Groundwater There have been a number of groundwater recharge values previously estimated for the Eastern Shore. Holme 4 conducted a detailed two year study of ground water recharge from monthly ground water budgets in the Beaverdam Creek basin in Maryland, near the border with Accomack. From his work a recharge value of 12 in/yr was determined, after subtracting ground water loss through evapotranspiration. The 12 in/yr estimate includes recharge which is later lost through discharge to surface waters. Harsh and Laczniak conducted a study of the regional aquifer system of the Northern Atlantic coastal Plain 5. In this study, they estimated that ground water recharge to the water table aquifer is approximately 15 inches/year. A digital-flow-model study in the Coastal Plain of central and southern Delaware 6 used 14 inches/year as an estimate of ground water recharge for the area and other studies on the Eastern Shore have estimated that recharge to the unconfined aquifer ranges between 8.5 and 15 in/yr 2 and 12 and 26 in/yr 7. The most recent estimate was developed by the USGS as part of the Eastern Shore Model 10 and is currently the best estimate for recharge on the Shore. The current estimates of recharge are presented on Figure , with 6.6 in/yr recharging the Columbia aquifer. Fresh groundwater recharge to the underlying confined Yorktown-Eastover aquifer is generally greatest near the central spine recharge area of the peninsula, where the difference in water level between the Columbia aquifer and Yorktown- Eastover aquifer is greatest (Figure ). Some of the water that recharges near the center of the peninsula flows vertically through the water table aquifer and underlying confining units to recharge the confined aquifers. This downward flow component decreases with distance from the central recharge area. The Yorktown-Eastover aquifers are recharged at a much lower rate than the Columbia aquifer. Current estimates for recharge rate to the Upper Yorktown-Eastover aquifer is ½ in/yr (less than 1% of the precipitation falling on the Shore. Recharge to the Middle and Lower Yorktown- Eastover aquifers are progressively lower with depth. Age measured from groundwater samples collected from the Columbia and Yorktown-Eastover aquifers 10 illustrates these low recharge rates with average ages as follows: Figure : Recharge Areas of the Eatern Shore Columbia aquifer 50 years Upper Yorktown-Eastover 4,500 years Middle Yorktown-Eastover aquifer 9,700 years Lower Yorktown-Eastover aquifer 13,900 years Page
34 2.2 Groundwater Ground water flow in the confined aquifers is also primarily horizontal, with some downward flow in the central peninsula and upward flow in coastal discharge areas (Figure 2.2-2). Recharge to the Yorktown-Eastover aquifer along the recharge spine is not uniform across the Shore, and can vary significantly depending on: Local thickness and composition (amount of silt and clay) of the confining unit, Presence of Paleochannels, and Local Yorktown-Eastover groundwater use that lowers the water level in the confined aquifer creating a higher downward hydraulic gradient (higher downward flow rate). Useful Definitions: Hydraulic conductivity: a property indicating the ability of water to flow through a standard volume of aquifer due to differences in pressure across the aquifer. The degree the above factors influence recharge to the Yorktown-Eastover aquifer is poorly understood Hydraulic Characteristics Columbia Aquifer Transmissivity: the hydraulic conductivity measured across the water-bearing thickness of an aquifer. It is a common metric indicative of the amount of water that can be withdrawn from an aquifer. An aquifer with a high transmissivity is likely to produce more water than an aquifer with a low transmissivity. Groundwater levels in the Columbia aquifer are generally subparallel to the land surface of the Eastern Shore, with depths to water ranging from 20 ft along the recharge spine to intersecting the land surface at streams, rivers, ponds, the Bay and the Atlantic. The hydraulic conductivity of the Columbia aquifer ranges from approximately 10 to 200 ft/day and generally increases northward. Transmissivities reported for the Columbia aquifer range from 100 to 50,000 ft 2 /day. On the Eastern Shore of Virginia, transmissivities are somewhat lower, typically ranging between 1,000 and 4,000 ft 2 /day. The general increase in transmissivity to the north appears to be a function of both increasing thickness and increasing hydraulic conductivity Upper Yorktown Aquifer Groundwater levels on the Eastern Shore follows the same general pattern as the overlying Columbia aquifer, since recharge to this aquifer is from the Columbia. Because the confining unit separating the two aquifers is consistently present over most of the area, there is significant pressure loss between the two aquifers. A maximum groundwater level of +25 ft msl occurs in south central Accomack County, decreasing radially from this point. In Northampton County, the groundwater level is between +5 and +10 ft, and in central Accomack County, groundwater level is +15 to +20 feet MSL, decreasing to +8 to +12 ft msl near the state boundary with Maryland. At the eastern and western coastline, groundwater level decreases to approximately +5 ft msl. A short distance offshore, vertical groundwater flow direction is expected to reverse, with fresh groundwater flow from the upper Yorktown aquifer into the overlying Columbia aquifer. Page
35 2.2 Groundwater There are several prominent cones of depression resulting from significant groundwater withdrawals centered around Temperanceville (Tyson Food), Accomack (Perdue), Exmore, and Cape Charles. Transmissivity for the upper Yorktown aquifer is generally lower than the Columbia aquifer, and has a lower variability. Transmissivity for this aquifer typically ranges between 1,000 to 5,000 ft 2 /day Middle Yorktown Aquifer Groundwater levels for the middle Yorktown aquifer on the Eastern Shore are only slightly lower in the central portion than the upper Yorktown, with a maximum groundwater elevation between +20 and +25 ft msl near Accomack. At the coast and a short distance offshore, the groundwater level in the middle Yorktown is expected to be slightly higher than the upper Yorktown, with the vertical groundwater flow reversed to an upward direction. In Northampton County, groundwater level typically ranges between +10 and +5 ft msl. Transmissivities for the middle Yorktown in the Eastern Shore range between 1,000 and 3,000 ft 2 /day Lower Yorktown Aquifer Transmissivity for this aquifer in the Eastern Shore is roughly the same or slightly lower than the middle Yorktown, averaging around 1,200 ft 2 /day in areas where the sediments are productive. There are only a few pumping tests conducted in the lower Yorktown of the Eastern Shore and the lower and middle Yorktown aquifer are not differentiated in Maryland. Therefore, there is not a great deal of information on areal variability in transmissivity of the Lower Yorktown Deeper Aquifers Currently there is no information on the hydraulic characteristics for the deeper aquifer on the Eastern Shore of Virginia Local and Regional Hydrostratigraphic Features There are several hydrostratigraphic features which interrupt the sequence of layers described above at local and regional scales and play an important although less understood role in the groundwater system of the Eastern Shore. These include several identified paleochannels which have replaced portions of the Yorktown confining unit with more permeable sediments and the impact crater which displaced and mixed sediments from the upper Potomac confining unit down into the basement rock Water Quality The Columbia aquifer and Yorktown-Eastover aquifers over most of the Shore has very good water quality. As part of development of the USGS Eastern Shore Model (USGS SIR ), water quality samples Page
36 2.2 Groundwater were collected from the Columbia and Yorktown-Eastover aquifers, and the Shore-wide water quality for these aquifers are summarized on Table The following summarizes the general water quality from the shallow Columbia aquifer to the deeper Lower Yorktown-Eastover aquifer: The Columbia, Upper Yorktown-Eastover, and Middle Yorktown-Eastover aquifer are largely fresh, with increasing levels of sodium and chloride with depth (Table and Figure ). The Lower Yorktown- Eastover aquifer is significantly more brackish, with average chloride levels exceeding the Drinking Water (SMCL) Maximum Contaminant Level. Consistent a transition from fresh to brackish groundwater, alkalinity likewise increased with depth (Figure ).. High bicarbonate alkalinity is most often associated with white deposits and scale formation in water systems The Columbia aquifer contains freshwater almost exclusively, with chloride levels less than the Drinking Water Secondary Maximum Contaminant Level of 250 mg/l over most of the Shore (Figure ). Where the Columbia aquifer subcrops, freshwater discharges from the aquifer to the Chesapeake Bay, Atlantic Ocean, and intervening tidal creeks and bays. While the Yorktown-Eastover aquifer has, as expected, more brackish water (chloride levels greater than 250 mg/l), it likewise is fresh throughout most of the Shore. Table Summary Groundwater Quality on the Eastern Shore of Virginia Constituent Columbia aquifer Upper Yorktown Eastover aquifer Middle Yorktown Eastover aquifer Lower Yorktown Eastover aquifer Well depth (ft) Specific conductance (µs/cm) ,952 Dissolved oxygen (mg/l) ph Ca (mg/l) Mg (mg/l) Na (mg/l) Cl (early 1980s) Cl (2003) SO (mg/l) Alkalinity (HCO 3) (mg/l) NO 3 (mg/l) Recharge temperature ( C) Adjusted 14C age (yrs) N/A 4,500 9,700 13,900 The aquifers deeper than the Yorktown-Eastover are believed to be brackish, although there is a lack of water quality measurements for confirmation. Based on one sample collected from the Jenkins Bridge core Page
37 2.2 Groundwater the Saint Marys aquifer is brackish, with a chloride level exceeding 3,000 mg/l. There are no water quality samples from any of the other deeper aquifers on the Shore. Figure Groundwater Chlorides Legend 250 mg/l Columbia aquifer < 150 mg/l Columbia 150 to 250 aquifer mg/l 250 to 500 mg/l Columbia aquifer 500 to 1,000 mg/l > 1,000 mg/l Legend 250 mg/l Upper Yorktown 250 mg/l Middle Yorktown 250 mg/l Lower Yorktown < 150 mg/l 150 to 250 mg/l 250 to 500 mg/l 500 to 1,000 mg/l > 1,000 mg/l Yorktown-Eastover aquifer Yorktown-Eastover aquifer Miles Miles Columbia aquifer Yorktown-Eastover aquifer Note: Chloride contours from USGS Eastern Shore Model for Simulation Year 2006 (USGS SIR ). Chloride samples from USGS PP 1772 Page
38 2.2 Groundwater Figure Groundwater Bicarbonate Alkalinity Legend < 100 mg/l 100 to 240 mg/l 250 to 500 mg/l 500 to 1,000 mg/l > 1,000 mg/l Legend < 100 mg/l 100 to 240 mg/l 250 to 500 mg/l 500 to 1,000 mg/l > 1,000 mg/l Miles Miles Typical of coastal plain water table aquifers, ph of the Columbia aquifer is slightly acidic, averaging 5.9 and typical of confined aquifers, the Yorktown-Eastover is near neutral to basic, averaging 7.8 to 8 (Figure ). Acidic water can be corrosive to some water systems, in particular older water systems with that may have galvanized piping or copper piping with poor lead soldering that exposes the lead to water. It is also important to recognize that other water quality characteristics can be corrosive to some water systems, such as high sodium and chloride (salt) levels. Water with high salt levels, such as levels that can be found in the Lower Yorktown-Eastover aquifer typically has a basic ph. Page
39 2.2 Groundwater Figure Groundwater ph Legend 3.5 to to to to to 12.5 Legend 3.5 to to to to to Miles Miles Sulfide in groundwater is, locally, a common problem for some groundwater supplies on the Shore. Relatively low concentrations of sulfide in the water are associated with objectionable odors (rotten egg). While sulfide measurements are not available, sulfate is (Table 2.2-1). There is no significant difference in sulfate levels between the unconfined Columbia and confined Yorktown-Eastover aquifer. There are not many groundwater samples where the sulfate levels exceed the Drinking Water Secondary Maximum Contaminant Level of 250 mg/l (Figure ). Page
40 2.2 Groundwater Figure Groundwater Sulfate Legend < 50 mg/l 50 to 100 mg/l 100 to 250 mg/l 250 to 500 mg/l > 500 mg/l Legend < 50 mg/l 50 to 100 mg/l 100 to 250 mg/l 250 to 500 mg/l > 500 mg/l Miles Miles The groundwater constituent most commonly associated with objectionable water quality is iron, which is a common cause of staining at low concentrations and objectionable taste at higher concentrations. Iron as low as 0.3 mg/l can cause staining. Iron concentrations less than 5 mg/l can typically be treated using conventional home treatment systems. However, higher levels of iron can result in an unintended increase in salt levels resulting from the ion-exchange used in many of the conventional home treatment systems. While spatially iron is highly variable (Figure ), average iron levels in the Columbia and Yorktown- Eastover aquifers are very similar. Page
41 2.2 Groundwater Figure Groundwater Iron Legend < 0.3 mg/l 0.3 to 1 mg/l 1 to 5 mg/l 5 to 10 mg/l > 10 mg/l Legend < 0.3 mg/l 0.3 to 1 mg/l 1 to 5 mg/l 5 to 10 mg/l > 10 mg/l Miles Miles Page

42 2.2 Groundwater Figure Groundwater Nitrate Legend < 1 mg/l 1 to 5 mg/l 5 to 10 mg/l 10 to 20 mg/l > 20 mg/l Legend < 1 mg/l 1 to 5 mg/l 5 to 10 mg/l 10 to 20 mg/l > 20 mg/l Miles Miles Page
43 2.2 Groundwater References 1. Sanford, W.E., Pope, J.P., and Nelms, D.L., Simulation of Groundwater-Level and Salinity Changes, in the Eastern Shore, Virginia. U.S. Geological Survey Scientific Investigations Report Richardson, D., Hydrogeology and Analysis of the Ground-Water-Flow System of the Eastern Shore, Virginia. U.S. Geological Survey Open File Report NOAA, Monthly Sation Normals of Temperature, Precipitation, and Heating and Cooling Degree Days Climatology of the United States No 81.: Virginia. National Oceanic and Atmospheric Administration, National Climactic Data Center. Asheville, NC. 4. Hulme, A. E., The Water Resources of Somerset, Wicomico, and Worcester Counties. Maryland Department of Geology, Mines, and Water Resources: Bulletin Harsh, J. F. and Laczniak, R. J., Conceptualization and Analysis of Ground-Water Flow System in the Coastal Plain of Virginia and Adjacent Parts of Maryland and North Carolina. U.S. Geological Survey Professional Paper 1404-F. 6. Hobbs, C. H.; Krantz, D. E. and Wikel, G. L. Coastal Processes and Offshore Geology. The Geology of Virginia, Bailey ed. 7. Johnston, R. H., Digital Model of the unconfined aquifer in central and southeastern Delaware. Bulletin 15, Delaware Geological Survey. 47 pp. 8. Horsley Witten Hegemann, Inc., Groundwater Supply Protection and Management Plan for the Eastern Shore of Virginia. Prepared for the Eastern Shore of Virginia Groundwater Study Committee. 9. Ortel, G. F. and Foyle, A. M., Drainage Displacement by Sea-Level Fluctuation at the Outer Margin of the Chesapeake Seaway. Journal of Coastal Research, V11, No. 3, pp Sanford, W.E., Pope, J.P., and Nelms, D.L., 2009, Simulation of Groundwater and Salinity Changes in the Eastern Shore, Virginia, U.S. Geological Survey Scientific Investigations Report McFarland, E.R., 2010, Groundwater Quality Data and Regional Trends in the Virginia Coastal Plain, , U.S. Geological Survey Professional Paper Page
44 SECTION 3 LAND USE AND WATER RESOURCE USE 3.0 LAND AND WATER RESOURCE USE This section of the Groundwater Management Plan describes the historic, current, and future use of land and water on the Eastern Shore of Virginia. Page 3.0-1

45 SECTION 3 LAND AND WATER RESOURCE USE 3.1 LAND USE Land use and land cover can have a significant impact on local and regional hydrology and should play an important role in water supply planning. Variations in land use and land cover affect the geospatial variation of water demands and can have an impact on streamflow and groundwater water recharge, both in terms of quantity and quality. Land uses such as urban developments tend to have high proportions of impermeable land cover in the form of pavement and buildings. Without compensating design and planning, these areas will decrease the amount of rainfall percolating into the soil, and runoff rapidly into nearby streams and water bodies. This rapid runoff reduces the amount of water available for groundwater recharge and can impact water supply wells, particularly wells with shallow screens. Rapid runoff can also carry a greater sediment and contaminant load which can impact water quality in adjacent and downstream bodies of water. High sediment loads can also fill in downstream reservoirs and thereby reduce their yield over time. Approved land uses in Accomack County and Northampton County are shown in Figure and Figure 3.1-2, respectively. Figure 3.1-1: Land Use in Accomack County Source: Accomack Comprehensive Plan, Page 3.1-1


46 3.1 Land Use Figure 3.1-2: Land Use in Northampton County Source: Northampton Department of Planning and Zoning, Page 3.1-2
47 3.1 Land Use Historic Land Use Historically, the Eastern Shore has been predominantly zoned as agricultural. The amount of agricultural land on the Eastern Shore has remained largely stable during this time, comprising approximately 35%. Over time, more residential structures have been built mainly in and around towns and villages, with a 10% increase since the 1990 census. In 1989 only 2% of the Eastern Shore was classified as commercial or industrial while approximately 95% was classified as cropland, woodlands, and wetlands Current Land Use In recent years on the Eastern Shore, rural subdivisions have become more common as has commercial and industrial developments located outside of traditional towns and village centers. This increase has caused a nearly 2.8 percent decrease in the amount of land identified in the agricultural and forestal districts since This reduction reflects the removal of land from districts due to no longer meeting minimum area requirements or for residential subdivisions and other land development. The percentage of total housing units has increased 23% since The amount of industrial activity on the Eastern Shore has also increased. The most sizeable commercial additions include a hatchery expansion at the Tysons poultry processing plant and three new starts at the 360 acres industrial park located in Melfa. Permits were issued for 43 poultry houses from 2001 to Future Land Use Trends The future land use plans for the Eastern Shore incorporate some groundwater quality and quantity protection measures to control the density, location and the pattern of development. Future land use will focus on public infrastructure investments in and around existing towns and villages and limits develop in outlying areas such as agricultural and forestal districts and in conservation districts including marshland and undeveloped barrier islands. The groundwater recharge spine along the Eastern Shore is also an area that will be preserved to the extent feasible. Approved future land uses in Accomack County and Northampton County are shown in Figure through Figure 3.1-2, respectively. Page 3.1-3

48 3.1 Land Use Figure 3.1-3: Future Land Use in Accomack County District 1 Source: Accomack Comprehensive Plan, Page 3.1-4

49 3.1 Land Use Figure 3.1-4: Future Land Use in Accomack County Districts 2 and 3 Source: Accomack Comprehensive Plan, Page 3.1-5

50 3.1 Land Use Figure 3.1-5: Future Land Use in Accomack County Districts 4 and 5 Source: Accomack Comprehensive Plan, Page 3.1-6

51 3.1 Land Use Figure 3.1-6: Future Land Use in Accomack County Districts 6 and 7 Source: Accomack Comprehensive Plan, Page 3.1-7

52 3.1 Land Use Figure 3.1-7: Future Land Use in Accomack County Districts 8 and 9 Source: Accomack Comprehensive Plan, Page 3.1-8

53 3.1 Land Use Figure 3.1-8: Future Land Use in Northampton County Source: Northampton Department of Planning and Zoning, Accomack County, Accomack County Comprehensive Plan. Adopted May 14, Page 3.1-9
54 3.1 Land Use 2. Northampton County, Northampton County Planning and Zoning Regulations. Adopted Oct 21, departments/planning_zoning.html 3 Accomack County, Accomack County Comprehensive Plan. Adopted May 14, Accomack County, Accomack County Comprehensive Plan. Adopted May 14, Accomack County, Accomack County Comprehensive Plan. Adopted May 14, Accomack County, Accomack County Comprehensive Plan. Adopted May 14, Accomack County, Accomack County Comprehensive Plan. Adopted May 14, Northampton County, Northampton County Planning and Zoning Regulations. Adopted Oct 21, departments/planning_zoning.html Page

55 SECTION 3 LAND AND WATER RESOURCE USE 3.2 WATER USE Placeholder for optional preamble Historic Water Use The United States Geological Survey (USGS) has compiled water usage information by county throughout the United States in 5-year increments since 1985 through the National Water-Use Information Program (NWUIP) 1. These water usage studies include estimated usage by source (i.e., groundwater versus surface water) and by type (e.g., public, industrial, agricultural, and individual domestic) for the Accomack and Northampton Counties on the Eastern Shore. The totals presented in these studies are approximate and provide estimates of water usage sufficient to evaluate trends in water usage. More recent ( ) data of freshwater use on the Eastern Shore has been compiled annually into the Virginia Water Use Data System (VWUDS) by the State Water Control Board (SWCB) to provide water withdrawal information to facilitate the management of water resources. Water users with average monthly withdrawal volumes greater than 0.1 MGD (~30,000 gallons per month) are required to report usage to the VWUDS. The VWUDS data is generally considered to be more accurate than data from the NWUIP; however, the VWUDS does not include withdrawals from individual users below the 0.1 MGD reporting limit. Estimated water use on the Eastern Shore has ranged between 12 million gallons per day (mgd) and 18 mgd over the period between 1985 and 2012 (Figure 3.3-1). Historically, the majority of water on the Eastern Shore was obtained from groundwater; however, the more recent trend of promoting the use of agricultural ponds rather than wells to supply agricultural water needs, has resulted in a significant shift away from groundwater use towards surface water, particularly in Accomack County. Figure 3.2-1: Historical Water Use on the Eastern Shore Page 3.2-1

56 3.2 Water Use Current Water Use Average water use from the previous five year period ( ) has been compiled from the VWUDS to define current and recent water use on the Eastern Shore. Water use has been categorized by source, end use, and county to identify demonstrate how and where water is being used. Each category is discussed below. The average water use in the county over the past 5 years was 15.4 mgd, ranging between 13.8 mgd and 16.9 mgd Water use by Source Water usage was divided into three source and three end use categories as shown in Figure 3.3-2, summarized in Table 3.3-1, and discussed below. The three sources include: groundwater, ponds, and other surface water; while the three end use types include: irrigation, commercial/industrial, and municipal. The commercial/industrial and municipal end users obtain water exclusively from groundwater wells, while irrigation end users obtain water from all three source types. As discussed in more detail below, ponds on the Eastern Shore usually receive the most significant portion of their water from groundwater discharge and the rest from run off and direct precipitation. Figure 3.2-2: Recent Water Use on the Eastern Shore by Source and End Use Page 3.2-2
57 3.2 Water Use Table 3.2-1: Recent Water Use on the Eastern Shore by Source and End Use Source Year Agriculture Commercial/Industrial Municipal Total Groundwater Average Agricultural Ponds Average Other Surface Water Average Total Water Use Average Ground water The average groundwater withdrawal by permitted users over the past five year period ( ) has been approximately 5.25 mgd, which is approximately 34% of the total water use on the Eastern Shore. End uses for the groundwater withdrawals consisted of agriculture (1.77 mgd or 33.7% of groundwater usage), commercial/industrial (2.35 mgd or 44.8% of groundwater usage), and municipal (1.13 mgd or 21.5% of groundwater usage) Surface Water Surface water on the Eastern Shore is used exclusively for agricultural purposes. The average surface water withdrawal by permitted users over the past five year period ( ) has been approximately 10.2 mgd, which is approximately 66% of the total water use on the Eastern Shore. However, 93% of the surface water (9.45 mgd, 61% of total water use) is derived from agricultural ponds, which rely primarily on groundwater discharge for replenishment. The rest (0.73 mgd, 5% of total water use) is withdrawn directly from fresh streams for agricultural use. While groundwater is the sole source of drinking water on the Eastern Shore of Virginia, surface water is used extensively for agricultural irrigation and some limited industrial use. Over the most recent five-year period, approximately 93% of water used for irrigation is from farm ponds. Historically, most farm ponds were created through dams or impoundments on existing creeks and streams. In part as a result of wetland Page 3.2-3

58 3.2 Water Use regulations, most new farm ponds are dug ponds located in upland areas. The majority of farm ponds on the Shore whether impoundments or dug ponds, extend into the Columbia aquifer. As water is pumped from the irrigation ponds, groundwater replenishes the pond. It is not unusual for farms to supplement the farm ponds with groundwater pumped directly from wells. Most often groundwater from the wells is pumped directly to the farm pond Use by County In the past five year period ( ), water use in Accomack County (12.1 MGD) has averaged significantly higher than in Northampton County (3.3 mgd) (Figure 3.2-3). Water use in Accomack and Northampton counties is categorized by the source and end use described above in Figure and Figure 3.2-5, respectively. Figure 3.2-3: Recent Water Use by County Average water use in Accomack County, as categorized by the sources and end uses described above, is presented in Figure and consisted of: Source End Use Average Withdrawal Municipal 0.72 Groundwater Commercial/Industrial 2.32 Agricultural 0.83 Ponds Agricultural 8.24 Other Surface Water Agricultural 0.02 Total Water Use Page 3.2-4


59 3.2 Water Use Average water use in Northampton, as categorized by the sources and end uses described above, is presented in Figure and consisted of: Source End Use Average Withdrawal Municipal 0.41 Groundwater Commercial/Industrial 0.03 Agricultural 0.94 Ponds Agricultural 1.21 Other Surface Water Agricultural 0.70 Total Water Use 3.30 Figure 3.2-4: Recent Water Use in Accomack County by Source and End Use Figure 3.2-5: Recent Water Use in Northampton County by Source and End Use Page 3.2-5
60 3.2 Water Use Future Water Use Trends Groundwater A statistical trend in the groundwater usage data was not found; however, average annual groundwater usage over the past five year period ( ) was approximately 5.25 MGD. Although linear interpolation provides a poor correlation to the data, recent groundwater usage has been steady to slightly declining (Figure 3.2-6), groundwater usage is likely to remain consistent over the short term for reasons outlined below. While the current comprehensive plans of both counties support residential and economic growth concentrated in areas already served by municipal supplies, groundwater demands have been declining due to reduced demands associated with conservation measures (Figure 3.2-7). Groundwater demands over the next five year period are likely to continue at current levels for the same reason total demand is flat because growth in consumption is being exceeded by reductions in per capita consumption. As incremental steps in water conservation become more difficult or expensive to implement, demand for fresh potable groundwater will begin to grow again unless alternative sources are developed (see Section 5.4). Figure 3.2-6: Recent and Projected Withdrawals Page 3.2-6
61 3.2 Water Use Figure 3.2-7: Trends in Groundwater Use Surface Water Surface water withdrawals (including a significant majority from the agricultural ponds) have increased over the past five years ( ) from approximately 8 mgd to almost 12 mgd. If a similar trend continues over the next five years, demand would increase to approximately 15 mgd (Figure 3.2-6). A further uncertainty to predicting future surface water demands is that surface water is largely used for irrigation and demand is largely tied to weather and climate, which are inherently unpredictable (recent and predicted climate trends are discussed in Section 4.4). Periods where average evapotranspiration exceeds precipitation (including droughts) require more irrigation waters and will put further pressure on demands. References 1 USGS, Water Use in the United States. National Water-Use Information Program website: Last Accessed: September 24, Page 3.2-7
62 SECTION 4 RESOURCE VULNERABILITY 4.0 RESOURCE VULNERABILITY This section of the Groundwater Management Plan identifies and discusses existing and potential vulnerabilities to water resources on the Eastern Shore of Virginia. There are two major concerns regarding groundwater on the Eastern Shore: 1. quantity and 2. quality. Groundwater quantity is limited by the nature of the aquifers and must be carefully managed to prevent overuse that can result in saltwater intrusion (Section 4.1) and water level declines (Section 4.2). Groundwater quality depends on proper management of land use activities that can contaminate aquifers (Section 4.3). In recognition of the limited groundwater supply and the potential for contamination, the U.S. Environmental Protection Agency designated the Eastern Shore of Virginia a Sole Source Aquifer in The designation provides protection to the Shore s water supply by requiring the EPA to review proposed projects on the Shore that are receiving federal financial assistance to ensure they do not endanger the water supply. Climate change and sea level rise (Section 4.4) may result in impacts to ground water quantity and quality due to changes in recharge patterns and increased potential for saltwater intrusion, respectively. Page 4.0-1

63 SECTION 4 RESOURCE VULNERABILITIES 4.1 SALTWATER INTRUSION Saltwater intrusion occurs when fresh groundwater is withdrawn at a rate faster than it is replenished. Because the sole source of fresh groundwater on the Eastern Shore of Virginia is from direct precipitation, the Shore is susceptible to saltwater intrusion. Saltwater intrusion typically occurs in two forms: 1) lateral movement and 2) upconing. Lateral movement of saltwater generally occurs near the edge of the freshwater / saltwater interface from the aquifer where the withdrawal is occurring. The lateral movement is a response to a smaller freshwater lens, with saltwater replacing freshwater in these areas. On the Eastern Shore of Virginia, although there are no well documented cases of lateral intrusion, it is likely at least a portion of the saltwater intrusion observed in Bayshore Concrete wells near the Town of Cape Charles is due to lateral intrusion. One reason lateral saltwater intrusion has not been readily observed on the Shore is that the location of the freshwater/saltwater lens is generally off-shore. The current rate of withdrawals is not sufficient to result in significant landward movement of the freshwater/lens. The Eastern Shore Model has been used to further evaluate conditions where lateral saltwater intrusion could occur. One example of saltwater encroachment in areas generally off-shore is a hypothetical 1-mgd withdrawal located halfway between the two major groundwater users on the Shore (Perdue and Tyson Farms) (Figure 4.1-1). Like these two major users, the hypothetical withdrawal was located near the center of the freshwater lens. The model predicted increases in chloride levels that exceed the Drinking Water secondary Maximum Contaminant Level of 250 mg/l over a relatively small area long the Seaside and secondarily the Bay. It is unlikely this saltwater intrusion would be observed in wells currently used on the Shore. Figure 4.1-1: Model Predicted Saltwater Intrusion from Hypothetical 1-MGD Withdrawal Legend Hypothetical Well Field Drawdown Constant 1MGD Lower Yorktown-Eastover Aquifer (feet) -60 feet -50 feet -40 feet -30 feet -20 feet -10 feet -5 feet -1 feet Change in Chloride Levels (ppm) Lower Yorktown-Eastover Aquifer (Chlorides ppm) 0 to 50 ppm 50 to 100 ppm 100 to 150 ppm 150 to 200 ppm 200 to 250 ppm 250 to 300 ppm 300 to 350 ppm 350 to 400 ppm 400 to 450 ppm 450 to 500 ppm Upconing is the more commonly observed form of saltwater intrusion occurring on the Shore, and occurs when groundwater pumped from a confined aquifer induces localized upward move movement of underlying saltwater as a result of the lowered freshwater levels (Figure 4.1-2). Unlike lateral intrusion, which commonly occurs some distance from the pumping well, upconing typically occurs in the immediate vicinity of the well Miles Updated August 2013 Page 4.1-1
 Upconing has been observed in the Town of Cape Charles production wells, with brackish groundwater in the lower Yorktown-Eastover aquifer")
64 4.1 Saltwater Intrusion Figure 4.1-2: Example of Upconing Source: USGS Circular 1262 (2003) Upconing has been observed in the Town of Cape Charles production wells, with brackish groundwater in the lower Yorktown-Eastover aquifer moving up into the middle Yorktown-Eastover aquifer. Chloride levels in the Town s production wells increased by almost 100 mg/l over a 10-year period as a direct result of increases in the Town s groundwater use (Figure 4.1.3). Figure 4.1.3: Saltwater Intrusion in the Town of Caper Charles Production Wells Cape Charles Tower Well Chlorides 190, Drinking Water MCL Cape Charles Use 175,000 Chloride Concentration (mg/l) , , ,000 Annual Water Use (GPD average) , ,000 Page 4.1-2
65 SECTION 4 RESOURCE VULNERABILITIES 4.2 WATER LEVEL DECLINES A consequence of groundwater withdrawals are lower groundwater levels in the aquifer being pumped as well as, in some cases, overlying and underlying aquifers. The amount the water level declines and the area that is impacted by the water level declines is a function of the rate the water is withdrawn and certain characteristics of the aquifer, such as the transmissivity, storage, and rate of aquifer recharge. Consequences of water level declines include: - Reduced well capacity - Potential well failure - Potential groundwater mining - Potential land subsidence - Increased potential for saltwater intrusion - Increased potential for transport of contaminants from land use activities Most often reduced well capacity does not result in a total loss of well yield, rather it typically results in lower withdrawal rate leading Useful Definitions: Well yield: the maximum groundwater withdrawal rate. Yield is a function of aquifer characteristics and well construction/maintenance. Drawdown: the decrease in groundwater levels relative to existing or baseline condition groundwater levels due to changes in groundwater flow, usually pumping. to longer pumping time in order to maintain the desired yield. However, in some cases the water levels will fall below a pump intake with the resulting well failure. The following measures will commonly correct well failure: 1) lowering pump intake; 2) increasing pump capacity; or 3) if the preceding measures cannot be implemented, replacing the well. Groundwater mining occurs when the water level is lowered below the top of the aquifer. In addition to loss of well capacity, mining results in some land subsidence and a permanent reduction in the aquifer capacity where the water is drained from the aquifer matrix. To prevent this from occurring, the Virginia Department of Environmental Quality (VDEQ) regulates all withdrawals greater than or equal to 300,000 gallons/month. Under these regulations, the VDEQ: - Requires that all pump intakes are above the top of the aquifer and - Groundwater levels are not lowered below the 80% criterion Anytime the water level is lowered in the freshwater aquifer, the size of the freshwater lens is reduced and saltwater intrusion occurs. Often the change is not measureable or does not affect any users. However, some localized saltwater intrusion that has resulted in measurable increases of sodium and chloride concentrations in the groundwater has been documented on the Shore. The lowered water levels also correspond to an increase in the groundwater flow velocity. Movement of any contaminants that may be present in the groundwater can occur or increase. Water level declines on the Shore are evaluated through two approaches: - Collecting and comparing empirical water level measurements over time from State Observation Wells maintained by the USGS (Figures through 4.1-3) and - Predicting groundwater levels based on simulations of various groundwater withdrawal scenarios using the Eastern Shore Model (Figure 4.1-4). Page 4.2-1
66 USGS Observation Well 4.2 Water Level Declines Figure 4.2-1: Measured Groundwater Levels - Assawoman 0 GROUNDWATER LEVEL TRENDS Observation Wells SOW 107 Assawoman 2 4 Depth Below Ground Surface (ft) # ### # ## # # Goshen Farm Drummond Farm ## # # # # # ### # ## # # East Coast Brokers and Packers 1 inch equals 4,000 feet Gillespe Farm Miles Tyson Foods Incorporated Holly Farms 66L 2 SOW 107A 66L 3 SOW 66L 1 SOW 107C Eastern Shore Seafood Incorporated Hogneck Farm Hagan Farm # # ## # ## # # US NASA -Goddard Space Flight Center Island Systems # ## NTGargiulo LP Taylor Farm Legend # Agricultural # Industrial/Commercial! Municipal USGS Observation 66L 2 SOW 107A - Screen Depth = ft 66L 3 SOW 107B - Screen Depth = ft 66L 1 SOW 107C - Screen Depth = ft Year Figure 4.2-2: Measured Groundwater Levels NW of Melfa GROUNDWATER LEVEL TRENDS Observation Wells SOW 108 NW of Melfa Depth Below Ground Surface (ft) # Weaver # Farm # K 11 SOW 108B 64K 12 SOW 108C 64K 10 SOW 108A # # # Eastern Shore Yacht # ## # and Country Club # Home Farm Bobtown Nursery Liberty Hall Farm # Miles 1 inch equals 4,000 feet ## Nursery Growers Legend # Agricultural # Industrial/Commercial! 64K 10 SOW 108A - Screen Depth = ft 64K 11 SOW 108B - Screen Depth = ft 64K 12 SOW 108C - Screen Depth = ft Year Page 4.2-2
67 65K 26 SOW 109S 65K 25 SOW 109B 65K 24 SOW 109A Miles Byrd 65K 29 SOW 114C 65K 30 SOW 114S 65K 28 SOW 114B 65K 27 SOW 114A Perdue Farms Incorporated 65K 62 SOW 183D Accomack County Office Buildings Waterworks 65K 61 SOW 183C Accawmacke Ornamentals Burton Farm Rew Farm Shore Life Care at Parksley 66K 2 SOW 101C 66K 4 SOW 101A USGS Observation Well 4.2 Water Level Declines Figure 4.2-3: Measured Groundwater Levels E of Greenbush 0 GROUNDWATER LEVEL TRENDS Observation Wells SOW 114 East of Greenbush 20 Depth Below Ground Surface (ft) inch equals 4,000 feet # #!@A@A@A@A ## # # # # # # Legend # # Agricultural Industrial/Commercial! 65K 30 SOW 114S - Screen Depth = ft 65K 27 SOW 114A - Screen Depth = ft 65K 28 SOW 114B - Screen Depth = ft 65K 29 SOW 114C - Screen Depth = ft Year Water level measurements collected from wells on the Eastern Shore during the period between 1997 and 2013 demonstrate that water levels have declined in some areas by averages of up to 20 feet, particularly in the deeper portions of the Yorktown aquifer (i.e. the deeper screened intervals at SOW 108 northwest of Melfa and at SOW 114 eat of Greenbush). Measured water levels in the shallower aquifers (i.e. the Columbia and Upper Yorktown aquifers) have remained consistent or declined much less over the same period. This is largely due to the higher recharge associated with the shallower aquifers. Simulations groundwater levels from the Eastern Shore Model resulting from withdrawing at the maximum annual average rate for each permitted user (as of 2013) conservatively predict water level declines (i.e. drawdown) based on current usage. The scenario is conservative because, it is unlikely that all users will withdraw at the maximum rate, particularly since recent groundwater withdrawals have been relatively stable or even declining slightly over the past ten years (as of 2010). As shown in Figure 4.2-4, the most significant area of potential drawdown (and therefore potential water level decline) is located in the central portion of Accomack County. Page 4.2-3

68 4.2 Water Level Declines Figure 4.2-4: Model Predicted Drawdown for All Permitted Withdrawals Drawdown Contour Interval = 2 ft Minimum Drawdown = -2 ft Maximum Drawdown = -142 ft Updated August Miles Page 4.2-4
69 SECTION 4 RESOURCE VULNERABILITIES 4.3 LAND USE ACTIVITIES Existing and potential vulnerabilities to water resources on the Eastern Shore of Virginia may be associated with various land use practices that can contaminate aquifers, typically in the following categories: Agricultural Industrial/Commercial Municipal/Residential Waste Management Each of these land use activities and their potential impact on Eastern Shore groundwater resources are discussed below Agricultural Cultivation of crops for food and feed and husbandry of livestock are important activities to the culture, character, and economy of the Eastern Shore. These practices provide obvious benefits in terms of food production and employment and are actively encouraged as part of the comprehensive plans of both Accomack and Northampton counties. Improper land management activities associated with agriculture can contribute to the degradation of water resources. Excessive application of fertilizers and pesticides can impact water quality and overuse of water for irrigation and other agricultural purposes can lead to declines in water levels (see Section 4.2) and concentrate minerals already present in the surficial aquifer. The most common groundwater quality impacts from agricultural activities are elevated nitrogen levels that, in some areas, exceed the USEPA Drinking Water Maximum Contaminant Level. Other impacts to groundwater that have been observed are low levels of pesticides that appear to be related more to past agricultural practices than current activities Nitrogen Nitrogen (often in the form of nitrate) is one of the most widespread groundwater contaminants in the United States. The primary and most common agricultural sources of nitrogen on the Eastern Shore include: Crop fertilization (natural/synthetic and organic/inorganic); and Land application of animal wastes, including from concentrated animal feed operations (CAFOs) Studies have shown that the surficial aquifer on the Eastern Shore has been impacted by historical agricultural practices and other human sources of nitrogen with concentrations above natural background conditions and exceeding 10 mg/l as nitrate (the USEPA maximum contaminant level goal) 1, 2, 3 (Debrewer, et al, 2007; Miller, 1972; Speiran, 1996). The highest levels of nitrogen in the groundwater are associated with agricultural fields. Based on groundwater rage dating conducted by Speiran (1996), there has been a decrease in nitrate levels within 10-years of the groundwater samples collected in 1993 as part of the USGS study, indicating improved recent agricultural practices reducing the nitrogen load to the groundwater. However, the information provided in this study is now over 20-years old. More recent information on nitrogen concentration trends on the Shore are very limited (Debrewer, et al, 2007). Page 4.3-1
. Figure 4.")

70 4.3 Land Use Activities Elevated nitrate concentrations are, for the most part, restricted to the shallow Columbia aquifer and do not exceed the USEPA Drinking Water MCL in the confined Yorktown-Eastover aquifer (Figure 4.3-1). Figure Nitrate Concentrations in Groundwater (2002) Legend < 1 mg/l 1 to 5 mg/l 5 to 10 mg/l 10 to 20 mg/l > 20 mg/l Legend < 1 mg/l 1 to 5 mg/l 5 to 10 mg/l 10 to 20 mg/l > 20 mg/l Miles Miles Columbia aquifer Yorktown-Eastover aquifer Once nitrates have infiltrated to groundwater, it is difficult to reduce their concentration, so it is important to minimize nitrate loading for land activities. Agricultural sources of nitrates can be controlled using best management practices (BMPs) such as: (enhanced) nutrient management planning, animal waste management, conservation tillage, and riparian and wetland buffer creation/restoration. Such practices are already widely used on the Eastern Shore and are supported by numerous government agencies through regulations, support programs, and funding/grant initiatives Page 4.3-2
Groundwater Protection and Management Planning for the Eastern Shore of Virginia
 Groundwater Protection and Management Planning for the Eastern Shore of Virginia Using a Sustainable Development Approach Britt McMillan, Malcolm Pirnie, Inc. Quick Definitions What is an Aquifer Any coarse
Our Eastern Shore Groundwater Part IV Groundwater Quality on the Eastern Shore: How safe is our groundwater and are there ways we can protect it?
 Our Eastern Shore Groundwater Part IV Groundwater Quality on the Eastern Shore: How safe is our groundwater and are there ways we can protect it? Britt McMillan, Malcolm Pirnie, Inc. Mercury Venus Mars
DRAFT REVIEW OF POULTRY HOUSE GROUNDWATER WITHDRAWAL PERMIT APPLICATIONS
 DRAFT REVIEW OF POULTRY HOUSE GROUNDWATER WITHDRAWAL PERMIT APPLICATIONS August 2018 Locations of Poultry Houses that have submitted Groundwater Withdrawal Applications 57 Poultry Houses All located in
Movement and Storage of Groundwater The Hydrosphere
 Movement and Storage of Groundwater The Hydrosphere The water on and in Earth s crust makes up the hydrosphere. About 97 percent of the hydrosphere is contained in the oceans. The water contained by landmasses
PUBLIC UTILITIES. Water Service
 PUBLIC UTILITIES Planning for public utilities is crucial to the successful growth of any community. The following section describes the current services provided to residents of Gloucester County and
Groundwater in Anne Arundel County, Maryland
 Groundwater in Anne Arundel County, Maryland Presented to Fort George G. Meade Restoration Advisory Board March 15, 2012 David W. Bolton Maryland Geological Survey Physiographic Provinces and Aquifer Types
General Groundwater Concepts
 General Groundwater Concepts Hydrologic Cycle All water on the surface of the earth and underground are part of the hydrologic cycle (Figure 1), driven by natural processes that constantly transform water
Sole Source Aquifer - no significant fresh water streams or rivers Limited resource - recharge occurs in a Spine Area Fresh ground water is
 Ground Water Availability and Resource Protection February 2009 Why Are We Discussing Groundwater? Sole Source Aquifer - no significant fresh water streams or rivers Limited resource - recharge occurs
Background Information on the. Peace River Basin
 Background Information on the Peace River Basin Resource Conservation & Development Department August 24 Background Physiography The Peace River drainage basin occupies large parts of Polk, Hardee, DeSoto,
Hydrogeology 101 3/7/2011
 Hydrogeology 101 W. Richard Laton, Ph.D., PG, CPG Associate Professor of Hydrogeology California State University, Fullerton Department of Geological Sciences 1 Hydrogeology 101 The objective is to obtain
DYNFLOW accepts various types of boundary conditions on the groundwater flow system including:
 Section 6 Groundwater Flow Model A groundwater flow model was developed to evaluate groundwater flow patterns in the site area and to provide a basis for contaminant transport modeling. 6.1 Model Code
Supplemental Guide II-Delineations
 Supplemental Guide II-Delineations Contents Source Water Protection Area Delineation... 1 Delineation Criteria for Systems Using Groundwater Sources... 2 Time of Travel... 4 Flow Boundaries... 4 Delineation
Office of Land and Water Evaluations of Groundwater Resources of Southern Mississippi
 Office of Land and Water Evaluations of Groundwater Resources of Southern Mississippi Virtually all of the water used for public and domestic drinking water supplies in southern Mississippi is derived
Groundwater. Importance of Groundwater. The Water Table. Geol 104: Groundwater
 Groundwater Subsurface water contained in soil and bedrock. There is ~ 60 times as much water underground than in freshwater streams and lakes. Source of groundwater is rain and snow. Represents the infiltration
San Mateo Plain Groundwater Basin Assessment Stakeholder Workshop #8 17 APRIL 2018
 San Mateo Plain Groundwater Basin Assessment Stakeholder Workshop #8 17 APRIL 2018 PRESENTATION OVERVIEW Introductions Project Overview Summary of Analysis Supporting Model Development Model Development
Song Lake Water Budget
 Song Lake Water Budget Song Lake is located in northern Cortland County. It is a relatively small lake, with a surface area of about 115 acres, and an average depth of about 14 feet. Its maximum depth
POTABLE WATER SUPPLY DEFINITIONS
 Definitions POTABLE WATER SUPPLY DEFINITIONS AQUIFER. A porous, water-bearing geologic formation. Generally restricted to materials capable of yielding an appreciable supply of water. BASIN. A natural
Irrigation. Branch. Groundwater Quality in the Battersea Drainage Basin
 AGRICULTURE, FOOD AND RURAL DEVELOPMENT Irrigation Branch Groundwater Quality in the Battersea Drainage Basin Groundwater quality in the Battersea drainage basin was monitored between 1995 and 21 to characterize
Florida s Aquifers Florida s Great Unseen Water Resources
 Southwest Florida Water Management District West-Central Florida s Aquifers Florida s Great Unseen Water Resources The abundance of Florida s freshwater resources provides a great attraction for residents
Water Resources on PEI: an overview and brief discussion of challenges
 Water Resources on PEI: an overview and brief discussion of challenges Components: Components and links Atmospheric water Surface water (including glacial water) Groundwater Links: Precipitation (atm(
Groundwater basics. Groundwater and surface water: a single resource. Pore Spaces. Simplified View
 Groundwater and surface water: a single resource Santa Cruz River, Tucson Groundwater basics Groundwater is water found within the pore spaces of geologic material beneath the surface of the Earth. It
Groundwater 3/16/2010. GG22A: GEOSPHERE & HYDROSPHERE Hydrology
 GG22A: GEOSPHERE & HYDROSPHERE Hydrology Definitions Groundwater Subsurface water in soil or rock that is fully saturated. Aquifer Contains enough saturated material to yield significant quantities of
CHAPTER 13 OUTLINE The Hydrologic Cycle and Groundwater. Hydrologic cycle. Hydrologic cycle cont.
 CHAPTER 13 OUTLINE The Hydrologic Cycle and Groundwater Does not contain complete lecture notes. To be used to help organize lecture notes and home/test studies. Hydrologic cycle The hydrologic cycle is
Groundwater and surface water: a single resource. Santa Cruz River, Tucson
 Groundwater and surface water: a single resource Santa Cruz River, Tucson 1942 1989 1 Groundwater basics Groundwater is water found within the pore spaces of geologic material beneath the surface of the
East Maui Watershed Partnership Adapted from Utah State University and University of Wisconsin Ground Water Project Ages 7 th -Adult
 INTRODUCTION What is groundwater? Water contained in saturated soil and rock materials below the surface of the earth. It is not NEW water, but is recycled water through the hydraulic cycle. The source
WASA Quiz Review. Chapter 2
 WASA Quiz Review Chapter 2 Question#1 What is surface runoff? part of the water cycle that flows over land as surface water instead of being absorbed into groundwater or evaporating Question #2 What are
Model-Simulated Ground Water Elevation at the Green Spot Site (MW-4) Baseline Scenario (1992 to 2002)
 Baseline Scenario (1992 to 2002)") Big Bear Area Regional Wastewater Authority Analysis of Ground Water Flow Model Simulations for the Proposed Green Spot Artificial Recharge Site 6895 6885 6875 Model-Simulated Ground Water Elevation at
Big Bear Area Regional Wastewater Authority Analysis of Ground Water Flow Model Simulations for the Proposed Green Spot Artificial Recharge Site 6895 6885 6875 Model-Simulated Ground Water Elevation at
ENGINEERING HYDROLOGY
 ENGINEERING HYDROLOGY Prof. Rajesh Bhagat Asst. Professor Civil Engineering Department Yeshwantrao Chavan College Of Engineering Nagpur B. E. (Civil Engg.) M. Tech. (Enviro. Engg.) GCOE, Amravati VNIT,
The Impact of Nonpoint Source Contamination on the Surficial Aquifer of the Delmarva Peninsula
 The Impact of Nonpoint Source Contamination on the Surficial Aquifer of the Delmarva Peninsula Judith M. Denver National Water-Quality Assessment Program (NAWQA) September 28,2010 U.S. Department of the
Groundwater. Groundwater Movement. Groundwater Movement Recharge: the infiltration of water into any subsurface formation.
 On March 22, 2014, a major landslide occurred near Oso, Washington. Death toll currently at 30, with 15 still missing. Groundwater Before and After Swipe http://bit.ly/pen1jt N. Fork Stillaguamish River
Salt Water Intrusion in Coastal Aquifers March, 2015 L. Pilgrim, P.Geo.
 Salt Water Intrusion in Coastal Aquifers March, 2015 L. Pilgrim, P.Geo. Agenda 1. What is SWI? 2. What are the causes? 3. Indicator parameters of SWI 4. What is happening in our region? 5. Conclusions
A MODEL OF SEAWATER INTRUSION IN SURFICIAL AND CONFINED AQUIFERS OF NORTHEAST FLORIDA
 The Second International Conference on Saltwater Intrusion and Coastal Aquifers - Monitoring, Modeling, and Management. Mérida, Yucatán, México, March 30 - April 2, 2003 A MODEL OF SEAWATER INTRUSION IN
Watershed Management Area Recommendations for NJ Water Policy
 Watershed Management Area Recommendations for NJ Water Policy Presenters: William Kibler, Director of Policy, Raritan Headwaters Association Bob Kecskes, Freelance Environmental Consultant, retired NJDEP
Long Island: Water Resources. Water Sayings. Water Issues. Water Quality Issues specific to LI Coastal Areas. Agriculture and Water Regulation
 Water Sayings Long Island: Water Resources Copyright 2011 AFG 1 All living things need water to survive after air. Water, water everywhere but not a drop to drink. The quality of water is just as important
RUNNING WATER AND GROUNDWATER
 NAME RUNNING WATER AND GROUNDWATER I. Introduction In this exercise we will investigate various features associated with streams and groundwater. Our drinking water ultimately comes from either streams
Groundwater Flow Evaluation and Spatial Geochemical Analysis of the Queen City Aquifer, Texas
 Groundwater Flow Evaluation and Spatial Geochemical Analysis of the Queen City Aquifer, Texas Abstract The Queen City Aquifer is a saturated sandstone unit in the coastal plain of East Texas. The goals
4B.6 Desalination 4B Description of Option. Desalination of Lake Granbury Water for Johnson County Regional Plan.
 4B.6 4B.6.1 Description of Options Water demands in Johnson County are increasing at a very significant rate, while the existing supply from the Surface Water and Treatment System (SWATS) water treatment
Florida s Aquifers Florida s Great Unseen Water Resources
 Southwest Florida Water Management District West-Central Florida s Aquifers Florida s Great Unseen Water Resources The abundance of Florida s freshwater resources provides a great attraction for residents
Design Guideline for Gravity Systems in Soil Type 1. January 2009
 Design Guideline for Gravity Systems in Soil Type 1 January 2009 This page is intentionally blank. Design Guideline for Gravity Systems in Soil Type 1 January 2009 For information or additional copies
Numerical Groundwater Flow Model Report. Caloosa Materials, LLC 3323 Gulf City Road Ruskin, Florida 33570
 Numerical Groundwater Flow Model Report Caloosa Materials, LLC 3323 Gulf City Road Ruskin, Florida 33570 GHD 2675 Winkler Ave Suite 180 Fort Myers, FL 33901 11138224 Report July 27, 2017 Table of Contents
Issue paper: Aquifer Water Balance
 Issue paper: Aquifer Water Balance 1. Introduction And Background 1.1. Purpose and Scope The population in Kitsap County has grown rapidly in recent years and is expected to increase substantially in the
Florida Aquifer Geology
 Florida Aquifer Geology February 2017 Sampler Training Workshop Thomas Seal, ES III Watershed Monitoring Section (WMS) Water Quality Assessment Program DEAR Tallahassee Aquifer Basics Essential Definitions
Water for All, Now and Into the Future: Water Quantity in Wisconsin. A report by the Sierra Club-John Muir Chapter
 Water for All, Now and Into the Future: Water Quantity in Wisconsin A report by the Sierra Club-John Muir Chapter Table of Contents Background The Importance of Water Quantity Water Use in Wisconsin Excessive
USGS Groundwater Resources Program Regional Groundwater Evaluations
 USGS Groundwater Resources Program Regional Groundwater Evaluations -- Northern Atlantic Coastal Plain Aquifer System -- John Masterson* New England Water Science Center Northborough, Massachusetts Delaware
GROUNDWATER & SGMA 101
 GROUNDWATER & SGMA 101 Santa Cruz Mid-County GSA Public Orientation Workshop #1 Presenter: Derrik Williams, HydroMetrics Water Resources Inc. Thursday, October 5, 2017 Session Objectives 1. Understanding
Grounding Water: An Exploration of the Unseen World Beneath Our Feet
 1 Grounding Water: An Exploration of the Unseen World Beneath Our Feet Kerry Schwartz, Director, Arizona Project WET Protect Your Groundwater Day: Tuesday, September 9, 2014 What I Hope to Convey Groundwater
Florida Aquifer Geology
 Florida Aquifer Geology September 2017 Sampler Training Workshop Thomas Seal, ES III Watershed Monitoring Section (WMS) Water Quality Assessment Program DEAR Tallahassee Aquifer Basics Essential Definitions
Watershed: an area or ridge of land that separates waters flowing to different rivers, basins, or seas. It is the interdependent web of living
 Watershed: an area or ridge of land that separates waters flowing to different rivers, basins, or seas. It is the interdependent web of living organisms that inhabit a geographic area and depend on it
Little Cypress Bayou Special Study - Subwatershed 1.10
 - Subwatershed 1.1 Sabine River Authority of Texas August 31, 21 Prepared in Cooperation with the Texas Natural Resource Conservation Commission Under the Authorization of the Texas Clean Rivers Act Table
year within the area of Kings County (California Department of Water Resources, 1979).
.") 4.3 WATER RESOURCES 4.3 WATER RESOURCES This section describes the existing hydrological setting for the County, including a discussion of water quality, based on published and unpublished reports and
4.3 WATER RESOURCES 4.3 WATER RESOURCES This section describes the existing hydrological setting for the County, including a discussion of water quality, based on published and unpublished reports and
FACT FLASH. 5: Groundwater. What is groundwater? How does the ground store water? Fact Flash 5: Groundwater
 FACT FLASH 5: Groundwater What is groundwater? Groundwater is fresh water (from rain or melting ice and snow) that soaks into the soil and is stored in the tiny spaces (pores) between rocks and particles
Understanding the Water System
 W Water Is a Natural Resource Understanding the Water System Cost WATER QUALITY in KENTUCKY The Water Cycle Figure 1. Trends in Water Withdrawals and Population, 1950 to 1995. Millions of People/Billion
Florida Aquifer Geology
 Florida Aquifer Geology September 2016 Sampler Training Workshop Thomas Seal, ES III Watershed Monitoring Section (WMS) Water Quality Assessment Program DEAR Tallahassee Aquifer Basics Essential Definitions
5. Basin Evaluation Salt and Nitrate Balance
 SNMP Attachment B, Section B.2.1.3 (originally Section 5 in CV-SALTS Phase 2 Conceptual Model Task 5 deliverables) 5. As part of the evaluation of water quality the SNMP requires loading estimates and
Groundwater history and trends in Kuwait
 Sustainable Irrigation Management, Technologies and Policies II 153 Groundwater history and trends in Kuwait E. H. AlAli Kuwait Institute for Scientific Research, Kuwait Abstract In Kuwait, one of the
Why Care About Contaminants in Groundwater?
 Why Care About Contaminants in Groundwater? Subject/ target grade: Middle School (8 th grade) Earth Science Duration: Two 50 minute periods Setting: Classroom Materials and Equipment Needed: Per class
PEACE RIVER MANASOTA REGIONAL WATER SUPPLY AUTHORITY BOARD OF DIRECTORS MEETING December 5, 2018 ROUTINE STATUS REPORTS ITEM 1
 PEACE RIVER MANASOTA REGIONAL WATER SUPPLY AUTHORITY BOARD OF DIRECTORS MEETING December 5, 218 ROUTINE STATUS REPORTS ITEM 1 Hydrologic Conditions Report MEMORANDUM Project: Hydrologic Conditions Report
Ground- Water in the Clark Fork Basin
 Well 19142: 6N 19W 7 BABC- Ravalli County Ground- Water in the Clark Fork Basin Tom Patton, John LaFave, and Larry Smith Montana Ground-Water Assessment September 27, 26 The Ground-Water Assessment Program
Chapter 7 - Monitoring Groundwater Resources
 Chapter 7 - Monitoring Groundwater Resources Introduction Because of its hidden nature, virtually everything that is known about Marlborough s aquifers comes from indirect observations made at wells. The
HILTON HEAD WATER SUPPLY & SALTWATER INTRUSION. Beaufort County Council September 2012
 HILTON HEAD WATER SUPPLY & SALTWATER INTRUSION Beaufort County Council September 2012 HILTON HEAD S WATER UTILITIES Three public water, wastewater, reused water utilities on Hilton Head Formerly, 10 different
A Hydrologic Study of the North Hills, Helena, Montana
 A Hydrologic Study of the North Hills, Helena, Montana Andrew Bobst, Kirk Waren, James Swierc, and Jane Madison MBMG Groundwater Investigations Program 10/6/11 MT AWRA Background Groundwater Steering Committee
11 HYDROLOGY, HYDROGEOLOGY AND DRAINAGE
 11 HYDROLOGY, HYDROGEOLOGY AND DRAINAGE 11.1 introduction 11.1.1 The objective of this section and the statements presented is to assess the existing hydrological and hydrogeological conditions to understand
WELLHEAD PROTECTION DELINEATION REPORT FOR THE VILLAGE OF BEAR LAKE DECEMBER 2002
 WELLHEAD PROTECTION DELINEATION REPORT FOR THE VILLAGE OF BEAR LAKE DECEMBER 2002 Prepared by: Gosling Czubak Engineering Sciences, Inc. 1280 Business Park Drive Traverse City, Michigan 48686 Telephone:
Water Supply in Coastal Georgia Meeting Water Demand Using Alternative Water Sources to the Upper Floridan Aquifer
 Water Supply in Coastal Georgia Meeting Water Demand Using Alternative Water Sources to the Upper Floridan Aquifer John Clarke U.S. Geological Survey Georgia Water Science Center U.S. Department of the
KISSIMMEE RIVER & FISHEATING CREEK BASINS. Hydrogeological Setting
 KISSIMMEE RIVER & FISHEATING CREEK BASINS Hydrogeological Setting The three principal Florida aquifer systems - surficial, intermediate and Floridan - all exist beneath the entire Kissimmee River Fisheating
AQUIFERS OF THE NORTHERN NECK, VIRGINIA. by The SAIF Water Committee
 AQUIFERS OF THE NORTHERN NECK, VIRGINIA by The SAIF Water Committee July 2003 Technical Paper #1 ACKNOWLEDGMENTS The descriptions of the aquifers in this presentation are adapted from a body of work that
The Hydrologic Cycle (with emphasis on groundwater)
") The Hydrologic Cycle (with emphasis on groundwater) The Hydrologic Cycle (viewed in series of steps) 1. Water evaporates from bodies of surface water and from land 2. As moist air is lifted, it cools and
The Hydrologic Cycle (with emphasis on groundwater) The Hydrologic Cycle (viewed in series of steps) 1. Water evaporates from bodies of surface water and from land 2. As moist air is lifted, it cools and
Feasibility Study of Subsurface Seawater Intakes West Basin Municipal Water District s Proposed El Segundo Desalination Facility
 Feasibility Study of Subsurface Seawater Intakes West Basin Municipal Water District s Proposed El Segundo Desalination Facility November 16, 2015 Bureau of Reclamation Project No. R14AP00173 1 Outline
Assessment of the Groundwater Quantity Resulting from Artificial Recharge by Ponds at Ban Nong Na, Phitsanulok Province, Thailand
 Research article erd Assessment of the Groundwater Quantity Resulting from Artificial Recharge by Ponds at Ban Nong Na, Phitsanulok Province, Thailand SIRIRAT UPPASIT* Faculty of Technology, Khon Kaen
Surface Water and Seawater Interactions in the Coastal Environment of Biscayne Bay, Southeast Florida
 Surface Water and Seawater Interactions in the Coastal Environment of Biscayne Bay, Southeast Florida William C. Hutchings, MS, PG Nicholas Albergo, PE, DEE Paper No. 191-8 2005 Salt Lake City Annual Meeting
DRAFT. APPENDIX F Groundwater Flow Model Proposed El Segundo Desalination Facility
 APPENDIX F Proposed El Segundo Desalination Facility Proposed El Segundo Desalination Facility 1. GROUNDWATER FLOW MODEL Based on review of offshore and onshore hydrogeologic data including the Summer
GROUNDWATER AND GENEVA LAKE
 GROUNDWATER AND GENEVA LAKE INTRODUCTION For years it was assumed that groundwater was a significant source of water to Geneva Lake. Local folklore once contended that the water in Geneva Lake came all
Strategies for Managing Water Resources in Saltwater Intrusion Environments
 Hilton Head Public Service District Groundwater Management Associates, Inc. Strategies for Managing Water Resources in Saltwater Intrusion Environments Hilton Head Island and Vicinity Feet Below Mean Sea
Illinois State Water Survey Division
 Illinois State Water Survey Division GROUND-WATER SECTION SWS Contract Report 456 SUMMARY REPORT: REGIONAL ASSESSMENT OF THE GROUND-WATER RESOURCES IN EASTERN KANKAKEE AND NORTHERN IROQUOIS COUNTIES by
2016 ANNUAL ICR AND TRR WELL FIELD REPORT ICR WATER USERS ASSOCIATION
 2016 ANNUAL ICR AND TRR WELL FIELD REPORT Prepared for ICR WATER USERS ASSOCIATION Prepared By William Meyer 1 2016 ANNUAL ICR AND TRR WELL FIELD REPORT PURPOSE OF THE REPORT This report is one of an annual
Mapping of the Basseterre Valley Aquifer
 Mapping of the Basseterre Valley Aquifer Coastal Aquifer Management in Caribbean SIDS Workshop, St. Kitts-Nevis Halla Sahely, Ph.D., P.Eng St. Kitts Water Services Department October 11, 2010 Participating
Environmental Resource Inventories. What are ERIs? Significance of information How to use them
 Environmental Resource Inventories What are ERIs? Significance of information How to use them Environmental Resource Inventory - ERI Compiled by the environmental commission Information about the natural
Florida Aquifer Geology
 Florida Aquifer Geology February 2018 Sampler Training Workshop Thomas Seal, ES III Watershed Monitoring Section (WMS) Water Quality Assessment Program DEAR Tallahassee Aquifer Basics Essential Definitions
GROUNDWATER. Water Resources of NYS: The Nature of its Underground Water. Composite Groundwater Environment. Groundwater Resources of NYS
 Water Resources of NYS: The Nature of its Underground Water Prof. Anthony Grande AFG 2014 1 GROUNDWATER Groundwater - water occupying the pore spaces and cracks in rocks and unconsolidated material. The
GEOCHEMICAL IDENTIFICATION OF SALINE WATER FROM AN IRRIGATION WELL IN NORTH-CENTRAL STAFFORD COUNTY, KANSAS
 GEOCHEMICAL IDENTIFICATION OF SALINE WATER FROM AN IRRIGATION WELL IN NORTH-CENTRAL STAFFORD COUNTY, KANSAS a report for the Kansas Corporation Commission by Donald O. Whittemore Kansas Geological Survey
Natural Resources & Environmental Stewardship
 Natural Resources & Environmental Stewardship Fundamentals of Nutrient Management Melissa L. Wilson Department of Environmental Science & Technology Ag Nutrient Management Program University of Maryland,
MENDOCINO WATER RESOURCES AND WATER CONSERVATION
 MENDOCINO WATER RESOURCES AND WATER CONSERVATION MENDOCINO S LIMITED GROUNDWATER SUPPLY The Town of Mendocino is located on the Mendocino Headlands along the Pacific Coast in Mendocino County, California
CLECO POWER LLC DOLET HILLS POWER STATION ASH BASIN NO. 2 MANSFIELD, LA
 CLECO POWER LLC DOLET HILLS POWER STATION ASH BASIN NO. 2 MANSFIELD, LA for the Coal Combustion Residuals Rule October 2018 TABLE OF CONTENTS Section Page No. 1.0 INTRODUCTION... 1 2.0 FACILITY INFORMATION...
Florida Department of Environmental Protection. Bureau of Mining and Minerals Regulation. Regulation of Mines. Howard J. Hayes, Program Administrator
 Florida Department of Environmental Protection Bureau of Mining and Minerals Regulation Regulation of Mines Howard J. Hayes, Program Administrator April 2011 What is a mine? Nonphosphate mine: Subsections
Virginia Coastal Plain Model 2004 Withdrawals Simulations Reported Use
 1/43 Virginia Coastal Plain Model 24 Withdrawals Simulations 24 Reported Use A Virginia Coastal Plain Model ( VCPM ) simulation was performed representing the withdrawals reported to DEQ for calendar year
Numerical Modeling of Groundwater Flow in the Navajo Sandstone Aquifer at the Tuba City, Arizona, Disposal Site 15167
 Numerical Modeling of Groundwater Flow in the Navajo Sandstone Aquifer at the Tuba City, Arizona, Disposal Site 15167 ABSTRACT Richard Bush*, Timothy Bartlett** *US DOE, Office of Legacy Management **Stoller
Aquifer Is More Sponge Than Lake
 The stream that is the back border of my property is Black Creek (see below). Aquifer Is More Sponge Than Lake BY CLARK COX: Senior Writer Middendorf Aquifer: It s an esoteric name, but that hasn t kept
USGS Virginia Water Science Center: Scientific Support to the Virginia Department of Environmental Quality Groundwater Withdrawal Permitting Program
 USGS Virginia Water Science Center: Scientific Support to the Virginia Department of Environmental Quality Groundwater Withdrawal Permitting Program Reported and Estimated Withdrawals for Virginia Coastal
Synopsis. Geoffrey R. Tick Dorina Murgulet Hydrogeology Group The University of Alabama UA Project Number Grant # 09-EI UAT-2
 Assessment of Groundwater Flow Paths and Discharge to the Coastal Region of Baldwin County, Alabama to Understand Contaminant Transport using a Cross- Sectional Groundwater Flow and Transport Synopsis
Irrigation modeling in Prairie Ronde Township, Kalamazoo County. SW Michigan Water Resources Council meeting May 15, 2012
 Irrigation modeling in Prairie Ronde Township, Kalamazoo County SW Michigan Water Resources Council meeting May 15, 2012 Development of a Groundwater Flow Model INFLOWS Areal recharge from precipitation
MEMORANDUM. Kathy Yager USEPA OSRTI Dick Goehlert USEPA Region 1 Darryl Luce USEPA Region 1 Mindy Vanderford, GSI Environmental, Inc.
 MEMORANDUM To: From: Kathy Yager USEPA OSRTI Dick Goehlert USEPA Region 1 Darryl Luce USEPA Region 1 Mindy Vanderford, GSI Environmental, Inc. (GSI) Doug Sutton, GeoTrans, Inc. Rob Greenwald, GeoTrans,
Groundwater and Groundwater Surface Water Interaction: How Does It Work?
 Napa Valley Groundwater Advisory Committee February 23, 2012 Groundwater and Groundwater Surface Water Interaction: How Does It Work? Thomas Harter University of California, Davis ThHarter@ucdavis.edu
Climate Change and the Delaware Estuary Appendix K PDE Figure 1: Groundwater/Seawater Interaction (Source: USGS)
") Appendix K Climate Change Impacts on Water Supply Wells in the Delaware River Estuary James Bennett, Delaware Valley Regional Planning Commission July 2009 One of the many threats that climate change and
Appendix K Climate Change Impacts on Water Supply Wells in the Delaware River Estuary James Bennett, Delaware Valley Regional Planning Commission July 2009 One of the many threats that climate change and
Geoenvironmental impact assessment of a landfill for solid chemical wastes
 ALOJZY SZYMAŃSKI, ZBIGNIEW LECHOWICZ, KAZIMIERZ GARBULEWSKI Department of Geotechnical Engineering, Warsaw Agricultural University SGGW, Poland Geoenvironmental impact assessment of a landfill for solid
SALINISATION OF THE NORTHERN COASTEL AREA OF THE NETHERLANDS DUE TO LAND SUBSIDENCE AND SEA LEVEL RISE
 SALINISATION OF THE NORTHERN COASTEL AREA OF THE NETHERLANDS DUE TO LAND SUBSIDENCE AND SEA LEVEL RISE PERRY DE LOUW AND GUALBERT OUDE ESSINK TNO Geological Survey of the Netherlands P.O. Box 815, 358TA
groundwater. Because watersheds are complex systems, each tends to respond differently to natural or human activities.
 The private development of Altos del María is located at an altitude between 550 and 1,000 meters above sea level in the environmentally sensitive Cordillera Central of Panama that separates the Pacific
Effluent Disposal Feasibility Alternatives Study of Morro Valley
 Final Report Effluent Disposal Feasibility Alternatives Study of Morro Valley Morro Bay, California Prepared for Michael K. Nunley & Associates and the City of Morro Bay August 2016 Prepared by Table of
Groundwater Training Course SOPAC, April Island Groundwater Resources
 Groundwater Training Course SOPAC, April 2005 Island Groundwater Resources Outline of Presentation Freshwater resources of islands Water use Factors affecting freshwater resources Water resource management
Groundwater Flow Demonstration Model Activities for grades 4-12
 Groundwater Flow Demonstration Model Activities for grades 4-12 NR/WQ/2012-5 SET-UP Please allow time to practice using the groundwater model before conducting demonstrations. 1. Remove the groundwater
How & Where does infiltration work? Context: Summary of Geologic History Constraints/benefits for different geologic units
 Associated Earth Sciences, Inc. Associated Earth Sciences, Inc. Presented by: Matthew A. Miller, PE April 23, 2013 How & Where does infiltration work? Context: Summary of Geologic History Constraints/benefits