CITY OF BRANTFORD GROWTH MANAGEMENT STRATEGY MHBC PLANNING
|
|
|
- Blaise Farmer
- 6 years ago
- Views:
Transcription
1 CITY OF BRANTFORD GROWTH MANAGEMENT STRATEGY MHBC PLANNING April 18, 2006
2 TABLE OF CONTENTS Executive Summary...i Introduction...1 Part A The Identification of Land Needs...2 Factors Affecting Growth Trends in the City of Brantford...2 The Policy Framework for Continued Growth...2 Growth Strategy Timeframe...4 Population, Household and Employment Projections...6 Consideration of Growth Scenarios within the Existing City of Brantford Boundary...7 Industrial Development Capability within Existing City Municipal Boundary...9 Industrial Employment Projections to Industrial Land Needs to Future Greenfield Residential Density Targets...12 Residential Land Needs to 2046 Existing Planning Scenario A...14 Residential Land Needs Compact City Scenario B...15 Part B Analysis of Alternative Growth Directions...17 Potential Growth Area Directions...17 The Scale of Potential Growth Areas...18 Growth Area Evaluation Criteria...19 The Weighting of Evaluation Criteria...20 Growth Area Direction Discussion...21 Part C Conceptual Land Use Allocation...23 Part D Water and Wastewater Servicing Assessment...25 Conclusion...28
3 City of Brantford Growth Management Strategy April 2006 i CITY OF BRANTFORD Growth Management Strategy EXECUTIVE SUMMARY PART A THE IDENTIFICATION OF LAND NEEDS Factors Affecting Growth Trends in the City of Brantford Brantford is a diverse urban growth centre characterized by successful business park expansion, employment growth, robust residential development and intensification, an expanding downtown higher education campus, and a location integrated with the Provincial 400-series highways. The Policy Framework for Continued Growth The Provincial Greater Golden Horseshoe Places to Grow Plan includes the City of Brantford as an Urban Growth Centre within an integrated growth management concept designed to accommodate significant growth to the year The Plan provides for a strong policy framework of economic development, livable and complete communities, environmental protection, resource management, comprehensive transportation improvements and infrastructure investment. Growth Strategy Timeframe Forty years is an appropriate (and perhaps minimum) growth strategy time frame to consider long-term municipal boundaries and major public infrastructure investment.
4 City of Brantford Growth Management Strategy April 2006 ii Population, Household, and Employment Projections The population of the City of Brantford is projected to increase from 93,000 in 2006 to 155,000 in 2046, and employment from 43,000 (2006) to 82,000 in Growth Scenarios within the Existing City The Existing Planning Scenario A would accommodate 124,000 people at buildout to City boundaries (2026), resulting in a need to accommodate another 31,500 people to The Compact City Scenario B (based on the density targets of the proposed Places to Grow Plan) would accommodate 139,000 people at buildout to City boundaries (2036) resulting in a need to accommodate another 15,000 people to Industrial Development Capacity within the Existing City The Northwest Industrial Area and the Braneida Industrial Park have an estimated 312 (2005) vacant net hectares remaining, capable of accommodating another 6,862 jobs at the City s existing employment density of 22 employees per net hectare. 15,000 new industrial jobs are required to Industrial Land Needs to 2046 At the current City net employment density, the shortfall of 8,100 industrial jobs (i.e. 15,000 projected 6,862 in City = 8,100 +/- shortfall) would require 371 net hectares, or 495 gross hectares, beyond City boundaries. Residential Land Needs to 2046 Residential land requirements beyond City boundaries range from 493 gross hectares (Scenario B Compact City) to 1,071gross hectares (Scenario A Existing Planning Scenario) not including natural features.
5 City of Brantford Growth Management Strategy April 2006 iii PART B ANALYSIS OF ALTERNATIVE GROWTH DIRECTIONS Potential Growth Area Identified and Assessed Seven potential growth areas were identified surrounding the City of Brantford. These areas were assessed relative to developable land area and evaluation criteria, including agricultural resources, mineral aggregate resources, environmental features, wellhead protection, sanitary and water servicing, transportation accessibility and community integration. The Preferred Growth Direction Area 1 (north) achieved the highest rank in an overall consideration of the evaluation criteria. Area 1 has a lower potential to be considered specialty crop lands when compared to lands to the southeast, southwest and west of the City. Unlike Area 7, Area 1 is mostly unconstrained by sand and gravel resources of primary significance. All seven areas exhibited environmental/natural features to a greater or lesser extent. Area 1 contains tributaries to Fairchild Creek. This natural system would be preserved as an open space system. Area 2 is highly impacted by the meander belt of Fairchild Creek, is bisected by numerous drainage tributaries and as a result, has a very rolling topography. Area 1 is not subject to wellhead protection policies (such as apply to Area 5). Area 1 has one of the least impacts on the existing sanitary and water system servicing capacities since the lands can be serviced from the two major trunk sanitary sewers (i.e. east and west) and from two existing water pressure zones (Zone 2/3 and Zone 4), thus reducing the need for major pipe upgrades and pumping/storage facilities. Area 1 ranks highest relative to transportation/accessibility, given existing north-south arterial road connections (Oak Park Road, Paris Road/Brant Avenue, King George Road/Highway 24 and Wayne Gretzky Parkway) with interchanges to Highway 403. Powerline Road and County Road 5/99 provide good west to east connections. The expansion of the northwest industrial node will increase the feasibility of transit service. Area 1 also achieves a high rank for community integration given the potential to naturally
6 City of Brantford Growth Management Strategy April 2006 iv extend industrial and residential development to the north of existing industrial and residential areas. There is a good potential to achieve a high level of integration relative to road patterns, transit service, pedestrian system, and commercial, recreational and school facilities. Extension of future development into Area 1 would also avoid some of the more significant County of Brant Settlement Areas bordering the City. The above indicates a logical preference for Area 1. However, this should not be viewed as ruling out the possibility of more minor boundary adjustments and rounding out in other areas. One such example might be the small industrial designation at the Garden Avenue/Highway 403 interchange.
7 City of Brantford Growth Management Strategy April 2006 v PART C: CONCEPTUAL LAND USE ALLOCATION Preliminary conceptual land use plans have been prepared which approximately relate land need to land areas; Industrial Business Park 570 gross hectares Residential Compact Scenario 493 gross hectares Residential Existing Planning Scenario 938 gross hectares The concepts would locate industrial lands in the west part of Area 1 in order to expand on the Northwest Industrial Park in proximity to Highway 403. Residential development is shown immediately north of Brantford s existing residential neighbourhoods with the ability to achieve a high level of integration with same.
8 City of Brantford Growth Management Strategy April 2006 vi PART D: WATER AND WASTEWATER SERVICING COSTS An assessment of the existing water and wastewater system capacities was performed to determine upgrading requirements and costs to accommodate the water and wastewater servicing demands of the preferred growth area (Area 1) at the following three critical stages of development: Scenario 1: 2036 Intensified Build-Out of the present City Scenario 2: Development of Area 1 to the 2046 Scenario 3: Buildout of Area 1 beyond 2046 The total investment in infrastructure to serve the above scenarios will be in the order of $150 million over a 40 year period including a $ 50 million expansion to the Wastewater Treatment Plant in 2026 and a $ 50 million expansion to the Water Treatment Plant in 2026.
9 City of Brantford Growth Management Strategy March INTRODUCTION The City of Brantford retained Earth Tech and MHBC Planning to conduct a Growth Management Strategy to identify long-term land use requirements for the City of Brantford. The City commissioned this study given a desire to plan comprehensively for the long-term within a context of limited land resources, increasing growth pressures, and a need to facilitate continued employment and economic health. The consultant team includes expertise in municipal planning, civil engineering, transportation planning, environmental analysis, agricultural analysis, and aggregate resource planning. This report is organized into the following headings: Part A: Identification of Land Needs. Part B: Analysis of Alternative Growth Directions. Part C: Conceptual Land Use Allocation.
10 City of Brantford Growth Management Strategy March PART A: THE IDENTIFICATION OF LAND NEEDS Factors Affecting Growth Trends in the City of Brantford Brantford is a diverse urban growth centre characterized by successful business park expansion, employment growth, robust residential development and intensification, an expanding downtown higher education campus, and a location integrated with the Provincial 400-series highways. Within the last 10 years a number of factors have combined to accelerate the role of Brantford as an urban growth centre. Brantford is a centre for residential, employment, institutional, and commercial growth. Over the five-year period from 2000 to 2004, municipal and private industrial land sales averaged 49 hectares (121 acres) per year, reflecting the impact of the completion of Highway 403. Residential building permits have been steadily increasing from 255 in 2001, to 556 in 2004, to 594 in Approximately 37 percent of residential units has been in the form of intensification between the years 2001 and Laurier University/Brantford and the affiliated campuses of Nipissing University and Mohawk College have continued to increase in enrollment and are transforming downtown Brantford. Brantford s strong locational advantages are anticipated to improve in the future as transit and highway connections to the Greater Golden Horseshoe continue to be expanded. The Policy Framework for Continued Growth The Provincial Greater Golden Horseshoe Places to Grow Plan includes the City of Brantford as an Urban Growth Centre within an integrated growth management concept designed to accommodate significant growth to the year The Plan provides for a strong policy framework of economic

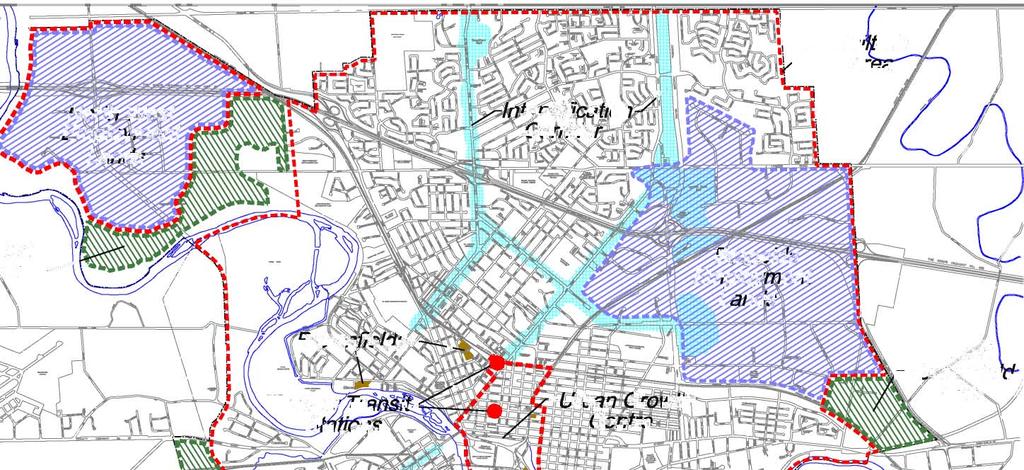
11 City of Brantford Growth Management Strategy March development, liveable and complete communities, environmental protection, resource management, comprehensive transportation improvements and infrastructure investment. The proposed Places to Grow Plan for the Greater Golden Horseshoe, includes the City of Brantford within the outer ring of municipalities expected to accommodate an additional one million population by Brantford is one of only nine Urban Growth Centres situated within the outer ring and well located just beyond the Greenbelt and in proximity to other major growth centres. The following map focuses on that part of the proposed Places to Grow Plan that relates to Brantford.
12 City of Brantford Growth Management Strategy March The plan designates the downtown as an Urban Growth Centre. The built-up area designation encompasses the majority of the lands within the City s boundaries. Designated growth areas include 4 greenfield sites within the City s boundaries as well as additional designated growth areas located immediately to the north of the City s boundaries. The Paris urban area is also indicated to the north west of the City. A Future Goods Movement Corridor is located east of the City. While shown as conceptual, this Corridor intersects with Highway 403 and would provide a major corridor connecting the City to the GTA and the Gateway Economic Zone identified at the Fort Erie/USA border crossing. The concept of connecting the goods movement corridor with Highway 403 will further enhance Brantford s strategic growth location in Southern Ontario. Improved Inter-regional Transit links are identified between the Brantford Urban Centre and the Hamilton Urban Centre and Cambridge Urban Centre. The identification of this transit system link provides the framework for future transit investment decisions in the Greater Golden Horseshoe. The existing major highway (Highway 403), goods movement corridor, and improved inter-regional transit links identified in the Places to Grow Plan improve and expand upon Brantford s strong location advantages within the Greater Golden Horseshoe. Growth Strategy Timeframe Forty years is an appropriate (and perhaps minimum) growth strategy time frame to consider long-term municipal boundaries and major public infrastructure investment. In preparing a growth strategy, a longer term view is required to ensure municipal boundaries are established for reasonable lengths of time, to allow sufficient surplus lands to satisfy economic and other growth needs, and to adequately plan for and fund major public infrastructure investments.
13 City of Brantford Growth Management Strategy March The Places to Grow Plan timeframe is to the year However, when preparing growth strategies that may affect long-term infrastructure investments, municipalities often review growth needs within a longer time frame. In 2001, the Ontario Professional Planners Institute (OPPI) commissioned a policy development paper on growth management. The paper entitled Exploring Growth Management Roles in Ontario: Learning from Who Does What Elsewhere, assessed current efforts in North America and provided direction with respect to current growth management initiatives in Ontario. It concluded that 20-year growth boundaries are not an effective growth management strategy on their own. It recommended that a 5-year, 20-year and 50-year perspective to growth management is needed, to provide for long-term infrastructure investment, and coordination between rural and urban areas. Examples of longer term growth management perspectives include: The Region of Waterloo Growth Management Strategy adopted by Regional Council in June 2003 providing a framework to guide growth in Waterloo Region to a target year of Initiated in 2001, the growth strategy had a 40-year time horizon. The Region of Peel is undertaking a growth management strategy to consider the long-term (to 2051) impacts of demographic and socioeconomic changes combined with high levels of growth, on the programs and services delivered by the Region. The City of London completed background studies as part of a growth management review that identified a 50-year servicing boundary. For the purposes of the Brantford Growth Strategy, a 40-year time frame is recommended to the year This also assumes that at 2046 there should be a minimum 10 year ability to accommodate residential growth (in keeping with Section of the Provincial Policy Statement.
14 City of Brantford Growth Management Strategy March Population, Household, and Employment Projections The population of the City of Brantford is projected to increase from 93,000 in 2006 to 155,000 in 2046, and employment from 43,000 (2006) to 82,000 in The City of Brantford has completed population, household, and employment projections to the years 2031 and 2046 (see Appendix 1). These projections are based on the work carried out by CN Watson & Associates as part of the Development Charges Background Study that was completed in Three alternative forecasts, low; reference; and high, were prepared by CN Watson & Associates using a housing market-based model to forecast future housing units and population and are differentiated on the basis of the assumptions used on the level of future new residential construction in Brantford. The table below provides a comparison of the C.N. Watson forecasts and the City of Brantford forecasts: C.N. Watson & Associates Low Residential Growth Reference Residential Growth High Residential Growth 2006 Official Plan Review Program Development Charges Reference Forecast Growth Assumption (residential units/year) Current Trends Forecast 575 Growth Management Forecast 650 For the purposes of the City s new forecasts, the C.N. Watson Low Forecast scenario was discarded as it does not appear relevant to conditions and trends in Brantford. The High Residential Forecast was renamed the Current Trends Forecast, as it reflects recent growth in the City. There are many factors that point to higher growth rates for Brantford than what has been experienced in the mid-term past. Based on these considerations, the City prepared a new forecast called the growth management forecast. The growth management forecast is based on approximately 650 new residential units per year
15 City of Brantford Growth Management Strategy March to The 2031 forecast was then extended to 2046, the timeline for this growth strategy. This forecast reflects increased levels of residential construction in Brantford, the high level of industrial development within Brantford (such as the Ferrero plant with its first phase employment of 600 employees), as well as new industrial-related opportunities in nearby communities such as Woodstock (the new Toyota automotive assembly plant). In addition, favourable house prices in Brantford, the development of post-secondary education facilities, and the entrance of large scale GTA home builders into the local housing market are all factors which support the growth management forecast. Consideration of Growth Scenarios within the Existing City of Brantford Boundary The following graph provides a summary of the growth management population forecast from 2001 to 2046: , , Compact City Scenario B: 139,000 people (+15,000 people) 132, ,000 Population (in thousands) Existing Planning Scenario A: 124,000 people 86,000 86,000 93,000 93,000 New Official Plan Time Horizon to 2031 Complete buildout of industrial land by 2021 Buildout of low density housing supply by 2023 Population Buildout A Population Buildout B Years 20 Year PPS Time Horizon 25 Year Places to Grow Time Horizon 40 Year Long-Term Growth Strategy
16 City of Brantford Growth Management Strategy March This forecast results in an increase of 62,500 people (67% increase) over the 40- year growth strategy time frame. Two development scenarios have been identified for build-out of the land capacity within existing City of Brantford municipal boundaries: CITY CAPACITY SCENARIOS Existing Planning Scenario A Growth based on densities in the City s existing development inventory Compact City Scenario B Growth based on the Province s Proposed Places to Grow Plan densities Existing Planning Scenario A is based on existing inventories of known infilling projects as well as current estimates of development in residential greenfield areas. Planning Scenario A would result in an ultimate population at total build-out to City boundaries of approximately 124,000 people. The Compact City Scenario B is based on the intensification and density targets contained within the draft Places to Grow Plan. For example, the capacity of greenfield areas has been adjusted based on 50 people or jobs per gross hectare. Downtown density has been estimated at 150 people or jobs per hectare. A minimum of 40% of future residential units have been assumed to be provided through intensification within the built-up area. The Compact City Scenario would add additional capacity of 15,000 people over existing Planning Scenario A within the City s existing boundaries (see Appendix 2). However, this would be achieved at a substantial change to housing mix / density types. For example, the following table compares the City s projected demand for housing by density type relative to the housing distribution, which results from the Compact City Scenario:
17 City of Brantford Growth Management Strategy March Current City Density Distribution Target Places to Grow Impact on Density Distribution Low Density 75% vs. 47% Medium Density 15% vs. 22% High Density 10% vs. 31% Based on current projected housing demand, it is anticipated that the lower density forms of housing (single detached and semi-detached) would be completely builtout in approximately 17 years (i.e. by 2023). This would leave a long-term shortfall of new low density housing in the remaining 23 years to Potential implications of a shortfall of low density housing include: An inability to satisfy Section of the Provincial Policy Statement, which requires provision of an appropriate range of housing types and densities to meet projected requirements of current and future residents; Impact on availability and affordability of single and semi-detached units; Difficulties in achieving the concept of complete communities (as per Places to Grow Plan), which by definition includes a full range of housing ; Changes in commuting patterns wherein single detached homebuyers choose to drive further to satisfy their housing preference; Potential impact on ability to achieve Provincial growth targets given not all housing needs are being satisfied. Industrial Development Capability within Existing City Municipal Boundary The two main industrial employment areas are the north-west industrial area, and the Braneida Park industrial area. Both are favourably located at interchanges of Highway 403.
18 City of Brantford Growth Management Strategy March The following table provides a summary of the existing inventory of vacant industrial land within these two industrial parks by city owned and privately owned land parcels. ADDITIONAL INDUSTRIAL EMPLOYMENT CAPACITY IN BRANTFORD S INDUSTRIAL PARKS (based on 22 employees per net hectare ) LOCATION NORTH-WEST INDUSTRIAL AREA CITY OWNED PRIVATELY OWNED TOTAL TRAFFIC ZONE HA JOBS HA JOBS HA JOBS , ,954 BRANEIDA INDUSTRIAL AREA , , ,908 TOTAL , , ,862 Source: City of Brantford Vacant Industrial Land map May 2005 (see Appendix 10) 1 Average Brantford industrial park density = 22 employees/net hectare gross hectares (487.3 acres) for parcels 1,2,3,12,13,14 reduced by 49.3 ha (25%) to equal net ha to account for future roads, storm water management, and topographic constraints related to previous aggregate extraction. (147.9 net ha + parcels 5,7,8 & 11 = 17.0 ha = 164.9) Complete build-out of these remaining industrial areas, and the resulting jobs which could be accommodated, are based on an employment density of 22 employees

19 City of Brantford Growth Management Strategy March per net hectare. This density is the current City of Brantford average employee density within the City s developed industrial parks. The table identifies a remaining inventory of 312 vacant industrial hectares, capable of accommodating approximately 6,862 additional industrial jobs. Industrial Employment Projections Employment projections prepared by the City of Brantford are summarized in the following graph. Approximately 40,000 new jobs are anticipated. Of these, approximately 15,000 will be industrial jobs requiring an industrial park location. CITY OF BRANTFORD EMPLOYMENT FORECASTS BY SECTOR A comparison of the long-term projection of an additional 15,000 industrial jobs relative to the existing vacant industrial land capacity within the City (6,862 jobs), results in a shortfall of land required to accommodate approximately 8,100 jobs. A literal application of the remaining available land would suggest a complete buildout of industrial land within City boundaries by the year 2021 (i.e. 15 years). However, as the industrial land supply continues to decrease and selection of sites become limited in respect to competitive prices, and choice of lot sizes and locations, industrial land opportunities will likely be significantly constrained within 5 to 8 years.
20 City of Brantford Growth Management Strategy March Industrial Land Needs to 2046 The previous analysis identified a shortfall in land to accommodate 8,100 industrial jobs to the year 2046, within existing City of Brantford boundaries. At current City net employment densities of 22 jobs per hectare, this would result in a requirement for 371 net hectares beyond the current City boundaries. In order to determine the amount of gross industrial park area required (not including environmentally sensitive non-developable areas) a ratio of 3 net hectares to 4 gross hectares has been utilized. The difference between net and gross would include a combination of the area taken up by municipal roads, storm water management facilities, and topographic limitations. Using this ratio, approximately 495 gross hectares of additional industrial land to 2046 are required. It is conceivable that the current density of employees per hectare could intensify over the planning period. However, this needs to be balanced against ensuring a sufficient amount of land to accommodate unforeseen economic attraction contingencies. Such contingencies, which are difficult to predict, might include a demand for larger lot sizes and the attraction of significant industries, fluctuations/increases in demand from time to time, and having a sufficient ongoing supply to provide choice and flexibility in industrial attraction and retention efforts. Care should be taken in limiting the amount of land based on excessive employment density targets. Industrial parks tend to have a range of densities depending upon the type and function of industrial use (i.e. warehousing, light assembly, intense industrial), the age/maturity of the industry, potential expansions to same, impacts of automation, the desire for single floor operations, and the relative health of the economy with respect to hiring and layoffs. Brantford is attracting many logistic related industries due to its highway accessibility. Logistic industries support the integrated manufacturing economy of Southern Ontario. However, logistic operations generally yield lower employment densities.
21 City of Brantford Growth Management Strategy March The recent announcement of the Toyota automobile manufacturing plant in Woodstock proposes 2,000 jobs on a site of approximately 400 hectares. This yields an employment density of 5 employees per hectare, or only one tenth of the Places to Grow Plan target of 50 jobs per hectare. Yet, the need to accommodate such a facility cannot be denied given the positive economic impact and spin-off jobs that will result. An example of differing employment densities is illustrated by the recent attraction of two industries to the City. Proctor and Gamble and Ferrero each occupy the same square footage of building (approximately 750,000 sq.ft.), but one employs about 300 while the other employs 600. These variations could not be predicted at the Official Plan stage and cannot be controlled through planning regulatory mechanisms. Another example of industrial employment density is the average of 28 jobs per hectare in Waterloo Region. Perhaps minimum building coverage targets can be established. However, even this approach should be tempered by the realization that industries may buy more land than they initially build on, given a desire to provide for future expansion on the same site. Future Greenfield Residential Density Targets In determining the additional land required to accommodate residential development beyond City boundaries, a target density of 50 persons and jobs per hectare (as per the Places to Grow Plan) was assumed. In order to estimate the relative proportion of other land uses (i.e. commercial and institutional), the proportion of population to jobs in the developed residential neighbourhoods in north Brantford were identified:
22 City of Brantford Growth Management Strategy March Population and Jobs by Traffic Zone in North Brantford Residential Neighbourhoods Traffic Zone Population Jobs Total 2 2,647 1,170 3, , , , , , , , ,544 Total 25,600 3,495 29,095 Percentage 12% 88% 100% 50/hectare Therefore, to provide for related commercial and institutional uses in greenfield areas the density target of 50 has been further refined to a combination of 6 jobs and 44 persons per gross hectare. Residential Land Needs to 2046 Existing Planning Scenario A The extent of the residential land shortfall within City boundaries covers a range depending on which scenario is used. The existing current Planning Scenario A would accommodate 124,000 people within the City of Brantford boundaries. Given the population projection of 155,500 to the year 2046, this would result in a population capacity shortfall of 31,500 people. At a derived Places to Grow density of 44 persons and 6 jobs per hectare for greenfields, approximately 716 gross hectares would be required beyond current City boundaries to One of the difficulties in estimating land needs to a set date (i.e. 2046) is the assumption that the resulting calculation provides for no additional developable land beyond that time period. For example, the above 716 hectares would be completely utilized by The Provincial Policy Statement (Section 1.4.1) requires planning authorities to, maintain at all times the ability to accommodate residential growth for a minimum of 10 years. As the 2046 time period
23 City of Brantford Growth Management Strategy March approaches and 5-year reviews of the Brantford Official Plan are conducted, the need to address this policy will become increasingly urgent. Thus 10 to 15 years before 2046 the minimum requirement for an additional 10 year supply will need to be addressed. Providing for an additional 10 year residential land supply at 2046 would require providing for an additional population of 15,600, which at 44 persons per gross hectare would equal another 355 hectares. In summary the additional residential land requirements for Existing Planning Scenario A were calculated as follows: 2046 population projection: Scenario A City build-out population: Population shortfall to 2046: Gross residential hectares required: (31,500 shortfall ) 44 persons/hectare) Provide for additional 10 year supply at 2046: (15,600 population ) 44 persons/hectare) Total Scenario A Residential Land Required: 155,500 persons 124,000 persons 31,500 persons 716 gross hectares 355 gross hectares 1,071 gross hectares Residential Land Needs to 2046 Compact City Scenario B The Compact City Scenario B would accommodate 139,000 people within City of Brantford boundaries (See Appendix 2). The following provides a summary of calculations to determine the additional longer term residential land requirements to 2046: 2046 population projection: Scenario A City build-out population: Population shortfall to 2046: Provision of an additional 10 year supply at 2046 for a population of: Total additional population planned for: 155,500 persons 139,000 persons 16,500 persons 15,600 persons 32,100 persons
24 City of Brantford Growth Management Strategy March Estimated number of dwelling units at 2.51 people per unit: 40% of units through intensification: 60% of units in new greenfields: 7,673 new greenfield units are equivalent to: Unit Density Type % total units # of units People /unit Estimated population Low 75% 5, ,265 Medium 15% 1, ,878 High 10% ,534 TOTAL 100% 7,673 21,677 12,789 units 5,116 units 7,673 units 21,677 persons Total Scenario B Residential Land Required: (21,677 persons ) 44 persons/hectare) 493 gross hectares Therefore, depending on which scenario and densities are applied, an additional residential land area of approximately 493 to 1,071 gross hectares are required beyond existing City boundaries.
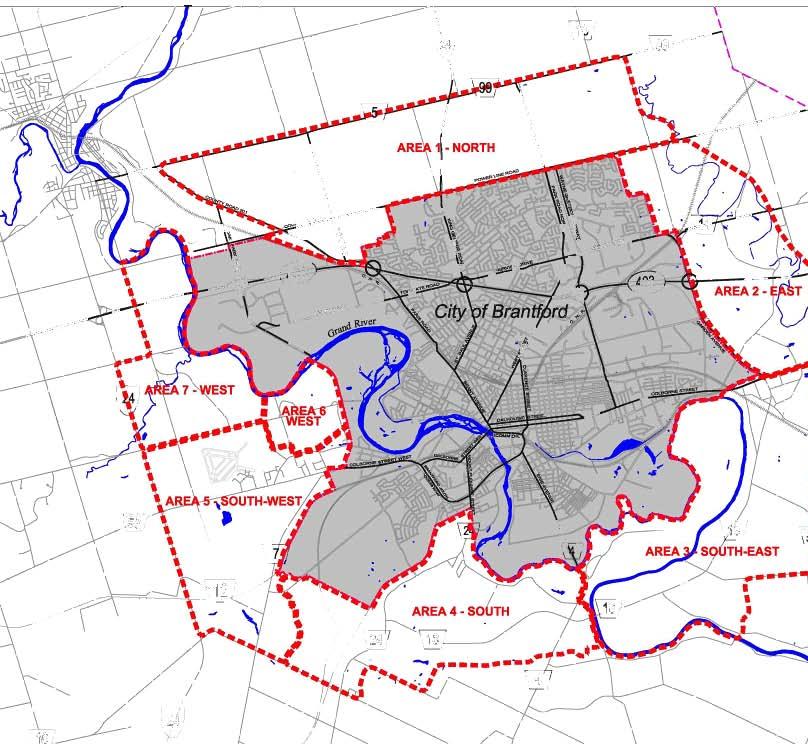
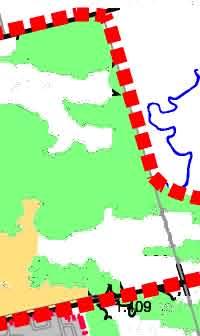
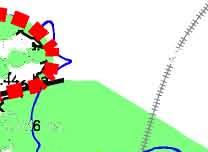
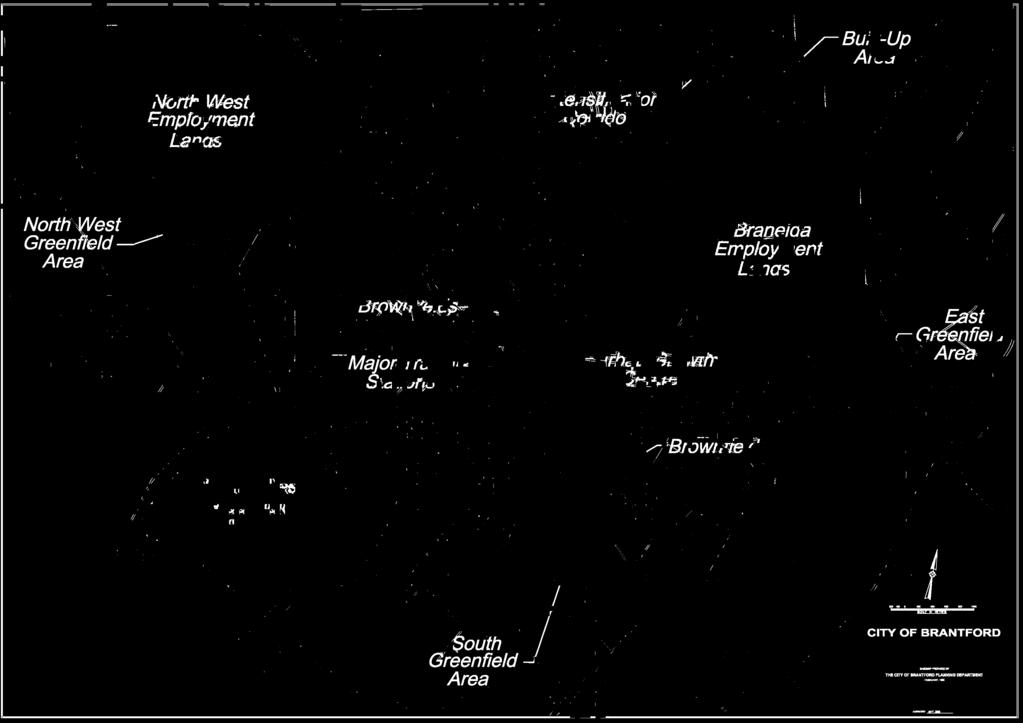
25 City of Brantford Growth Management Strategy March PART B: ANALYSIS OF ALTERNATIVE GROWTH DIRECTIONS Part A of this report identified a need for additional industrial business park and residential land, beyond the build out capacity within existing City boundaries. The City of Brantford is surrounded by one municipality, the County of Brant. Potential growth expansions to the year 2046 would therefore affect lands within the County. Potential Growth Area Directions The following map identifies seven potential growth areas surrounding the City. The seven areas have been identified for comparative analysis purposes. All extend outward from the City boundary for a distance ranging from two to three kilometres. The seven areas have been determined based on natural and cultural boundaries and characteristics. For example: Area 1 (north) extends across the top (north) of the City to County Roads 5 and 99 in the north. The west side is bounded by Paris Road and the municipal boundary, and the east side by Fairchild Creek. Area 2 (east) extends east of the City to Fairchild Creek and is bisected by Highway 403. Area 3 (south-east) includes the Oxbow of the Grand River and lands to the southeast above the Grand s high embankment. Area 3 also includes the Cainsville/Blossom Avenue Settlement Area. Area 4 (south) is located south of the Grand River, is traversed by County Road 18 and includes the Tutela Heights Settlement Area and approximately the north half of the Mount Pleasant Settlement Area. Area 5 (south-west) is located west of the Grand River and includes a large wellhead protection area designation in the County Plan, and the Airport/Oakhill Settlement Area.
26
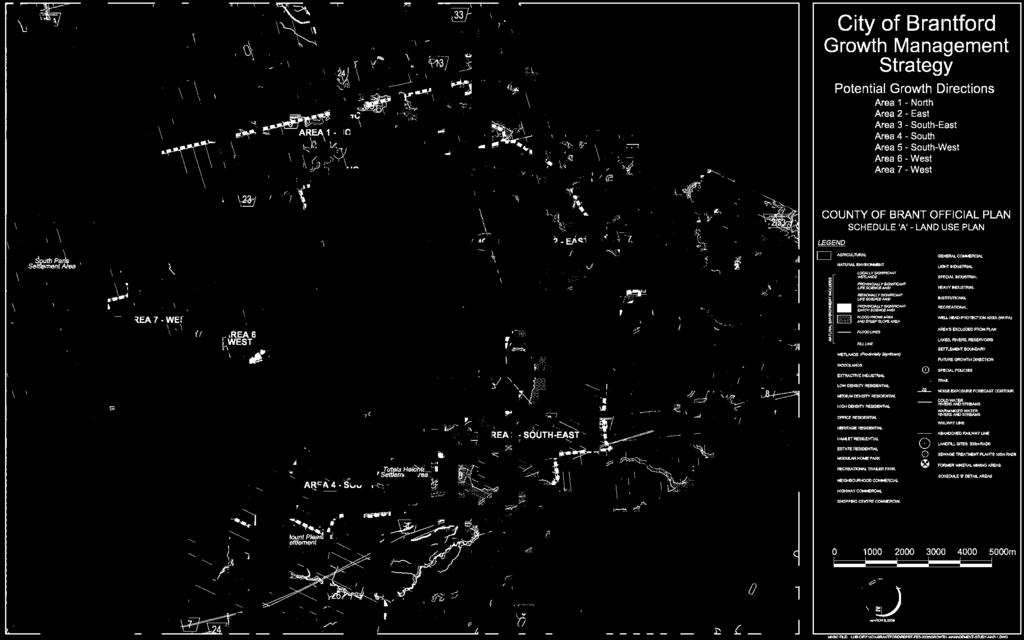
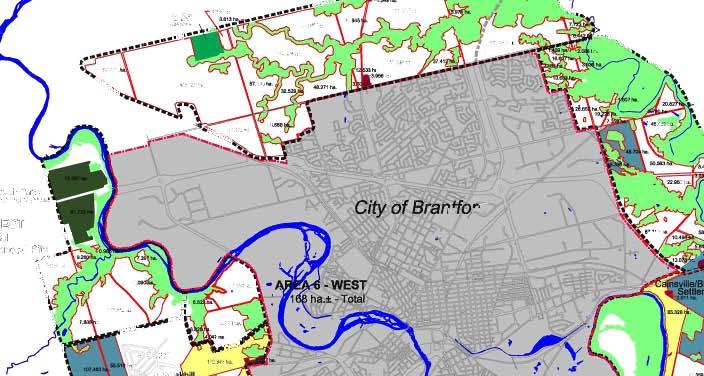
27
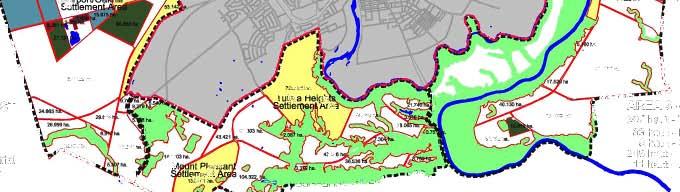
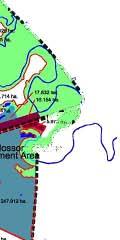
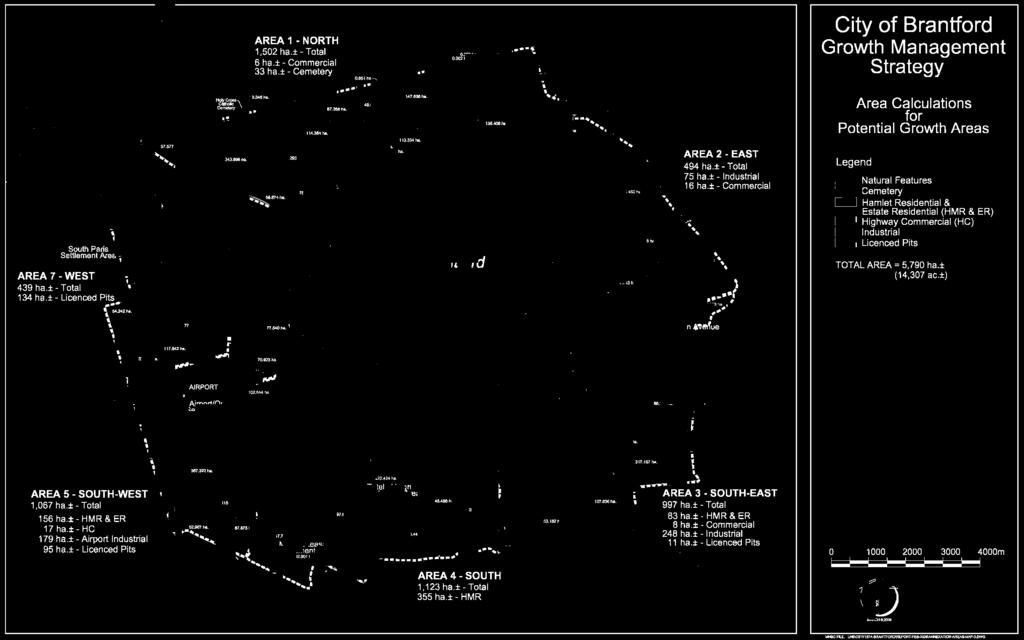
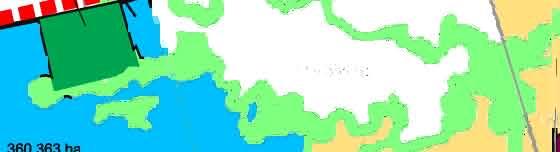
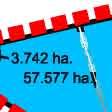
28 City of Brantford Growth Management Strategy March Area 6 (west) is a smaller area bounded by the Grand River, the future Brantford South Access Road, the Airport and Oakhill Settlement Area. Area 7 (west) is bounded by the Grand River to the east, the Paris settlement boundary to the west and the airport to the south. This area is characterized by aggregate resources and is bisected by Highway 403 and Whitemans Creek. The Scale of Potential Growth Areas Area The following map identifies sub-areas for each potential growth area. Area calculations in hectares are provided for each sub-area. Natural features and proposed regulated areas as provided by the Grand River Conservation Authority (GRCA) have been assumed to be non-developable lands and therefore have not been included in the land area calculations. These natural features also in many instances serve to define the limits of the sub-areas. The following table provides land area calculations for the lands not constrained by natural features (based on GRCA mapping), and also indicates land areas already affected by existing uses (i.e. airport) and development designations (based on the County Official Plan). Agriculture Area Calculations for Potential Growth Areas (in hectares) Industrial Designation Licensed Pit Airport Cemetery Hamlet & Estate Residential Highway Commercial TOTAL Area Total
29
30 City of Brantford Growth Management Strategy March The seven study areas have a total of 4,395 hectares not affected by natural features or developed land uses and settlement designations. This exceeds the additional City industrial and residential land area required to 2046 (i.e. 1,083 to 1,528 gross hectares) by a factor of 4.0 times to 2.9 times respectively. The next section of this report will therefore assess and rank the seven growth areas in order to determine a preferred growth direction(s). Growth Area Evaluation Criteria In order to evaluate the relative advantages and disadvantages of the seven areas to accommodate growth, the policies of Section 2: Wise Use and Management of Resources and Section 3: Protecting Public Health and Safety of the Provincial Policy Statement were considered and the following eight criteria were developed: Prime agricultural land - Prime agricultural areas to be protected for agricultural use. Prime agricultural areas are areas where prime agricultural lands predominate and include Class 1, 2 and 3 soils. The analysis is included as Appendix 3. Mineral aggregate resources / licensed pits Protection of mineral aggregate resources to make as much resource as close to market as possible. The analysis is included as Appendix 4. Environmental features Natural features to be protected, including wetlands, rivers, streams, woodlands. The analysis is included as Appendix 5. Wellhead protection areas Restrict development in or near sensitive ground water features such that these features and their related hydrologic functions will be protected, improved or restored. The existing policy area from the Brant County Official Plan is included as Appendix 6.
31 City of Brantford Growth Management Strategy March Sanitary servicing Direct and accommodate expected growth in a manner that promotes the efficient use of existing municipal sewage systems. Consideration of optimizing existing infrastructure and facilities, where feasible, before developing new infrastructure and facilities. Municipal services are the preferred form of servicing. The analysis is included as Appendix 7. Water servicing Direct and accommodate expected growth in a manner that promotes the efficient use of existing municipal water systems. Municipal services are the preferred form of servicing. The analysis is included as Appendix 7. Transportation accessibility - Provision of an integrated, safe and energy efficient transportation system to facilitate the movement of people and goods to address projected needs. The analysis is included as Appendix 8. Community integration The proposed Places to Grow Plan requires complete communities, which could also include consideration of integration of community facility planning with existing facilities and neighbourhoods. The Weighting of Evaluation Criteria Each criteria was given a weight of high constraint (3), medium constraint (2) or low constraint (1), as it applied to a specific potential growth area. Therefore, the seven potential growth areas were evaluated against eight criteria, each of which was given a weighting from 1 to 3. For example, potential specialty cropland was considered a high constraint (3) to development, while a mixed agricultural capability was a medium constraint (2), and lower agricultural capability a low constraint (1). The following fold out matrix provides a visual summary of this exercise and results in a ranking of least constrained to more constrained. The following table provides a summary of the results:
32 Brantford Growth Management Strategy Evaluation Summary of Potential Growth Directions Area One Area Two Area Three Area Four Area Five Area Six Area Seven CRITERIA North East Southeast South Southwest West West Prime Agricultural Land Mineral Aggregate Resources/Licensed Pits Environmental Features (overall) Wellhead Protection Area Sanitary Servicing Water Servicing Transportation Accessibility Community Integration Constraint Summary High Constraint Medium Constraint Low Constraint 3 2 1
33
34 City of Brantford Growth Management Strategy March Area 1 has one of the least impacts on the existing sanitary and water system servicing capacities since the lands can be serviced from two major trunk sanitary sewers (i.e. west and east) and from two existing water pressure zones (Zone 2/3 and Zone 4), thus reducing the need for major infrastructure upgrades and pumping/storage facilities. Area 6 is limited in scale (only 168 hectares) and is more difficult to service. From an industrial location perspective and proximity/accessibility to Highway 403, Area 1 north ranks high. The extension of industrial uses northerly along Oak Park Road is seen as a natural extension of the Northwest Industrial Park, and compatible with existing highway commercial and industrial designations within the Brant County Official Plan (immediately to the west). The area also has moderate topography. By comparison, Area 2 to the east has a more rolling topography and is characterized by numerous natural features and tributaries relating to the oxbow meander of Fairchild Creek. The ability to assemble contiguous parcels is more difficult in Area 2, given the numerous drainage corridors which bisect this area. From a residential perspective, Area 1 north immediately abuts onto the northern completed neighbourhoods of the City of Brantford. This enables the logical extension of residential growth northerly, as well as the ability to utilize and relate to existing soft services located within the northern portion of the City. Extending residential development to the north also provides the opportunity to balance the area of residential growth in close proximity to the area of future industrial employment. Growth to the north would also limit the impact on existing settlements within Brant County. Areas 2, 3, 4 and 5 presently include designated settlement areas of either an industrial or residential nature. The proposed Places to Grow Plan also indicates a Designated Growth Area to the north of the City within portions of Area 1.
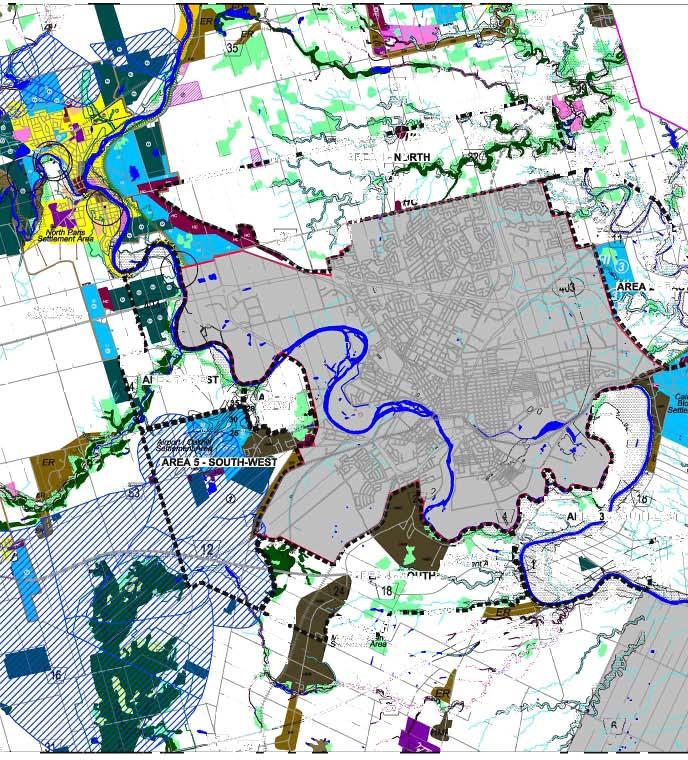
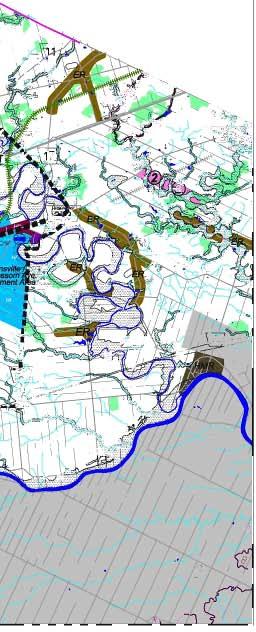
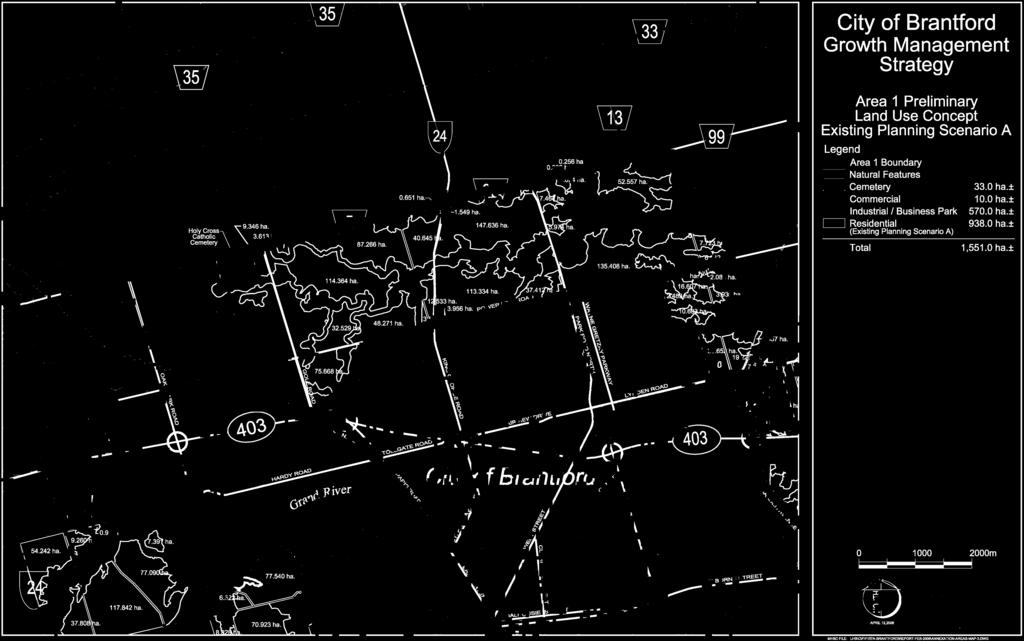
35 City of Brantford Growth Management Strategy March PART C: CONCEPTUAL LAND USE ALLOCATION The attached maps provide preliminary land use concepts for Area 1 north. The land use concepts are at a very general level and intended to indicate the relationship between the land area requirements identified in Part A, and available land areas within Area 1 north. Natural features are shown in green. These natural features relate to the tributaries of Fairchild Creek, which drain through the central portion of Area 1 from west to east. The boundaries of the natural features are based on the proposed regulated area as provided by the Grand River Conservation Authority. It is expected that future more detailed environmental assessments at a neighbourhood and/or subdivision planning level, will address the boundaries of the natural features designation in greater detail in order to refine the limits of developable lands. These west/east natural features could supplement the future transportation system with pedestrian linkages. Public input comments from the ongoing City of Brantford Official Plan program has put a high value on a walkable City, including an integrated pedestrian/open space system. The concepts illustrate an area for industrial/business park development, in the westerly portion of Area 1. This area consists of 570 gross hectares, which is close to the identified 495 hectares required for industrial land. The industrial land allocation is in the area of Powerline Road, Golf Road, the Paris Road and County Road 5. It has good accessibility to the Oak Park Road and Paris Road interchanges with Highway 403. The industrial area is less constrained relative to identified natural features, as compared to the potential residential areas further to the east. It is expected that future more detailed planning will provide for an industrial area concept that might identify a range of industrial/business park designations. For example, areas closer to residential development might be considered for a transitional business park designation. The more detailed industrial concept could
36 City of Brantford Growth Management Strategy March also identify complementary land uses, access and collector road layouts, and appropriate servicing and phasing of development. An area immediately north of the residential neighbourhoods contained within the City of Brantford is illustrated as potential future residential development. Planning Scenario A illustrates an area of 938 gross residential hectares, which utilizes all of the remaining lands in Area 1 not affected by natural features (and is still less than the estimated need of 1,071 gross residential hectares). The Compact City Scenario B concept illustrates an area of 493 gross residential hectares. More detailed planning at a neighbourhood level would ultimately be required for these conceptual residential lands. A major objective should be a high level of integration with the existing residential communities to the south. This would include maximizing the extension of the existing residential road pattern, providing for the extension of existing transit routes and considering the relationship to recreation, schools, commercial areas, and recreation facilities.


37


38
39 City of Brantford Growth Management Strategy March PART D: WATER AND WASTEWATER SERVICING ASSESSMENT The water and wastewater servicing assessment identified the relative servicing impact of each of the proposed seven growth areas on the existing infrastructure. The results of this analysis were combined with the other evaluation criteria as described in Part B to identify the preferred growth direction. The details of this assessment can be reviewed in Appendix 7, Part 1. Based on the preferred growth direction and the final population growth projections, a more detailed analysis of the water and wastewater system upgrades and estimated costs was performed for three critical stages of development as follows: Scenario 1: 2036 Intensified Build-Out of the present City Scenario 2: Development of Area 1 to the 2046 Scenario 3: Buildout of Area 1 beyond 2046 The existing water and wastewater linear systems were modeled, based on the compact growth scenario to identify wastewater trunk sewer, water transmission main, pumping, storage and treatment upgrade requirements. Plant expansion costs were allocated to the three growth scenarios based on current construction unit costs and average per capita equivalent consumption rates. The following is a more detailed description of the scope of work performed for each of the three growth scenarios: Scenario 1 Assessment of wastewater trunk sewer and water transmission main improvements, pumping station upgrades, water storage expansions and incremental water and wastewater treatment expansions to accommodate all new growth within the existing city boundary to accommodate the build-out population of 139,000 persons (2036). Scenario 2 Assessment of wastewater trunk sewer and water transmission main extensions to the external boundaries of Area 1, water and wastewater pumping upgrades and water storage and water and wastewater treatment
40 City of Brantford Growth Management Strategy March expansions to accommodate the first phase of Area 1 growth (16,500 persons plus ICI) by Scenario 3 Assessment of wastewater trunk sewer and water transmission main extensions to the external boundaries of Area1, water and wastewater pumping system upgrades and water storage and water and wastewater treatment expansions to accommodate the balance of Area 1 development (i.e. to build-out).. Details of the upgrade and costing analysis can be reviewed in Appendix 7 Part 2. The following table summarizes the estimated growth related costs required to provide the necessary water and wastewater service upgrades to accommodate the three growth scenarios. The table also includes year of construction of each component of infrastructure and the distribution of costs to accommodate each growth scenario.
41 City of Brantford Growth Management Strategy March Summary of Total Water and Wastewater Servicing Costs
42 City of Brantford Growth Management Strategy March CONCLUSION The Growth Management Strategy was initiated by the City of Brantford to identify land use needs and adequately plan for major public infrastructure investments. A time horizon of 40 years has been used to consider long-term land needs. The methodology used to assess growth needs and directions is illustrated as follows: Preparation of Population, Household and Employment Forecasts Development of Buildout Growth Scenarios for the City Inventory of Current Land Supply within City Boundary Determination of Land Needs to 2046 Identification of Potential Growth Directions Comparison and Ranking of Potential Growth Directions Selection of a Preferred Growth Direction Preparation of Preliminary Land Use Concepts to Address Land Needs
43 City of Brantford Growth Management Strategy March The City s forecasts project continued growth to 2046, due to Brantford s strategic location in Southern Ontario, the recent development of post-secondary institutions in the downtown, relatively affordable housing by comparison with the Greater Toronto Area, and the City s identification as an Urban Growth Centre by the Province. An additional 62,540 people, 82,000 jobs and 26,450 new households are forecasted to The City currently has capacity to accommodate some industrial and residential growth. However, additional land will be required beyond the current City boundaries to adequately accommodate the forecasted growth. From an industrial land needs perspective, approximately 495 gross hectares would be required. Residential land requirements beyond the City boundaries range from 493 gross hectares to 1,071 gross hectares depending upon the degree of intensification achieved. The Growth Management Strategy identified seven potential growth area directions surrounding the City. These were assessed based on criteria from current provincial policy. The growth areas were compared and ranked, with the area to the north of the current City determined as the preferred growth direction. Preliminary concepts for this area illustrate possible land use combinations to meet industrial and residential land needs to Generally, growth to the north provides for a logical extension of the residential and industrial areas existing within the City. It has one of the least impacts on existing sanitary and water servicing system capacities and allows for efficient expansions to existing systems. The Province s Proposed Places to Grow Plan also identifies an area to the north of the City for future growth. While the area to the north was selected as the preferred direction, there may also be the opportunity for other areas of minor rounding out of the City from portions of other growth areas.
44 APPENDICES Appendix 1 Appendix 2 Appendix 3 Appendix 4 Appendix 5 Appendix 6 Appendix 7 Appendix 7 Appendix 8 Appendix 9 Appendix 10 City of Brantford Population and Employment Projections Growth Scenario B Compact City (Growth capacity of the existing City of Brantford based on the G.G.H. Places to Grow Plan) Agricultural Assessment of Potential Growth Areas Mineral Aggregate Resources Overview of Natural Heritage Features by Potential Growth Areas Groundwater and Wellhead Protection Area Policies from the County of Brant Official Plan Water and Wastewater Assessment (Part 1) - Relative Impact of Growth Areas on the Existing Water and Wastewater Systems Water and Wastewater Assessment (Part 2) - Water and Wastewater Servicing Upgrades and Costs for Growth Area 1 Transportation Assessment Residential Monitoring Map Vacant Industrial Land Map
45 Appendix 1 City of Brantford Population and Employment Forecasts
46 Appendix 1 CITY OF BRANTFORD POPULATION AND EMPLOYMENT PROJECTIONS INTRODUCTION Appendix 1 is based on the report Growth Forecasts, 2005/06 Official Plan Review Program, prepared by the City of Brantford Planning Department. 1.0 HISTORICAL GROWTH 1.1 Historical Population Growth Recent historical census population data and annual rates of growth for Brantford are presented in Table 1. Brantford s population grew by approximately 12,000 people over the 20-year period from 1981 to Over the 20-year period, the population of Brantford grew at annual average rate of 0.8 per cent. Table 1 Historical Population Growth, Brantford: Year Brantford Population Annual Rate of Growth (%) , , , , , Table 2 provides data on the number of households, average household size and total employment in Brantford for the period between 1991 and Over the 10-year period, the total number of households in Brantford increased by
47 Appendix 1 City of Brantford Population and Employment Projections almost 3,400. The average household size declined over the 10-year period, reaching an average size of 2.5 persons per household in Brantford in Total employment in Brantford declined by about 4,000 jobs between 1991 and 1996 and then recovered by Brantford was hit particularly hard by the general economic downturn in the 1990 s and this is reflected in the jobs lost in Brantford during the first half of that decade. The employment data also indicate that Brantford had recovered from the economic downturn by Table 2 Households, Average Household Size and Total Employment, Brantford: Category Year Brantford Total # of ,460 Households ,845 Average Household Size Total Employment , , ,440 Page 2
48 Appendix 1 City of Brantford Population and Employment Projections 2.0 Development Charges Background Study Projections A new growth forecast for Brantford was completed in This forecast, which was also prepared by C.N. Watson and Associates in conjunction with the City s recent Development Charges Background Study, used the 2001 Census as base data. These projections are outlined in the report City of Brantford Household, Population and Employment Projections: Three alternative forecasts, low; reference; and high, were prepared using a housing market-based model to forecast future housing units and population. The results of this approach were then checked against forecasts prepared using a cohort/survival model based on projected births, deaths and net migration to Brantford over the forecast period. The age/sex profile of the projected population, under each growth alternative, was prepared by using the cohort/survival approach. An employment forecast was prepared, for the reference forecast, by examining relationships between employment and population amongst major employment categories. The three alternative forecasts can be differentiated on the basis of the assumptions used on the level of future new residential construction in Brantford. The residential unit growth assumptions used for each of the three alternative forecasts are presented in Table 3 and the resultant population projections and average annual growth rates are presented in Table 4. The forecast of total employment are presented in Table 5. Page 3
49 Appendix 1 City of Brantford Population and Employment Projections Table 3 Residential Unit Assumptions Alternative Development Charge Growth Forecasts: Residential Growth Assumption (new units) Period Low Reference High mid 2001-mid ,533 2,283 3,080 mid 2006-mid ,888 2,500 2,847 mid 2011-mid ,500 2,250 2,750 mid 2016-mid ,500 2,250 2,750 mid 2021-mid ,612 2,250 2,956 Total 9,033 11,633 11,533 Annual Average Source: C.N. Watson & Associates. City of Brantford Household, Population and Employment Projections: , 2004 The reference forecast estimates a 2026 population of 112,055. The average annual rates of growth for all of the three alternatives are relatively modest, ranging from 0.8% in the Low Forecast, to 1.0% in the Reference Forecast and 1.3 % in the High Forecast. It should be noted that the Reference Forecast was used for the calculation of development charge rates in the Development Charges Background Study. An employment forecast, based on the reference forecast, is presented in Table 5. Total employment in Brantford is expected to grow by about 20,600 new jobs over the 25-year period between 2001 and This compares to a projected population growth of 25,600 over the same period. Page 4
50 Appendix 1 City of Brantford Population and Employment Projections Table 4 Population Growth Alternative Development Charge Growth Forecasts: Residential Growth Assumption (new units) Low Reference High Annual Growth Rate (%) Annual Growth Rate (%) Annual Growth Rate (%) Year Pop. Pop. Pop ,417 86,417 86, , , , , , , , , , , , , , , , Total Growth 18,742 25,638 33,035 Avg. Growth Rate (%) Source: C.N. Watson & Associates. City of Brantford Household, Population and Employment Projections: , 2004 Table 5 Forecast of Total Employment in Brantford Reference Forecast: Year Total Employment , , , , , ,039 Total Change 20,599 Source: C.N. Watson & Associates. City of Brantford Household, Population and Employment Projections: , 2004 Page 5
51 Appendix 1 City of Brantford Population and Employment Projections 3.0 RECENT GROWTH FACTORS There are many factors that point to higher growth rates for Brantford than what has been experienced recently, particularly during the 5-year period between 1996 and The completion of Highway 403 between Brantford and Ancaster, in 1997, has considerably improved the accessibility of Brantford and has been a key contributor to changing local growth dynamics. This is most clearly demonstrated in statistics on recent industrial development in Brantford. Figure 1 illustrates the trends in municipal industrial land sales over the past 15 years. Before 1997, annual industrial land sales were consistently below 20 acres a year and in some years no municipal industrial land was sold at all. Since 1997, industrial land sales, although fluctuating significantly from year to year, has been consistently above 20 acres a year and actually hit a peak of 188 acres in The only exception was in 2005 when only 17 acres were sold. The 2005 total is primarily due to the lack of supply availability in the municipal industrial land inventory. In the six years before 1997, the municipality sold on average 6.5 acres of industrial land annually and after 1997 this figure increased almost tenfold to 60.8 acres a year. It should be noted that the 2004 peak year does not include the 150 acres of private land that was sold to Ferrero for its new industrial plant in the City s northwest which is now nearing completion. Page 6
52 Appendix 1 City of Brantford Population and Employment Projections Figure 1 City of Brantford Industrial Land Sales: # of Acres Sold Annual Sales Year Average Figure 2 displays data on the value of industrial building permits in Brantford from 1991 to Before 2000, the annual building permit value for industrial construction projects, which includes plant additions as well as new buildings rarely rose above $15 million in any year. There was a lag between the increase in industrial land sales and the increase in the level of industrial building activity. Note that the industrial building activity peaked in 2005, when it reached $126 million. Figure 2 also shows that the value of construction activity in Brantford has increased steadily since 1997 after suffering a general decline in the first half of the 1990 s. As the graph indicates, industrial construction has mirrored the Page 7
53 Appendix 1 City of Brantford Population and Employment Projections overall trend and the increase in industrial construction activity has been a factor in the increase in the overall level of construction, particularly in The graph also shows that construction activity in other sectors such as residential, institutional and commercial has also contributed to the increase in the volume of construction activity. The graph indicates that, in the early 1990 s, industrial construction activity was only a small portion of total construction activity and that it is now a very important sector in the local building industry. Figure 2 City of Brantford Building Permit Values: Industrial, Other Sectors and Total Construction: Building Permit Value $ millions Total Construction Other Sectors Industrial Year To a considerable extent, the City s ability to attract further industrial development is related to the industrial operations that are already located within Page 8
54 Appendix 1 City of Brantford Population and Employment Projections the community. The City s Economic Development Department has a wellestablished business retention program designed to work with businesses in the community and to facilitate their future expansion requirements. A number of the new industrial operations, such as the Proctor and Gamble distribution centre, the Camco distribution centre and the Ferrero operation announced their intentions to expand soon after their original investments are operational. Many other industries have further expansion potential as well. In the past, Brantford was very susceptible to economic downturns as its industrial base was concentrated in only a few sectors. With the departure of the agricultural machinery industry from the community, the local industrial base has become considerably diversified particularly in recent years as there has been significant expansion in food processing operations and distribution centres for consumer products. The City s industrial base is dominated by small and medium sized industries with only a few plants having more than 500 employees. Ferrero when it begins full operations with over 600 employees (not including its announced expansion) will be Brantford s largest industrial employer. Also of relevance is Brantford s location with respect to the recently announced Toyota car plant to be constructed in Woodstock, about a half hours drive to the west of Brantford. This new plant will be an easy commute for Brantford workers and a short distance for parts suppliers. With this new plant, Brantford is wellpositioned with respect to the southern Ontario automobile manufacturing centres of Alliston, Oshawa, Brampton, Oakville, St. Catharines, Woodstock, St. Thomas and Windsor. Another factor is that a number of the communities in the western half of the greater Golden Horseshoe, particularly Kitchener and Cambridge, have dwindling supplies of available industrial land and will have difficulty bringing more Page 9
55 Appendix 1 City of Brantford Population and Employment Projections industrial land on-stream in the near future. While Brantford is also facing supply issues, it is taking pro-active steps to deal with the matter. In addition to Brantford s ability to attract industrial development, there are other factors as well that point to strong growth in the community in the future. Important amongst these other factors is the emergence of Laurier Brantford and the affiliated campuses of Nipissing University and Mohawk College in the downtown core. The 2005/06 academic year fulltime enrolment in the downtown post-secondary campus is 1,500 students and continued expansion is expected. The development of the university campus allows Brantford to retain more university students from amongst its own residents as well as to attract students from other communities who may become permanent residents. The growing campus also provides many jobs for faculty and support staff that were not previously available in the community. The development and continued expansion of the university campus will further contribute to the diversification of the City s economic base and contribute to other spin-off job creation. Over the next 25 years, Brantford strong locational advantages will be further enhanced with planned improvements in the inter-city transportation network to the west of the Greater Toronto Area. These improvements include the expansion inter-regional transit to Brantford from the east and to the north and the development of the mid-peninsula goods movement corridor that will intersect the 403 between Hamilton and Brantford. These improvements are part of the Province s Places to Grow strategy. The Red Hill Creek Expressway, now under construction, will further reduce travel times to the US border. The Ministry of Transportation is also investigating how the Highway 24 corridor that links Brantford to Waterloo Region can be improved. Page 10
56 Appendix 1 City of Brantford Population and Employment Projections Brantford has been proactive in providing incentives in various sectors to encourage development that would not otherwise have occurred. The City s Downtown Performance Grant program and the Civic Square project has facilitated investment in commercial, institutional and residential development in the downtown core which would not have happened otherwise. The City s affordable housing strategy has been responsible for a number of residential projects that would not have been feasible if the financial assistance offered by the City was not made available. The Brantford Brownfields Financial Tax Incentive Program, which is to begin operating in 2006, will encourage investment in the redevelopment of brownfield properties that will economic spinoffs that will contribute to growth in the local economy. Also of importance is the difference in the cost of homes in Brantford to that in nearby communities that are part of the Greater Toronto-Hamilton (GTAH) area. The relatively lower prices in Brantford and the availability of land has made it an attractive area for GTAH home-builders. The best example of this is Empire Community Homes which now owns large tracts of land in the City s southwest and actively markets its Brantford product in the GTAH. Other GTAH homebuilders are following suit. According to the local housing market analyst for the Canada Mortgage and Housing Corporation, Brantford housing starts should go up to 600 to 650 new units a year. A major factor is the significant difference in prices for new homes in the Brantford and Hamilton housing markets. Figure 3 displays the average absorbed price of a new single-detached home in Brantford and in the Hamilton CMA from 1989 to Whereas the gap between Brantford and the Hamilton CMA in the average absorbed price for a new home was about $65,000 in 1989, the gap stood at $192,000 in 2005, with most of this increase occurring after According to data obtained from CMHC, the average MLS sale in the Page 11
57 Appendix 1 City of Brantford Population and Employment Projections Avg. Absorbed Price $ 000's 1989 Figure 3 Average Absorbed Price of a New Single-Detached Home, Brantford and Hamilton CMA: Hamilton YTD Brantford Source: Canada Mortgage and Housing Corporation Year Hamilton CMA is now about $50,000 higher in than in the Brantford area. These price gaps are encouraging home buyers to look seriously at the Brantford market and encouraging developers to move into the Brantford market. The impact of all of these factors are already evident in the local housing market. Figure 4 shows the trends in building permit data for the totals number of new housing units and for single-detached housing units issued over the past twentyyear period from 1986 to New housing construction was at a relatively high level in the late 1980 s and then declined in the 1990 s reaching a low level of 186 units in Total housing construction was then relatively stable to 2001 and then increased significantly and has been above 500 units a year since Page 12
58 Appendix 1 City of Brantford Population and Employment Projections In 2005, the total number of new residential units for which building permits were issued stood at 594 units. The level of total residential construction, since and including 2002, has been above the levels forecasted by C.N. Watson and Associates in their Low and Reference forecast scenarios prepared in 2004 and in 2005 was higher than that projected in Watson s high forecast. It should be noted that the trend in the level of construction of single-detached housing closely mirrors the trends displayed for the total units. In the 1990 s, when total residential construction activity was at a relatively low level, singledetached housing comprised a very large proportion of the total units constructed. Since 2001, while single-detached housing construction has increased significantly, there has also been a large number of new townhouse and apartment dwellings constructed. Figure 4 Residential Building Activity: # of New Units Year Total Units Single-Detached Source: City of Brantford Planning Department as drawn from Building Dept. Page 13
59 Appendix 1 City of Brantford Population and Employment Projections 4.0 REVISED CITY OF BRANTFORD FORECAST Based on the consideration of all of these factors it was evident that a review of the C.N. Watson growth forecasts was necessary. Residential construction in Brantford, particularly in 2004 and 2005, was approaching the level upon which the C.N. Watson High Forecast scenario, prepared in 2004, was based. With the various factors pointing to more sustained growth in the future and the consideration that population growth tends to lag behind industrial growth, a higher level of future growth than what has recently been experienced is not unreasonable. Based on these considerations a new forecast was prepared. Also, the C.N. Watson Low Forecast scenario was discarded as it no longer appears to be relevant to current conditions in Brantford. Table 6 displays the growth forecasts that will be presented in this report, the basic assumptions upon which they are based as well as comparisons to the C.N. Watson growth forecast scenarios. As the reference forecast was the base forecast used for the Development Charges Background Study it is renamed as the Development Charges Reference Forecast. C.N. Watson s high residential forecast now corresponds closely to recent residential construction levels in Brantford and is renamed as the Current Trends Forecast. The new forecast, which is based on the higher annual growth rate of 650 new residential units a year will be referred to as the Growth Management Forecast. Page 14
60 Appendix 1 City of Brantford Population and Employment Projections Table 6 C.N. Watson & Associates Low Residential Growth Reference Residential Growth High Residential Growth Growth Forecasts Official Plan Review Program Development Charges Reference Forecast Growth Assumption (residential units/year) Current Trends Forecast 575 Growth Management Forecast 650 The methodology used for the preparation of the forecasts followed that used by C.N. Watson & Associates in the development of its three residential growth forecasts. This methodology is outlined in their report City of Brantford Household, Population and Employment Projections: The statistics used in their forecasts that vary household size according to the age of the housing stock and by housing type were also applied in the Official Plan Review Forecasts. The employment to population ratios used in the C.N. Watson report were also to derive estimates of future employment in Brantford. In preparing the forecasts, it was assumed that new housing would be proportioned amongst the various density categories as follows: - low density - 75 % - medium density - 15% - high density - 10%. This is the same distribution that was used in the C.N. Watson forecasts. For all three forecasts, Development Charges Reference, Current Trends, and Growth Management, it was assumed that over the period that the total number of new units to be created over that period would be as follows: Page 15
61 Appendix 1 City of Brantford Population and Employment Projections - low density - 1,810 units - medium density units high density units - Total - 2,400 units. As a result, all three growth scenarios provide for the same population forecast for 2006 and the varying growth assumptions on the amount of new residential construction apply after The C.N. Watson forecasts went to To be consistent with the pending Places To Grow growth plan for the GGH, the Official Plan forecasts need to be extended to The forecasts were prepared at 5-year intervals to this date. They were also extended a further 15 years, to 2046, to allow for an estimation of land requirements to accommodate future growth at the end of the planning period in 2031 and to meeting the planning requirements for the Growth Study. The projection was extended from 2031 to 2046 by calculating the growth that was forecasted between 2016 and 2031 and then adding this growth to the 2031 forecasted population. It was further assumed that the employment to population ratios and average household size would stay constant over the 2031 to 2046 period. The population and household forecasts resulting from this exercise for each of the three growth scenarios are presented in Table 7. Table 8 presents the results for the employment forecasts. The employment forecasts are provided for each of the major employment sectors as well as for total employment in Brantford. The employment to population ratios used to derive calculate these forecasts are provided in Table 9. Page 16
62 Appendix 1 City of Brantford Population and Employment Projections Table 7 Population and Household Forecasts for Brantford: Development Charges Reference Forecast Year Pop. Change in Pop. Annual Growth rate (%) Hshlds. Change in # of Hshlds Persons/ Hshld ,417 33, ,960 6, ,250 2, ,384 5, ,750 2, ,646 5, ,000 2, ,020 4, ,250 2, ,774 5, ,500 2, ,529 5, ,750 2, ,412 15, ,165 6, Current Trends Forecast Annual Growth rate (%) Change in # of Hshlds Year Pop. Change in Pop. Hshlds ,417 33, ,960 6, ,250 2, ,470 6, ,125 2, ,069 6, ,875 2, ,706 5, ,625 2, ,740 7, ,375 2, ,773 7, ,125 2, ,477 19, ,660 8, Growth Management Forecast Annual Growth rate (%) Change in # of Hshlds Persons/ Hshld Year Pop. Change in Pop. Hshlds ,417 33, ,960 6, ,250 2, ,557 7, ,500 3, ,493 7, ,750 3, ,394 6, ,000 3, ,706 8, ,250 3, ,018 8, ,500 3, ,500 23, ,700 10, Persons/ Hshld Page 17
63 Appendix 1 City of Brantford Population and Employment Projections Table 8 Employment Forecasts for Brantford: Development Charges Reference Forecast Comm./ Year Pop. Primary/ Industrial Pop. Related Instit. Work At Home Total ,417 15,555 12,098 7,778 1,728 37, ,960 17,662 13,944 9,296 1,859 42, ,384 19,677 15,741 10,822 2,952 49, ,646 20,729 16,583 11,401 3,109 51, ,020 22,684 18,363 11,882 3,241 56, ,774 23,893 19,342 13,653 3,413 60, ,529 25,101 20,320 14,343 3,586 63, ,412 28,436 23,020 16,249 4,062 71,768 Current Trends Forecast Year Pop. Primary/ Industrial Comm./ Pop. Related Instit. Work At Home Total ,417 15,555 12,098 7,778 1,728 37, ,960 17,662 13,944 9,296 1,859 42, ,470 19,894 15,915 10,942 2,984 49, ,069 21,214 16,971 11,668 3,182 53, ,706 23,458 18,990 12,288 3,351 58, ,740 24,935 20,186 14,249 3,562 62, ,773 26,412 21,381 15,093 3,773 66, ,477 30,550 27,731 17,457 4,364 77,103 Growth Management Forecast Year Pop. Primary/ Industrial Comm./ Pop. Related Instit. Work At Home Total ,417 15,555 12,098 7,778 1,728 37, ,960 17,662 13,944 9,296 1,859 42, ,557 20,111 16,089 11,061 3,017 50, ,493 21,699 17,359 11,934 3,255 54, ,394 24,233 19,617 12,693 3,462 60, ,706 25,978 21,030 14,845 3,711 65, ,018 27,724 22,443 15,842 3,961 69, ,500 32,655 26,435 18,660 4,665 82,415 Page 18
64 Appendix 1 City of Brantford Population and Employment Projections Table 9 Employment to Population Ratios by Mayor Employment Sectors, Brantford: Employment to Population Ratios Comm./ Year Pop. Primary/ Industrial Pop. Related Instit. Work At Home Total , , , , , , , , It is recommended that the Growth Management Forecast be used for planning purposes as it best takes into account the growth dynamics that are in play in the Brantford area and which are likely to be sustained for some time. Planning for this level of growth will ensure that Brantford can adequately respond to growth pressures and maintain a strong local economy. Page 19
65 Appendix 2 Growth Scenario B Compact City (Growth capacity of the existing City of Brantford based on the G.G.H. Places to Grow Plan)

66
67 TZ # Growth Scenario B Compact City - 1 ESTIMATED CAPACITY OF BRANTFORD S URBAN GROWTH CENTRET HA 2001 POP 2001 JOBS 2001 TOTAL 2001 DENSITY/ HA 2031 POP 2031 JOBS 2031 TOTAL 2031 DENSITY/ HA , , , , ,035 5, ,654 6,725 8, , ,875 1,919 3, TOTAL ,162 5,245 7,844 5,991 9,492 15, TZ #34 reduced to 25 ha for purposes of estimating intensification potential, given extensive public uses such as B.S.A.R., civic centre, YMCA and parkland. Assumptions on distribution of jobs to population to 2031: Traffic Zone 23: 74% people to 26% jobs. 24: 20% people to 80% jobs. 34: 49% people to 51% jobs. Summary for Urban Growth Centre: 1. The urban growth centre will accommodate an additional 3,829 people and 4,247 jobs in the core by An additional 3,829 2 ppu equals 1,914 dwelling units, or an average of 77 units per year over 25 years 3. An additional 4,247 1 job per 18 m 2 of floor area approximates 76,500 m 2 (7.6 ha) of renovated/newly constructed employment floor area (ie. 3,060 m 2 per year over 25 years). Y517-A Brantford Growth Study N:\Y517\A\Reports\Final Mar14 Report\Appendix 2 Revised.doc
68 Growth Scenario B Compact City - 2 ESTIMATED CAPACITY OF BRANTFORD S RESIDENTIAL GREENFIELD AREAS AT A DENSITY OF 50 RESIDENTS & JOBS PER HECTARE GREENFIELD TRAFFIC HA POP JOBS TOTAL LOCATION ZONE SOUTH-WEST , , , ,700 NO. of RESIDENTIAL UNITS LOW MED HIGH TOTAL , ,500 5,214 1, ,954 SOUTH ,410-1, ,010-2, EAST ,185-3, ,096 NORTH-WEST , ,860 1, ,664 Notes: TOTAL , ,555 7,802 1,559 1,044 10,405 Area between abandoned rail tracks reduced from 86 to 43 ha due to environmental constraints. Full services assumed. Area E1 reduced from 91 to 75 ha based on open space constraints. Developable hectares reduced by 5.4 ha. of open space. Areas for A3 (17.83 ha), E.24 (10 ha) & A4 (18.38 ha) were reduced given open space constraints. JOB ESTIMATES: - Community commercial centre (1 job per 1000 sq. ft.) Two 20 jobs each 40 - Community centre 50 - Neighbourhood commercial site 30 Residential unit distribution based on the following: % Total People Units Per Unit Low Density 75% 3.09 Medium Density High Density jobs Y517-A Brantford Growth Study N:\Y517\A\Reports\Final Mar14 Report\Appendix 2 Revised.doc
69 Growth Scenario B Compact City - 3 ADDITIONAL INDUSTRIAL EMPLOYMENT CAPACITY IN BRANTFORD S INDUSTRIAL PARKS (based on 22 employees per net hectare ) LOCATION NORTH-WEST INDUSTRIAL AREA BRANEIDA INDUSTRIAL AREA TRAFFIC CITY OWNED PRIVATELY OWNED TOTAL ZONE HA JOBS HA JOBS HA JOBS , , , , ,908 TOTAL , , ,862 Source: City of Brantford Vacant Industrial Land map May Average Brantford industrial park density = 22 employees/net hectare gross hectares (487.3 acres) for parcels 1,2,3,12,13,14 reduced by 49.3 ha (25%) to equal net ha to account for future roads, storm management, and topoconstraints related to previous aggregate extraction. (147.9 net ha + parcels 5,7,8 & 11 = 17.0 ha = 164.9) Y517-A Brantford Growth Study N:\Y517\A\Reports\Final Mar14 Report\Appendix 2 Revised.doc
70 Growth Scenario B Compact City - 4 SUMMARY OF RESIDENTIAL DEVELOPMENT TO CITY BUILD-OUT (per GGH Places to Grow ) DEVELOPMENT CATEGORY Low Density NO. of RESIDENTIAL UNITS Medium High Density Density TOTAL UNITS POPULATION ACCOMMODATED GREENFIELD AREAS 7,802 1,559 1,044 10,405 (60%) 30,247 INTENSIFICATION Urban Growth Centre Infilling (Known Inventory) Corridors & Brownfields 1,914 1,914 3, , ,609 6, ,622 2,610 5,813 SubTotal 418 2,279 4,436 7,133 (40%) 15,997 TOTAL 8,220 3,838 5,480 17,538 46,244 DWELLING DENSITY (%) 47.3% 21.8% 30.9% 100% Y517-A Brantford Growth Study N:\Y517\A\Reports\Final Mar14 Report\Appendix 2 Revised.doc
71 Growth Scenario B Compact City - 5 INVENTORY INFILL UNITS WITHIN BUILT-UP AREA TRAFFIC ZONE LOW DENSITY UNITS MEDIUM DENSITY UNITS HIGH DENSITY UNITS TOTAL TOTAL UNITS 418 1, ,609 POPULATION 1,292 3,357 1,800 6,355 Y517-A Brantford Growth Study N:\Y517\A\Reports\Final Mar14 Report\Appendix 2 Revised.doc
72 Growth Scenario B Compact City - 6 RESIDENTIAL SUMMARY A. GREENFIELDS POPULATION SOUTH-WEST 20,212 SOUTH 2,010 to 5,750 EAST 3,185 NORTH-WEST 4,840 TOTAL 30,247 B. INTENSIFICATION TARGET Minimum of 40% of residential development by 2015 Greenfield Intensification 60% 40% No. of Units 10,405 7,133 POP 30,247 15,997 TOTAL 100% 17,538 46,244 C. POPULATION CAPACITY PER PLACES TO GROW MINIMUM TARGETS Estimated 2006 population 92,960 Greenfield population 30,247 Intensification population 15, ,204 D POPULATION PROJECTION 155,500 E. POPULATION NOT ACCOMMODATED WITHIN CITY BOUNDARIES TO ,296 Y517-A Brantford Growth Study N:\Y517\A\Reports\Final Mar14 Report\Appendix 2 Revised.doc
73 Appendix 3 Agricultural Assessment of Potential Growth Areas
74 - 1 - APPENDIX 3 BRANTFORD GROWTH STRATEGY AGRICULTURAL ASSESSMENT 1.0 Provincial Policy Statement (2005) The Provincial Policy Statement (PPS) is issued under the authority of Section 3 of the Planning Act and came into effect on March 1, It provides policy direction on matters of Provincial interest related to land use planning and development. The wise use and management of the Province s agricultural lands over the long-term is of Provincial interest. The PPS requires that prime agricultural areas be protected for the long-term use of agriculture. Prime agricultural areas defined in the PPS as specialty crop areas and/or Canada Land Inventory 1, 2 and 3 soils. Specialty crop areas are given the highest priority for protection followed by Classes 1, 2 and 3 soils, in this order of priority. A specialty crop area is defined by the PPS as an area designated using evaluation procedures established by the Province, where specialty crops such as tender fruits (peaches, cherries, plums), grapes, other fruit crops, vegetable crops, greenhouse crops, and crops from agriculturally developed organic soil lands are predominantly grown. The Ministry of Agriculture and Food is developing evaluation procedures for identifying specialty crop areas outside the Greenbelt Areas. At the time of writing, Ministry Staff advised that Brant County has been identified as a potential specialty crop municipality, but no evaluation procedures have been developed to date. Policy (a) of the PPS does allow planning authorities to exclude land from prime agricultural areas for expansion of settlement areas only at the time of a comprehensive review in accordance with policy of the PPS. Policy allows for the expansion of settlement area boundaries in prime agricultural areas, provided that: 1) the lands do not comprise specialty crop areas;
75 - 2-2) there are no reasonable alternatives, which avoid prime agricultural areas; and, 3) there are no reasonable alternatives on lower priority agricultural lands in prime agricultural areas. 2.0 Canada Land Inventory The Canada Land Inventory (CLI) mapping (Map No. 40 P, O) was reviewed to establish the capability of soils for agricultural production in the potential growth areas. The CLI mapping was produced in 1968 at a scale of 1:250,000. The CLI mapping provides a general representation of the soil capability for agriculture. The information obtained from the CLI mapping was compared against the more detailed land resource information provided in the County of Brant Soils Report produced by the Ministry of Agriculture and Food. 3.0 Soils of Brant County - Report No. 55 The Soils of Brant County Report No. 55 was produced by the Ministry of Agriculture and Food in 1989.The Report provides a detailed assessment of the capability of the soils to produce common field crops and specialty crops based on an assessment of the surficial geology, climate and land uses which influence the characteristics of the soils. The Report also provides a generalized soil map at a scale of 1:100,000 for the entire County. Figure 3-1 is a rendered version of the soils map and illustrates the agricultural capability of the soils surrounding the City of Brantford. The County s diversified agricultural industry has benefitted from the broad range of soils and favourable climate in Brant County. According to the Soils Report, livestock farming is prevalent in the lacustrine and glacial till soils, which are generally located in the eastern and northeastern portions of the County. Tobacco, vegetables, grain crops and other cash crops are located in the outwash soils, which are generally located in the west and southwestern portions of the County.
76 - 3 - Cultivated hay, wheat, grain corn and soybeans are the main crops grown in the County. However, substantial areas in the County are also planted in tobacco and vegetable crops. These latter crops represent a major component of the County s agricultural economy and make effective use of the County s sandy soils. The following generally describes the characteristics of the soils within the seven potential growth areas: Area 1 (North) Soil capability to the north is mixed. The amount of Class 1 is relatively small and with a few small concentrations to the extreme northwest, and immediately north of the City (east of Highway 24). Areas of poor capability soil generally are coincident with the valleys and side-slopes related to the Fairchild Creek tributaries. Class 3 areas are generally related to topographic constraints with Class 2 areas being the higher area of land. The higher capability soils (Class 1 and 2) in the area are generally comprised of Brant soils, whereas the lower capability soils are generally Brantford soils. Both of these soil types are extensively used for field crops. These soils are less commonly used for specialty crops given their soil characteristics and common limitations associated with steep slopes and topography. Area 2 (East) Area 2 is characterized by a wide mix of capability from Classes 1-4. There are a few small pockets of Class 1 land. Class 2 lands are relatively small in area and located in areas of the Fairchild Creek oxbows. Class 3 lands are mostly located central to Area 2 and closer to the City boundary. There is a large area of Class 4 lands in the southwest portion of Area 2 and close to the City boundary. This is coincident with an area of rolling topography.
77 - 4 - Brantford soils, which are coincident with the Class 3 and 4 soils, predominate in the area. Fox and Berrien soils reflect the small pockets of Class 1 / 2 land. Specialty crops are grown to a limited extent on Brantford soils, whereas the Fox and Berrien soils are well suited for specialty crop production, particularly tobacco and specialized horticultural crops. Area 3 (South East) Area 3 is a mix of Classes 1-4 capability. Much of the higher capability Class 1 lands are approximately coincident with the existing industrial designation in the County Plan. Classes 3 and 4 lands comprise much of the remainder of this area with some Class 2 lands closer to the bluff along the river and in the most westerly oxbow of the Grand River. South of the river and outside the existing industrial area, the soils are generally comprised of Brantford soils (representing the lower capability areas) and Berrien soils (coinciding with the higher capability area). The Berrien soils are generally well suited for specialty crops. North of the river and within the oxbow, the soils consist of a mix of Bookton, Brant and Tuscola soils. With the exception of the Brant soils, these soils are well suited for horticultural crops. Area 4 (South) Area 4 has large areas of Class 4 capability, which is non-prime agricultural land. Much of this Class 4 land is related to very rolling topography and centres on the tributaries which drain west to east towards the Grand River. This area is also characterized by large areas of Class 3 land along the drainage tributaries and a larger area of Class 3 land in the most westerly portion. Overall, Area 4 has the greatest degree of poorer agricultural lands. The Class 3/4 soils in Area 4 reflect the characteristics of the Brantford soils. Brantford soils are extensively used for common field crops and are used to a limited extent for specialized horticultural crops. The Class 4 areas associated with the valleys and
78 tributaries are characterized as alluvium soils with fine textured clayey floodplain deposits Area 5 (South West) Area 5 is roughly centered on the airport. The majority of Area 5 is Class 2 agricultural capability with some Class 3 lands closer in towards the City boundary. Of all the study areas, Area 5 has the largest concentration of better agricultural lands largely as a result of fewer tributaries passing through the area and larger areas of flatter topography. The Class 2 lands are representative of the Fox soils. Small pockets of Caledon and Teeswater soils are also present in this area. All of these soils are very good soils for specialty crops, and most commonly, tobacco and potatoes. Area 6 (West) Area 6 is a mix of all four classifications and is a relatively small area for consideration. Similar to Area 5, the Fox soils predominate this area, with small pockets of Caledon and Teeswater soils. All of these soils are considered Class 1 / 2 soils, and are very good soils for specialty crops, such as tobacco and potatoes. Area 7 (North) Area 7 West has small isolated pockets of Class 1 soils surrounded by larger areas of Class 2 soils, with some Class 3 soils and poorer located along Whitemans Creek, valley and along the floodplain of the Grand River. Much of Area 7 is affected by existing and future aggregate activities. The higher agricultural capability soils of Burford and Fox are largely represented in this area with small pockets of Teeswater soils. All of these soils are very good for specialty crop production. However, the Burford soils may require more intensive management for some specialty crops such as tobacco and potatoes.
79 - 6 - In summary, the higher quality agricultural soils are generally located in Growth Areas 5, 6 and 7. Area 4 has the poorest agricultural soils because of the topography and drainage limitations associated with the tributaries to the Grand River. The soil capability in Areas 1, 2 and 3 are mixed with few concentrations of acres with higher agricultural soils.
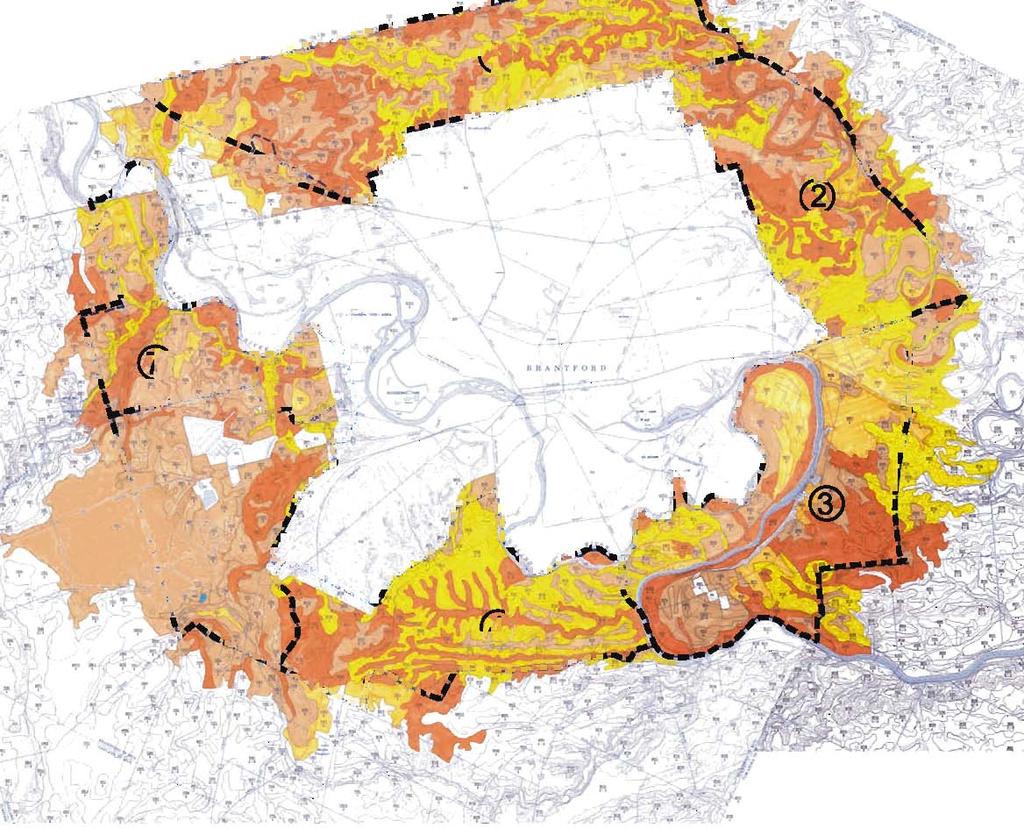

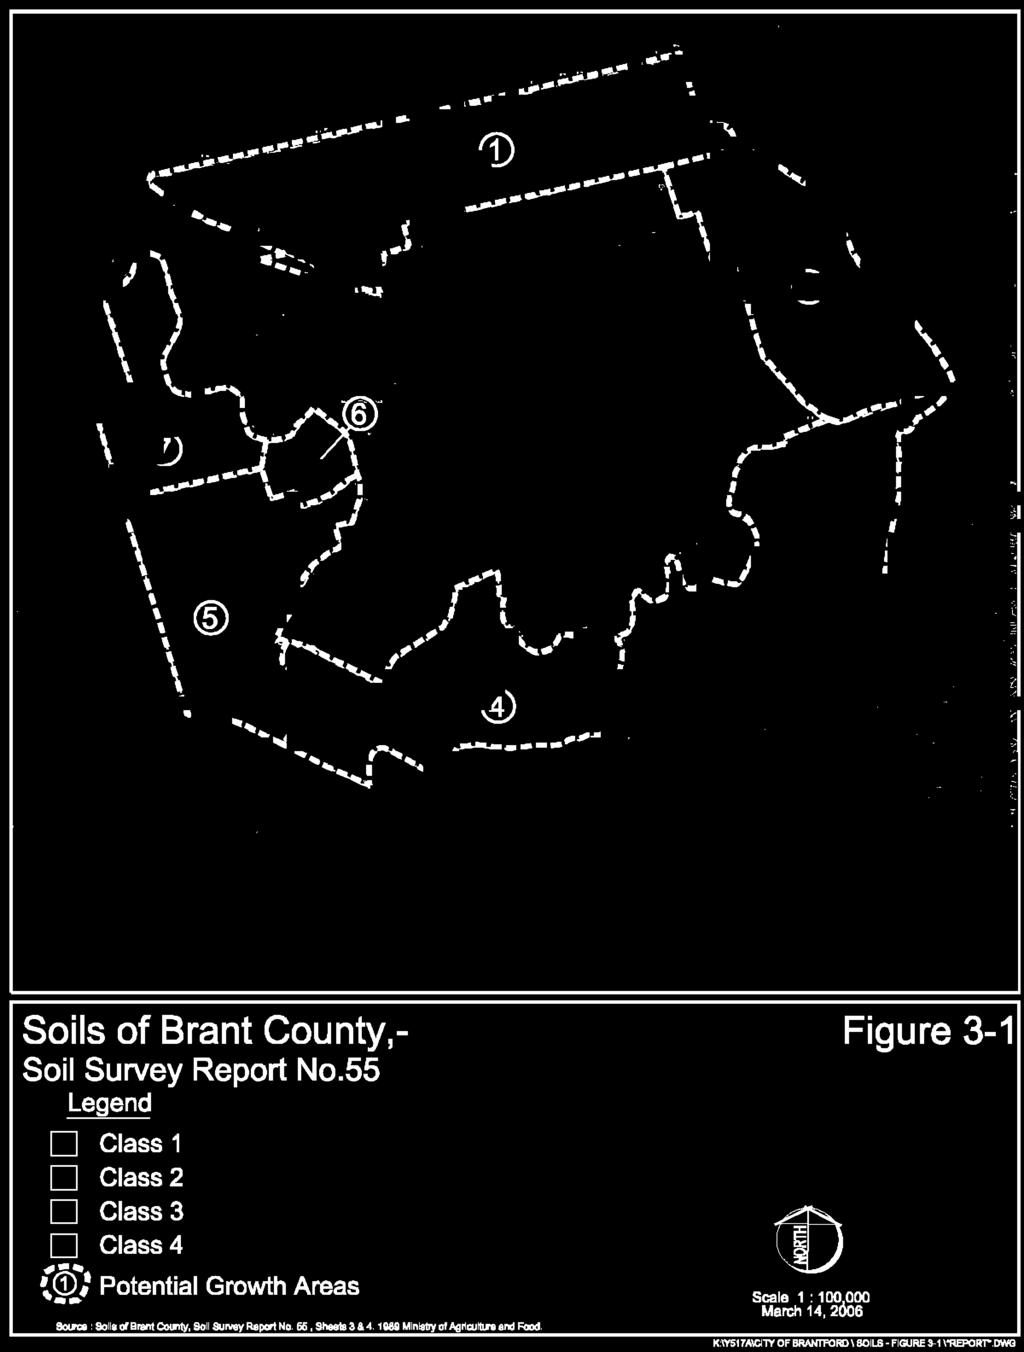
80
81 Appendix 4 Mineral Aggregate Resources
82 APPENDIX 4 MINERAL AGGREGATE RESOURCES AND LICENSED PITS There is a provincial interest in ensuring that mineral aggregate resources are protected for long-term use. In order to achieve this, the PPS limits development and activities that preclude or hinder the establishment of new operations or access to resources in areas adjacent to, or in, known deposits of mineral aggregate resources. Furthermore, the PPS requires that as much of the mineral aggregate resources, as is realistically possible, be made available as close to market as possible. Both the County of Brant Official Plan and City of Brantford Official Plan implement the PPS. The County Plan recognizes mineral aggregates as an essential non-renewable resource, and the policies of the Plan provides for the protection of existing pits and quarries and extraction operations as well as the mineral aggregate resources. Primary aggregate resources, as identified the Ministry of Natural Resources Aggregate Resource Inventory Papers, are protected in the County Plan, and with the exception of aggregate uses, only land uses directly related to Agriculture and Natural Environment shall be permitted. The City of Brantford Official Plan also protects the mineral aggregate resources within the City boundaries. Mineral Resources Areas within the City are identified in the Plan, and the policies of the Plan are intended to control development within, and adjacent to, Mineral Resource Areas such that the long-term availability of the resource is not precluded. The County of Brant, and in particular the former Brantford Township, has large concentration of good quality sand and gravel deposits. Crushed aggregate from bedrock resources is generally not available or economically feasible in the County, given the depth of the bedrock formations in the County.
83 According to the Ministry of Natural Resources Aggregate Resources Inventory Paper (ARIP) No. 8, the primary sand and gravel resources surrounding the City of Brantford (and in the former Township of Brantford) are predominantly located west and northwest of the City (see Figure 4-1). These primary resources are comprised of extensive outwash deposits that extend along the Grand River, between Paris and Brantford and along Whiteman s Creek. A number of licensed pits are located within these outwash deposits west of the City of Brantford. The primary resources areas do not affect potential growth areas 1, 2, 3 and 4, and therefore, these growth areas are not constrained by aggregate resources and/or licensed pits. Area 5 (Southwest) Area 5 Southwest is partially constrained by virtue of two licensed pits to the south and southwest of the airport. However, identified aggregate resources do not affect the majority of Area 5. A small portion of the Primary Resource Area, as identified in ARIP Report No. 8, is located in the northwest corner of the growth area. Area 6 West Area 6 is largely unconstrained by aggregate resources. There is an area immediately adjacent to the river that is shown as a Secondary Resource Area, in ARIP Report No. 8 Area 7 (West) Area 7 West has the greatest area of aggregate resource potential. Firstly, there is a cluster of licensed pits to the north and south of Highway 403, immediately west of the Grand River. These licensed pits occupy much of the area between the Grand River and the Paris Urban Area. The Paris Urban Area forms the westerly boundary of the northern portion of Area 7. The southerly portion of Area 7 is centered on Whiteman s Creek. The Primary Resource Areas are located to the northwest and southeast of Whiteman s Creek and occupy much of the southern portion of Area 7. According to the Aggregate Resources Inventory Report No. 8, the aggregate resources within Area 7 are considered to have high quality gravel with an average depth of 8 metres (25 feet).
84 In summary, Area 7 has the greatest area of aggregate resources potential and licensed pits. Aggregate resources affect the majority of Area 7.
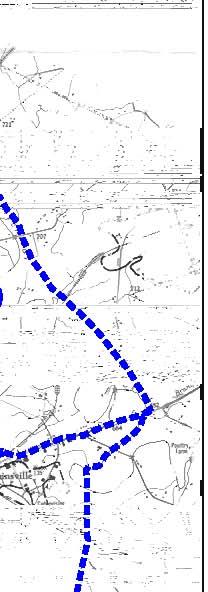
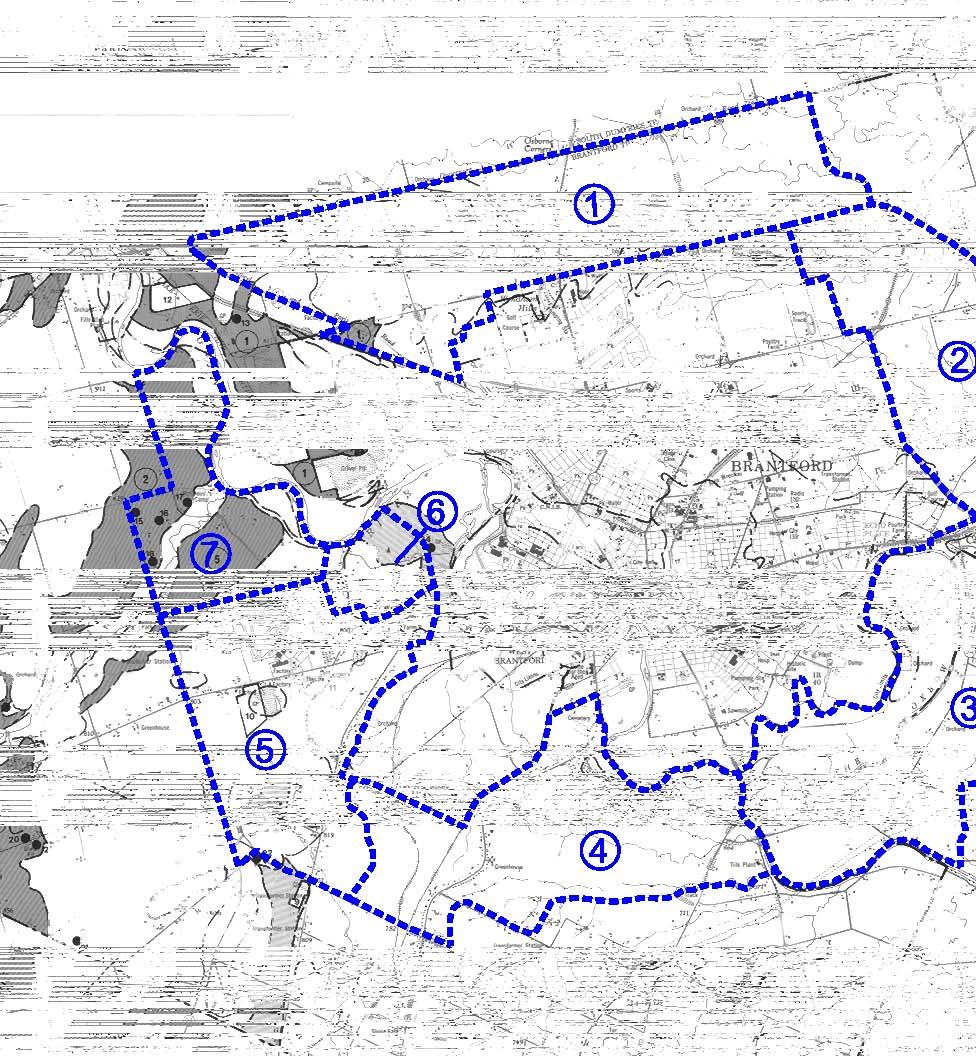

85
86 Appendix 5 Overview of Natural Heritage Features by Potential Growth Areas
87 BRANTFORD GROWTH MANAGEMENT STRATEGY NATURAL HERITAGE FEATURES The following provides an overview of natural heritage features by potential growth area. The rationale was based on a compilation of existing information from a variety of sources including relevant Official Plans, Natural Heritage Information Centre (NHIC), aerial photos, and GRCA mapping and data. To evaluate the constraints to development in each area, a ranking system was developed (i.e. 1 = least constrained to 7 = most constrained). The methodology and evaluation criteria are summarized in the Evaluation Table. For clarity and consistency, we separated out the main aquatic, wetland, and terrestrial rationale and grouped them accordingly in each respective Block, similar to our Evaluation Table. Area 1 Low Constraint Rating (3 rd Overall) Aquatic Features Numerous tributaries of Fairchild Creek, including some headwater reaches occur laterally through this area. Within this block, aquatic features collectively represent 12% of its total area; Wetland Features Within this block, wetland features collectively represent 6% of its total area where 3% constitutes Provincially Significant Wetland area. Terrestrial Features Features include Conservation Lands and lands identified with susceptible slopes (i.e. Slope Erosion in the table). These lands collectively represent 7.5% of the total area within this block. Area 2 Medium Constraint Rating (6 th Overall) Aquatic Features A fairly large section of the Fairchild Creek meander belt and various tributaries traverse through this area. Within this block, aquatic features represent just over 24% of its total area; Wetland Features Only non-provincially significant wetland features occur within this block constituting approximately 4% of this block s total area. Terrestrial Features - Features include Conservation Lands and lands identified with susceptible slopes. These lands collectively represent 18% of the total area within this block.
88 MEMO Page 2 th Area 3 High Constraint Rating (7 Overall) Aquatic Features - The Grand River, its floodplain, and associated tributaries meander right through the middle of this block. In addition, the river also flanks the northwestern and southern edges of this area. Therefore, the aquatic coverage represents almost 66% of the total available area in this block; Wetland Features - Only non-provincially significant wetland features occur within this block constituting approximately 2.5% of this block s total area. Terrestrial Features - Features include Conservation Lands and lands identified with susceptible slopes. These lands collectively represent 10% of the total area within this block. Area 4 Medium Constraint Rating (4 th Overall) Aquatic Features This block contains some headwater reaches of D Aubigny Creek and a section of the Grand River in the northeast corner, which collectively represents only 6% of the total area in the block; Wetland Features - Within this block, wetland features collectively represent 9% of its total area where 3% constitutes Provincially Significant Wetland area. Terrestrial features - Features include Conservation Lands and lands identified with susceptible slopes. These lands collectively represent 14.5% of the total area within this block. Area 5 Low Constraint Rating (1 st Overall) Aquatic Features The only aquatic constraint is a small section of Mount Pleasant Creek that cuts across the southern end of this block, which represents only 3% of the total area; Wetland features - Only non-provincially significant wetland features occur within this block constituting approximately 1% of this block s total area. Terrestrial features - Features include Conservation Lands and lands identified with susceptible slopes. These lands collectively represent 1% of the total area within this block.
89 MEMO Page 3 nd Area 6 Low Constraint Rating (2 Overall) Aquatic Features The only aquatic constraint to development is a section of the Grand River and floodplain that flanks the northside of this block, which comprises 12% of the total block area; Wetland features - Only non-provincially significant wetland features occur within this block constituting approximately 0.5% of this block s total area. Terrestrial features - Features include Conservation Lands and lands identified with susceptible slopes. These lands collectively represent 10% of the total area within this block. Area 7 Medium Constraint Rating (5 th Overall) Aquatic Features Whiteman s Creek bisects this entire Block and the Grand River floodplain flanks the entire eastside. As a result, 31% of the total area represents a significant constraint to development (floodplains included); Wetland features - Within this block, wetland features collectively represent 4.5% of its total area where 4% constitutes Provincially Significant Wetland area. Terrestrial features - Features include Conservation Lands and lands identified with susceptible slopes. These lands collectively represent 1% of the total area within this block.
90 Brantford Growth Strategy - Draft Natural Heritage Evaluation Category Natural Feature Block (Area) Aquatic Wetland Terrestrial Shoreline 0.03 a GRCA Flood plains Virtual Drainage River-stream cold water Total Area Evaluation (H,M,L b ) Low Medium High Low Low Low Medium Rank c Provincially Significant Wetlands Other Wetlands Total Area Evaluation (H,M,L) Medium Medium Low High Low Low Medium Rank Forest ANSI Other Conservation Lands Slope Erosion Total Area Evaluation (H, M, L) Medium High Medium High Low Medium Low Rank Percent Area (%)of Natural Heritage Features Constraint Rank (H,M,L) Low Medium High Medium Low Low Medium Overall Rank Notes: a - b - c - The total percentage area of Natural Heritage Features within the Block (Area). Percentage (%) areas were calculated by dividing the area of a natural feature within each block by the total area of that block. A ratio was calculated for the drainage featues (Virtual Drainage and River-stream cold water) where the total kilometres Blocks (Areas) 1 through 7 were ranked as either having High, Medium or Low constraints in terms of total percentage for each category. The highest percentage area was divided into thirds determining what was High, Medium or Low. For example, for the Aquatic category, Block "3" has the highest percentage (65.85) of aquatic natural features. Therefore Blocks with low constraints ranged from 0 to 22, Blocks with medium constraints ranged from 22 to 44 and Blocks with high constraints ranged from 44 to 66. Blocks (Areas) were ranked from 1 through 7 for each category, from least constrained to most constrained.
91 Appendix 6 Groundwater and Wellhead Protection Area Policies from the County of Brant Official Plan
92 SECTION 2 LAND USE MANAGEMENT STRATEGY the Ministry's recommended sound and vibration limits. The County of Brant may use Site Plan Control in accordance with Section 7.5 of this Plan to require buffering between uses of land where there may be conflicts such that one use may detract from the enjoyment and functioning of the adjoining use. Such buffering will be considered in light of the Ministry of Environment s guideline entitled Guideline on Separation Distance Between Industrial Facilities and Sensitive Land Uses, as amended from time to time, and may include landscaping, screening and the separation of uses by extra distance between them. Added conditions such as increased yard requirement, planting strips, fencing, and/or berms, deflective lighting, restrictions of use of certain portions of the land, etc., are all added requirements that may be imposed to offset aspects of incompatibility between any two land uses. In areas where a conflict already exists between residential and non-residential land uses, the municipality may consider the erection of a buffer such as sound attenuation fencing as either a general or local improvement. The municipality may also consider the installation of attractive buffering to screen storage and loading areas, particularly where there is an interface with residential uses or the 403 Freeway GROUNDWATER PROTECTION The County of Brant is extremely dependent on groundwater for all of the community s water requirements. In consultation with the Conservation Authorities and the Province, a Groundwater Protection Plan will be developed and implemented. Potential threats to surface and groundwater quality and quantity need to be evaluated, monitored, and appropriate policies implemented in order to prevent, mitigate or eliminate negative impacts. The Grand River Conservation Authority has undertaken a Grand River Regional Groundwater Study and has draft maps on Areas Vulnerable to Contamination, Overburden Thickness, Sand and Gravel Thickness, Upward Vertical Hydraulic Gradients, Downward Vertical Hydraulic Gradients, Potential Groundwater Discharge Areas, Water Table Surface, and Depth to First Aquifer. In addition studies have been done for the Paris municipal wells to determine the area of immediate or primary influence. Similar studies are being done for the Burford area and were done for St. George and around the Brantford Airport. Development applications within the wellhead protection areas and within the areas that are vulnerable to contamination including the Settlement Areas of Burford and the portion of St. George located east of Lot 8, will not be permitted where there is a COUNTY OF BRANT OFFICIAL PLAN PAGE 33 November, 2000
93 SECTION 2 LAND USE MANAGEMENT STRATEGY proposed use that includes any form of the following: underground transmission of oil, gasoline, or other petroleum liquid products; wood preserving and treating; outdoor storage of road salt, or other de-icing materials and dumping of salt-laden snow; petroleum product, refining and manufacturing; furniture and wood stripping and refinishing; horticultural nurseries; intensive livestock operations including the spreading of liquid manure; landfills; chemical/biological laboratory; chemical manufacturing/industrial areas; disposal of leachable waste (including the spreading of biosolids); electroplaters and metal fabricators; facilities generating, treating or disposing hazardous wastes; asphalt/concrete/tar plants; automobile junk yards; bulk fuel oil storage yards; car washes; cemeteries; dry cleaning facilities; gasoline service stations; underground storage tanks; agricultural spraying of herbicides and pesticides. Applications for any industrial or commercial uses within the Wellhead Protection Area (WHPA) must include a report outlining the nature of the business, details of their operation, specify if any chemical substances are used or stored on site, and the measures proposed for spill containment. Periodic groundwater quality monitoring for the area down gradient from the development may also be required as part of the approval process. Applications for golf courses within the WHPA will require a site specific assessment of the potential impact on the WHPA and periodic groundwater quality monitoring for the down gradient from the development as part of any approval process. The establishment of any new aggregate extraction pit will also require a site specific assessment of the potential impact on the WHPA including an assessment of potential interference, water quality, and stream flow impacts. COUNTY OF BRANT OFFICIAL PLAN PAGE 34 November, 2000
94 SECTION 2 LAND USE MANAGEMENT STRATEGY Approval from the County of Brant will be required before any application is processed to either a site plan approval stage and/or a zoning by-law amendment stage of development. The County of Brant will also require all abandoned wells be plugged in accordance with Ontario Regulation 903 or as amended from time to time. The County s Nutrient Management By-Law requires that Nutrient Management Plans be developed and approved by the County before new or expanded livestock operations may occur. The spreading of sludge, and the establishment of new intensive livestock operations are not permitted in the WHPA. Within the WHPA, no aggregate extraction operation, fish farm, landscape feature or any other uses that would result in the exposure of the high water table shall be permitted. Excavation shall be required to remain a minimum of one metre above the high water table. Rehabilitation of established licensed pits will also be restricted from establishing livestock intensive agricultural uses within the WHPA. Throughout the County of Brant, where development involves the taking of water in excess of 10,000 litres per day, the following additional policies shall apply: 1. hydrogeological studies will be required to ensure the quality and quantity of ground and surface water available to adjoining users of the aquifer is maintained; 2. no permit or license for the taking of water shall be issued by the appropriate authority until the hydrogeological studies have been circulated and consulted upon by the County of Brant; 3. the effect of land use proposals on the groundwater aquifers utilized by approved water taking operations will be considered before development is permitted so as to ensure land use compatibility and to maintain the quality and quantity of the groundwater resource in the aquifer; and 4. the effect of land use proposals on any Provincially Significant Wetlands and on any cold water trout stream including Whiteman s, Gilbert, and McKensie Creeks DEVELOPMENT ALONG INLAND WATERCOURSES COUNTY OF BRANT OFFICIAL PLAN PAGE 35 November, 2000
95 Appendix 7 Water Distribution System Assessment and Sanitary Sewer System Assessment
96 Appendix 7 Part 1 Brantford Growth Management Strategy Water and Wastewater Assessment, Relative Impact of Growth Areas on the Existing Water and Wastewater Systems
97 Earth Tech Canada Inc. Page 1 1. WATER DISTRIBUTION SYSTEM ASSESSMENT The purpose of the water distribution system assessment is to identify the relative servicing impact of the proposed growth areas on existing water distribution system. The assessment focused on available pumping and storage capacity and the need for improvement to service growth areas outside the City boundary. The assessment is based on a projected build out population of approximately 100,000 and a design population of 30,000 for each of the identified growth areas. It is to be noted that this assessment was completed prior to the finalization of the projected population and employment estimates. Depending on the final population and employment projections, the water distribution assessment may have to be revised. In the assessment process the existing City of Brantford water hydraulic model is used to evaluate system capacity and identify the need for improvement works. The City uses the same hydraulic model for their Master Plan Study Design Criteria The following design criteria were used to determine the projected water demand for the estimated growth population of 30,000 persons. Average Day Consumption factor = 450 L/cap/day Maximum Day Consumption factor = 1.8 ( 1 ) x Average Day Consumption factor Peak Hour Consumption factor = 2.7 ( 2 ) x Average Day Consumption factor The above design criteria are used to calculate system demands and Tables 1 summarizes the system demand for a population of 30, Obtained from MOE Guidelines, Appendix N, Table 1 Maximum Day Factor for equivalent population of Obtained from MOE Guidelines, Appendix N, Table 1 Peak Rate Factor for equivalent population of File Location: N:\Y517\A\Final report\app 7 Part 1.doc
98 Earth Tech Canada Inc. Page 2 Table 1: System Demand for a Population of 30,000 Demand Condition Average Day Demand Maximum Day Demand Peak Hour Demand System Demand L/s (13.5ML/day) L/s (24.3 ML/day) L/s (36.5 ML/day) The storage requirement is calculated based on MOE Guidelines. According to MOE Guidelines, storage requirement is generally calaculated by: Total Storage = Fire Storage (A) + Equalization Storage (B) + Emergency Storage (C) Where: A = B = Fire Storage to allow for adequate fire supply and estimated based on population Equalization Storage to compensate for difference in demand when the local demand exceeds pumping capacity (25% of Max Day Demand) C = Emergency Storage to provide an allowance during system upset (25% of A + B) Table 2 summarizes the requirement storage to service each Growth Area via different water distribution district (pressure zone) File Location: N:\Y517\A\Final report\app 7 Part 1.doc
99 Earth Tech Canada Inc. Page 3 Table 2: MOE Recommended Storage Requirement for Population of 30,000 Via Zone 1 Via Zone 2/3 Via Zone 4 40% Via Z4 60% Via Z2/3 Total Equivalent Population per Zone within City Boundary Total Equivalent Population for Growth Area 74,000 74,000 21,000 21,000 74,000 30,000 30,000 30,000 12,000 16,000 Total Equivalent Population 104, ,000 51,000 33,000 90,000 Max. Day Flow within City Boundary (ML/d) 47 ML/d* 42 ML/d* 16 ML/d* 16 ML/d* 42ML/d* Max Day Flow for Growth Area 24 ML/d 24 ML/d 24 ML/d 10 ML/d 14 ML/d Total Max. Day Flow 71 ML/d 66 ML/d 40 ML/d 26 ML/d 56 ML/d A. Fire Storage Fire Flow ( 3 ) Fire Duration ( 4 ) 378 L/s 378 L/s 378 L/s 348 L/d 378 L/s 6 hrs 6 hrs 6 hrs 5 hrs 6 hrs Required Fire Storage = 8.2ML 8.2ML 8.2ML 6.3ML 8.2ML B. Equalization Storage 25% of Max Day Demand = 18 ML 16 ML 10 ML 6.5 ML 14ML C. Emergency Storage 25% of (A + B) = 6.6 ML 6.0 ML 4.6ML 3.2ML 5.6ML Total Required Storage A + B + C 32.8 ML 30.2 ML 22.8 ML 16ML 27.8ML * System demand within City boundary is calculated based on City s standards (274Lpcd for existing Lpcd for future) 1.2. Analysis of Water Servicing Requirements for the Seven Growth Areas The water distribution system assessments include the following: 3 Obtained from MOE Guidelines, Appendix N, Table 2 Suggested Fire Flow for equivalent population of Obtained from MOE Guidelines, Appendix N, Table 2 Fire Flow Duration for equivalent population of File Location: N:\Y517\A\Final report\app 7 Part 1.doc

100 Earth Tech Canada Inc. Page 4 1. Topographic analysis to identify potential water supply options. 2. Pumping capacity assessment to identify the additional pumping capacity requirement in each zone to maintain water supply to the growth area. 3. Storage capacity assessment to identify additional storage requirement in each zone to maintain sufficient storage as per the MOE Guideline (fire storage + equalization storage + emergency storage). Figure 1 presents the existing water service boundary for the City of Brantford and the location for each growth area. The subsequent sections summarize the water servicing requirements for each of the seven growth areas. Figure 1: City of Brantford Existing Water Service Boundary and Growth Areas Limit Area 1 The topographic information suggests that the majority of water supply to Area 1 will be from Zone 1 via Zone 2/3 and Zone 4. File Location: N:\Y517\A\Final report\app 7 Part 1.doc
101 Earth Tech Canada Inc. Page 5 Additional Zone 1 Pumping Capacity Requirement = 9.7 ML/day No Additional Zone 2/3 Storage Capacity is required No Additional Zone 4 Storage Capacity is required Area 2 The topographic information suggests that the majority of water supply to Area 2 will be from Zone 1 via Zone 2/3. The following system upgrades are required to service 30,000 persons in Area 2: Additional Zone 1 Pumping Capacity Requirement = 9.7 ML/day Additional Zone 2 Storage Capacity Requirement = 2.0 ML Area 3 The topographic information suggests that the majority of water supply to Area 2 will be from Zone 1 via Zone 2/3. The following system upgrades are required to service 30,000 persons in Area 3: Additional Zone 1 Pumping Capacity Requirement = 9.7 ML/day Additional Zone 2 Storage Capacity Requirement = 2.0 ML Area 4 The existing water distribution system connectivity allows servicing Area 4 directly from Zone 1. The following system upgrades are required to service 30,000 persons in Area 4: Additional Zone 1 Pumping Capacity Requirement = 9.7 ML/day Additional Zone 1 Storage Capacity Requirement = 9.0 ML Area 5 The topology of Area 5 and system separation by Grand River necessitates that a new pressure district be created to supply Area 5. Area 5 will be supplied from Zone 1 via new pumping station within the new pressure district. The following system upgrades are required to service 30,000 persons in Area 5: Additional Zone 1 Pumping Capacity Requirement = 9.7 ML/day File Location: N:\Y517\A\Final report\app 7 Part 1.doc
102 Earth Tech Canada Inc. Page 6 Pumping Capacity for New Zone Requirement = 51.8 ML/day Storage Capacity for New Zone Requirement = 14.8 ML Area 6 The topology of Area 6 and system separation by Grand River necessitates that a new pressure district be created to supply Area 6. Area 6 will be supplied from Zone 1 via new pumping station within the new pressure district. The following system upgrades are required to service 30,000 persons in Area 6: Additional Zone 1 Pumping Capacity Requirement = 9.7 ML/day Pumping Capacity for New Zone Requirement = 51.8 ML/day Storage Capacity for New Zone Requirement = 14.8 ML Area 7 The topology of Area 7 and system separation by Grand River necessitates that a new pressure district be created to supply Area 7. Area 7 will be supplied from Zone 1 via a new pumping station within the new pressure district. The following system upgrades are required to service 30,000 persons in Area 7: Additional Zone 1 Pumping Capacity Requirement = 9.7 ML/day Pumping Capacity for New Zone Requirement = 51.8 ML/day Storage Capacity for New Zone Requirement = 14.8 ML 1.3. Water Servicing Constraints The water servicing constraints for each of the seven growth areas are discussed in the following sections. Several factors are considered in the assessment of the water servicing of the seven growth areas including: 1. Constructability constraints including the need for land accusation and river crossings. 2. Existing infrastructure constraints including the need for additional storage and pumping facilities. File Location: N:\Y517\A\Final report\app 7 Part 1.doc
103 Earth Tech Canada Inc. Page 7 3. Capital costs of new infrastructure to provide additional water servicing capacity. 4. Long term operational cost including pumping cost Area 1 Constraints Growth Area 1 is situated to the north of the existing city boundary. The system assessment indicates that additional storage in Zones 1 and 2/3 and possibly 4 is required. Additional pumping capacity in Zone 1 is also needed to meet the expected demand. There are no major river crossings required and the need for land accusation to build new water infrastructure is low. However, in comparison to the other growth areas, Area 1 is the highest in elevation and is the furthest from the City water treatment facilities. Thus, more energy would be required to pump the water two Area 1 resulting in higher long term operational costs Area 2 Constraints Growth Area 2 is situated to the north east of the existing city boundary. The system assessment shows that additional storage in Zones 1 and 2/3 is required. Additional pumping capacity in Zone 1 is also needed to meet the expected demand. There are no major river crossings required and the need for land accusation to build new water infrastructure is low. The average increase in energy consumption to pump water to Area 2 would be required but not to the extent of Area1 thus resulting in medium long term operational costs Area 3 Constraints Growth Area 3 is located to the south east of the existing city boundary. The system assessment indicates that additional storage in Zones 1 and 2/3 is required. Additional pumping capacity in Zone 1 is also required to meet the expected demand. However, to provide water service to Area 3, a major river crossing is necessary (high constraint). There is limited existing water infrastructure available to service Area 3 and therefore a significant level of capital expenditure will be required for a new water supply network for the area (medium constrain). There would be an average increase in energy consumption to pump the water to this service Area resulting in a medium long term operational cost Area 4 Constraints Growth Area 4 is situated to the south of the existing city boundary. The system assessment shows that additional storage in Zone 1 is needed. Additional pumping capacity in Zone 1 is also required to meet the expected demand. In comparison to other growth areas, the water servicing of Area 4 would require the least storage and pumping upgrades (low constraint). However, to provide water service to Area 4 a File Location: N:\Y517\A\Final report\app 7 Part 1.doc
104 Earth Tech Canada Inc. Page 8 major river crossing is necessary (high constraint). The subject growth area can be serviced from the existing water infrastructure in Zone 1 and therefore limited new infrastructure would be required (low constrain). The closeness of Area 4 to the City s water treatment facilities means that the increase in energy consumption to pump the water and service Area 4 will be low compared to the other service areas resulting in low long term operational cost Area 5 Constraints Growth Area 5 is located to the west of the existing city boundary. The system assessment shows that servicing Area 5 would require the creation of a new pressure zone. The new pressure zone will be supplied from Zone 1. Thus additional storage in Zone 1 is needed in addition to the storage requirement for the new zone. Additional pumping capacity in Zone 1 is also required to meet the expected demand in addition to the need for a new pumping station to service the new zone. In comparison to the other growth areas, the servicing of Area 5 requires higher storage and pumping upgrades (high constraint). There will also be a need for land accusation for the new water storage and pumping facilities (high constraint). Though the Grand River separates Area 5 from the rest of the city, there is an existing water main crossing the Grand River which could be used to provide water supply to the new zone (low constraint). The subject growth area will require some capital investment for new infrastructure (medium constrain). There would be an average increase in energy consumption required to pump water to service Area 5 resulting in a medium long term operational cost Area 6 Constraints Growth Area 6 is situated to the north west of the existing city boundary. The system assessment shows that servicing Area 6 would necessitate the creation of a new pressure zone. The new pressure zone will be supplied from Zone 1. Thus additional storage in Zone 1 is needed in addition to the storage requirement for the new zone. Additional pumping capacity in Zone 1 is also required to meet the expected demand in addition to the need for a new pumping station to service the new zone. In comparison to the other growth areas, servicing of Area 6 requires high storage and pumping upgrades (high constraint). There will be a need for land accusation for the new water storage and pumping facilities and a river crossing (Grand River) to service Area 6 from the city water supply system (high constraint). The subject growth area will also require a sizable capital investment for new infrastructure (high constraint). Compared to the other areas, there would be an average increase in energy consumption to pump the water to Area 6 resulting in a medium long term operational cost. File Location: N:\Y517\A\Final report\app 7 Part 1.doc
105 Earth Tech Canada Inc. Page Area 7 Constraints Growth Area 7 is located to the north west of the existing city boundary. The system assessment shows that servicing Area 7 would require the creation of a new pressure zone. That would be supplied from Zone 1. Thus additional storage in Zone 1 is needed in addition to the storage requirements for the new zone. Additional pumping capacity in Zone 1 is also required to meet the expected demand in addition to the need for a new pumping station. In comparison to other growth areas, servicing Area 7 requires high storage and pumping upgrades (high constraint). Moreover, there will be a need for land accusation for the new water storage and pumping facilities (high constraint). A river crossing (Grand River) is also required (high constraint). There would also be a sizable capital investment for new infrastructure (high constraint). Area 7 has a very high ground elevation and is a considerable distance from the City water treatment facilities. Thus, more energy would be required to pump the water to Area 7 resulting in high long term operational costs. File Location: N:\Y517\A\Final report\app 7 Part 1.doc
106 Earth Tech Canada Inc. Page SANITARY SEWER SYSTEM ASSESSMENT Similar to the Water System Assessment, the Sanitary Sewer System Assessment reviewed the relative servicing impact of the proposed seven growth areas on the existing sanitary sewer collection system. The assessment is based on a projected build out population of approximately 100,000 and a design population of 30,000 for each of the identified growth areas. It is to be noted that this assessment was completed prior to the finalization of the projected population and employment estimates. Depending on the final population and employment projections, the sanitary sewer system assessment may have to be revised. The City of Brantford s H2OMAP sanitary sewer hydraulic model was used to evaluate the system capacity for each growth area Design Criteria The following design criteria were used to determine the projected peak sanitary flow for the build out population plus the estimated growth population of 30,000 persons. Average Sewage Flow = 450 L/cap/day Design Population = 50 persons/hectare Inflow / Infiltration (I/I) Flow Allowances = 0.28 L/ha/s ( 5 ) Sewage Flow Peaking Factor = Harmon Formula ( 6 ) Utilizing the above design criteria, the sanitary sewer flow for the growth areas based on 30,000 persons is as below: Average Sewage Flow = 156.2L/s (13.5 ML/day) I/I flow = L/s (14.5 ML/d) Harmon Peaking Factor = Allowance as per MOE standard for extraneous flows 6 M = /(4+p 0.5 ) File Location: N:\Y517\A\Final report\app 7 Part 1.doc
107 Earth Tech Canada Inc. Page 11 Total Sewage Flow ( 7 ) = 432.0L/s (37.3ML/d) The total sewage flow was applied to H2OMap Model in order to identify the system constraints Analysis of Sanitary Servicing Requirements for the Seven Growth Areas The following is a brief summary of the sanitary servicing requirements for each of the seven growth areas Area 1 Approximately 67% of the total sewage flow from Area I can be accomodated by the eastern trunk sewer system with the remaining 33% going to the western sanitary sewer system. Figure 1 presents the connections to the existing sanitary sewer system for Area 1. Figure 1: Sanitary Sewer System Servicing Area 1 7 Total Sewage Flow = Average Sewage Flow * Peaking Factor + I/I File Location: N:\Y517\A\Final report\app 7 Part 1.doc
108 Earth Tech Canada Inc. Page 12 In Figure 1, the sanitary sewer lines in red color were indicating the sanitary sewer restriction (potential surcharge section). According to Figure 1, there are five (5) potential surcharging sewer lines with a total length of the surcharging sewer lines of approximately 1.9 km. The majority of the potential surcharge occurred in the western sanitary sewer system and some potential surcharged sewer lines are also identified in the eastern trunk system, downstream of Empey Street Pumping Station Area 2 Two connections were identified to transport sewage flow from Area 2 to the waste water treatment plant. Figure 2 presents the connections for Area 2 development. Figure 2: Sanitary Sewer System Servicing Area 2 According to Figure 2, the hydraulic model identified a total of ten (10) potential surcharging sewer lines with a total length of the surcharging sections of approximately 0.8km. File Location: N:\Y517\A\Final report\app 7 Part 1.doc
109 Earth Tech Canada Inc. Page Area 3 Area 3 can be serviced from the existing 675mm sewer line on Colborne Street. Figure 3 presents the connection for Area 3 to the existing sanitary sewer system. Figure 3: Sanitary Sewer System Servicing Area 3 Based on the hydraulic analysis results two (2) pipes with a total length of 167m were identified as potential surcharging sewer lines. As indicated in Figure 3, the potential surcharge sections occurred at the following locations: 1. Intersection of Linden Ave and Colborne Street mm sewer line between Mohawk Street and Forest Road File Location: N:\Y517\A\Final report\app 7 Part 1.doc
110 Earth Tech Canada Inc. Page Area 4 Area 4 is located at the southeast side of City of Brantford s boundary. The potential connection for Area 4 development is the 1200mm sewer line on Delamere Street. Figure 4 presents the connection for Area 4. Figure 4: Sanitary Sewer System Servicing Area 4 The hydraulic model identified that 19 pipes with approximately 2.6km in length will be potentially surcharging. The majority of the potential surcharging sections occur in the 1200mm/1350mm western trunk sewer lines from River Road to Brantford Waste Water Treatment Plant Area 5 The potential sanitary sewer connection for this area is the existing 675mm sewer line on Shellard Lane. Figure 5 presents the connection for Area 5. File Location: N:\Y517\A\Final report\app 7 Part 1.doc
111 Earth Tech Canada Inc. Page 15 Figure 5: Sanitary Sewer System Servicing Area 5 With the total sewage flow applied to this connection, the hydraulic model identified 24 potential surcharging sewer lines. The surcharging sections are approximately 3.0 km in length and the majority of the potential surcharged sewer lines occur in the 1200mm/1350mm western trunk sewer lines from River Road to Brantford Waste Water Treatment Plant Area 6 Area 6 could be serviced from the existing 1050mm eastern trunk system as indicated in Figure 6. With the total sewage flow applied to this connection, 25 pipes with a total length of about 3.2 km were identified as being subject to potential surcharging. Similar to Areas 4 and 5, the majority of potential surcharging sewer lines occur in the 1200mm/1350mm western trunk sewer lines from River Road to Brantford Waste Water Treatment Plant. File Location: N:\Y517\A\Final report\app 7 Part 1.doc
112 Earth Tech Canada Inc. Page 16 Figure 6: Sanitary Sewer System Servicing Area Area 7 Area 7 can be serviced from the existing 750mm eastern trunk system as indicated in Figure 7. With the total sewage flow applied to this connection, 41 pipes with a total length of about 4.9km were identified as being subject to potential surcharging. Similar to Areas 3, 4 and 5 the majority of the potential surcharging sewer lines occur in the 1200mm/1350mm western trunk sewer lines from River Road to Brantford Waste Water Treatment Plant. File Location: N:\Y517\A\Final report\app 7 Part 1.doc
113 Earth Tech Canada Inc. Page 17 Figure 7: Sanitary Sewer System Servicing Area General Comments The main sanitary sewer system constraint in the western sanitary sewer trunk system is the 1200mm/1350mm sewer lines located between River Road and the Brantford Waste Water Treatment Plant. Improvement works to these sections of sewer line are common to Areas 4, 5, 6 and 7. One of the sanitary sewer constraints in the eastern sewer trunk system is the Empey Street Pumping Station. According to the information provided by the City, the existing Empey Street Pumping Station consists of 4 pumps (each with a rated capacity of 455 L/s). According to the City s operational policy, the Empey Street Pumping Station firm capacity consists of two pumps under normal operating condition with the remaining two pumps only being used as backup pumps. Thus, the total available pumping capacity is 910 L/s. The Empey Street Pumping Station may not have sufficient capacity to meet the design sewage flows. As well, some sections of the sewer lines downstream of the Empey Pumping Station are experiencing an extreme high velocity of 5m/s; which is higher than the maximum allowable velocity of 3.0 m/s as recommended in MOE Guidelines. In the lower part of the eastern trunk sewer File Location: N:\Y517\A\Final report\app 7 Part 1.doc
114 Earth Tech Canada Inc. Page 18 system, the slope of two 1050mm sewer lines changes from steep to flat. Figure 8 presents the cross section profile of these two pipes. Figure 8: Sewer lines Profile Forest Road & Mohawk Street Using the City s H2OMap Sewer Model, a potential surcharge was identified for an existing pipe downstream of the Empey Pumping Station which has a very flat slope (pipe ID EC328-EC276). However, the impact of this configuration on existing and future sewage flows cannot be properly evaluated due to the limitation of a steady-state hydraulic model. In order to more accurately determine the impact of increased sewage flows on the upstream sewer lines and the downstream sewer lines with that are experiencing high velocities, a fully dynamic modeling analysis is strongly recommended. The modeling analysis would identify appropriate operational arrangements and/or specific pipe capacity improvements. File Location: N:\Y517\A\Final report\app 7 Part 1.doc
115 Earth Tech Canada Inc. Page Sanitary Servicing Constraint The sanitary servicing constraints for each of the seven growth areas are discussed in the following sections. The following factors were considered in the assessment process: 1. Constructability constraints including the need for land accusation and river crossings. 2. Existing infrastructure constraints including available pipe capacity and the need for additional pumping facilities. 3. Capital costs including the cost of new infrastructure to provide sanitary servicing. 4. Long term operational cost including pumping cost Area 1 Constraints Growth Area 1 is situated to the north of the existing city boundary. The system assessment shows that the servicing of Area 1 can be made through a combination of both the Eastern Sewer Trunk and the Western Sewer Trunk systems. The analysis has indicated that the servicing of Area 1 will result in a potential surcharging of the existing sewer system resulting in a need for system improvements (medium constraints). Operational constraints in the Empey Street Pumping Station need to be addressed to service Area 1 through the Eastern Sewer Trunk (medium constraints). New sanitary infrastructure mainly in the western part of Area 1 would also be required (medium constrain). Servicing Area 1 through the Western Sewer Trunk will require the construction of a sewage pumping station within Area 1 due to the topology of the area. This would necessitate the need for land accusation (medium constraint). There will also be a need for multi pumping of sewage to the City wastewater treatment facilities resulting in long term operational costs (medium constraint) Area 2 Constraints Growth Area 2 is located to the north east of the existing city boundary. The system assessment shows that Area 2 can be serviced through the Eastern Sewer Trunk system. There would be some potential surcharging of the existing sewer system and thus the need for system improvements (medium constraints). Operational constraints in the Empey Street Pumping Station need to be addressed to be able service Area 2 through the Eastern Sewer Trunk (medium constraints). No river crossings are required and a limited amount of new sanitary infrastructure would be required (low constrain). Compared to the other service areas, the sanitary servicing of Area 2 would have limited pumping needs resulting in low long term operational costs (low constraint). File Location: N:\Y517\A\Final report\app 7 Part 1.doc
116 Earth Tech Canada Inc. Page Area 3 Constraints Growth Area 3 is located to the south east of the existing city boundary. The system assessment shows that servicing of Area 3 can be made through the Eastern Sewer Trunk system. The analysis indicated that servicing this will result in very limited potential surcharging in the existing sewers (low constraint). No operational constraints in existing pumping stations need to be addressed (low constraints). A River crossing would be required (medium constraint) and land acquisition for new pumping facilities would be needed (high constraint). Furthermore, the subject growth area has limited existing sanitary infrastructure and therefore a significant capital expenditure would be needed to build a new sanitary sewer system to service the area (high constraint). The servicing of Area 3 across the river would require the construction of a new pumping station with an outfall connection to the City wastewater treatment facilities resulting in high long term operational costs (high constraint) Area 4 Constraints Growth Area 4 is situated to the south of the existing city boundary. The system assessment shows that servicing of Area 4 can be made through the Western Sewer Trunk system. The analysis indicated that servicing of Area 4 will result in a potential surcharging of a few of the existing sewers (medium constraint). No operational constraints in existing pumping stations need to be addressed (low constraints). A River crossing and land acquisition for new pumping facilities would be required (high constrain). As well, a capital expenditure would be needed to build a new sanitary sewer system to service the area (high constraint). There would be limited pumping requirements resulting in long term operational costs (medium constraint) Area 5 Constraints Growth Area 5 is located to the west of the existing city boundary. The system assessment shows that servicing of Area 5 can be made through the Western Sewer Trunk system. The analysis has indicated that servicing of Area 5 will result in the potential surcharging of a few existing sewers (medium constraint). No operational constraints in existing pumping stations need to be addressed (low constraints). A River crossing and land accusation for new pumping facilities will be needed (high constraints). Furthermore, capital expenditures will be needed to build a new sanitary sewer system to service the area (high constraint). There would be limited pumping requirements resulting in long term operational costs (medium constraint). File Location: N:\Y517\A\Final report\app 7 Part 1.doc
117 Earth Tech Canada Inc. Page Area 6 Constraints Growth Area 6 is located to the north west of the existing city boundary. The system assessment shows that the servicing of Area 6 can be made through the Western Sewer Trunk system. The analysis has indicated that servicing of Area 6 will result in a potential surcharging of several existing sewers (high constraint). No operational constraints in the existing pumping stations need to be addressed (low constraints). A River crossing and land accusation for new pumping facilities will be needed (high constraints). Furthermore, capital expenditures will be needed to build a new sanitary sewer system to service the area (high constraint). The sanitary servicing of Area 6 across the river will require multiple pumping of sewage to the City s wastewater treatment facility resulting in long term operational costs (medium constraint) Area 7 Constraints Growth Area 7 is situated to the north west of the existing city boundary.. The system assessment shows that the servicing of Area 7 can be made through the Western Sewer Trunk system. The analysis has indicated that servicing of Area 7 will result in the potential surcharging of several existing sewers (high constraint). No operational constraints in the existing pumping stations needs to be addressed (low constraints). A River crossing and land accusation for new pumping facilities will be needed (high constraint). Furthermore, capital expenditures will be needed to build a new sanitary sewer system to service the area (high constraint). The sanitary servicing of Area 7 across the river will require multiple pumping of sewage to the City s wastewater treatment facility resulting in long term operational costs (medium constraint). File Location: N:\Y517\A\Final report\app 7 Part 1.doc
118 Appendix 7 Part 2 Brantford Growth Management Strategy Water and Wastewater Servicing Upgrades and Costs for Growth Area 1
119 Earth Tech Canada Inc. Page 1 1. INTRODUCTION The purpose of the water and wastewater servicing assessment is to identify the capacity upgrades and costs required to accommodate Brantford s projected growth at three points in time. The following is a description of the three growth scenarios: Complete build-out within the existing City limits by year 2036 Growth Area 1 by year 2046 Growth Area 1 at build out beyond The population of the City of Brantford is projected to increase to 155,500 by year The population increase, hence water and wastewater servicing, is based on the Compact City Scenario B that uses the following population projections: Total population projection by year 2046: 155,500 persons Scenario B City build-out population by year 2036: 139,000 persons Additional population in Area 1 by year 2046: 16,500 persons Additional population to build-out of Area 1 beyond year 2046: 15,000 persons For the ICI land the servicing is evaluated based the following: Scenario B City build-out ICI land by year 2036: 582 ha Area 1 ICI land by year 2046: 371 ha In the Water Servicing system assessment the following demand rates are used: Existing residential water demand: 274 l/cap/day Future residential water demand: 450 l/cap/day ICI water demand rate: 22,500 l/ha/day Max. day factor: 1.72 Peak hour factor: 2.75 In the Wastewater Servicing system assessment the following demand rates are used: Existing residential sanitary flow rate: l/cap/day (including ICI and I/I) Future residential sanitary flow rate: 450 l/cap/day Future ICI sanitary flow rate: 22,500 l/ha/day Future I/I rate: 13,306 l/ha/day Harmon peaking factor: 2 File Location: N:\y517\a\Appendix 7 Part2April 13.doc
120 Earth Tech Canada Inc. Page 2 2. WATER SYSTEM CAPACITY ASSESSMENT AND COSTS 2.1 Scenario 1 Servicing City Build-Out by year 2036 This scenario assesses the ability of the existing water supply system to service the City to the projected full build-out population of 139,000 by year 2036 as described in the following tables 1, 2 & 3. A) Water Storage Table 1 Scenario 1 System Storage Requirements Pressure District PD1 PD2/3 PD4 Res Population ,736 64,075 2,189 ICI Population ,759 18,368 Total Population ,715 73,834 20,557 Ave. Day Demand (L/s) Max. Day Demand (L/s) Water Storage Required as per MOE Fire Flow per area (L/s) Duration (hr) A - Fire Storage (m3) 8,165 8,165 4,304 B - Equalization Storage (m3) 11,696 10,452 3,890 C - Emergency Storage (m3) 4,965 4,654 2,048 Total Required Storage = A+B+C (m3) 24,825 23,270 10,242 Total Required Storage = A+B+C (ML) Existing Storage (ML) Storage Surplus (+) or Deficit (-) as per MOE Guidelines (ML) The analysis indicates that to service the City at full build-out (2036) there will be an additional storage requirement of approximately 1.5 million litres. An elevated storage facility is planned for 2016 at a cost of $2.0 million in the south west portion of the City that will also serve the downtown. File Location: N:\y517\a\Appendix 7 Part2April 13.doc
121 Earth Tech Canada Inc. Page 3 B) Water Pumping Table 2 Scenario 1 System Pumping Capacity Requirements Pressure District Total PD1 (PD1 Local + Transfer to PD2/PD3 & PD4 PD2/3 PD4 Peak Hour Demand (L/s) Max Day Demand (L/s) Fire Flow (L/s) Total Max Day + Fire Flow (L/s) Required Pump Capacity (L/s) Required Pump Capacity (ML/D) Existing Firm Pump Capacity (ML/D) Additional Pumping Capacity (ML/D) The analysis indicates that no additional pumping capacity is required to service the City full build-out population. C) Water Transmission The analysis indicates the need for water transmission upgrades to accommodate the projected growth in the amount of $7.9 million which represents the prorated growth component directly attributed to the full build out (2036). The following water transmission main upgrades (for full build out) are planned for this timeframe. The location of these upgrade projects can be reviewed on Drawing W-1(shown in red). Project No. Table 3 Scenario 1 Water Transmission Capacity Upgrade Requirements Year Description Cost ($) in Million From intersection of Pearl St. & Nelson St. to Wayne Greztky PS $ Along Elgin St. from Wayne Gretzky Res to Hachborn Rd. $ Along Grandriver Ave. between Morrell St. & Waterloo St. $ From intersection of Brant Ave. & Parkside Rd. to Tollgate PS $ From Tollgate Res to King George ET $ Along Shellard Lane between Killarney St. & Hillcrest Ave. $0.8 Total $7.9 File Location: N:\y517\a\Appendix 7 Part2April 13.doc
122 Earth Tech Canada Inc. Page 4 E) Water Treatment Additional water treatment plant capacity will be required to service the anticipated build-out residential population and ICI water demands in Based on a construction unit cost of $1.00 per litre and a maximum day per capita equivalent flow of 860 litres, the prorated cost to provide additional water treatment capacity is $19.6 million. This represents only the prorated growth component of a $50 million Water Treatment Plant expansion planned for Summary of Scenario 1 (2036) Water Servicing Costs Additional Storage: $2.0 million Additional Pumping: $0.0 million Water Transmission Upgrades: $7.9 million Water Treatment Upgrades: $19.6 million Total Build Out (2036) Water Servicing Cost $29.5 million 2.2 Scenario 2 Servicing the Preferred Growth Area (Area 1) by year 2046 This scenario only considers capacity upgrades and costs for water servicing beyond year 2036 and up to 2046 as described in tables 4, 5 and 6. A) Water Storage Table 4 Scenario 2 System Storage Capacity Requirements Pressure District PD1 PD2/3 PD4 Water Storage Required as per MOE Fire Flow per area (L/s) Duration (hr) A - Fire Storage (m3) 8,165 8,165 8,165 B - Equalization Storage (m3) 11,696 12,566 8,383 C - Emergency Storage (m3) 4,965 5,183 4,137 Total Required Storage = A+B+C (m3) 24,825 25,914 20,685 Total Required Storage = A+B+C (ML) Existing Storage (ML) Storage Surplus (+) or Deficit (-) as per MOE Guidelines (ML) File Location: N:\y517\a\Appendix 7 Part2April 13.doc
123 Earth Tech Canada Inc. Page 5 The analysis indicates that to service Area 1 by year 2046 an additional storage (over and above the 1.5 million litres required in pressure district 1) of approximately 8.7 million litres is required in pressure district 4 at a cost of $4.8 million. This represents only the prorated growth component of a 6.6 million litres above ground storage facility expansion and a new 3 million litres elevated storage tank planned for 2026 at a cost of $6.0 million. The additional capacity provided is for growth beyond 2046 and is for the full build-out of Area 1. B) Water Pumping Table 5 Scenario 2 System Pumping Capacity Requirements Pressure Zone Total PD1 + AREA1 (PD1 Local + Transfer to PD2/PD3, PD4 & AREA 1) PD2/3 + AREA 1 PD4 + AREA 1 Peak Hour Demand (L/s) Max Day Demand (L/s) Fire Flow (L/s) Total Max Day + Fire Flow (L/s) Required Pump Capacity (L/s) Required Pump Capacity (ML/D) Existing Firm Pump Capacity (ML/D) Additional Pumping Capacity (ML/D) The analysis indicates that to service Growth Area 1 by year 2046 an additional pumping capacity is required at a cost of $0.1 million for the supply and installation of the pumps. This represents only the prorated growth component of pumping upgrades at the pressure district 4 above ground storage facility planned for construction in 2026 at a cost of $1.0M. C) Water Transmission The analysis indicates the need for water transmission upgrades to accommodate the projected growth in the amount of $3.8 million which represents the prorated growth component directly attributed to the servicing of that portion of Area 1 that services the 2046 growth projection. The following water transmission main upgrades are planned for this timeframe. The location of these upgrade projects can be reviewed on Drawing W-1(shown in green). File Location: N:\y517\a\Appendix 7 Part2April 13.doc
124 Earth Tech Canada Inc. Page 6 Table 6 Scenario 2 Water Transmission Capacity Upgrade Requirements Project No. Year Description Cost ($) in Million Within PD4 Boundary, North West of Hwy 403 $3.8 D) Water Treatment Additional water treatment plant capacity will be required to service that portion of Area 1 that services the 2046 growth projection. Based on a construction unit cost of $1.00 per litre and a maximum day per capita equivalent flow of 860 litres, the prorated cost to provide additional water treatment capacity is approximately $14.2 million. This represents only the prorated growth component of a $50 million Water Treatment Plant expansion planned for Summary of Water Costs for Scenario 2 Servicing Area 1 by year 2046 Additional Storage: $4.8 million Additional Pumping: $0.1 million Water Transmission Upgrades: $3.8 million Water Treatment Upgrades: $14.2 million Total Area 1 Water Servicing Costs $22.9 million 2.3 Scenario 3 Servicing the preferred Growth Area (Area 1) to Build-Out This scenario only considers capacity upgrades and costs for water servicing from 2046 to build-out in Area 1 as described in tables 7, 8 and 9. A) Water Storage The analysis indicates that to service the remainder of Area 1 (from 2046 to build-out) an additional storage (over and above the additional storage required for scenarios 1 and 2 ) of approximately 2.0 million litres is required at both PD2/PD3 and PD4 storage facilities at a cost of $1.2 million. This represents only the prorated growth component of a 6.6 million litres above File Location: N:\y517\a\Appendix 7 Part2April 13.doc
125 Earth Tech Canada Inc. Page 7 ground storage facility expansion and a new 3 million litres elevated storage tank planned for 2026 at a cost of $6.0 million. Table 7 Scenario 3 System Storage Capacity Requirements Pressure District PD1 PD2/3 PD4 Water Storage Required as per MOE Fire Flow per area (L/s) Duration (hr) A - Fire Storage (m3) 8,165 8,165 8,165 B - Equalization Storage (m3) 11,696 14,688 9,164 C - Emergency Storage (m3) 4,965 5,713 4,332 Total Required Storage = A+B+C (m3) 24,825 28,566 21,661 Total Required Storage = A+B+C (ML) Existing Storage (ML) Storage Surplus (+) or Deficit (-) as per MOE Guidelines (ML) B) Water Pumping Table 8 Scenario 3 System Pumping Capacity Requirements Pressure District Total PD1 + AREA1 (PD1 Local + Transfer to PD2/PD3, PD4 & AREA 1) PD2/3 + AREA 1 PD4 + AREA 1 Peak Hour Demand (L/s) Max Day Demand (L/s) Fire Flow (L/s) Total Max Day + Fire Flow (L/s) Required Pump Capacity (L/s) Required Pump Capacity (ML/D) Existing Firm Pump Capacity (ML/D) Additional Pumping Capacity (ML/D) The analysis indicates that to service the remainder of Growth Area 1 (2046 to build-out) an additional pumping capacity of 7 ML/D at PD1 Pumping Station and 3 million litres /day at PD4 Pumping Station is required at a cost of $0.9 million in pump supply and installation cost. This represents only the prorated File Location: N:\y517\a\Appendix 7 Part2April 13.doc
126 Earth Tech Canada Inc. Page 8 growth component of pumping upgrades at the pressure district 4 above ground storage facility planned for construction in 2026 at a cost of $1.0M. Note: The additional 7 ML/D pumping capacity will be accomodated in the WTP upgrade improvements planned for 2007/8. C) Water Transmission The analysis indicates the need for water transmission upgrades to accommodate the projected growth in the amount of $1.4 million which represents the prorated growth component directly attributed to the full build out of Area 1 (beyond 2046). The following water transmission main upgrades (for full build out) are planned for this timeframe. The location of these upgrade projects can be reviewed on Drawing W-1 (shown in yellow). Table 9 Scenario 3 Water Transmission Capacity Upgrade Requirements Project No. Year Description Cost ($) in Million From Tollgate Res to Powerline Rd Along Wayne Gretzky Parkway between Edmondson St. to north of Brier Park Rd. $1.4 D) Water Treatment Additional water treatment plant capacity will be required to service Area 1 at build-out. Based on a construction unit cost of $1.00 per litre and a maximum day per capita equivalent flow of 860 litres, the prorated cost to provide additional water treatment capacity is approximately $12.9 million. This represents only the prorated growth component of a $50 million Water Treatment Plant expansion planned for Summary of Water Costs for Scenario 3 Servicing Remainder of Area 1 (2046 to build-out) Additional Storage: $1.2 million Additional Pumping: $0.9 million Water Transmission Upgrades: $1.4 million Water Treatment Upgrades: $12.9 million Total Area 1 Water Servicing Costs $16.4 million File Location: N:\y517\a\Appendix 7 Part2April 13.doc
127 Earth Tech Canada Inc. Page 9 3. WASTEWATER SYSTEM CAPACITY ASSESSMENT AND COST The assessment included the available wastewater conveyance capacity, pumping capacity and wastewater treatment capacity. Sewer line Q flow /Q capacity is used as the criteria to identify the need for sewer upgrades. In the assessment Q flow /Q capacity = 0.8 indicates that the sewer has only 20% of its capacity available for the future flow, thus increasing the risk of surcharge. Therefore, any sewer with Q flow /Q capacity 0.8 is flagged as a capacity constraint and must be upgraded. 3.1 Scenario 1 Servicing City Build-Out by year 2036 The scenario assess the capability of the existing sanitary sewer system to service the City full build-out population of 139,000 by year 2036 A) Trunk Sewers Table 10 provide details of sewer upgrade projects required to accommodate the City build-out by The estimated total cost of these projects is $9.7 million of which the prorated growth component directly attributed to the City full build out (2036). The location of these upgrade projects can be reviewed on Drawing WW-1 (shown in red). Table 10 Scenario 1 Wastewater Trunk Sewer Upgrade Requirement Proj ID Year of Construction Project List West Brantford Trunk from Erie Ave. to Greenwich St. PS and Mohawk St. Trunk from PS to Cayuga St. Total Cost (million) $ Oak Hill Drive Bottleneck Twinning $ South of Hardy Rd. Collector Sewer $ North of Hardy Rd. Collector Sewer $3.5 Total $9.7 B) Pumping Servicing the west part of the full build out of Area 1 will be through the new pumping station at Hardy Road. Additional pumping capacity of 120 l/s will be required at the Hardy Road pumping station at an estimated cost of $0.7 million. This represents the only the growth component of a planned $ 3.2 million pumping station expansion planned for 2006 File Location: N:\y517\a\Appendix 7 Part2April 13.doc
128 Earth Tech Canada Inc. Page 10 D) Wastewater Treatment Additional wastewater treatment plant capacity is required to service the projected population of 139,000 persons at City build-out (2036). Based on a construction unit cost of $1.50 per litre and an average annual daily per capita flow equivalent of 590 litres, the prorated cost to provide additional wastewater treatment capacity (over and above the existing plant s 25 million liters/day remaining capacity) is approximately $3.2 million. This represents only the prorated growth component of a $50 million wastewater treatment plant expansion planned for 2026 Summary of Wastewater Costs for Scenario 1 (build-out 2036) Trunk Sewer Upgrades: $9.7 million Pumping Station Upgrades: $0.7 million Wastewater Treatment Plant Expansion: $3.2 million Total Wastewater Servicing Costs for Scenario 1 $13.6 million 3.2 Scenario 2 Servicing the Preferred Growth Area (Area 1) by year 2046 This scenario assesses the ability of the existing wastewater system to service Area 1 by year Consideration is given only to the additional upgrades and costs beyond year 2036 described as follows: A) Trunk Sewers The analysis indicates the prorated growth component directly attributed to servicing Area 1 (2046) will be $4.4 million. The following trunk sewer upgrade is planned for this timeframe. The location of the upgrade project can be reviewed on Drawing WW-1 (shown in green). Table 11 Scenario 2 Wastewater Trunk Sewer Upgrade Requirement Proj ID Year of Construction Project List South West Trunk Twinning (Winter Way to Birkett Lane) Total Cost (million) $4.4 B) Pumping A pumping capacity constraint was identified at the Empey Street pumping station. An assessment indicates that the total flow to the pumping station by year 2046 is estimated to be approximately 900 l/s. which matches the existing total pumping capacity. The total estimated cost to upgrade the pumping File Location: N:\y517\a\Appendix 7 Part2April 13.doc
129 Earth Tech Canada Inc. Page 11 station to accommodate the full build out of Area 1 is $6.0 million of which the growth component to service Area 1 (2046) is $3.0 million. Servicing the west part of Area 1 will be through the new pumping station at Hardy Road. An additional pumping capacity of 448 l/s will be required at the Hardy Road pumping station at an estimated cost of $2.5 million. This represents the only the growth component of a planned $ 3.2 million pumping station expansion planned for C) Wastewater Treatment Additional wastewater treatment plant capacity is required to service Area 1(2036). Based on a construction unit cost of $1.50 per litre and an average annual daily per capita flow equivalent of 590 litres, the prorated cost to provide additional wastewater treatment capacity is approximately $11.2 million. This represents only the prorated growth component of a $50 million wastewater treatment plant expansion planned for Total Wastewater Costs for Scenario 2 Servicing Area 1 by year 2046 Trunk Sewer Upgrades: $4.4 million Pumping Station Upgrades: $5.5 million Wastewater Treatment Plant Expansion: $11.2million Total Wastewater Servicing Costs for Scenario 2 $21.1 million 3.3 Scenario 3 Servicing the Preferred Growth Area (Area 1) to Build-Out This scenario assesses the ability of the existing wastewater system to service the remaining portion of Area 1 (2046 to build-out). Consideration is given only to the additional upgrades and costs described as follows: A) Trunk Sewers The analysis indicates the prorated growth component directly attributed to servicing Area 1 beyond 2046 will be $4.0 million. The following trunk sewer upgrades are planned for this timeframe. The location of the upgrade project can be reviewed on Drawing WW-1.(shown in yellow) File Location: N:\y517\a\Appendix 7 Part2April 13.doc
130 Earth Tech Canada Inc. Page 12 Table 12 Scenario 3 Wastewater Trunk Sewer Upgrade Requirement Proj ID Year of Construction 4 Beyond Beyond Beyond 2046 Project List Eastern Circumferential Trunk Twinning (Along Mohawk St. from Greenwich St. to WPCP) Eastern Circumferential Trunk Twinning (Along Empey St. from Henry St. to Empey PS) South West Trunk Twinning (Kinnard Rd. to Oak Hill Dr.) Total Cost (million) $1.0 $1.0 $2.0 Total $4.0 B) Pumping A pumping capacity constraint was identified at the Empey Street pumping station. Our assessment indicates that the total flow to the pumping station by build out of Area 1 is estimated to be approximately 1100 l/s. The pumping station currently has a total pumping capacity of approximately 900 l/s therefore additional pumping will be required. The total estimated cost to upgrade the pumping station to accommodate the full build out of Area 1 is $6.0 million of which $3.0 million would be the growth component required to service the balance of lands within Area 1 beyond C) Wastewater Treatment Additional wastewater treatment plant capacity will be required to service Area 1at build-out. Based on a construction unit cost of $1.50 per litre and an average annual daily per capita flow equivalent of 590 litres, the prorated cost to provide additional wastewater treatment capacity is approximately $9.8 million. Total Wastewater Costs for Scenario 3 Servicing Area 1 at Build-Out Trunk Sewer Upgrades: $4.0 million Pumping Station Upgrades $3.0 million Wastewater Treatment Plant Expansion $9.8 million Total Area 1 (build-out) Wastewater Servicing Costs $16.8 million File Location: N:\y517\a\Appendix 7 Part2April 13.doc
131 Earth Tech Canada Inc. Page 13 Total Cost $million Summary of Water and Wastewater Servicing Costs Anticipated Year of Construction Project Funding from Development Charges ($million) To City Area 1 Build- Area 1 Beyond Beyond Area 1 Build- Out(2036) (2046) 2046 Out Capital Project Description Water Storage Elevated Storage Tank in PD In Ground Storage in PD Elevated Storage in PD Total Storage Pumping New Pumps in PD4 Above Ground Storage Facility Total Pumping Transmission Project Project Project Project Project Project Project Project Project Total Transmission Treatment Major WTP Expansion Total Treatment Total Water Wastewater Trunk Sewers Project Project Project Project Project Project Project Beyond 2046 Beyond 2046 Beyond Project Total Trunk Sewers $18.1 $9.7 $4.4 $4.0 $0.0 Pumping Empey PS Upgrade Hardy Road PS Upgrade Total Pumping Treatment Major WWTP Expansion Total Treatment Total Wastewater Total W&WW Gross Area Serviced (Hectares) Cost per Hectare* * accumulated average cost File Location: N:\y517\a\Appendix 7 Part2April 13.doc

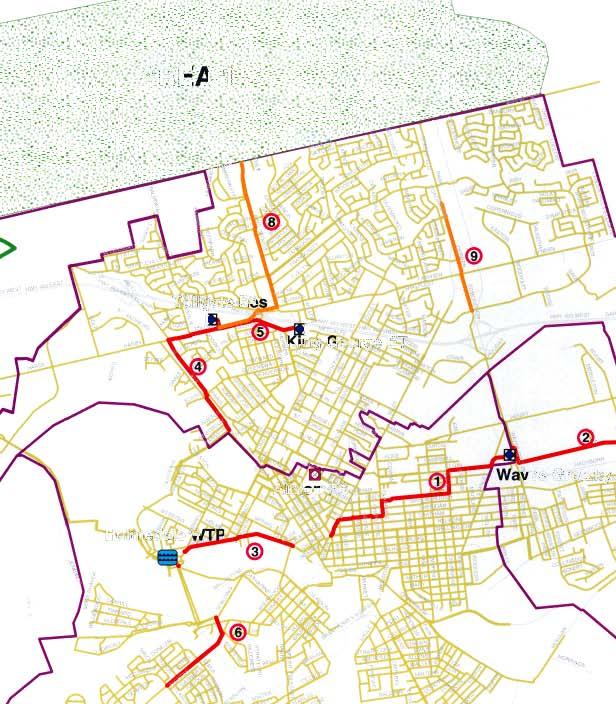


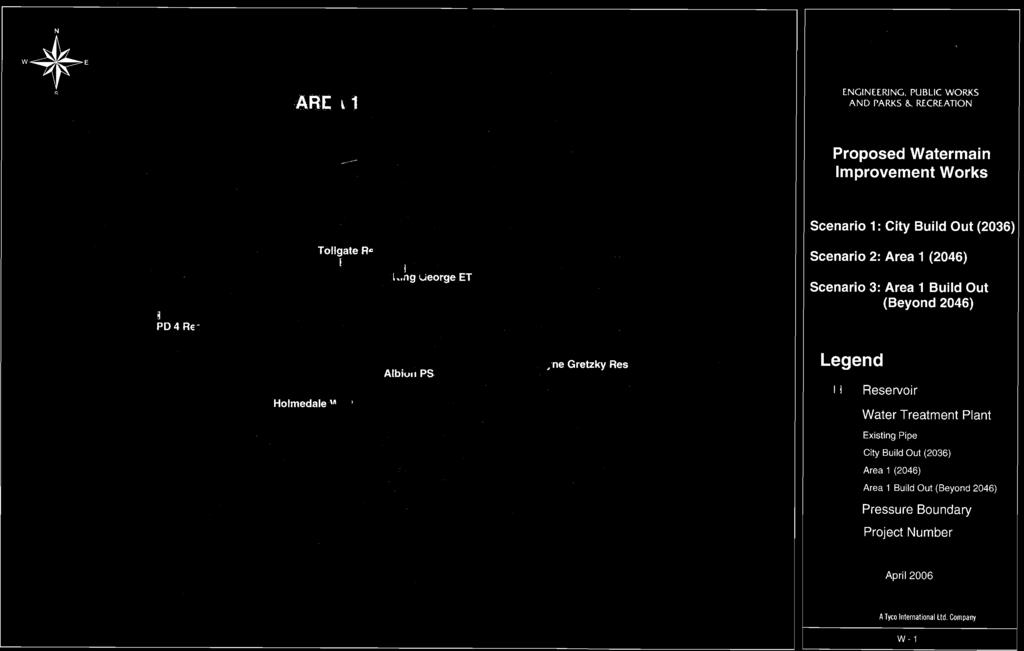
132
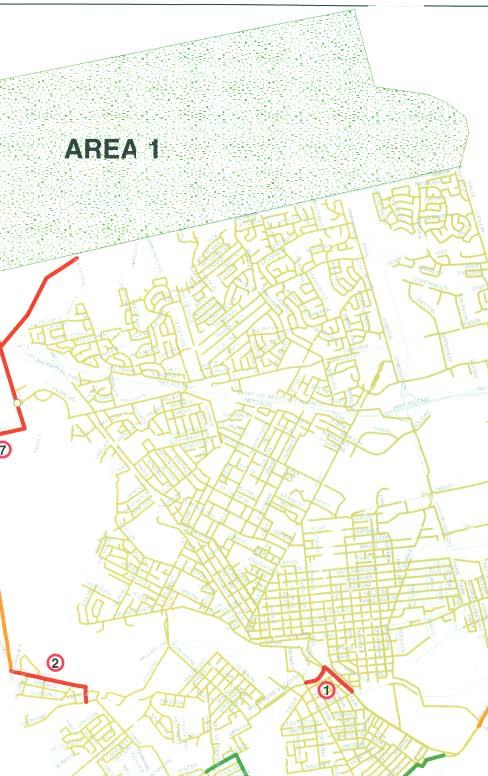


133
134 Appendix 8 Transportation Assessment
135 Transportation Assessment Brantford Strategic Growth Study 1) Introduction Through the population forecasting and land use assessment, forecasts for the City of Brantford have identified the need to secure sufficient lands to accommodate future population and employment growth. Based on current land consumption trends, reflected in the City s Official Plan, approximately 630 ha of land is required to accommodate approximately 31,600 new residents. Through implementation of the Province s new Places to Grow density targets, this land requirement is reduced to approximately 308 ha, representing 15,400 new residents. Based on the future employment forecasts, and the availability of industrial lands with the City, it is estimated that 8,100 new employee will need to accommodated in lands outside of the current City boundaries. Within this context, the transportation assessment focuses on two key aspects of the transportation-land use equation: Marketability is an important criterion, particularly in terms of commercial and industrial land. The old adage Location, location, location still plays a key role in the business decisions of companies when considering relocation or establishing a new operation. In addition to such factors as a skilled workforce, and available serviced lands; access to key transportation and trade corridors is seen as a key factor influencing where companies choose to locate their facilities. With Brantford s proximity to the Highway 403 corridor, offering excellent and reliable access to both the Windsor and Niagara gateways, the marketability of industrial land in the Brantford area is largely centred on accessibility to Highway 403 for transportation and logistics dependant industries. Considering the marketability of lands is also an important consideration in terms of achievement of planning objectives. While it may make some sense to plan for industrial lands in certain areas of a City to minimize servicing costs or transportation impacts, the marketability of the site will determine if those lands actually develop into industrial operations. Poorly located industrial lands will often be identified by developers for rezoning due to lack of market demand. Impact on Existing Transportation Infrastructure is also an important criterion which looks at the relative impact a certain land use may have on the operation and capacity of an existing transportation facility or service. In examining alternative locations for new growth, the current and projected transportation demands on existing roads, the availability or practicality of servicing the area by transit, and the presence of constraints that would limit new transportation infrastructure opportunities are all key indicators of how an area will impact the transportation system.
136 2) Transportation Assessment of Growth Areas 2.1 Area 1 North Located to the north of the current City boundary, is served by three key north south arterial road connections; Paris Road/Brant Street, King George Road (Highway 24), and Wayne Gretzky Parkway (WGP). Each of these routes provides direct access to Highway 403 and all three feature interchanges allowing for full movements. A fourth link to the Highway 403 corridor is provided via Oak Park Road, at the west end of the study area, allowing for development of a separate industrial road access to the west end of Brantford. This area has the overall best location of the seven alternative growth areas from an industrial location / marketability perspective. The western most section of Area 1 is directly adjacent to the current North-West Brantford Industrial Park, which is currently developing with new industrial employers. The City is currently looking at options to provide transit service to this area, and land use alternatives which increase the number of employees within a distinct node are much more economically feasible to service with conventional transit. In the East-West direction, Powerline Road and County Road 5, both are relatively free flowing and have reserve capacity to accommodate east-west travel between residential and employment areas. In the North-South direction, Paris Road and Oak Park Road have reserved capacity today to accommodate new growth. King George Road is currently operating near capacity in some segments, due to the need for a centre left turn lane. The current localized congestion on King George Road is forecast to worsen by 2031 based on the Status Quo growth scenario and the addition of a large residential area to north of the current city boundary will likely requiring additional widening of this facility. Wayne Gretzky Parkway, to the north of Lynden Road, is currently forecast to operate satisfactorily under the Status Quo growth scenario for Additional population growth on the lands to the north of Powerline Road will increase north-south travel demands in this corridor, and may accentuate the need for widening of WGP to six lanes across Highway 403. Urban expansion to the north along the WGP corridor would facilitate the eventual extension of WGP to connect to a future Highway 424 linking Brantford to the Region of Waterloo area. 2.2 Area 2 East Located to the east of the current City boundary, Area 2 is bisected by Highway 403, which offers significant frontage for industrial land uses. Access to Highway 403 is via the new Garden Avenue interchange which currently has significant reserve capacity to accommodate additional growth. The access is essentially limited to one interchange location, however, which may strain the capacity of Garden Ave to service the industrial and residential highway access needs of this entire area over the longer term. As the lands to the east are constrained due to river and adjacent flood plain areas, opportunities to develop additional interchanges to service industrial expansion may be somewhat limited. To the north of Highway 403, the lands within Area 2 will use Lyndon Road and Powerline Road for east-west travel to the WGP corridor. The location of the river and flood plain lands in this sector would tend to focus the development opportunities around
137 the Lyndon Road corridor, which may result in significant growth on this key corridor. Current Status Quo forecasts show Lyndon Road operating near capacity on both sides of the WGP, but with reserve capacity east and west of this localized congestion. Given the existing commercial focus around this intersection, urban expansion in Area 2 (north) would likely require significant upgrades / widening through this intersection. There is one transit route providing half hour service along the Garden Avenue corridor today, as much of this area is lightly developed. Growth in this area would be difficult to service with conventional, fixed route transit services unless there is a significant density of residential and employment land uses to generate enough ridership to introduce additional routes. To the south of Highway 403 east west access between Area 2 and the downtown Brantford area is primarily served by two road connections; Henry Street and the Colborne Street corridor. Elgin Street does not currently extend to the east of Garden Avenue, limiting it s role in providing east-west capacity to service this growth area. Current forecast of future travel demands under the Status Quo land sue scenario indicate that Colbourne Street will be operating near capacity, from Garden Avenue through to the downtown area. Henry Street is forecast to operate at acceptable levels, except for localized congestion at the Henry Street / WGP commercial development node. 2.3 Area 3 South East The South East growth area is located to the south of Colborne Street and is located along the County Road 18 corridor. The land area is bisected by the Grand River, with the eastern most portion of the area located within the Oxbow Tract. Access to and from this area would need to be provided separate from the remaining lands in the south east growth area, unless a new crossing of the Grand River is built. The only opportunity to introduce access to the area within the Oxbow tract is via Oxbow Road, off Erie Street. Without a second access road to this area, growth potential for the area could be limited by capacity of the existing Oxbow Road. Emergency access would be forced to use this single route, which could prove problematic if the road is closed or blocked by an accident. With the land area bisected by the river, opportunities to integrate the land uses in this expansion area (i.e. employment areas near residential areas) are limited. The remaining lands on the east side of the Grand River have similar transportation challenges, and would prove difficult to integrate into the City s overall road network. The primary access to these lands is via County Road 18, which is currently operating at free flow conditions. If this land area was developed to accommodate the population and employment levels necessary to accommodate project City growth, it is anticipated that additional access routes would be required to provide effective and reliable service to this area. Colborne Street east is already projected to be operating at or near capacity by 2031, based on current land use and population projections. Erie Avenue is anticipated to have some localized congestion, but generally is expected to have some reserve capacity to accommodate future growth.
138 From an industrial marketing perspective, the eastern most lands within this growth area dose have access to two major transportation corridors. Access to Highway 403 would be gained via Garden Avenue, which may require widening to preserve an acceptable operation in the future. Truck access could also be gained to and from the east via County Road 2/53. County Road 54 provides a secondary access to the Caledonia Area and the Hamilton International airport area. Industrial access to the West is not as good as the northern growth areas, and all truck traffic would need to use Garden Avenue to access Highway 403. There is no current transit service in this part of the City, with the exception of route 9 along Colborne Street. Route 1, via Erie Avenue currently does not extend far enough south to service this growth area and the route is currently structured to provide local service. Growth in this area would be difficult to service with conventional, fixed route transit services due to the long distances required to access the developable lands. 2.4 Area 4 - South - The South growth area is essentially an extension of the current West Brant community, located south and west of the Grand River. From an industrial marketability perspective, this area does not have acceptable access to the Highway 403 corridor to be attractive for industrial development. Access to the east, for trucks, would need to be gained via County Road 18, currently under the jurisdiction of Brant County. Access to the West would be difficult for trucks, and would likely result in truck traffic infiltrating through the downtown area. From an industrial land perspective, it is unlikely that Area 4 would be attractive enough to encourage new development. The growth potential of Area 4 is also constrained by the Grand River. The existing Erie Avenue (County Road 4) crossing has reserve capacity to accommodate some growth in the future, but would likely need to be widened if 15-31,000 new residents were to locate south of the river. Alternative access to this area can be gained via Mount Pleasant Road to the BSAR, although future forecasts suggest that the BSAR crossing of the Grand River may be approaching capacity under current land use conditions. The Colborne Street crossing is also anticipated to be at or over capacity by the 2031 horizon as well. This area is also difficult to service with conventional, fixed route transit services. Existing transit services do not extend this far south, and are currently structured to provide service to local areas. The long distance between the existing routes and the proposed growth area, combined with the barrier effect of the Grand River, would likely require the introduction of a new separate transit route to service this area. The routing to this area would involve long sections with very little development to generate ridership. It is likely that this area could only be serviced with dial a bus service. 2.5 Area 5 & 6 South West These two growth areas are similar in terms of their serviceability from a transportation perspective. The marketability of these lands from an industrial development perspective is not nearly as good as the northern growth areas, since there is no direct access to the Highway 403 corridor. Access to the west for truck traffic would be via County Road 53, while truck access to the east would need to route through the downtown, a fact that could limit the development potential of these lands.
139 The location of the industrial growth area would, however, provide good opportunity for shorter trip lengths and more live-work opportunities, due to the close proximity of the existing West Brant residential area. Industrial growth in Area 4 could provide opportunities for integration with the existing Brantford Municipal Airport, a potential key to the redevelopment and enhancement of this facility. County Road 53, Shellard Lane and Mount Pleasant Road all provide access to Area 4 to some degree, although the only practical access route to Area 6 is via Colborne Street West, unless a new crossing of the Grand River is constructed. An extension of the BSAR across the Grand River to Oak Park Road was recommended as a longer term project in the 1997 Transportation Master Plan. This route would likely border the east edge of Area 6. Access to Area 4 would be provided by County Road 53 (Colborne Street West), and Shellard Lane bisects the remaining land area. Integration with the remaining road network in the City from these two growth areas is highly dependant on the existing crossings of the Grand River. Current forecasts based on the Status Quo growth scenario indicate that the BSAR crossing of the Grand River may be approaching capacity under current land use conditions. The Colborne Street crossing is also anticipated to be at or over capacity by the 2031 horizon as well. Additional residential growth in Area 4 or 6 would almost certainly require the new Oak Park Road extension across the Grand River to ensure adequate access to the existing built up areas of the City. There are two transit routes that currently provide service to this area of Brantford. Transit service to either of these growth areas would be relatively easy to implement, although additional buses may be required to maintain the current half hour service. An additional crossing of the Grand River via Oak Park Road would provide new opportunities to provide transit service to the growing Northwest Industrial Park. 2.6 Area 7 West With it s close proximity to the Highway 403 corridor, Area 7 is also well poised to attract industrial development, with primary highway access via the Highway 24 interchange. The Grand River, running along the east side of this growth area, would limit accessibility between this area and the existing Northwest Industrial Park unless a new crossing of the Grand River is constructed. The only means of access between these two areas would be via Highway 403 itself. Access to the existing road network in the City would be problematic for this growth area due to the barrier effect created by the river. A new arterial road connection to the south would likely be required to connect with Colborne Street west, likely to the west of the existing airport lands. Similar to Area 6, access to the downtown would put additional pressure on the existing Colborne Street and BSAR crossings of the river, both of which are forecast to be operating at or near capacity by 2031 under current land use forecasts. There is no current transit service in this part of the City, with the exception of dial a bus service to the Northwest Industrial Park area. Growth in this area would be difficult
140 to service with conventional, fixed route transit services due to the long distances required to access the developable lands. Summary Evaluation & Ranking of Growth Areas Growth Area Access & Marketability for Industrial Lands New Transportation Infrastructure Requirements Integration With Existing Road Network Ability to Service with Transit Area 1-North Excellent 1 Moderate 1 Excellent 1 Very Good 1 Area 2- East Very Good 2 Moderate 2 Good 2 Good 2 Area 3-South East Acceptable 4 Extensive 6 Poor 6 Poor 6 Area 4 South Poor 7 Significant 3 Poor 5 Poor 5 Area 5 South West Poor 6 Extensive 5 Acceptable 4 Acceptable 3 Area 6 West Poor 5 Extensive 7 Good 3 Acceptable 3 Area 7 - West Very Good 3 Significant 4 Poor 7 Poor 7
141 Appendix 9 Residential Monitoring Map City of Brantford
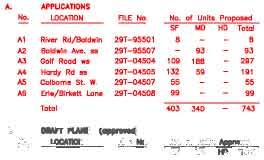
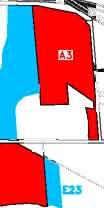
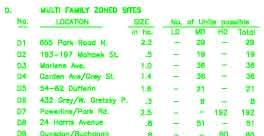
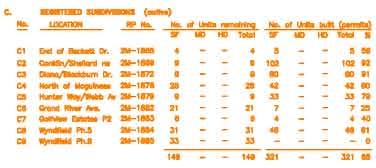
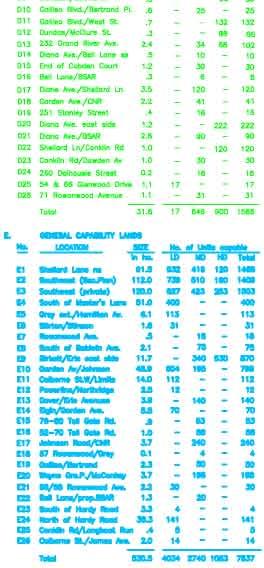


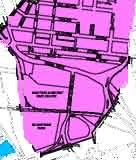
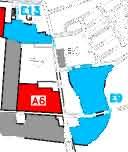

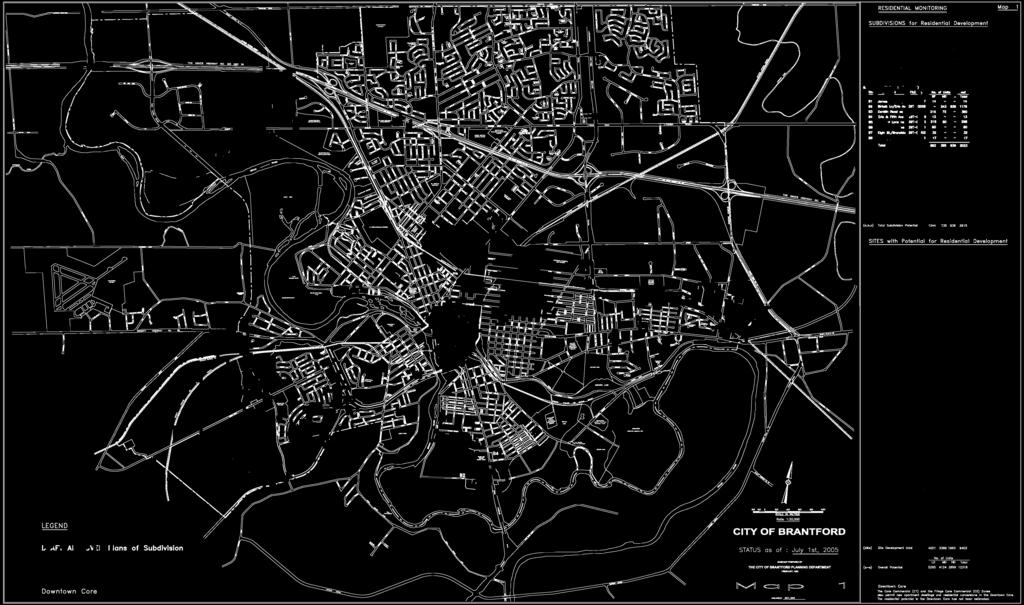
142
143 Appendix 10 Vacant Industrial Land Map City of Brantford

144 Powerline Rd. Powerline Rd Highway 403 Vacant Industrial Land Oak Park Rd Hardy Rd. Hardy Rd. Paris Rd. Tollgate Rd. St. Paul Ave. Brant Ave. King George Rd. Highway 403 Charing Cross St. Fairview Dr. West St. Clarence St. Dalhousie St. 15 Henry St. West St Park Rd. North 17 Wayne Gretzky Pky. Wayne Gretzky Pky Lynden Rd Highway Henry St Garden Ave Site No. Acres* Owner Servicing Northwest Industrial Area Private General Capability Private General Capability Private General Capability City Serviced Private Serviced City Serviced Private Serviced Private Serviced City General Capability City Serviced Private Serviced Private General Capability Private General Capability Private General Capability Total Braneida Industrial Area - South of Private Serviced Private Serviced Private Serviced Private Serviced Private Serviced Private Serviced Private Serviced Private Serviced Private Serviced Private Serviced Private Serviced Private Serviced Private General Capability Private Serviced City General Capability City General Capability City General Capability City General Capability Total Braneida Industrial Area - North of Private Serviced Private Serviced Private Serviced Private General Capability Private General Capability Private General Capability Private General Capability City Serviced Private Serviced Total 58.7 Colborne St. West Colborne St. West Icomm Dr. Colborne St. Colborne St. East City-Owned 30.8 Serviced 85.0 General Capability Total Brantford Southern Access Road Mount Pleasant St. Erie Ave. LEGEND Ownership Privately Owned Serviced General Capability Total Total Vacant Industrial Land Serviced General Capability Total * All areas are net City owned Privately owned Servicing Serviced General Capability Conditionally Sold ,000 Prepared by the City of Brantford Planning Department Metres Amended May, 2005
City of Brantford Chapter 3 TABLE OF CONTENTS
 Chapter 3 The Land Use & Transportation Connection TABLE OF CONTENTS 3.1 THE LAND USE & TRANSPORTATION LINK... 1 3.2 POPULATION & EMPLOYMENT GROWTH FORECASTS... 3 3.2.1 Proposed Places to Grow Plan Forecasts
DRAFT TOWN OF MILTON EMPLOYMENT LAND NEEDS ASSESSMENT STUDY PHASE 2 ANALYSES AND RECOMMENDATIONS REPORT EXECUTIVE SUMMARY
 APPENDIX 1 PD-040-16 DRAFT TOWN OF MILTON EMPLOYMENT LAND NEEDS ASSESSMENT STUDY PHASE 2 ANALYSES AND RECOMMENDATIONS REPORT EXECUTIVE SUMMARY REPORT SUMMARY The Town of Milton Employment Land Needs Assessment
Lincoln - OFFICIAL PLAN PART 1 INTRODUCTION 1.1. THE COMMUNITY VISION
 Lincoln - OFFICIAL PLAN PART 1 INTRODUCTION 1.1. THE COMMUNITY VISION The vision for Lincoln is to be a Centre of Excellence for Agriculture; an inclusive community that values diversity, partnerships,
COUNTY OF WELLINGTON Official Plan
 COUNTY OF WELLINGTON Official Plan OFFICE CONSOLIDATION This is an office consolidation of the which was adopted by Wellington County Council on September 24, 1998, approved by the Ministry of Municipal
CHAIR AND MEMBERS PLANNING & ENVIRONMENT COMMITTEE
 TO: CHAIR AND MEMBERS PLANNING & ENVIRONMENT COMMITTEE FROM: SUBJECT: JOHN M. FLEMING MANAGING DIRECTOR, PLANNING AND CITY PLANNER INFORMATION REPORT REVIEW OF INTENSIFICATION TARGETS IN THE LONDON PLAN
Planning Department Community Services
 Welcome and Introduction Mayor Chris Friel Background and History Mayor Chris Friel Boundary Adjustment Background and Letter of Intent Discussion Greg Dworak General Manager Community Development Services
Amendment No. 38. An Amendment to Incorporate the Results of Sustainable Halton, Official Plan Review Directions and Other Matters
 Amendment No. 38 to THE REGIONAL PLAN (2006) Official Plan for the Halton Planning Area Regional Municipality of Halton An Amendment to Incorporate the Results of Sustainable Halton, Official Plan Review
5-2 A Strong and Diverse Economy
 5-2 A Strong and Diverse Economy A STRONG AND DIVERSE ECONOMY 5.0 CONTENTS 5.1 EMPLOYMENT 5.1.1 General Policies 5.1.2 Protecting Employment Lands 5.1.3 Maintaining a Supply of Diverse Employment Lands
TES Industrial Development SW ¼ SEC Lacombe County Outline Plan
 TES Industrial Development Lacombe County Outline Plan 112849297 June 2012 am v:\1128\active\112849297\07_reports_studies\rpt_tes_20120508.doc i Table of Contents 1.0 INTRODUCTION... 1 1.1 PURPOSE... 1
RPP SEPTEMBER 27, 2017 SEPTEMBER
 APPENDIX VI MAYFIELD WEST PHASE 2 STAGE 2 PLANNING JUSTIFICATION REPORT Prepared by Nick McDonald, RPP SEPTEMBER 27, 2017 SEPTEMBER TABLE OF CONTENTS 1.0 OVERVIEW... 3 1.1 PURPOSE OF REPORT... 3 1.2 PLANNING
Executive Summary Planning for Health, Prosperity and Growth in the Greater Golden Horseshoe:
 Executive Summary Planning for Health, Prosperity and Growth in the Greater Golden Horseshoe: 2015-2041 Recommendations of the Advisory Panel on the Coordinated Review of the Growth Plan for the Greater
Revised Report as approved by City of Guelph Council on October 4, 2004
 Subject Recommendations Background City of Guelph Response to Places to Grow, Better Choices, Brighter Future That PET Report 04-79 and its appendices titled City of Guelph Response to Places to Grow,
AMENDMENTS MADE APRIL 26, 2010 TO: OFFICIAL PLAN AMENDMENTS 19, 21,44, 43, 68, 69, 28 AMENDMENTS MADE JULY 6/10 OPA #71, 72, 56
 AMENDMENTS MADE APRIL 26, 2010 TO: OFFICIAL PLAN AMENDMENTS 19, 21,44, 43, 68, 69, 28 AMENDMENTS MADE JULY 6/10 OPA #71, 72, 56 AMENDMENTS MADE FEBRUARY 12/13 OPA # 7, # 73, #74, #76, #79, #82, COUNTY
TRANSPORTATION DEMAND FORECASTING INFORMATION SESSION
 GTA WEST CORRIDOR PLANNING AND EA STUDY-STAGE STAGE 1 TRANSPORTATION DEMAND FORECASTING INFORMATION SESSION JUNE 2008 Topics for this Session 1. The Challenge of Growth 2. Overview of GTAW Study 3. The
Provincial Policy Statement 2014 Training Aid
 This job aid has been developed for education and training purposes as a high-level summary of the policy changes in the PPS 2014. It should not be relied upon as a substitute for specialized legal or
GRAND NIAGARA Proposed Secondary Plan
 GRAND NIAGARA Proposed Secondary Plan Public Open House #3 January 17. 2017 scope + process BUILT Grand Niagara Secondary Plan The Grand Niagara Secondary Plan will establish a framework for the future
RURAL CENTER COMMUNITY ROLE COUNCIL ROLE RURAL CENTER ALL COMMUNITIES
 Orderly and Efficient Land Use Align land use, development patterns, and infrastructure to make the best use of public and private investment. Plan for forecasted population and household growth at overall
That Capital Region Board APPROVE the Town of Beaumont Municipal Development Plan.
 Statutory Plan Evaluation Report Ville De/Town of Beaumont Municipal Development Plan Board Reference: REF #2017 011 Municipal Bylaw: 887 17 Introduction The Province has adopted the Regional Evaluation
Vision, Goals, Objectives, and Land Use Scenarios Welcome
 Vision, Goals, Objectives, and Land Use Scenarios Welcome Event purpose is to: 1. present draft land use scenarios, as well as the vision, goals and objectives. 2. provide a project update and the next
DATE: February 13, 2018 REPORT NO. CD Chair and Members Committee of the Whole Operations and Administration
 DATE: February 13, 2018 REPORT NO. CD2018-033 TO: FROM: Chair and Members Committee of the Whole Operations and Administration Paul Moore, General Manager Community Development 1.0 TYPE OF REPORT CONSENT
Development Approval & Planning Policy Department
 To: From: Mayor and Members of Council Development Approval & Planning Policy Department Meeting: 2014-06-24 Subject: Bolton Residential Expansion Study (BRES): Selection of Preferred Settlement Expansion
REPORT Meeting Date: Regional Council
 8.2-1 REPORT Meeting Date: 2018-04-12 Regional Council DATE: April 10, 2018 REPORT TITLE: FROM: Janette Smith, Commissioner of Public Works RECOMMENDATION That Regional Council recommend to the Provincial
Municipal Class EA Process
 Purpose of Tonight s Meeting INTRODUCTION This is the first Public Information Centre (PIC) to present information on the Class Environmental Assessment (EA) Study for a new operations centre. The following
Guelph Innovation District
 Guelph Innovation District Community Meeting, June 18, 2009 1 Welcome Meeting Purpose: Present City & Provincial work that is completed or underway Discuss how recent initiatives/studies will influence
SUBURBAN EDGE COMMUNITY ROLE COUNCIL ROLE ALL COMMUNITIES SUBURBAN EDGE
 Orderly and Efficient Land Use Align land use, development patterns, and infrastructure to make the best use of public and private investment. Plan and stage development for forecasted growth through 2040
Grand Niagara Secondary Plan
 Source: Google Maps Prepared for: Prepared by: April 28, 2016 Contents 1.0 Introduction and Purpose... 1 2.0 Site Location and Description... 2 2.1 Subject Lands... 2 2.3 Surrounding Area... 4 3.0 Secondary
THE REGION OF PEEL & TOWN OF CALEDON LAND EVALUATION AREA REVIEW (LEAR) STUDY. PUBLIC INFORMATION OPEN HOUSE April 7, 2015
 STUDY. PUBLIC INFORMATION OPEN HOUSE April 7, 2015") THE REGION OF PEEL & TOWN OF CALEDON AREA REVIEW () STUDY PUBLIC INFORMATION OPEN HOUSE April 7, 2015 one two three four five six Land Evaluation Area Review () Existing Prime Agricultural, Agricultural
THE REGION OF PEEL & TOWN OF CALEDON AREA REVIEW () STUDY PUBLIC INFORMATION OPEN HOUSE April 7, 2015 one two three four five six Land Evaluation Area Review () Existing Prime Agricultural, Agricultural
Simcoe Area: A Strategic Vision for Growth
 Simcoe Area: A Strategic Vision for Growth June 2009 Table of Contents 1 Introduction 1 1.1 Purpose 1 1.2 Building Strong, Vibrant Communities 4 1.3 Managing Growth in the Simcoe Area 5 2 Guiding Principles
5 SUTTON/JACKSON'S POINT SECONDARY PLAN
 Report No. 3 of the Planning and Economic Development Committee Regional Council Meeting of March 24, 2011 5 SUTTON/JACKSON'S POINT SECONDARY PLAN The Planning and Economic Development Committee recommends:
Hospital Re-location Analysis
 Hospital Re-location Analysis Background Collingwood General and Marine Hospital is in the early stages of a capital hospital facility redevelopment with the Ministry of Health and Long Term Care. The
Lincoln - OFFICIAL PLAN APPENDIX 1 DEFINITIONS
 Lincoln - OFFICIAL PLAN APPENDIX 1 DEFINITIONS Where a term used in this Plan, or a definition in this Section, is inconsistent with a definition in the Provincial Policy Statement or Provincial Plan,
Development Approval & Planning Policy Department. Subject: Bolton Residential Expansion Study: Selection of Expansion Area
 DP-2013-091 To: From: Mayor and Members of Council Development Approval & Planning Policy Department Meeting: 2013-07-09 Subject: Bolton Residential Expansion Study: Selection of Expansion Area RECOMMENDATIONS
PEEL REGION Bolton Residential Expansion Regional Official Plan Amendment DISCUSSION PAPER
 Bolton Residential Expansion Regional Official Plan Amendment DISCUSSION PAPER The Planning Partnership April 15, 2016 TABLE OF CONTENTS 1.0 Introduction... 2 1.1 Summary of the Application 2 1.2 Purpose
WELLINGTON NORTH COMMUNITY GROWTH PLAN
 WELLINGTON NORTH COMMUNITY GROWTH PLAN FINAL REPORT Township of Wellington North Final February 2018 WELLINGTON NORTH COMMUNITY GROWTH PLAN FINAL REPORT Township of Wellington North Final February 2018
PLANNING AND BUILDING SERVICES Planning (Report # 06-14)
") PLANNING AND BUILDING SERVICES Planning (Report # 06-14) Report: TO: Planning, Environment & Transportation Committee DATE: 2006/01/16 SUBJECT: CITY OF GUELPH RESPONSE TO PLACES TO GROW, BETTER CHOICES,
PLANNING AND BUILDING SERVICES Planning (Report # 06-14) Report: TO: Planning, Environment & Transportation Committee DATE: 2006/01/16 SUBJECT: CITY OF GUELPH RESPONSE TO PLACES TO GROW, BETTER CHOICES,
For additional copies of this document in either French or English, please contact:
 For additional copies of this document in either French or English, please contact: Ministry of Municipal Affairs and Housing Provincial Planning Policy Branch 777 Bay Street, 14 th Floor Toronto, ON M5G
City of Kingston. Public Information Centre #2. Population, Housing and Employment Projections Study. December 3, 2018
 City of Kingston Population, Housing and Employment Projections Study Public Information Centre #2 December 3, 2018 City of Kingston Population, Housing and Employment Projections Study Jamie Cook DIRECTOR
City of Kawartha Lakes Growth Management Strategy and Municipal Master Plan Project
 and Municipal Master Plan Project EXECUTIVE SUMMARY VOLUME 1: VOLUME 2: VOLUME 3: VOLUME 4: VOLUME 5: GROWTH MANAGEMENT STRATEGY MUNICIPAL SERVICING ASSESSMENT TRANSPORTATION MASTER PLAN SOLID WASTE MANAGEMENT
Regional Municipality of Halton: Economic Development Strategy Discussion Paper #1
 Regional Municipality of Halton: Economic Development Strategy 2011-2021 Discussion Paper #1 Business Growth: Economic Development and Employment Lands PREFACE This series of Discussion Papers was produced
SCHEDULE A REGION OF PEEL
 SCHEDULE A REGION OF PEEL REGION OF PEEL OFFICIAL PLAN AMENDMENT NUMBER - AMENDMENT TO ESTABLISH THE SOUTH ALBION-BOLTON EMPLOYMENT LANDS AND NORTH HILL SUPERMARKET SETTLEMENT SITE BOUNDARY EXPANSION -1-
Mayfield West Phase Two Secondary Plan Water and Wastewater Servicing Study Part A Report Town of Caledon
 Water and Wastewater Servicing Study Part A Report Town of Caledon Prepared by 170 Steelwell Road Suite 200 Brampton ON L6T 5T3 Canada File No: MTB 15608 The material in this report reflects best judgement
Planning Peterborough to 2031: How the Growth Plan for the Greater Golden Horseshoe will affect the City of Peterborough
 Exhibit C Sheet 1 of 79 Planning Peterborough to 2031: How the Growth Plan for the Greater Golden Horseshoe will affect the City of Peterborough April 20, 2009 Planning Division 1 Exhibit C Sheet 2 of
EMPLOYMENT LAND NEEDS ASSESSMENT
 1 EMPLOYMENT LAND NEEDS ASSESSMENT HEMSON C o n s u l t i n g L t d. In Association with: June 22, 2018 i EXECUTIVE SUMMARY The influence of the western Greater Toronto Area and Hamilton (GTAH) economy
Planning and Growth Management Committee. Chief Planner and Executive Director, City Planning Division
 STAFF REPORT ACTION REQUIRED 2205 Sheppard Avenue East Official Plan Amendment and Zoning By-law Amendment Application Refusal Report Date: August 14, 2007 To: From: Wards: Reference Number: Planning and
SUBJECT: Burlington s Mobility Hubs: Work Plan for Area Specific Planning. Committee of the Whole. Planning and Building Department.
 Page 1 of Report PB-48-16 SUBJECT: Burlington s Mobility Hubs: Work Plan for Area Specific Planning TO: FROM: Committee of the Whole Planning and Building Department Report Number: PB-48-16 Wards Affected:
An Introduction to the Provincial Policy Statement, 2014: Rural Ontario
 An Introduction to the Provincial Policy Statement, 2014: Rural Ontario August 2016 The Ministry of Municipal Affairs has prepared this document, including the scenarios set out in the appendix, to assist
RURAL RESIDENTIAL COMMUNITY ROLE COUNCIL ROLE RURAL RESIDENTIAL ALL COMMUNITIES
 Orderly and Efficient Land Use Align land use, development patterns, and infrastructure to make the best use of public and private investment. Discourage future development of rural residential patterns
SPRINGBANK Phase 1 Background Report
 Phase 1 Background Report Table of Contents 1.0 CONTEXT... 4 CENTRAL ASP... 4 NORTH ASP... 4 MODDLE ASP... 5 2.0 PROJECT SCOPE... 5 3.0 PLANNING POLICY FRAMEWORK... 6 COUNTY PLAN (BYLAW C-7280-2013)...
Planning Justification Report. 70 Pioneer Trail Fernbrook Homes (Parkside) Ltd. Official Plan Amendment Zoning By-law Amendment.
 Ltd. Official Plan Amendment Zoning By-law Amendment.") 70 Pioneer Trail Fernbrook Homes (Parkside) Ltd Planning Justification Report Official Plan Amendment Zoning By-law Amendment September 2016 The Jones Consulting Group Ltd. #1-229 Mapleview Drive East,
70 Pioneer Trail Fernbrook Homes (Parkside) Ltd Planning Justification Report Official Plan Amendment Zoning By-law Amendment September 2016 The Jones Consulting Group Ltd. #1-229 Mapleview Drive East,
REPORT. Mayor Bonnette and Members of Council. Curtis Marshall, Sr. Planner - Policy
 REPORT REPORT TO: REPORT FROM: Mayor Bonnette and Members of Council Curtis Marshall, Sr. Planner - Policy DATE: January 2, 2015 REPORT NO.: RE: PDS-2015-0003 Premier Gateway Phase 1B Employment Area Integrated
Independence is a growing community. Growth is placing new demands on City transportation facilities and City services
 6.0 LAND USE GUIDE PLAN 6.1 INTRODUCTION The Independence Land Use Guide Plan is a result of four decades of municipal planning activity, citizen s involvement and reasonable decision-making. This plan
1 AMENDMENT NO. 637 TO THE VAUGHAN OFFICIAL PLAN (VAUGHAN 400 NORTH EMPLOYMENT AREA SECONDARY PLAN) ONTARIO MUNICIPAL BOARD HEARING SETTLEMENT
 ONTARIO MUNICIPAL BOARD HEARING SETTLEMENT") Report No. 7 of the Planning and Economic Development Committee Regional Council Meeting of September 22, 2011 1 AMENDMENT NO. 637 TO THE VAUGHAN OFFICIAL PLAN (VAUGHAN 400 NORTH EMPLOYMENT AREA SECONDARY
Report No. 7 of the Planning and Economic Development Committee Regional Council Meeting of September 22, 2011 1 AMENDMENT NO. 637 TO THE VAUGHAN OFFICIAL PLAN (VAUGHAN 400 NORTH EMPLOYMENT AREA SECONDARY
Section 6 Table of Contents. List of Tables. List of Figures
 Section 6 Table of Contents 6. The Study Area... 6-3 6.1 Study Area Environment... 6-3 6.1.1 Natural Environment... 6-3 6.1.2 Socio-Economic... 6-4 6.1.3 First Nations Communities... 6-4 6.1.4 Economic
DIVERSIFIED RURAL COMMUNITY ROLE COUNCIL ROLE DIVERSIFIED RURAL ALL COMMUNITIES
 Orderly and Efficient Land Use Align land use, development patterns, and infrastructure to make the best use of public and private investment. Plan for growth not to exceed forecasts and in patterns that
Land Use INTRODUCTION
 Land Use INTRODUCTION The Land Use Element provides the policy context for the Centre Region to achieve its goals for the preservation and future development of rural, suburban, and urban land uses. This
WELLINGTON NORTH COMMUNITY GROWTH PLAN
 WELLINGTON NORTH COMMUNITY GROWTH PLAN FINAL REPORT Township of Wellington North Draft January 2018 WELLINGTON NORTH COMMUNITY GROWTH PLAN FINAL REPORT Township of Wellington North Draft January 2018 Prepared
Town of Okotoks Growth Study and Financial Assessment. February 2014 (July 2016 update) prepared by
 prepared by") Town of Okotoks Growth Study and Financial Assessment February 2014 July 2016 update) prepared by Executive Summary The Town of Okotoks Growth Study and Financial Analysis presents the results of a full
Town of Okotoks Growth Study and Financial Assessment February 2014 July 2016 update) prepared by Executive Summary The Town of Okotoks Growth Study and Financial Analysis presents the results of a full
RER New Stations Initial Business Case BRESLAU STATION. Kitchener Corridor. July Draft
 RER New Stations Initial Business Case BRESLAU STATION Kitchener Corridor July 2016 Draft Draft: v1.2 Metrolinx RER New Stations Initial Business Case BRESLAU Draft Prepared by: IBI Group 55 St. Clair
DISCUSSION PAPER, EMPLOYMENT LANDS OFFICIAL PLAN REVIEW, BRADFORD WEST GWILLIMBURY PREPARED FOR THE CORPORATION OF THE TOWN OF BRADFORD WEST
 DISCUSSION PAPER, EMPLOYMENT LANDS OFFICIAL PLAN REVIEW, BRADFORD WEST GWILLIMBURY PREPARED FOR THE CORPORATION OF THE TOWN OF BRADFORD WEST GWILLIMBURY October 14, 2016 This report has been prepared by
3 PROJECT DESCRIPTION
 3.1 PROJECT OVERVIEW 3 PROJECT DESCRIPTION The Rocklin 60 project (proposed project) includes the subdivision of 56.9 acres of land, construction of 179 single-family, detached dwelling units, and installation
SUSTAINABLE COMMUNITIES OFFICIAL PLAN Local priorities for a sustainable County
 SUSTAINABLE COMMUNITIES OFFICIAL PLAN Local priorities for a sustainable County Adopted June 27, 2012 Prepared by LANARK COUNTY Sustainable Communities Official Plan Adopted - June 27, 2012 TABLE OF CONTENTS
Mulock Station Area Secondary Plan - Update and Density Staff Report
 Town of Newmarket 395 Mulock Drive P.O. Box 328, Newmarket, Ontario, L3Y 4X7 Email: info@newmarket.ca Website: newmarket.ca Phone: 905-895-5193 Mulock Station Area Secondary Plan - Update and Density Staff
3.12 LAND USE AND PLANNING
 3.12 LAND USE AND PLANNING 3.12.1 INTRODUCTION This section describes the existing land uses in the project vicinity that could be affected by implementation of the Proposed Action and the alternatives.
2016 MAJOR GENERAL PLAN AMENDMENT
 2016 MAJOR GENERAL PLAN AMENDMENT GROWTH AREAS ELEMENT GROWTH AREAS ELEMENT 4.0 GOALS 1. Encourage orderly development within Growth Areas. 2. Encourage balanced, mixed use and multi-modal development
Corporate Report. CD.21.PEE (Region of Peel) DATE: September 25, Chair and Members of Planning and Development Committee October 2, 2006 TO:
 DATE: September 25, Chair and Members of Planning and Development Committee October 2, 2006 TO:") Corporate Report Clerk s Files Originator s Files CD.21.PEE (Region of Peel) DATE: September 25, 2006 TO: FROM: SUBJECT: Chair and Members of Planning and Development Committee October 2, 2006 Edward R.
Corporate Report Clerk s Files Originator s Files CD.21.PEE (Region of Peel) DATE: September 25, 2006 TO: FROM: SUBJECT: Chair and Members of Planning and Development Committee October 2, 2006 Edward R.
Niagara s Transportation Strategy 1. Introduction:
 Niagara s Transportation Strategy May 8, 2002 Niagara s Transportation Strategy 1. Introduction: Transportation is of pivotal importance in the development of Niagara. This, Niagara s first comprehensive
APPENDIX V. Mariposa Lakes Study on Sanitary Sewer Service
 APPENDIX V Mariposa Lakes Study on Sanitary Sewer Service MARIPOSA LAKES STUDY ON SANITARY SEWER SERVICE STOCKTON, CA Prepared for: PCCP Mariposa Lakes, LLC 4 A ~ P i..--.mi o A I 12-5 uoru ~ O UI F ~
Once known as warehousing and distribution, the process
 Map III-2.3 Proposed Agile Port Industrial Area AGILE PORT INDUSTRIAL AREA PLAN Once known as warehousing and distribution, the process of moving goods to market has evolved dramatically. No longer is
PROVINCIAL POLICY STATEMENT COMPARISON
 PROVINCIAL POLICY STATEMENT 2005-2014 COMPARISON TRACKED CHANGES VERSION This document compares Provincial Policy Statement, 2005 and Provincial Policy Statement, 2014. Additions are shown in grey highlighting
HEMSON C o n s u l t i n g L t d.
 DEVELOPMENT PHASING STRATEGY: REGIONAL MUNICIPALITY OF NIAGARA FINAL REPORT C o n s u l t i n g L t d. November 4, 2013 TABLE OF CONTENTS EXECUTIVE SUMMARY... 1 I INTRODUCTION... 2 II GROWTH PROSPECTS...
This policy discussion paper has been prepared for the Town of Whitby by Meridian Planning Consultants with the assistance of GLPi.
 table of contents 1.0 INTRODUCTION... 2 2.0 LOCATION OF AGRICULTURAL AREA IN WHITBY... 3 3.0 THE STATE OF AGRICULTURE IN WHITBY... 5 4.0 PROVINCIAL POLICY AND AGRICULTURE... 9 4.1 Provincial Policy Statement...
Towards Performance. Preliminary Indicators for Discussion
 Towards Performance Indicators FOR THE Growth Plan for the Greater Golden Horseshoe, 2006 Preliminary Indicators for Discussion Overview Greater Golden Horseshoe How are we doing? This document introduces
Provincial Policy Statement, 2014: Key Changes by Policy Area
 : Key Changes by Policy Area Policy Area Provincial Policy Statement, 2005 Healthy, Active Communities Northern and Rural Communities Support healthy, active communities by promoting efficient development
COUNTY OF WELLINGTON Official Plan
 COUNTY OF WELLINGTON Official Plan OFFICE CONSOLIDATION This is an office consolidation of the which was adopted by Wellington County Council on September 24, 1998, approved by the Ministry of Municipal
APPENDICES. Table 46: Quantified Objectives (October 2013 to October 2021) New Construction Rehabilitation Conservation/Preservation
 New Construction Rehabilitation Conservation/Preservation") VI. APPENDICES APPENDIX A. QUANTIFIED OBJECTIVES The City of Placerville has established quantified (numerical) objectives for several program categories to provide measurable standards for monitoring
VI. APPENDICES APPENDIX A. QUANTIFIED OBJECTIVES The City of Placerville has established quantified (numerical) objectives for several program categories to provide measurable standards for monitoring
Town of Huntsville Official Plan Section 9 Rural Area Page 104
 Section 9 Rural Area Page 104 9 RURAL AREA 9.1 Definition and Function Location Rural Settlements 9.1.1 The Rural Area includes those lands located outside any other land use designation identified in
4 GROWTH PLAN FOR THE GREATER GOLDEN HORSESHOE 2006 OFFICE CONSOLIDATION JANUARY 2012 INCLUDING AMENDMENT 1 TO THE GROWTH PLAN FOR THE SIMCOE SUB-AREA
 Report No. 3 of the Planning and Economic Development Committee Regional Council Meeting of March 22, 2012 4 GROWTH PLAN FOR THE GREATER GOLDEN HORSESHOE 2006 OFFICE CONSOLIDATION JANUARY 2012 INCLUDING
Provincial. Statement
 Provincial Statement This publication was produced by the Ministry of Municipal Affairs and Housing. For more copies of this document, in either English or French, please contact: Publications Ontario
REGIONAL GROWTH STRATEGY
 THOMPSON-NICOLA REGIONAL DISTRICT REGIONAL GROWTH STRATEGY Bylaw 2409, 2013 Source: Picture BC Thompson-Nicola Regional District 300-465 Victoria Street Kamloops, BC V2C 2A9 Telephone: 1-250-377-8673 Toll
INDUSTRIAL SITES. Contact Us: A Summary of Industrial Land in the Township of Wellington North
 INDUSTRIAL SITES A Summary of Industrial Land in the Township of Wellington North Contact Us: The Or ecdev@wellington north.com TABLE OF CONTENTS About Wellington North...1 Industrial Land Strategy...2
Appendix B. TM1B - SPS Population and Flow Projections
 Appendix B TM1B - SPS Population and Flow Projections The Regional Municipality of Waterloo Technical Memorandum No. 1B: Sewage Pumping Station Population and Flow Projections Final 5935 Airport Road,
Transportation and Utilities
 4 Section 4 Transportation and Utilities 4.0 Introduction Transportation and utility systems are essential to accommodate and support development proposed in the Future Land Use Map. The following pages
Debrob Investments Limited FUNCTIONAL SERVICING REPORT DRAFT PLAN OF SUBDIVISION, CITYVIEW DRIVE CITY OF GUELPH
 JULY 2013 DOCUMENT CONTROL Client: Project Name: Report Title: IBI Reference: 25528 Cityview Drive Version: JULY 2013 Digital Master: Originator: Reviewer: Authorization: [File Location] Scott MacDonald,
BYLAW NO LEDUC COUNTY
 BYLAW NO. 27-14 LEDUC COUNTY A BYLAW OF LEDUC COUNTY, IN THE PROVINCE OF ALBERTA, TO AMEND THE CITY OF LEDUC/LEDUC COUNTY INTERMUNICIPAL DEVELOPMENT PLAN BYLAW 30-11. WHEREAS The Council of Leduc County
Niagara Region Transportation Master Plan Niagara-Hamilton Trade Corridor Technical Paper
 Niagara-Hamilton Trade Corridor Technical Paper 1. Purpose In the report to Council on the Regional Council Strategic Priorities Implementation Plan, pursuing Provincial commitment for the Niagara to Greater
TOWN OF EAST GWILLIMBURY WATER AND WASTEWATER CONSERVATION STRATEGY
 TOWN OF EAST GWILLIMBURY WATER AND WASTEWATER CONSERVATION STRATEGY George Zukovs 1, Wayne Hunt 2 1. XCG Consultants Ltd, Oakville Ontario, Canada georgez@xcg.com 2. Town of East Gwillimbury Ontario, Canada
Sunnyside Heights (Grandview Heights Area #2) Neighbourhood Concept Plan (NCP) - Engineering Servicing and Financial Strategies
 Neighbourhood Concept Plan (NCP) - Engineering Servicing and Financial Strategies") CORPORATE REPORT NO: R236 COUNCIL DATE: November 15, 2010 REGULAR COUNCIL TO: Mayor & Council DATE: November 10, 2010 FROM: General Manager, Engineering FILE: 6520-20 (GH#2) SUBJECT: Sunnyside Heights
CORPORATE REPORT NO: R236 COUNCIL DATE: November 15, 2010 REGULAR COUNCIL TO: Mayor & Council DATE: November 10, 2010 FROM: General Manager, Engineering FILE: 6520-20 (GH#2) SUBJECT: Sunnyside Heights
Functional Servicing Report. Winston Park West Proposed Business Park Development Project. Infrastructure Ontario (IO) September MU1
 September MU1") Functional Servicing Report Winston Park West Proposed Business Park Development Project (IO) September 2011 14-11208-001-MU1 Winston Park West 2 TABLE OF CONTENTS Page 1.0 INTRODUCTION... 3 1.1 SITE DESCRIPTION...
Functional Servicing Report Winston Park West Proposed Business Park Development Project (IO) September 2011 14-11208-001-MU1 Winston Park West 2 TABLE OF CONTENTS Page 1.0 INTRODUCTION... 3 1.1 SITE DESCRIPTION...
City of Maple Ridge. Employment Land Use Suitability Assessment (West and East of the Kwantlen First Nation)
") City of Maple Ridge TO: Her Worship Mayor Nicole Read MEETING DATE: October 17, 2016 and Members of Council FILE NO: FROM: Chief Administrative Officer MEETING: C of W SUBJECT: Employment Land Use Suitability
City of Maple Ridge TO: Her Worship Mayor Nicole Read MEETING DATE: October 17, 2016 and Members of Council FILE NO: FROM: Chief Administrative Officer MEETING: C of W SUBJECT: Employment Land Use Suitability
POLICY PAPER. It s Cool to be Smart: How Ontario s Growth Plan can Reduce Greenhouse Gas Emissions. Graham Haines FIRST COAL, NOW TRANSPORTATION
 CBI It s Cool to be Smart: How Ontario s Growth Plan can Reduce Greenhouse Gas Emissions Graham Haines March 21, 2017 Introduced in the past decade, the Greenbelt and Growth Plan represent a pair of Ontario
CHAPTER 8: INTERGOVERNMENTAL COOPERATION
 CHAPTER 8: INTERGOVERNMENTAL COOPERATION Photos above by Randy Uhl 8.1 Introduction Intergovernmental cooperation involves working with neighboring communities, school districts and agencies to understand
DRAFT Agricultural Impact Assessment (AIA) Guidelines
 Guidelines") DRAFT Agricultural Impact Assessment (AIA) Guidelines November 7, 2011 Legislative & Planning Services Sustainable Communities. Economic Opportunities. Transparent Government. Prepared with the assistance
DRAFT Agricultural Impact Assessment (AIA) Guidelines November 7, 2011 Legislative & Planning Services Sustainable Communities. Economic Opportunities. Transparent Government. Prepared with the assistance
STORMWATER MANAGEMENT REPORT DRAFT PLAN OF CITY OF GUELPH
 Debrob Investments Limited STORMWATER MANAGEMENT REPORT DRAFT PLAN OF SUBDIVISION, CITYVIEW DRIVE CITY OF GUELPH PRELIMINARY NOVEMBER 2, 2011 I B I G R O U P P R E L I M I N A R Y Debrob Investments Limited
Planning For Employment and Industry in Melbourne s Growth Areas
 Planning For Employment and Industry in Melbourne s Growth Areas Growth Areas Authority October 2011 Planning For Employment and Industry in Melbourne s Growth Areas Executive Summary A key part of the
STAFF REPORT. Permit Number: Tallman. Kitsap County Board of Commissioners; Kitsap County Planning Commission
 STAFF REPORT Permit Number: 15 00742 Tallman DATE: November 9, 2015 TO: FROM: RE: Kitsap County Board of Commissioners; Kitsap County Planning Commission Katrina Knutson, AICP, Senior Planner, DCD and
HAMLET OF ROUND HILL AREA STRUCTURE PLAN
 HAMLET OF ROUND HILL AREA STRUCTURE PLAN With Amendment December 11, 2012 to Map 4 Land Use Concept Map Prepared by: Austrom Consulting Ltd. Area Structure Plan, Page 1 of 21 Table of Contents TABLE OF
NOTICE OF PREPARATION OF ENVIRONMENTAL IMPACT REPORT FOR WOODLAND RESEARCH & TECHNOLOGY PARK SPECIFIC PLAN FOCUS OF INPUT NOP RESPONSES
 NOTICE OF PREPARATION OF ENVIRONMENTAL IMPACT REPORT FOR WOODLAND RESEARCH & TECHNOLOGY PARK SPECIFIC PLAN To: Responsible Agencies, Trustee Agencies, Organizations, and Interested Parties From: Erika
Public Information Centre #1. March 2010
 Public Information Centre #1 March 2010 Purpose of Public Information Centre Halton Region is initiating a Transportation Master Plan (2031) The Road to Change The Plan will develop a sustainable, integrated
4 Economic vitality. Chapter. In this chapter:
 Chapter 4 vitality In this chapter: 4.1 Supporting the York Region Strategy 4.2 City Building 4.3 Planning for Employment Lands 4.4 Planning for Retail 4.5 Financial Management The Regional Municipality
Honorable Mayor and Members of the City Council. Submitted by: Dan Marks, Director, Planning and Development
 Office of the City Manager To: From: Honorable Mayor and Members of the City Council Phil Kamlarz, City Manager Submitted by: Dan Marks, Director, Planning and Development Subject: EXECUTIVE SUMMARY Senate