Status and Trends of Water Quality in Wisconsin s Lakes, Streams, and Rivers
|
|
|
- Joshua Bradley
- 6 years ago
- Views:
Transcription


1 Status and Trends of Water Quality in Wisconsin s Lakes, Streams, and Rivers Tim Asplund, Matt Diebel, Katie Hein, and Mike Shupryt Water Resources Program, WDNR AWRA Wisconsin Section Annual Meeting March 9, 2017
2 Statewide Monitoring Program Objectives In general, a monitoring program that meets the Clean Water Act objectives should be able to answer the following five questions: 1. What is the overall quality of waters in the State? 2. To what extent is water quality changing over time? 3. What are the problem areas and areas needing protection? 4. What level of protection is needed? 5. How effective are clean water projects and programs? (From EPA s Elements of a State Monitoring Strategy )
 Prescribed Statewide and District Collaboration Targeted Watershed Assessments Directed Lake Assessment (including APM and Critical Habitat) 319 (Non-point) Project")
3 Monitoring Categories Baseline Statewide Trends sites (Lakes, Rivers) Probabilistic surveys (streams, AIS, NARS (coastal condition and wetlands)) Reference sites (wadeable streams, macrophytes, large river macroinvertebrates) Prescribed Statewide and District Collaboration Targeted Watershed Assessments Directed Lake Assessment (including APM and Critical Habitat) 319 (Non-point) Project Evaluation Follow-up for Impaired Waters Local Needs - District Initiated Cross program support Unique stressors, projects

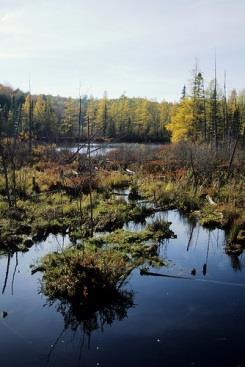
4 Statewide Baseline Monitoring Organized by resource type: Lakes Rivers Streams Wetlands Metrics and Indicators: Physical Chemical Biological


 Fish community characteristics")
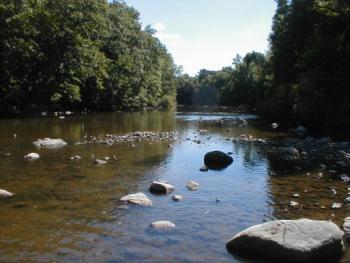
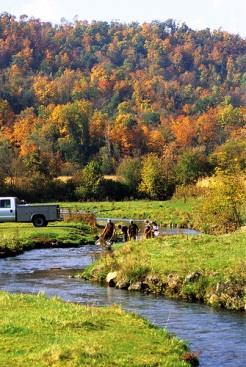
5 Streams Indicators and Metrics* Large streams (>2 nd order) Fish community characteristics Gamefish population dynamics Water chemistry: Dissolved oxygen ph Conductivity Turbidity Other surface water analytes Macroinvertebrates Habitat assessment Total phosphorus * Other nutrients and fish tissue contamination indicators are used as supplemental indicators for both large and small streams Small streams (1 st and 2 nd order) Fish community characteristics Macroinvertebrates Total phosphorus
6 Stratified Random Design Wadeable Streams (n=600) Sampled Proposed Dropped
7 What is the overall quality of waters in the State? Statewide Condition NCSR - Percent of Wadeable Stream Miles in Wisconsin Considered in Poor Condition by Stressor 56% 38% TP 33% TN 10% 24% 29% DIN TSS DO Conductivity 6% 9% Habitat ph


8 What level of protection is needed? Setting Expectations Wadeable Trend Reference Sites 44 sites visited yearly for biology and chemistry Track inter annual variation Determine regionally based expectations
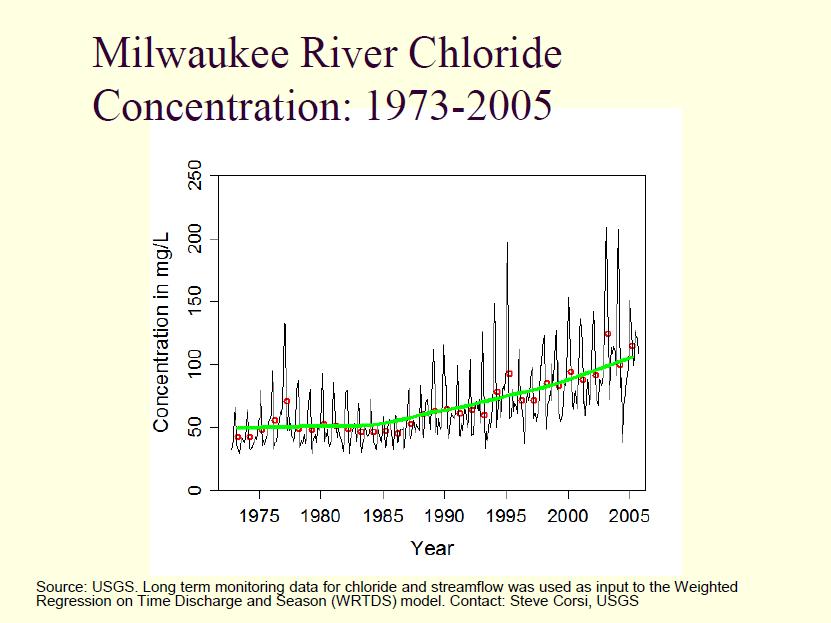
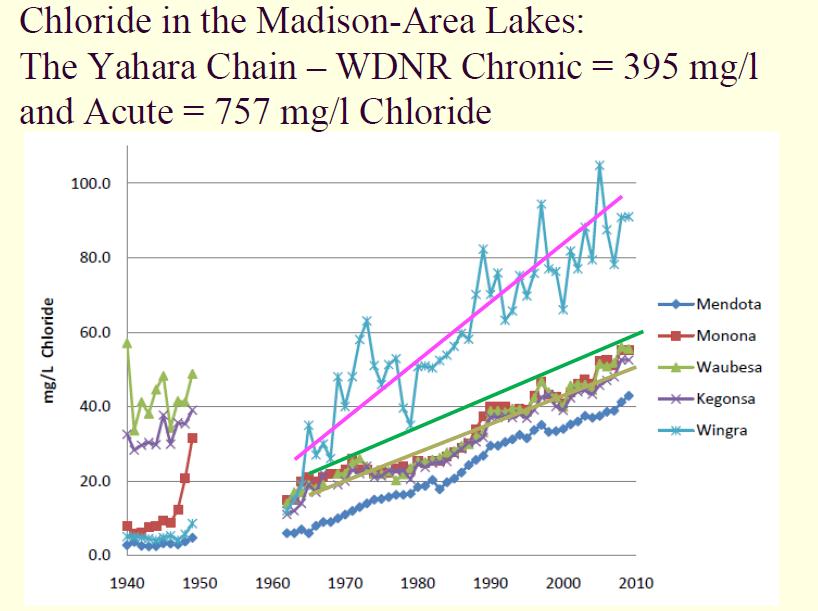
9 Long-Term Trends in Water Quality in Wisconsin Have policies and practices aimed at improving water quality worked? What water quality parameters have changed the most? What areas of the state have seen the biggest improvements or declines? Can we identify and head off worsening trends before they become critical? TP (mg/l) Rock River at Afton, WI Chloride (mg/l)
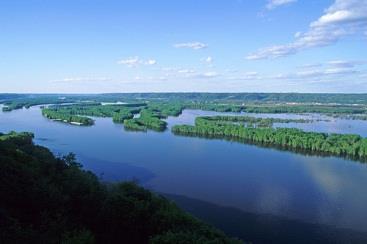
10 Long Term Trends Monitoring Program 38 sites on large rivers across Wisconsin Started in 1961 (30-50 years per site!) Monthly or quarterly water quality samples. Phosphorus, nitrogen, sediment, chloride
11 Number of sites River Water Quality Trend Summary, Increase No change Decrease KJN NH3 NO3 TN TP DP PO4 TSS CL
12 Sheboygan River Rock Afton


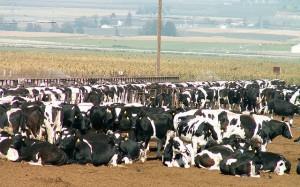
13 Phosphorus Reduction Actions in Wisconsin Soil Conservation Clean Water Act Wastewater Treatment Runoff program Coon Valley Great Lakes Water Quality Agreement Regulate Concentrated Animal Feeding Operations Discharge <1 mg/l phosphorus statewide Runoff performance standards and prohibitions Tighten rules for large animal farms Fertilizer phosphorus ban Dish detergent < 0.5% phosphorus by weight Phosphorus criteria for all surface waters Phosphorus budgets for impaired watersheds CAFO s Phosphorus bans
14
15
16


17 Statewide Lake Monitoring & Assessment Satellite Secchi 8000 lakes each year Citizen Lake Monitoring 900 Secchi lakes each year 550 chemistry lakes each year Secchi Secchi, Chl-a, TP Longest records are 24 years!
 Lake")


18 Ln (Secchi depth) Lake clarity can be assessed regionally by coupling Secchi measurements with satellite observations Band 1:3 ratio Landsat band ratio Courtesy Kevin Rose and Steve Greb

19 Spatial patterns, m m m Ecoregion Secchi (m) # of lakes m m m Rose et al 2016
20 Many lakes had significant long term trends in clarity. 2,930 lakes with 10 years of data 257 (8.8 %) have significant long term trends 97 (3.3 %) negative trend 160 (5.5 %) positive trend As the length of record increases: Fewer lakes have negative trends More lakes have positive trends Rose et al 2016
 exhibited long term trends. More trends were positive than negative.")
21 50 2,930 lakes w/ 10 years of data n = 2, n = n = 38 n = % (257) exhibited long term trends. More trends were positive than negative. 54 Rose et al 2016
22 Long-Term Water Quality Monitoring Spring and 3 X s in summer: Secchi depth Temperature/D.O. profile Total Phosphorus Chlorophyll a Conductivity (optional) ph (optional) 1 X in summer: Color Total Kjeldahl Nitrogen NO2+NO3 Alkalinity 5 year cycle: Ca Mg 61 Lakes
23 Latitude Trends in Total Phosphorus Over Time 8 lakes decreasing TP 46 lakes no change in TP 6 lakes increasing TP decrease steady Average + stdev increase

24 Depends on time scale


25 Reasons for Phosphorus Decline Urbanization of Agricultural Land Septic to Municipal Sewage Algal to Plant-Dominated Lake Best Management Practices Melvin McCartne Bruce Werre


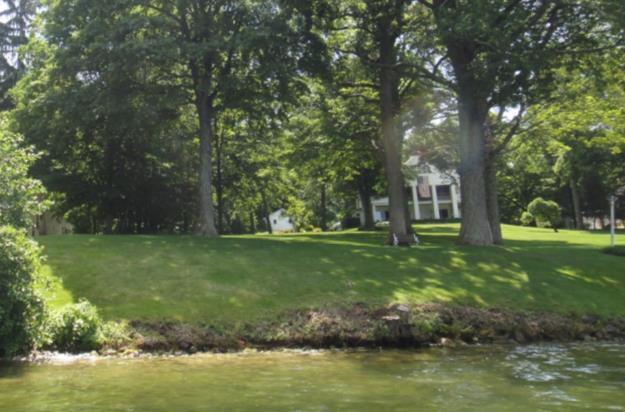
26 Reasons for Increasing Phosphorus Agriculture Lake Shore Development Plant to Algal-Dominated Lake Climate and Water Levels Carp Exclosure USGS


27 Future Nutrient Loading Threats Projected Change in Frequency of 2 Precipitation Events 1980 to 2055 days/decade Increase in Housing Density

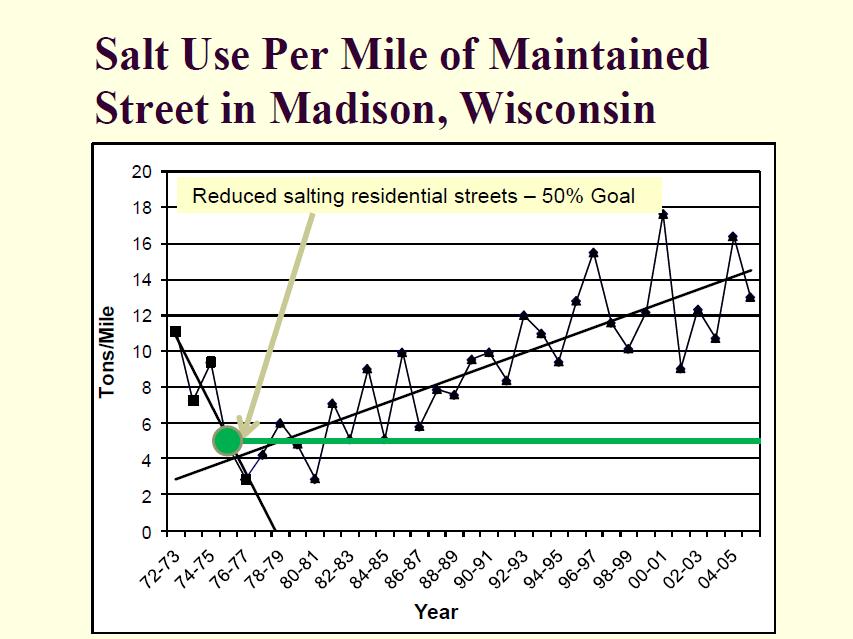
28 Summary Water quality conditions have improved since 1960 s sediments, phosphorus Recent increases in phosphorus in more remote areas subtle changes masked in more disturbed areas Increasing chloride and nitrate concentrations impacts to biota may become more apparent in the future Management practices can make a difference!
29
Long Term Water Quality Trends in Wisconsin Lakes. Katie Hein Wisconsin Department of Natural Resources
 Long Term Water Quality Trends in Wisconsin Lakes Katie Hein Wisconsin Department of Natural Resources 14,3 lakes > 1 hectare Photos: Buzz Sorge Phosphorus Reduction Actions in Wisconsin 1933 1972 Soil
State Water Resources Monitoring Priorities and Role of Citizen Based Monitoring Tim Asplund, WDNR April 5, 2013
 State Water Resources Monitoring Priorities and Role of Citizen Based Monitoring Tim Asplund, WDNR April 5, 2013 From Ken Johnson, WDNR Water Division Administrator: Please extend my gratitude to all those
Nutrient Limits: What to Expect. Water Division Arkansas Department of Environmental Quality
 Nutrient Limits: What to Expect Water Division Arkansas Department of Environmental Quality wentz@adeq.state.ar.us bailey@adeq.state.ar.us Timeline of Nutrient Criteria Development 1998 EPA published the
Lake & Watershed Resource Management Associates P O Box 65; Turner, ME
 Lake & Watershed Resource Management Associates P O Box 65; Turner, ME 207-336-2980 LWRMA@megalink.net 2008 Baseline Water Quality Monitoring and Assessment of Pemaquid and Biscay Ponds At the request
CLMP+ Report on Fleming Lake (Aitkin County)
") CLMP+ Report on Fleming Lake (Aitkin County) Lake ID# -5-5-6 CLMP+ Data Summary July 7 Authors Shannon Martin Contributors/acknowledgements Terry Dahlberg Sandy Dahlberg Pam Anderson For questions regarding
CLMP+ Report on Fleming Lake (Aitkin County) Lake ID# -5-5-6 CLMP+ Data Summary July 7 Authors Shannon Martin Contributors/acknowledgements Terry Dahlberg Sandy Dahlberg Pam Anderson For questions regarding
Acidity and Alkalinity:
 Evaluation of Pollution Sources to Lake Glenville Quarterly Report December 2018 Kimberlee K Hall, PhD Environmental Health Program, Western Carolina University Summary Chemical and microbial analysis
CLMP+ Report on Grass Lake (Anoka County) Lake ID# CLMP+ Data Summary
 Lake ID# CLMP+ Data Summary") CLMP+ Report on Grass Lake (Anoka County) Lake ID# 02-0113-00 2012-2013 CLMP+ Data Summary October 2014 Authors Shannon Martin, MPCA Editing and graphic design Public Information Office Staff The (MPCA)
CLMP+ Report on Grass Lake (Anoka County) Lake ID# 02-0113-00 2012-2013 CLMP+ Data Summary October 2014 Authors Shannon Martin, MPCA Editing and graphic design Public Information Office Staff The (MPCA)
Redwood Shores Lagoon November 2016 Monthly Water Quality Monitoring Report
 Redwood Shores Lagoon November 2016 Monthly Water Quality Monitoring Report Prepared for Redwood City Public Works Services Department 1400 Broadway Redwood City, CA 94063-2594 Prepared by Clean Lakes,
Redwood Shores Lagoon February 2019 Monthly Water Quality Monitoring Report
 Redwood Shores Lagoon February 2019 Monthly Water Quality Monitoring Report Prepared for Redwood City Public Works Services Department 1400 Broadway Redwood City, CA 94063-2594 Prepared by Clean Lakes,
ARKANSAS NUTRIENT CRITERIA DEVELOPMENT. EPA Region 6 Nutrient RTAG Dallas, Texas April 14, 2015
 ARKANSAS NUTRIENT CRITERIA DEVELOPMENT EPA Region 6 Nutrient RTAG Dallas, Texas April 14, 2015 CRITERIA DEVELOPMENT MILESTONES Assessment Methodology Beaver Lake Wadeable Streams Nutrient Trading-Act 335
Overview National Aquatic Resource Surveys
 Overview National Aquatic Resource Surveys Tribal Water Workshop Oct. 6 th 2016 Mari Nord- USEPA Region 5 Sarah Lehmann USEPA Headquarters 1 Designed to Answer Key Policy Questions What is the condition
Redwood Shores Lagoon May 2017 Monthly Water Quality Monitoring Report
 Redwood Shores Lagoon May 2017 Monthly Water Quality Monitoring Report Prepared for Redwood City Public Works Services Department 1400 Broadway Redwood City, CA 94063-2594 Prepared by Clean Lakes, Inc.
2012 Nutrient Regulations Update
 2012 Nutrient Regulations Update OWEA Government Affairs Workshop March 1, 2012 Guy Jamesson, PE, BCEE Malcolm Pirnie, The Water Division of ARCADIS Imagine the result Agenda Nutrient impacts Nutrient
Lake Washington. Water Quality Assessment Report. Copyright 2012 PLM Lake & Land Management Corp.
 Lake Washington 2012 Water Quality Assessment Report Copyright 2012 PLM Lake & Land Management Corp. Water Quality Report On May 22nd, June 18th, July 30th, August 29th, and September 27 th, 2012, PLM
Redwood Shores Lagoon August Monthly Water Quality Monitoring Report
 Redwood Shores Lagoon August Monthly Water Quality Monitoring Report Prepared for Redwood City Public Works Services Department 1400 Broadway Redwood City, CA 94063-2594 Prepared by Clean Lakes, Inc. P.
Surveys of the Nation s Waters
 Surveys of the Nation s Waters EPA and State Collaboration to Assess the Condition of the Nation s s Waters Darvene Adams, USEPA-Region 2 Presented at: NJ Water Monitoring Council Meeting May 30, 2007
Lakeshore Habitat Condition in Wisconsin. Katie Hein, Caitlin Carlson, Paul Garrison & Tim Asplund
 Lakeshore Habitat Condition in Wisconsin Katie Hein, Caitlin Carlson, Paul Garrison & Tim Asplund When you look at a lake, what do you see? Limnology focused on the pelagic zone and so did state wide monitoring
National Lakes Assessment 2012
 National Lakes Assessment 2012 Lake Specific Reports: Lakes on the Red Lake Reservation This is part of a series based on Minnesota s participation in U.S. EPA s 2012 National Lakes Assessment November
Appendix D Monitoring Program
 Appendix D Monitoring Program [This page left intentionally blank.] Shingle Creek and West Mississippi Watershed Management Commissions Third Generation Watershed Management Plan Monitoring Program Minnesota
Stormwater Runoff & Pesticides What Monitoring Done Elsewhere May Suggest for South Portland
 Stormwater Runoff & Pesticides What Monitoring Done Elsewhere May Suggest for South Portland South Portland City Council Workshop 8/8/16 Fred Dillon Stormwater Program Coordinator Stormwater 101 What stormwater
Status of Water Quality in Ohio: The 2018 Integrated Report. April 25, 2018
 Status of Water Quality in Ohio: The 2018 Integrated Report April 25, 2018 Today s Topics Overview of the 2018 Integrated Report Purpose and requirements Assessment overview Differences from the 2016 Integrated
Nutrients. Water Quality Planning Branch Water Division Arkansas Department of Environmental Quality
 Nutrients Water Quality Planning Branch Water Division Arkansas Department of Environmental Quality Water Quality & Biological Data Water Quality Standards & Criteria Assessment Permit Limitations Impairment
Wakefield Lake TMDL Public Meeting 3/17/2014. Jen Koehler, PE Barr Engineering
 Wakefield Lake TMDL Public Meeting 3/17/2014 Jen Koehler, PE Barr Engineering Outline Project Contacts Introduction to Wakefield Lake Thoughts/Questions/Concerns About TMDL Studies Lake Water Quality and
Portage Lake Hubbard County
 Prepared in cooperation with the Minnesota Department of Natural Resources Minnesota Lake ID: 9- Area: acres Watershed Area: 6,7 acres Ecoregion: Northern Lakes and Forests (NLF) Portage Lake Hubbard County
EUTROPHICATION. Student Lab Workbook
 EUTROPHICATION Student Lab Workbook THE SCIENTIFIC METHOD 1. Research Background literature research about a topic of interest 2. Identification of a problem Determine a problem (with regards to the topic)
Draft National Rivers and Stream Assessment. Overview and Key Findings NRSA 2008/09
 Draft National Rivers and Stream Assessment Overview and Key Findings NRSA 2008/09 1 Outline of Presentation Background on the National Aquatic Resource Surveys NRSA Design and Indicators Key Findings
Lake & Watershed Resource Management Associates P O Box 65; Turner, ME
 Lake & Watershed Resource Management Associates P O Box 65; Turner, ME 207-336-2980 LWRMA @megalink.net 2009 Baseline Water Quality Monitoring and Assessment of McCurdy Pond At the request of the Pemaquid
MassDEP Water Quality Monitoring in the Merrimack Watershed: Therese Beaudoin MassDEP Division of Watershed Management
 MassDEP Water Quality Monitoring in the Merrimack Watershed: 1995-2015 Therese Beaudoin MassDEP Division of Watershed Management Overview Descriptions of the various monitoring programs conducted by MassDEP
Wisconsin River. Hardest Working River In the Nation
 Hardest Working River In the Nation Hardest Working River In The Nation Largest Basin In Wisconsin 430 miles in length 20% of Wisconsin, with diverse land use 14,776 mi2 catchment at Prairie du Sac Dam
Lake of the Pines. Watershed TMDL. Depressed DO conditions in 3,700 acres of upper reservoir; declining
 Lake O O the Pines Watershed TMDL Presented at: 15 th National NPS Monitoring Workshop August 27, 2007 Vernon D. Rowe, P.E. Pilgrim s Pride Corporation Corporate Environmental Manager Lake of the Pines
What Characterizes the Taninim Estuary in Relation to Other Mediterranean Microestuaries in Israel and Implications for the River rehabilitation
 What Characterizes the Taninim Estuary in Relation to Other Mediterranean Microestuaries in Israel and Implications for the River rehabilitation Sarig Gafny (sarig@ruppin.ac.il) The RIME team: Gitai Yahel,
2016 Summit Lake Water Quality Report Prepared by Thurston County Environmental Health Division
 ! 216 Summit Lake Water Quality Report Prepared by Thurston County Environmental Health Division PART OF TOTTEN INLET WATERSHED LENGTH OF LAKE: 2.2 miles SHORELINE LENGTH: 5.6 miles LAKE SIZE: 53 acres
Envirothon Aquatics. Mike Archer, NE Dept. of Environmental Quality. Katie Pekarek, Nebraska Extension Jeff Blaser, Nebraska Game and Parks
 Envirothon Aquatics Mike Archer, NE Dept. of Environmental Quality Katie Pekarek, Nebraska Extension Jeff Blaser, Nebraska Game and Parks Lake Watersheds Watershed = area contributing water to pond Surface
Smithville Lake 2000 Water Quality Report
 Smithville Lake 2 Water Quality Report 1. General. a. Project location. The dam is located at river mile 12.9 on the Little Platte River, a tributary of the Platte River. The drainage area above the dam
Tina Laidlaw US EPA 1
 Tina Laidlaw US EPA 1 Many states have developed approaches for listing waterbodies for nutrient-related impairments based on the narrative standard Existing state approaches are similar to CO s proposal
Update on Numeric Nutrient Criteria Development
 Update on Numeric Nutrient Criteria Development Russ Frydenborg, Ken Weaver, and Denise Miller FDEP Presented by Nia Wellendorf What are we doing and why? Due to adverse impacts of excessive nutrients
Impacts to Aquatic Habitats from Land-Use or Is It Polluted?
 Impacts to Aquatic Habitats from Land-Use or Is It Polluted? Water Pollution is: The addition of excessive carbon to a system The addition of large amounts of materials to water that causes adverse changes
WWOA Annual Conference October 6, John Kennedy. Green Bay Metropolitan Sewerage District Cleaning Water Today For Tomorrow s Generations
 WWOA Annual Conference October 6, 2011 John Kennedy Green Bay Metropolitan Sewerage District Cleaning Water Today For Tomorrow s Generations Lower Green Bay and Fox River Examples of Water Resource Degradation
Eutrophication, water clarity, and divergent responses to variation in lake level
 Eutrophication, water clarity, and divergent responses to variation in lake level Peter Lisi post doctoral scientist UW Center for Limnology pjlisi@uw.edu Catherine Hein Wisconsin DNR PJL6 PJL7 Distance
Turning water quality data into lake-specific nutrient standards
 Turning water quality data into lake-specific nutrient standards 2015 Tribal Lands and Environment Forum Nancy Schuldt, Water Projects Coordinator Fond du Lac Reservation Current Narrative Standard:
Septic System Impacts on Stormwater and Impaired Waterbodies. December 8, 2016 Tim Denison, Johnson Engineering Marcy Frick, Tetra Tech
 Septic System Impacts on Stormwater and Impaired Waterbodies December 8, 2016 Tim Denison, Johnson Engineering Marcy Frick, Tetra Tech Presentation Overview Charlotte County: Many areas adjacent to impaired
Florida Nutrient Criteria Update
 Standards and Assessment Florida Nutrient Criteria Update Russ Frydenborg Path Forward March 15, 2013: FDEP and EPA announced agreement to continue the protection of Florida s waterways from excess nitrogen
Big Chetac Lake Getting Rid of the Green Phase 3. Nutrient Budget and Management Data Analysis Report
 Big Chetac Lake Getting Rid of the Green Phase 3 Nutrient Budget and Management Data Analysis Report Prepared for: Big Chetac Chain Lake Association and Wisconsin Department of Natural Resources Prepared
2007 Inland and Purdy Reservoirs Report. Rivers and Reservoirs Monitoring Program
 2007 Inland and Purdy Reservoirs Report Rivers and Reservoirs Monitoring Program Field Operations Division Environmental Indicators Section Aquatic Assessment Unit June 2012 Rivers and Reservoirs Monitoring
NATIONAL COASTAL ASSESSMENT
 NATIONAL COASTAL ASSESSMENT Presented by: Paula Zevin, EPA Region 2 Monitoring & Assessment Branch NJ Water Monitoring Council Meeting June 9, 2004 WHAT IS THE NATIONAL COASTAL ASSESSMENT (NCA)? Five-year
Continuous records for the Chariton River indicate that 2004 was an average water year, with total flow approximately equal to the average annual
 2004 Rathbun Report Iowa State University Limnology Laboratory John A. Downing, Ph.D. George Antoniou, Assistant Scientist For Rathbun Land and Water Alliance August 31, 2005 A. Tributaries Personnel of
Water Quality Standards What s coming up for lakes? Kristi Minahan, WI DNR WI Lakes Convention April 7, 2017
 Water Quality Standards What s coming up for lakes? Kristi Minahan, WI DNR WI Lakes Convention April 7, 2017 Water Quality Standards Water Quality Standards 1. Designated Uses 2. Water Quality Criteria
The Snapshot CONODOGUINET CREEK WATERSHED SNAPSHOT
 CONODOGUINET CREEK WATERSHED SNAPSHOT ABOVE: CONODOGUINET CREEK AT RT 74 BRIDGE FACING DOWNSTREAM The Snapshot The Conodoguinet Watershed Snapshot was a collaborative effort to engage local citizens in
Environmental Services
 215 Environmental Services River Water Quality Summary for the Twin Cities Metropolitan Area In 215, Metropolitan Council Environmental Services (MCES) river monitoring was conducted at six automated and
Subwatershed Prioritization of the Lake Wister Watershed Using Baseflow Water Quality Monitoring Data
 Subwatershed Prioritization of the Lake Wister Watershed Using Baseflow Water Quality Monitoring Data Bradley J. Austin, Brina Smith, and Brian E. Haggard Eutrophication Process by which excess nutrients
Long Prairie River Watershed Restoration and Protection Strategies (WRAPS) Report Summary
 Report Summary") Long Prairie River Watershed Restoration and Protection Strategies (WRAPS) Report Summary Minnesota has adopted a watershed approach to address the state s 80 major watersheds (denoted by 8-digit hydrologic
Long Prairie River Watershed Restoration and Protection Strategies (WRAPS) Report Summary Minnesota has adopted a watershed approach to address the state s 80 major watersheds (denoted by 8-digit hydrologic
What is a TMDL? MWEA NPDES Permit Compliance Seminar. December 2, 2009
 What is a TMDL? Total Maximum Daily Load is an estimate of the maximum amount of a pollutant that a water body can receive and still meet water quality standards, and an allocation of that amount to the
Total Maximum Daily Load Development for Unnamed Tributary to Pitts Creek. Public Meeting March 26, Why Are We Here
 Total Maximum Daily Load Development for Unnamed Tributary to Pitts Creek Public Meeting March, Why Are We Here. Learn about water quality of the stream. Discuss the Total Maximum Daily Load (TMDL) development.
Water Quality Monitoring for Lake Erie and the Great Lakes Nutrient Initiative (GLNI)
") Water Quality Monitoring for Lake Erie and the Great Lakes Nutrient Initiative (GLNI) 2011-2016 Water Quality Monitoring and Surveillance Division Alice Dove, Sean Backus, Vi Richardson Issues Facing the
Water Quality Monitoring for Lake Erie and the Great Lakes Nutrient Initiative (GLNI) 2011-2016 Water Quality Monitoring and Surveillance Division Alice Dove, Sean Backus, Vi Richardson Issues Facing the
Introduction. USEPA National Rivers and Streams Assessment (NRSA) Credit to: Colin Hill Tetra Tech, Inc.
 Credit to: Colin Hill Tetra Tech, Inc.") USEPA National Rivers and Streams Assessment (NRSA) Introduction Presented by: Al Korndoerfer, NJDEP/WM&S NJWMC Mtg, June 11, 2008 Credit to: Colin Hill Tetra Tech, Inc. What is the National Rivers and
USEPA National Rivers and Streams Assessment (NRSA) Introduction Presented by: Al Korndoerfer, NJDEP/WM&S NJWMC Mtg, June 11, 2008 Credit to: Colin Hill Tetra Tech, Inc. What is the National Rivers and
WATERSHED. Maitland Valley. Report Card 201
 Maitland Valley WATERSHED Report Card 201 The Maitland Valley Conservation Authority has prepared this report card as a summary on the state of our forests, wetlands, surface water, and ground water resources.
Development of Nutrient Criteria for Wyoming Streams and Lakes
 Development of Nutrient Criteria for Wyoming Streams and Lakes Eric Hargett Wyoming Department of Environmental Quality Water Quality Division Watershed Protection Program Monitoring Program Wyoming Nutrient
Today s Webinar: Types of Monitoring and Assessment Data and What They Mean
 Welcome to the 1 st Webinar in the Series Monitoring & Assessment for Watershed Plans: Identifying, Accessing, and Using Data to Protect and Restore Indiana s Waters Each Monday in May at noon Today s
NUTRIENTS AND PARTICLES TAHOE.UCDAVIS.EDU 9
 NUTRIENTS AND PARTICLES 9 Sources of clarity-reducing and blueness-reducing pollutants In 2017 Research has quantified the primary sources of nutrients (nitrogen and phosphorus) and particulate material
Water Quality Sampling Presentation Ministry of the Environment. Presented by Dana Cruikshank Surface Water Specialist October 2009
 Water Quality Sampling Presentation Ministry of the Environment Presented by Dana Cruikshank Surface Water Specialist October 2009 1 5W s of Water Quality Sampling WHY WHAT WHERE WHEN WHO Sampling is an
Welcome. Thank you for joining us! Lower Mississippi River Watershed Management Organization
 Welcome. Thank you for joining us! Lower Mississippi River Watershed Management Organization Lower Mississippi River Watershed Management Organization Watershed Restoration and Protection (WRAP) Study
Owasco Lake Day
 Introductions Halfman apologizes for not presenting this talk himself. A family reunion took precedent. Owasco Lake Day 6-25--14 1 The beginnings Preliminary water quality comparison of the Finger Lakes
Watershed and Water Quality Modeling to Support TMDL Determinations Lake Oologah
 Watershed and Water Quality Modeling to Support TMDL Determinations Lake Oologah 26 th Annual Conference Oklahoma Clean Lakes and Watersheds Association (OCLWA) April 5-6, 2017 Stillwater, Oklahoma Lake
Appendix X: Non-Point Source Pollution
 Appendix X: Non-Point Source Pollution Sources Nonpoint source of pollution, unlike pollution from industrial and sewage treatment plants, comes from many different sources. Nonpoint source pollution is
Water Quality Assessment in the Thames River Watershed
 Water Quality Assessment in the Thames River Watershed Nutrient Trends Karen Maaskant, Upper Thames River Conservation Authority 2015 Lake St. Clair Conference October 21, 2015 Outline Thames River watershed,
Fact Sheet. Chesapeake Bay Water Quality
 Fact Sheet Chesapeake Bay Water Quality Water quality is a critical measure of the Chesapeake Bay s health. For the Bay to be healthy and productive, the water must be safe for people and must support
Factsheet: Town of Deep River Water Quality and Stormwater Summary
 79 Elm Street Hartford, CT 06106-5127 www.ct.gov/deep Affirmative Action/Equal Opportunity Employer Factsheet: Town of Deep River Water Quality and Stormwater Summary This document was created for each
Water Quality Study In the Streams of Flint Creek and Flint River Watersheds For TMDL Development
 Water Quality Study In the Streams of Flint Creek and Flint River Watersheds For TMDL Development Idris Abdi Doctoral Dissertation Presentation Major Advisor: Dr. Teferi Tsegaye April 18, 2005 Alabama
2018 WATER QUALITY MONITORING BLUE MARSH RESERVOIR LEESPORT, PENNSYLVANIA
 2018 WATER QUALITY MONITORING BLUE MARSH RESERVOIR LEESPORT, PENNSYLVANIA U.S. Army Corps of Engineers Philadelphia District Environmental Resources Branch January 2019 2018 Water Quality Monitoring Blue
Ploof s Creek South. Johannes Creek. Grand Lake, Ploof s Creek South, Johannes Creek. Introduction
 524 4th Street South Sauk Centre, MN 56378 320.352.2231 Grand Lake, Ploof s Creek South, Johannes Creek Introduction Since the 2012 monitoring season, the Grand Lake Improvement District (Grand LID) and
LAKE OF THE WOODS PROGRAM
 LAKE OF THE WOODS PROGRAM Water quality and aquatic ecosystem health is of concern in OBJECTIVES the Lake of the Woods. The most critical issue affecting Lake of the Woods water quality and aquatic ecosystem
Stream Water Quality Assessment of Long Point Gully, Graywood Gully, and Sutton Point: Conesus Lake Tributaries 2015
 Stream Water Quality Assessment of Long Point Gully, Graywood Gully, and Sutton Point: Conesus Lake Tributaries 2015 Theodore W. Lewis and Joseph C. Makarewicz The Department of Environmental Science and
2006 Aliceville Reservoir Report. Rivers and Reservoirs Monitoring Program
 2006 Aliceville Reservoir Report Rivers and Reservoirs Monitoring Program Field Operations Division Environmental Indicators Section Aquatic Assessment Unit May 2011 Rivers and Reservoirs Monitoring Program
CITIZEN MONITORING AS WATERSHED MANAGEMENT TOOL. Reesa Evans Lake Specialist Certified Lake Manager Adams County LWCD
 CITIZEN MONITORING AS WATERSHED MANAGEMENT TOOL Reesa Evans Lake Specialist Certified Lake Manager Adams County LWCD Setting Up Monitoring When looking at setting up a monitoring program, the first step
Barnegat Bay Water Quality and Quantity Monitoring Program
 Barnegat Bay Water Quality and Quantity Monitoring Program Helen Pang, Trish Ingelido, Ariane Giudicelli, Barbara Hirst, Amanda Lotto and Jill Lipoti Water Monitoring and Standards NJDEP 2013 Delaware
Florida Department of Environmental Protection Numeric Nutrient Criteria: Current Status
 Florida Department of Environmental Protection Numeric Nutrient Criteria: Current Status Russ Frydenborg, Drew Bartlett, Daryll Joyner, Ken Weaver Division of Assessment and Restoration Support Nutrient
Choptank Monitoring Snapshot
 Choptank Monitoring Snapshot Cooperative Oxford Laboratory Parameters/Frequency Measured: At the water quality sites, physical (YSI) and chemical (nutrients) are measured seasonally (May, July, Sep).
Monitoring Plan. The following section provides information related to:
 Monitoring Plan This section summarizes monitoring efforts included in the Watershed Protection Plan. Much like the Watershed Protection Plan in general, the Monitoring plan is comprised of efforts from
NLA New Jersey Lakes 2012
 NLA New Jersey Lakes 2012 Vic Poretti NJWMC Meeting May 30, 2012 NLA New Jersey Lakes (11 Lakes) 2012 NLA Lakes Municipality County 2007 NLA Common Lakes Sampled by NJDEP 2007 Sampled by NJDEP 2012 Est.
NUTRIENTS AND PARTICLES TERC.UCDAVIS.EDU
 NU T R I EN T S A N D PA R T I C L E S 9 TAHOE: STATE OF THE L AKE REPORT 2017 Sources of clarity-reducing and blueness-reducing pollutants In 2016 Research has quantified the primary sources of nutrients
Factsheet: City of West Haven Water Quality and Stormwater Summary
 79 Elm Street Hartford, CT 06106-5127 www.ct.gov/deep Affirmative Action/Equal Opportunity Employer Factsheet: City of West Haven Water Quality and Stormwater Summary This document was created for each
REND LAKE WATER QUALITY
 REND LAKE 1999-2002 WATER QUALITY REPORT U.S. ARMY CORPS OF ENGINEERS, ST. LOUIS DISTRICT ENVIRONMENTAL QUALITY SECTION - Water Quality Billy Arthur, Section Chief Theodore Postol, Environmental Engineer
DRAFT. Tidal Trends in Water Quality: Potomac River 2017 Tributary Summary
 DRAFT Tidal Trends in Water Quality: Potomac River 2017 Tributary Summary Sept 26, 2018 1 Contents 1. Location... 3 1.1 Watershed Physiography... 3 1.2 Tidal Waters and Stations... 4 2. Tidal Water Quality
Narrative Water Quality Objective
 Narrative Water Quality Objective Waste discharges shall not contribute to excessive algal growth in inland surface receiving waters. (Basin Plan, 1995, pg. 4-5) Excessive is not defined No numeric standard
Okanagan Large Lakes Water Quality Monitoring Program Ellison Lake Wood Lake Kalamalka Lake Okanagan Lake Skaha Lake Osoyoos Lake
 Okanagan Large Lakes Water Quality Monitoring Program Ellison Lake Wood Lake Kalamalka Lake Okanagan Lake Skaha Lake Osoyoos Lake 1 Table of Contents Goals & Objectives... Trophic Status... Data Collection...
Shifting Tides: Florida's Changing Water Quality Regulations
 Shifting Tides: Florida's Changing Water Quality Regulations Statewide Stormwater Rule & EPA Numeric Nutrient Criteria Chris Martinez Assistant Professor University of Florida Outline - Statewide Stormwater
Nutrient distributions and the interaction between coastal wetlands and the nearshore of Lake Ontario
 Nutrient distributions and the interaction between coastal wetlands and the nearshore of Ontario Krista Chomicki and Gary Bowen International Association of Great s Research, 25 Type Durham Region Coastal
Factsheet: Town of East Lyme Water Quality and Stormwater Summary
 79 Elm Street Hartford, CT 06106-5127 www.ct.gov/deep Affirmative Action/Equal Opportunity Employer Factsheet: Town of East Lyme Water Quality and Stormwater Summary This document was created for each
EPA s Proposed Water Quality Standards for Florida s Lakes and Flowing Waters Establishing Numeric Nutrient Criteria January 14, 2010
 EPA s Proposed Water Quality Standards for Florida s Lakes and Flowing Waters Establishing Numeric Nutrient Criteria January 14, 2010 Erik Silldorff, DRBC NJ Water Monitoring Council Meeting Feb 3, 2010
Interpreting Lake Data
 Interpreting Lake Data Indiana Clean Lakes Program The Indiana Clean Lakes Program was created in 1989 as a program within the Indiana Department of Environmental Management's (IDEM) Office of Water Management.
9. Evaluation Mechanisms
 9. Evaluation Mechanisms Not everything that can be counted counts, and not everything that counts can be counted. - Albert Einstein Introduction Watershed planning is meant to be an iterative process
CREEKS OF THE MIDDLE FOX RIVER 2016 Progress Report
 CREEKS OF THE MIDDLE FOX RIVER 2016 Progress Report Brewster approximately three years after dam removal Presented by the Sierra Club Valley of the Fox Water Sentinels ILLINOIS CHAPTER PRESERVING THE FOX
Physics, Chemistry, and Biology in Ponds and Lakes
 Physics, Chemistry, and Biology in Ponds and Lakes Ponds and Lakes Dominated by Heterotrophic Processes Example. A well mixed lake with V = 5x10 8 L is fed by a stream flowing at Q=2.4x10 7 L/d that contains
Lake Whatcom Water Quality - Presentation to Bellingham City Council
 Western Washington University Western CEDAR Lake Whatcom Other Reports Lake Whatcom 7-6-2015 Lake Whatcom Water Quality - Presentation to Bellingham City Council Robin A. Matthews Western Washington University,
5.0 NUTRIENT TMDL COMPONENTS
 5.0 NUTRIENT TMDL COMPONENTS This section of the document focuses on nutrients as a cause of water quality impairment in the Bitterroot project area. It describes: (1) how excess nutrients impair beneficial
nutrients and particles terc.ucdavis.edu 9
 nutrients and particles 9 Tahoe: State of the L ake RepoRT 2016 Sources of clarity-reducing and blueness-reducing pollutants In 2015 Research has quantified the primary sources of nutrients (nitrogen and
Protecting Utah s Water Resources. Nutrient Issues
 Protecting Utah s Water Resources Nutrient Issues Nutrient Issues Questions What are they? Why are they important? Nationally Locally What are the impact on my community Costs Timing What are Nutrients?
Physics, Chemistry, and Biology in Ponds and Lakes
 11//1 Physics, Chemistry, and Biology in Ponds and Lakes Ponds and Lakes Dominated by Heterotrophic Processes Example. A well mixed lake with V = x1 8 L is fed by a stream flowing at Q=.x1 7 L/d that contains
Nutrient Cycling and Water Quality on California Rangelands
 Nutrient Cycling and Water Quality on California Rangelands Randy Dahlgren Department of Land, Air and Water Resources University of California - Davis Core Research Team Barbara Allen-Diaz Rob Atwill
Land-Use Survey and Impact Study of Plymouth Beach Residential Canal. Rachel Weston
 Land-Use Survey and Impact Study of Plymouth Beach Residential Canal University of Michigan Biological Station Biology 482 Limnology Tuesday, August 16th 2011 Prof. Paul Moore Abstract A full examination