RESULTS OF AN AQUIFER TEST AT VERMILLION, SOUTH DAKOTA
|
|
|
- Sherman Price
- 6 years ago
- Views:
Transcription
1 STATE OF SOUTH DAKOTA M. Michael Rounds, Governor DEPARTMENT OF ENVIRONMENT AND NATURAL RESOURCES Steven M. Pirner, Secretary DIVISION OF FINANCIAL AND TECHNICAL ASSISTANCE David Templeton, Director GEOLOGICAL SURVEY PROGRAM Derric L. Iles, State Geologist OPEN-FILE REPORT 91-UR RESULTS OF AN AQUIFER TEST AT VERMILLION, SOUTH DAKOTA by TOM RICH Akeley-Lawrence Science Center University of South Dakota Vermillion, South Dakota 2006
2 GEOLOGICAL SURVEY PROGRAM DEPARTMENT OF ENVIRONMENT AND NATURAL RESOURCES AKELEY-LAWRENCE SCIENCE CENTER 414 EAST CLARK STREET VERMILLION, SOUTH DAKOTA (605) Derric L. Iles, M.S. Sarah A. Chadima, M.S. Timothy C. Cowman, M.S. Brian A. Fagnan, M.S. Dragan Filipovic, M.S. Thomas N. Haggar, B.S. Ann R. Jensen, B.S. Matthew T. Noonan, B.S. Thomas B. Rich, M.S. Layne D. Schulz, B.S. Dennis W. Tomhave, B.A. Dennis D. Iverson Gary W. Jensen Scott W. Jensen Ted R. Miller Colleen K. Odenbrett Lori L. Roinstad Priscilla E. Young, B.S. State Geologist Senior Geologist Natural Resources Administrator Geologist Senior Hydrologist Geologist Senior Geologist Hydrologist Senior Hydrologist Senior Geologist Geology Specialist Civil Engineering Technician Civil Engineering Technician Civil Engineering Technician Natural Resources Technician Word Processing Supervisor Cartographer Senior Secretary RAPID CITY REGIONAL OFFICE 2050 WEST MAIN, SUITE 1 RAPID CITY, SOUTH DAKOTA (605) Mark D. Fahrenbach, Ph.D. Senior Geologist Kelli A. McCormick, Ph.D. Senior Geologist J. Foster Sawyer, Ph.D. Hydrology Specialist
3 CONTENTS Page INTRODUCTION... 1 HYDROGEOLOGIC SETTING... 1 THE AQUIFER TEST... 2 METHODOLOGY... 2 RESULTS AND INTERPRETATION... 3 SUMMARY... 6 REFERENCES... 8 FIGURES 1. Map of the study area 2. Locations of wells 3. Cross section A-A 4. Cross section B-B 5. Total drawdown versus distance from the pumping well TABLES 1. Schedule for pumping and measurement of water levels 2. Aquifer parameters calculated form water level drawdown data APPENDICES A. Field data B. Key to analytical solutions C. Results of analyses of aquifer test data using AQTESOLV software i
4 INTRODUCTION From June 2 through June 4, 2003, the Geological Survey Program, South Dakota Department of Environment and Natural Resources, conducted an aquifer test within the city of Vermillion s well field in cooperation with the city of Vermillion. The well field is located in N½ sec. 24, T. 92 N., R. 52 W. in southwestern Vermillion (figs. 1 and 2). The test consisted of an initial non-pumping phase during which water levels were allowed to recover to equilibrium or near equilibrium conditions, a second phase that consisted of pumping one municipal well, and a third phase during which water levels were again allowed to recover. The purpose of the test was to assess and characterize the general hydraulic properties of the aquifer in the Vermillion well field in an effort to assist the city in determining any appropriate modifications to its wellhead protection area. HYDROGEOLOGIC SETTING Vermillion is located in southern Clay County adjacent to, and in, the Missouri River valley (fig. 1). Surface sediments in the part of Vermillion occurring in the Missouri River valley are composed primarily of overbank deposits (figs. 3 and 4). These overbank deposits are up to 65 feet thick and are composed of clay and silt with minor amounts of sand (Christensen, 1967). They extend from the edge of the bluff southward to approximately one-third mile south of the Vermillion River. In this area, the overbank deposits comprise an aquitard above the underlying outwash. Within the immediate well field area, these generally fine-grained sediments are thickest to the north and west and become thinner to the south and east. The water table occurs in the fine-grained overbank deposits at a depth of about 16 feet immediately south of the bluff (Zutz, 2003). Most of Vermillion occurs on uplands to the north of the Missouri River valley. Surface sediments on the uplands are composed primarily of loess-mantled till that is about 120 feet thick (Christensen, 1967). Christensen indicates the loess to range in thickness from 0 to 15 feet. Thus, there may be areas where loess is absent resulting in till being the surface sediment. The narrow bluff separating the Missouri River valley from the uplands is mapped as having till as the surface sediment (Christensen, 1967). The till is generally considered to be a unit of low permeability and forms an aquitard above the underlying outwash. All areas of Vermillion are underlain at depth by outwash (sand and gravel), as indicated in figures 3 and 4, that was deposited by glacial meltwater (Christensen, 1967). The outwash that underlies the overbank sediments in the Missouri River valley is named the Missouri aquifer. The outwash that underlies the till in the bluff and uplands is named the Lower-Vermillion- Missouri aquifer. However, these two named aquifers are in direct hydraulic connection, occur at essentially the same elevation, act as a single water-bearing unit, and are referred to in this report as outwash. The outwash thickness in the well field ranges from about 55 to 76 feet. The Graneros Shale directly underlies the outwash in the part of Vermillion that occurs in the Missouri River valley (Tomhave and Schulz, 2004). In Clay County, the Graneros Shale is 1
5 less than 30 feet thick (Christensen, 1967). The Dakota Formation, a source of artesian water, directly underlies the Graneros Shale. Vermillion s well field is located within the city limits and mostly in the Missouri River valley (figs. 1 and 2). All except one of Vermillion s water supply wells is completed in the Missouri aquifer. The lone exception is the water-supply well identified as #6-Active, which is located on the bluff between the valley and the uplands. This well is completed in the Lower- Vermillion-Missouri aquifer. Considering the outwash may be confined or partially confined in and immediately surrounding Vermillion s well field, the recharge to the outwash in the well field is primarily from lateral inflow. Recharge may also be from upward flow/leakage from the underlying Dakota Formation (Jorgensen, 1960). Some discharge from the outwash in the vicinity of the well field is into the Vermillion River. Farther away, some discharge from the Missouri aquifer would be into the Missouri River. However, during times of high stream flow, the rivers may be sources of recharge to the outwash. Water is also discharged from the outwash by lateral flow through the well field area and through pumping of wells. THE AQUIFER TEST Water-level data were collected from all eight wells shown on figure 2. These data are included in this report in appendix A. The water supply wells are 12 inches in diameter. The screen lengths of these wells range from 12 to 22 feet, only partially penetrating the full thickness of the aquifer (figs. 3 and 4). Well #3-Active was the only well that was pumped during the pumping phase of the study. All available wells were used to observe the development of the cone of depression induced by pumping and the deterioration of the cone of depression during the two non-pumping/recovery phases of the aquifer test. The test was conducted according to the schedule presented in table 1. The duration of the initial non-pumping phase was 13 hours, during which time the ground water was allowed to stabilize to equilibrium conditions, or near equilibrium conditions. The potentiometric surface of the outwash determined from water levels in the wells at equilibrium conditions is shown on figures 3 and 4. The subsequent pumping phase during which the cone of depression developed around the pumping well was 24 hours in duration. Finally, the second non-pumping, or recovery, phase lasted 4 hours. The pumping rate during the pumping phase of the test was kept steady at 520 gallons per minute and pumped water was discharged into the city s water storage facilities. Distances from the pumping well to the observation wells (non-pumping production wells or former production wells) ranged from 76 to 1,079 feet (table 2). METHODOLOGY AQTESOLV, a software program for determining aquifer parameters, was used to analyze aquifer test data.. Data were collected at pumping well #3-Active, and at observation wells #1-Inactive, #2-Active, #3-Inactive, #4-Active, #4-Inactive, and #6-Active. The data from well 2
6 #5-Active was not used to determine aquifer parameters due to the inaccurate and imprecise pressure gauge that was used to collect data from that well. Both the Hantush-Jacob solution for leaky confined aquifers and the Thiem solution were applied to the drawdown data collected during the aquifer test. The Hantush-Jacob solution can be applied to non-equilibrium or unsteady flow conditions while the Thiem solution applies to equilibrium or steady-state flow conditions. The drawdown data indicate that equilibrium or steady-state flow conditions were reached, or nearly reached, in the aquifer by the conclusion of the aquifer test. However, a determination of equilibrium conditions being reached, or not, cannot be reliably made due to the short duration of the test and because of the uncertainties introduced by multiple field personnel making measurements on a given well. Thus, both Hantush-Jacob and Thiem solutions were applied to the data. The Hantush-Jacob solution for leaky confined aquifers provided a good fit to the data using the AQTESOLV software. The formula for the Hantush-Jacob solution, along with the conditions assumed to exist when using this solution under ideal circumstances, is listed in appendix B. All conditions ideally assumed to exist are actually seldom, if ever, met in the course of conducting aquifer tests. As not all the assumptions listed in appendix B apply to the city s well field, the results of the calculations must be considered to be approximations. Calculations for transmissivity using the Thiem equation for steady-state radial flow to wells in confined aquifers were performed manually. Storativity cannot be calculated using the Thiem solution. The formula for the Thiem solution, along with the conditions assumed to exist under ideal circumstances, is listed in appendix B. As with the Hantush-Jacob solution, not all of these conditions apply to the city s well field, and the results must be considered to be approximations. A semi-log plot of the total drawdown occurring during the pumping phase of the test versus distance from the pumping well, #3-Active, was constructed, as shown in figure 5. Drawdown data from all observation wells except well #5-Inactive were used to determine the radius of influence of the pumping well (r o ) as the point on the distance axis that is intersected by the line of best fit to the data points. The specific capacity (pumping rate divided by total drawdown) of well #3-Active (the pumping well) was determined manually from its drawdown data. RESULTS AND INTERPRETATION Water levels in all assessed wells began to decline within the first 5 minutes of the pumping phase of the test. Recharge and discharge of water reached, or very nearly reached, equilibrium in all observation wells during the later part of the pumping phase of the aquifer test. The Hantush-Jacob solution for leaky confined aquifers provided a good fit to the data from all observation wells using the AQTESOLV software. Results of the analysis of drawdown data from wells #1-Inactive, #2-Active, #3-Active, #3-Inactive, #4-Active, #4-Inactive and #6-Active determined using this solution are shown in table 2 and appendix C. The transmissivities determined for observation wells #1-Inactive, #3-Inactive, #4-Active and #4-Inactive, the four observation wells closest to the pumping well, ranged from 54,000 to 56,000 ft 2 /day. Storativities 3
7 of these four observation wells were , , , and , respectively. Thus, there was no substantial difference in the values of transmissivity, and the storativities were within the same order of magnitude among these four observation wells using the Hantush-Jacob solution. Three of these four wells are farther from the pumping well than the distance beyond which partial penetration of the screened portions of wells through the outwash has negligible effect on the analyses as described by Fetter (1988). Because there was no difference in transmissivities at distances greater and less than this critical distance, any effect of partial penetration of observation wells is assumed to have been negligible. The transmissivities calculated using the Hantush-Jacob solution for wells #2-Active and #6-Active were 50,000 and 75,000 ft 2 /day, respectively. The storativities calculated for these two wells using this solution were and , respectively. The difference between the aquifer parameters calculated for these wells and those calculated for the four observation wells closest to the pumping well is attributed to heterogeneous conditions in the outwash. The median transmissivity and storativity calculated using the Hantush-Jacob solution for all six assessed observation wells were 55,000 ft 2 /day and , respectively. The results of five calculations of transmissivity using the Thiem steady-state solution are shown in table 2. These transmissivity values ranged from 37,000 to 45,000 ft 2 /day. The median transmissivity of these calculations was 43,000 ft 2 /day. The minor difference in the median transmissivity values calculated using the Hantush-Jacob and Thiem solutions is accounted for by the fact that these solutions use different factors in calculating aquifer parameters. Change in drawdown occurring within a well and leakage are factored only into the Hantush-Jacob solution, while the difference in total drawdown between wells is only factored into the Thiem solution. In addition, the ratio of the distances from the pumping well of two observation wells is factored only into the Thiem equation. Transmissivity values calculated with the Thiem solution are more likely to be accurate than those obtained from a transient analysis (Fetter, 1988). However, there is some uncertainty as to whether steady-state conditions occurred in pumping wells #3-Active, well #4-Active, and well #4-Inactive. In addition, the use of the Hantush-Jacob solution accommodates reporting of storativity values. The good of fit of the data to the Hantush-Jacob solution is also indicative of leakage from an aquitard as a source of recharge during the aquifer test. Therefore, results of both the Hantush-Jacob and Thiem solutions are reported. The median transmissivity values calculated by the Hantush-Jacob and Thiem analytical solutions are both substantially higher than 14,000 ft 2 /day, which is the threshold transmissivity of a good aquifer (Freeze and Cherry, 1979). Under ideal conditions, all flow to pumping wells in a completely confined aquifer occurs laterally. However, three possible additional sources of recharge to the aquifer during the test are suggested by this study. The Vermillion River was one probable source of recharge as it lies within the 2,400-foot radius of influence of the pumping well determined from the semi-log plot of total drawdown versus distance from the pumping well (fig. 5). The position of the data point corresponding with well #2-Active on figure 5 indicates that there was slightly less drawdown in this well than would be predicted from the line of best fit for all data. Since well #2-Active is closer to the Vermillion River than any other wells, this relatively smaller amount of drawdown 4
8 most likely indicates recharge from the river. An implication of the apparent recharge to the outwash from the river during the aquifer test is that the river is also a natural source of recharge to the outwash at times of high stream flow. Another possible source of recharge to the observation wells during the aquifer test is upward flow of ground water induced by artesian pressure within the Dakota aquifer. Leakage of ground water through the Graneros Shale, which is believed to lie between the Dakota aquifer and most, if not all, of the outwash in the well field, is consistent with the good fit of the data from all observation wells to the Hantush-Jacob solution. The Hantush-Jacob solution is for leaky confined aquifers assuming steady-state flow (no storage) in the aquitard(s). Equilibrium between recharge and discharge during pumping was reached, or nearly reached, at all observation wells, including well #6-Active, which is evidence for recharge as leakage through an aquitard. Well #6-Active was the farthest observation well from the river and therefore the least likely to receive recharge from the river of all the wells monitored during the test. The coefficient of determination (R 2 ) for the data to the negatively sloping line on the total drawdown versus distance from pumping well semi-log plot shown in figure 5 was This very good fit of the data to the semi-log line implies that distance from pumping well #3-Active was a principle determinant of the amount of drawdown in the observation wells. While this goodness of fit is consistent with lateral flow as a recharge source, it is also consistent with the presence of a source of recharge approximately equidistant from all wells, such as leakage through the Graneros Shale. The fine-grained sediments that overlie the outwash in the well field area are another possible source of recharge to the outwash. This source of recharge is also approximately equidistant to the outwash throughout the well field and therefore consistent with the good fit of the distance versus drawdown data points to the line of best fit shown in figure 5. Leakage from these sediments is also consistent with the goodness of fit of the drawdown data from all observation wells to the Hantush-Jacob solution. However, substantial gravity drainage of water from such fine-grained sediments is not likely. Significant leakage into the outwash is also unlikely from the till underlying the uplands. Whether there is any flow of water into the outwash from the overlying sediments during pumping cannot be determined from the test data. If available, a shallow observation well located south of the bluff near a pumping well and screened at or near the water table could be used to determine the effect of pumping on the water table. If the water table elevation falls in response to pumping, some recharge to the outwash from the overlying fine grained sediments would be indicated. There may not have been any influence of pumping during the aquifer test on the ground water within the 2,400-foot calculated radius of influence (fig. 5) south of the Vermillion River because the river is a ground water boundary. However, at high pumping rates over extended periods of time, ground water could potentially be drawn northward under the Vermillion River from south of the river. The radius of influence determined for pumping in the well field would probably have been larger had more than one of the city s wells had been pumping simultaneously or had the rate of pumping been higher. 5
9 Several criteria indicate that the ground water in the outwash in the city of Vermillion s well field exists under confined conditions. One criterion is the position of the potentiometric surface of the outwash in the overbank sediments and till that comprise the upper aquitard (figs. 3 and 4). The lack of a gently sloping segment of the curve on the log drawdown versus log time plots shown in appendix C preceded and followed by more steeply sloping segments also indicates confined hydraulic conditions. Data plots of time versus drawdown for aquifers under water table conditions show such gently sloping segments corresponding with gravity drainage of ground water (Freeze and Cherry, 1979). Another indication of confined conditions is the order of magnitude of the storativity values for the outwash that were calculated. A typical range of storativity values for confined aquifers is from to (Driscoll, 1986). The 2,400-foot radius of influence of the pumping well determined on figure 5 probably also indicates confined conditions. Thus, while the fine-grained sediments overlying the outwash from which the city of Vermillion obtains its water supply retard downward migration of any potential contaminants, they also cause confined hydraulic conditions to prevail in the outwash. As a result of this confined condition and the high transmissivity of the outwash, the area of influence of pumping is substantially greater than would occur under water table conditions and lower transmissivity. Water table conditions exist south of the Vermillion River (fig. 4) and might also be present in the area between the southeastern part of the well field and the Vermillion River. It is inferred that any existing water table conditions in those portions of these two areas lying within the radius of influence of the pumping well had no influence on drawdown rates in the observation wells during the aquifer test. This lack of influence on drawdown rates is attributed to the relatively great distance of these areas from the pumping and observation wells. In the area south of the Vermillion River, the lack of influence on drawdown rates also resulted from the river being a ground water boundary. The specific capacity of well #3-Active was determined to be 36.5 gallons/minute/foot, as shown on table 2. However, drawdown of the water level in the pumping well, #3-Active, may have still been occurring at the end of the pumping phase of the aquifer test. Therefore, the actual specific capacity of this well may be somewhat lower than the specific capacity calculated from the test data. SUMMARY All wells in the Vermillion well field are located in the Missouri River valley except well #6-Active, which is located on the bluff between the uplands and the Missouri River valley (figs. 1 and 2). Surface sediments in the part of the well field south of the bluff in the Missouri River valley are composed primarily of fine grained, relatively impermeable overbank sediments (figs. 3 and 4). These sediments range in thickness from 65 feet in the northern and western part of the well field to 5 feet just southeast of the well field. At well #6-Active, located on the bluff, a 49- foot thick surficial layer of glacial till is present. The permeable outwash sediments that underlie these surficial sediments range in thickness from about 55 to 76 feet in the well field. The outwash is underlain by the Graneros Shale which is about 30 feet thick. The Graneros Shale is underlain by the Dakota aquifer. 6
10 Water-level data were collected from eight wells shown on figure 2, including well #3-Active, the only well that was pumped during the pumping phase of the test. All available wells were used to observe the development of the cone of depression induced by pumping at a rate of 520 gallons per minute and the deterioration of the cone of depression during the two non-pumping/recovery phases. The drawdown data from all wells except well #5-Active were analyzed using AQTESOLV software (data from well #5-Active were deemed unreliable). The Hantush-Jacob solution provided a good fit to the data collected during the pumping phase of the test. Log time versus log drawdown plots of the drawdown data along with the curve for this solution can be seen in appendix C. The median transmissivity calculated using this solution was 54,500 ft 2 /day while the median storativity was The median of five transmissivity values calculated manually using the Thiem solution was 43,000 ft 2 /day. Equilibrium between recharge and discharge occurred, or very nearly occurred, as indicated by the stabilization of water levels in all observation wells during the later part of the pumping phase of the test. Three possible sources of recharge to the outwash in addition to lateral flow toward the pumping well during the test are suggested by the study. The Vermillion River was one probable source of recharge as it lies within the 2,400-foot radius of influence of the pumping well determined from the test data (fig. 5). Leakage through aquitards underlying and overlying the outwash during pumping was also possible, particularly as flow through the underlying Graneros Shale from artesian pressure in the Dakota aquifer. The test results cannot eliminate from possibility that some recharge to the outwash from the overlying aquitard may occur. However, substantial flow into the outwash from these surficial sediments is not likely to have occurred, especially where the overlying aquitard is relatively thick. Multiple criteria indicate that the ground water in the outwash in the city of Vermillion s well field exists under confined hydraulic conditions. These criteria are the position of the potentiometric surface of the outwash in the upper aquitard (figs. 3 and 4), the shape of the curve that best fits the drawdown data (app. C), the order of magnitude of storativities calculated for the outwash (table 2), and the 2,400-foot radius of influence of the pumping well during the aquifer test (fig. 5). The fine-grained sediments overlying the outwash from which the city of Vermillion obtains its water supply act as a confining layer and retard downward migration of potential contaminants. As a result of this confined condition and the high transmissivity of the outwash, the area of influence of pumping is substantially greater than would occur under water table conditions and lower transmissivity. Water table conditions exist south of the Vermillion River (fig. 4) and might also exist in the area between the southeastern part of the well field and the Vermillion River. The area of influence of pumping may increase with higher discharge rates and pumping simultaneously from multiple wells. At high pumping rates over extended periods of time, ground water could potentially be drawn northward under the Vermillion River from south of the river. The specific capacity of well #3-Active was determined to be 36.5 gallons/minute/foot (table 2). However, drawdown of the water level in the pumping well, #3-Active, may have still been occurring at the end of the pumping phase of the aquifer test. Therefore, the actual specific 7
11 capacity of this well may be somewhat lower than the specific capacity calculated from the test data. REFERENCES Christensen, C.M., 1967, Geology and water resources of Clay County, South Dakota; Part I, Geology: South Dakota Geological Survey Bulletin 19, 86 p. Driscoll, F.G., 1986, Groundwater and wells (second edition): St. Paul, MN, H.M. Smyth Company, Inc., 1089 p. Duffield, G.M., 2000, AQTESOLV for Windows user s guide: HydroSOLVE, Inc. Fetter, C.W., 1988, Applied hydrogeology (second edition): Columbus, OH, Merrill Publishing Company, 592 p. Freeze, R.A., and Cherry, J.A., 1979, Groundwater: Englewood Cliffs, NJ, Prentice-Hall, Inc., 604 p. Jorgensen, D.G., 1960, Geology and shallow ground water resources of the Missouri Valley between North Sioux City and Yankton, South Dakota: South Dakota Geological Survey Report of Investigations 86, 54 p. Kruseman, G.P., and de Ridder, N.A., 1994, Analysis and evaluation of pumping test data (second edition): International Institute for Reclamation and Improvement Publication 47. Tomhave, D.W., and Schulz, L.D., 2004, Bedrock geologic map showing configuration of the bedrock surface in South Dakota east of the Missouri River: South Dakota Geological Survey General Map 9, scale 1:500,000. Zutz, J.K., 2003, Monitoring well installation and groundwater monitoring, former Vermillion power plant: Geotek Engineering & Testing Services, Inc. Report to the city of Vermillion, 11 p. 8

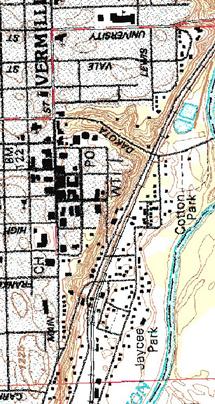
12 Figure 1. Map of the study area. T 92 N Vermillion well field South Dakota Missouri River Vermillion 0 1 mile Map base from U.S. Geological Survey 1:24,000 scale Vermillion quadrangle, 7.5 minute series (topographic) digital raster graphic.

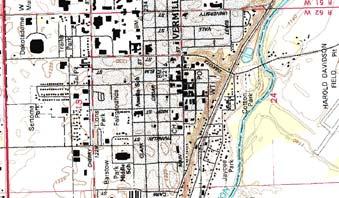
13 Figure 2. Locations of wells. Well #6-Active Well #3-Inactive Well #3-Active Well #4-Active Well #1-Inactive Well #4-Inactive Dakota St. Broadway Chestnut St. Well #2-Active Well #5-Active feet
14
15
16 Figure 5. Total drawdown versus distance from the pumping well. 1.4 Well #3-Inactive Total drawdown (ft) Well #4-Active Well #4-Inactive Well #1-Inactive Well #2-Active Well #6-Active 0.2 r 0 = 2,400 ft Distance from pumping well (ft)
17 Table 1. Schedule for pumping and measurement of water levels Date Description of time period Description of activities Immediately prior to prepumping-stabilization phase of the test Mon., June 2, 2003 Mon. and Tues., June 2 and 3, 2003 Tues., June 3, 2003 Tues. and Wed., June 3 and 4, 2003 Wed., June 4, 2003 Wells #3-Active and #4-Active are pumping to provide drinking water to Vermillion residents Approximately 7:55 PM Water levels in all wells were measured 8:00 PM All pumping wells were shut off 8:00 10:00 PM, or 0 to 120 minutes of the initial stabilization phase of the test 10:00 PM on June 2 through 8:55 AM on June 3 9:00 AM 9:00 9:10 AM, or 0 to 10 minutes of the pumping phase of the test 9:15 10:50 AM, or 15 to 100 minutes of the pumping phase of the test 10:50 AM on June 3 through 9:00 AM on June 4 9:00 AM 9:00 9:10 AM, or 0 to 10 minutes of the recovery phase of the test 9:15 10:40 AM, or 15 to 100 minutes of the recovery phase of the test 10:40 AM 1:00 PM, or 15 to 240 minutes of the recovery phase of the test 1:00 PM Water levels are allowed to recover from pumping; water levels are measured at 15, 30, 45, 60, 90, and 120 minutes Water levels were measured every 2 hours and at 8:55 AM on June 3 Pumping phase of the test started using municipal well #3-Active Water levels were measured, relative to the start of pumping, at 30 sec., 60 sec., 90 sec., 2 min., 2 min. 30 sec., 3 min. 15 sec., 4 min., 5 min., 6 min. 30 sec., 8 min., and 10 min. Water levels were measured, relative to the start of pumping, at 15, 20, 25, 30, 40, 50, 65, 80, and 100 min. Water levels were measured every 1 to 2 hours and at approximately 8:55 AM on June 4 Pump in well #3-Active is shut off; this ended the pumping phase of the test Water levels were measured, relative to the end of pumping, at 30 sec., 60 sec., 90 sec., 2 min., 2 min. 30 sec., 3 min. 15 sec., 4 min., 5 min., 6 min. 30 sec., 8 min., and 10 min. Water levels were measured, relative to the end of pumping, at 15, 20, 25, 30, 40, 50, 65, 80, and 100 min. Water levels were measured at 1-hour intervals Wells #3-Active and #4-Active were turned on to provide drinking water to Vermillion residents
18 Table 2. Aquifer parameters calculated from water level drawdown data Well name(s) Distance from Transmissivity Storativity r Analytical method o Specific capacity pumping well (ft) (ft 2 /day) (dimensionless) (ft) (gal/min/ft) #1-Inactive 434 Hantush-Jacob 56, #2-Active 677 Hantush-Jacob 50, #3-Active 0 Manual calculation #3-Inactive 76 Hantush-Jacob 55, #4-Active 385 Hantush-Jacob 54, #4-Inactive 408 Hantush-Jacob 54, #6-Active 1079 Hantush-Jacob 75, All* Jacob modified , #1-Inactive and #3-Inactive Thiem 43, #3-Inactive and #4-Inactive Thiem 45, #3-Inactive and #6-Active Thiem 44, #4-Active and #6-Active Thiem 37, #4-Inactive and #6-Active Thiem 43, r o The maximum distance from the pumping well at which drawdown of water level occurred * Except #5-Active and #3-Active
19 APPENDIX A Field data Note: Because not all watches used by personnel measuring water levels were properly synchronized, it was necessary to adjust the times of many water level measurements taken during the first 10 minutes of the pumping phase of the test according to the measurement schedule presented in table 1 in determining aquifer parameters.
20
21
22
23
24
25
26
27
28
29
30
31
32
33
34
35
36
37
38
39
40
41
42
43
44
45
46
47
48
49
50
51
52
53
54
55
56
57
58
59
60
61
62
63
64
65
66
67
68 APPENDIX B Key to analytical solutions The Hantush-Jacob solution for a pumping test in a leaky aquifer is given as: s = [Q/4πT] W(u, r/b) and u = r 2 S/4Tt Where the integral expression W(u, r/b) is referred to as the Hantush well function and: B = leakage factor determined by the Aqtesolv software Q = flow rate from pumping well r = distance from pumping well S = storativity s = drawdown at time since pumping began T = transmissivity t = time since pumping began Conditions assumed to exist when applying the Hantush-Jacob solution (Duffield, 2000): Aquifer has infinite areal extent Aquifer is homogeneous, isotropic, and of uniform thickness Aquifer potentiometric surface is initially horizontal Pumping well is fully or partially penetrating Flow to pumping well is horizontal when pumping well is fully penetrating Aquifer is leaky Flow is unsteady Water is released instantaneously from storage with decline in hydraulic head Diameter of pumping well is very small so that storage in well can be neglected Confining bed(s) is overlain by an infinite constant-head plane source Flow in the aquitard(s) is vertical The Thiem equation for steady-state flow in a confined aquifer is given as: T = Qln(r 2 /r 1 )/2π(h 2 -h 1 ) Where: h 1, h 2 = respective steady-state drawdowns Q = flow rate from pumping well r 1, r 2 = respective distances from pumping well Conditions assumed to exist when applying the Thiem solution (Kruseman and de Rider, 1994): The aquifer is confined The aquifer has an infinite areal extent The aquifer is homogeneous, isotropic, and of uniform thickness Prior to pumping the piezometric surface is horizontal The pumping rate is constant The well is screened over the entire thickness of the aquifer The hydrologic system is at a steady-state Water is released instantaneously from storage with decline in hydraulic head Diameter of pumping well is very small so that storage in well can be neglected
69 APPENDIX C Results of analyses of aquifer test data using AQTESOLV software
70
71
72
73
74
75
Well Hydraulics. The time required to reach steady state depends on S(torativity) T(ransmissivity) BC(boundary conditions) and Q(pumping rate).
 T(ransmissivity) BC(boundary conditions) and Q(pumping rate).") Well Hydraulics The time required to reach steady state depends on S(torativity) T(ransmissivity) BC(boundary conditions) and Q(pumping rate). cone of depression static water level (SWL) drawdown residual
Well Hydraulics The time required to reach steady state depends on S(torativity) T(ransmissivity) BC(boundary conditions) and Q(pumping rate). cone of depression static water level (SWL) drawdown residual
Lab 6 - Pumping Test. Pumping Test. Laboratory 6 HWR 431/
 Pumping Test Laboratory 6 HWR 431/531 7-1 Introduction: Aquifer tests are performed to evaluate the capacity of an aquifer to meet municipal or industrial water requirements. Hydraulic characteristics
Ground-Water Flow to Wells Introduction. Drawdown Caused by a Pumping Well
 1 Ground-Water Flow to Wells Introduction Wells used to control salt water intrusion, remove contaminated water, lower the water table for construction, relieve pressure under dams, and drain farmland
Comparison between Neuman (1975) and Jacob (1946) application for analysing pumping test data of unconfined aquifer
 and Jacob (1946) application for analysing pumping test data of unconfined aquifer") Comparison between Neuman (1975) and Jacob (1946) application for analysing pumping test data of unconfined aquifer Dana Mawlood 1*, Jwan Mustafa 2 1 Civil Engineering Department, College of Engineering,
Comparison between Neuman (1975) and Jacob (1946) application for analysing pumping test data of unconfined aquifer Dana Mawlood 1*, Jwan Mustafa 2 1 Civil Engineering Department, College of Engineering,
SOURCES OF WATER SUPPLY GROUND WATER HYDRAULICS
 SOURCES OF WATER SUPPLY GROUND WATER HYDRAULICS, Zerihun Alemayehu GROUNDWATER Groundwater takes 0.6% of the total water in the hydrosphere 0.31% of the total water in the hydrosphere has depth less than
8 Time-drawdown analyses
 8 Time-drawdown analyses this, the geology of the test site must be properly known. Well logs may indicate which type of aquifer you are dealing with, i.e. whether it can be regarded as confined, leaky,
ENGINEERING HYDROLOGY
 ENGINEERING HYDROLOGY Prof. Rajesh Bhagat Asst. Professor Civil Engineering Department Yeshwantrao Chavan College Of Engineering Nagpur B. E. (Civil Engg.) M. Tech. (Enviro. Engg.) GCOE, Amravati VNIT,
University of Arizona Department of Hydrology and Water Resources Dr. Marek Zreda
 University of Arizona Department of Hydrology and Water Resources Dr. Marek Zreda HWR431/531 - Hydrogeology Final exam - 12 May 1997 Open books and notes The test contains 8 problems on 7 pages. Read the
4. Groundwater Resources
 4. Groundwater Resources 4-1 Majority (97 %) of unfrozen fresh water on earth exists as groundwater. In comparison to surface water, - groundwater is available all year around - groundwater is mostly invisible
WELLHEAD PROTECTION DELINEATION REPORT FOR THE VILLAGE OF BEAR LAKE DECEMBER 2002
 WELLHEAD PROTECTION DELINEATION REPORT FOR THE VILLAGE OF BEAR LAKE DECEMBER 2002 Prepared by: Gosling Czubak Engineering Sciences, Inc. 1280 Business Park Drive Traverse City, Michigan 48686 Telephone:
SEES 503 SUSTAINABLE WATER RESOURCES GROUNDWATER. Instructor. Assist. Prof. Dr. Bertuğ Akıntuğ
 SEES 503 SUSTAINABLE WATER RESOURCES GROUNDWATER Instructor Assist. Prof. Dr. Bertuğ Akıntuğ Civil Engineering Program Middle East Technical University Northern Cyprus Campus SEES 503 Sustainable Water
9 Multi-layered aquifer systems
 9 Multi-layered aquifer systems I 1 Multi-layered aquifer systems may be one of three kinds. The first consists of two or more aquifer layers, separated by aquicludes. If data on the transmissivity and
Aquifer Science Staff, January 2007
 Guidelines for Hydrogeologic Reports and Aquifer Tests Conducted Within the Jurisdictional Boundaries of the Barton Springs / Edwards Aquifer Conservation District I. Introduction Aquifer Science Staff,
Supplemental Guide II-Delineations
 Supplemental Guide II-Delineations Contents Source Water Protection Area Delineation... 1 Delineation Criteria for Systems Using Groundwater Sources... 2 Time of Travel... 4 Flow Boundaries... 4 Delineation
Groundwater and surface water: a single resource. Santa Cruz River, Tucson
 Groundwater and surface water: a single resource Santa Cruz River, Tucson 1942 1989 1 Groundwater basics Groundwater is water found within the pore spaces of geologic material beneath the surface of the
Groundwater basics. Groundwater and surface water: a single resource. Pore Spaces. Simplified View
 Groundwater and surface water: a single resource Santa Cruz River, Tucson Groundwater basics Groundwater is water found within the pore spaces of geologic material beneath the surface of the Earth. It
OUTLINE OF PRESENTATION
 GROUNDWATER?? OUTLINE OF PRESENTATION What is groundwater? Geologic investigation Definitions: aquifer and aquitard, unconfined and semi-confined Water level and interpretation of water level data Well
Aquifer Characterization and Drought Assessment Ocheyedan River Alluvial Aquifer
 Aquifer Characterization and Drought Assessment Ocheyedan River Alluvial Aquifer Iowa Geological Survey Water Resources Investigation Report 10 Aquifer Characterization and Drought Assessment Ocheyedan
I almost horizontal line
 unsteady I I almost horizontal line I I (pseudo) steady 4 (t I I I + time Figure 10.5 Time-drawdown plots showing the changes in drawdown during an aquifer test and their interpretations To establish whether
Determination of hydrogeological parameters from pumping of water wells in Alberta
 Determination of hydrogeological parameters from pumping of water wells in Alberta by K.U.Weyer, Ph.D., P.Geol. WDA Consultants Inc. 4827 Vienna Drive N.W. Calgary, Alberta, Canada T3A 0W7 March 2003 2003
Name: Problem 1. (30 points; 5 each)
") 2700 2500 1900 2100 1500 2300 1800 1700 Hydrogeology - HWR/GEOS 431/531 Final exam Dr. Marek Zreda 16 December 1998 11:00-1:00 Open books and notes There are 5 problems on 7 pages. Read entire test before
2700 2500 1900 2100 1500 2300 1800 1700 Hydrogeology - HWR/GEOS 431/531 Final exam Dr. Marek Zreda 16 December 1998 11:00-1:00 Open books and notes There are 5 problems on 7 pages. Read entire test before
DESIGN PARAMETERS FOR MULTI-PHASE EXTRACTION SYSTEMS USING UNSATURATED AND SATURATED SOIL PROPERTIES
 DESIGN PARAMETERS FOR MULTI-PHASE EXTRACTION SYSTEMS USING UNSATURATED AND SATURATED SOIL PROPERTIES Todd White, M.Sc., P.Geol. and Douglas A. Sweeney, M.Sc., P.Eng. SEACOR Environmental Inc. INTRODUCTION
Gravity driven dewatering systems for landfill expansion
 Waste Management and the Environment IV 183 Gravity driven dewatering systems for landfill expansion S. A. Smith. & J. A. Smyth Richardson Smith Gardner and Associates, Inc, USA Abstract A landfill site
Part 1: Steady Radial Flow Questions
 Islamic University of Gaza Water Resources Management EENV 4359 First Semester (2014-2015) Instructors: Dr. Yunes Mogheir Eng. Wael Salem Eng. Israa Abushaban Question 1 (text book) Part 1: Steady Radial
The Islamic University of Gaza Faculty of Engineering Civil Engineering Department Infrastructure Msc.
 The Islamic University of Gaza Faculty of Engineering Civil Engineering Department Infrastructure Msc. Special Topics in Water and Environment - ENGC 6383 Lecture 2 Instructors: Dr. Yunes Mogheir (ymogheir@iugaza.edu.ps)
FIELD TESTING AQUIFERS TO. (Field Follies) James Robinson, Goodwyn, Mills and Cawood, Inc.
 James Robinson, Goodwyn, Mills and Cawood, Inc.") FIELD TESTING AQUIFERS TO ESTIMATE HYDRAULIC PROPERTIES (Field Follies) James Robinson, Goodwyn, Mills and Cawood, Inc. Objectives Estimate t hydraulic coefficients; i Test conceptual models of aquifer;
FIELD TESTING AQUIFERS TO ESTIMATE HYDRAULIC PROPERTIES (Field Follies) James Robinson, Goodwyn, Mills and Cawood, Inc. Objectives Estimate t hydraulic coefficients; i Test conceptual models of aquifer;
Leaky Aquifers. log s drawdown. log time. will the red observation well look more like?.. A infinite aquifer. D none of the above
 Leaky Aquifers b K S s unpumped aquifer b K S s b 1 K 1 S s1 aquitard pumped aquifer previously K was zero (i.e. no leakage) subscript 1 = pumped zone subscript = unpumped aquifer prime = aquitard = pumping
[ ] (6) The tidal correction procedure is repeated for all segments of the tidal and groundwater drawdown record.
![[ ] (6) The tidal correction procedure is repeated for all segments of the tidal and groundwater drawdown record.](/thumbs/85/92772646.jpg "[ ] (6) The tidal correction procedure is repeated for all segments of the tidal and groundwater drawdown record.") (also Table 5-1) to correct each segment of observed groundwater drawdown using the equation: [ ] s' ( τ ) = s( τ) s( 0) E H( 0) 0 H( τ) + s'( 0) (5-15) where s0(τ) = Corrected groundwater drawdown for
(also Table 5-1) to correct each segment of observed groundwater drawdown using the equation: [ ] s' ( τ ) = s( τ) s( 0) E H( 0) 0 H( τ) + s'( 0) (5-15) where s0(τ) = Corrected groundwater drawdown for
Task 4.2 Technical Memorandum on Pumping Impacts on Squaw Creek
 Task 4.2 Technical Memorandum on Pumping Impacts on Squaw Creek Aquifer Test 1 Aquifer Test 2 Prepared for: Squaw Valley Public Service District April 2013 Prepared by: This page left intentionally blank
8. Regional groundwater system
 8. Regional groundwater system 8-1 We have learned basic principles governing the flow and storage of groundwater. We will now use these principles to understand groundwater in the regional context. Flow
Investigation of Possible Extra ~Recharge During Pumping in N ottinghant.aquifer
 nvestigation of Possible Extra ~Recharge During Pumping in N ottinghant.aquifer by Jiu J. Jiaoa Abstract Approaches to investigate possible recharge during a pumping test period are demonstrated by analyzing
Illinois State Water Survey Division
 Illinois State Water Survey Division GROUND-WATER SECTION SWS Contract Report 456 SUMMARY REPORT: REGIONAL ASSESSMENT OF THE GROUND-WATER RESOURCES IN EASTERN KANKAKEE AND NORTHERN IROQUOIS COUNTIES by
About 900 total tests (that we know of)
") A DISTANCE-DRAWDOWN DRAWDOWN ANALYSIS PROCEDURE TO IDENTIFY THE EFFECTS OF BEDDING-PLANE FRACTURES AND IMPROVE THE ESTIMATES OF HYDRAULIC PROPERTIES IN THE PALEOZOIC BEDROCK AQUIFERS OF SOUTHEASTERN MINNESOTA
A DISTANCE-DRAWDOWN DRAWDOWN ANALYSIS PROCEDURE TO IDENTIFY THE EFFECTS OF BEDDING-PLANE FRACTURES AND IMPROVE THE ESTIMATES OF HYDRAULIC PROPERTIES IN THE PALEOZOIC BEDROCK AQUIFERS OF SOUTHEASTERN MINNESOTA
Performance and Analysis of Aquifer Slug Tests and Pumping Tests Policy
 Performance and Analysis of Aquifer Slug Tests and Pumping Tests Policy May 31, 2007 Table of Contents page Introduction... 2 (1) Purpose of policy...2 (2) Basis for technical approach...2 (3) The purpose
FLOW IN POROUS MEDIA LUÍS RIBEIRO INSTITUTO SUPERIOR TECNICO UNIVERSITY OF LISBON
 FLOW IN POROUS MEDIA LUÍS RIBEIRO INSTITUTO SUPERIOR TECNICO UNIVERSITY OF LISBON Where does groundwater flow? How water flows? Groundwater moves from areas of high hydraulic head to areas of low hydraulic
Memorandum. Introduction. Carl Einberger Joe Morrice. Figures 1 through 7
 Memorandum TO: Michelle Halley, NWF DATE: October 9, 2007 FROM: Carl Einberger Joe Morrice PROJ. NO.: 9885.000 CC: Project File PROJ. NAME: National Wildlife Federation ATTACHMENTS: Tables 1 through 6
DYNFLOW accepts various types of boundary conditions on the groundwater flow system including:
 Section 6 Groundwater Flow Model A groundwater flow model was developed to evaluate groundwater flow patterns in the site area and to provide a basis for contaminant transport modeling. 6.1 Model Code
Amah E. A 1, Anam G. S 1 1 Department of Geology, University of Calabar, Calabar, Nigeria
 IOSR Journal of Applied Geology and Geophysics (IOSR-JAGG) e-issn: 2321 0990, p-issn: 2321 0982.Volume 4, Issue 1 Ver. I (Jan. - Feb. 2016), PP 01-08 www.iosrjournals.org Determination of Aquifer Hydraulic
Analysis of the Cromwell, Minnesota Well 4 (593593) Aquifer Test CONDUCTED ON MAY 24, 2017 CONFINED QUATERNARY GLACIAL-FLUVIAL SAND AQUIFER
 Aquifer Test CONDUCTED ON MAY 24, 2017 CONFINED QUATERNARY GLACIAL-FLUVIAL SAND AQUIFER") Analysis of the Cromwell, Minnesota Well 4 (593593) Aquifer Test CONDUCTED ON MAY 24, 2017 CONFINED QUATERNARY GLACIAL-FLUVIAL SAND AQUIFER Analysis of the Cromwell, Minnesota Well 4 (593593) Aquifer Test
Analysis of the Cromwell, Minnesota Well 4 (593593) Aquifer Test CONDUCTED ON MAY 24, 2017 CONFINED QUATERNARY GLACIAL-FLUVIAL SAND AQUIFER Analysis of the Cromwell, Minnesota Well 4 (593593) Aquifer Test
Groundwater Modeling Guidance
 Groundwater Modeling Guidance Richard J. Mandle Groundwater Modeling Program Michigan Department of Environmental Quality Draft 1.0 10/16/02 Executive Summary The use of groundwater models is prevalent
Steady Flow in Confined Aquifer
 Steady Flow in Confined Aquifer If there is steady movement of groundwater in confined aquifer, there will be a linear gradient /slope to the potentiometric surface, whose two directional projection is
Groundwater Occurrence & Movement: An Introductory Discussion with Application to Northeastern Illinois
 Groundwater Occurrence & Movement: An Introductory Discussion with Application to Northeastern Illinois H. Allen Wehrmann, P.E., Director Center for Groundwater Science Illinois State Water Survey April
Evaluation of the Potential for Unreasonable Impacts from the EP Well Field, Hays County, Texas
 February 2018 Evaluation of the Potential for Unreasonable Impacts from the EP Well Field, Hays County, Texas Brian B. Hunt, P.G. Brian A. Smith, Ph.D., P.G. Introduction An application for a permit to
RIDDICK ASSOCIATES, P.C.
 RIDDICK ASSOCIATES, P.C. CIVIL & ENVIRONMENTAL ENGINEERS 139 LAFAYETTE AVENUE SUFFERN, NEW YORK 10901 845 357-7238 FAX 845 357-7267 NORMAN L. LINDSAY DENNIS G. LINDSAY ---------------------------- SEAN
Potential effects evaluation of dewatering an underground mine on surface water and groundwater located in a rural area
 Potential effects evaluation of dewatering an underground mine on surface water and groundwater located in a rural area ITRODUCTIO Michel Mailloux* Eng. M.Sc, Vincent Boisvert, M.Sc, Denis Millette, Eng.,
Numerical Groundwater Flow Model Report. Caloosa Materials, LLC 3323 Gulf City Road Ruskin, Florida 33570
 Numerical Groundwater Flow Model Report Caloosa Materials, LLC 3323 Gulf City Road Ruskin, Florida 33570 GHD 2675 Winkler Ave Suite 180 Fort Myers, FL 33901 11138224 Report July 27, 2017 Table of Contents
groundwater/surface-water interactions Evan Christianson, PG Barr Engineering Company
 groundwater/surface-water interactions Evan Christianson, PG Barr Engineering Company Discussion of. Groundwater/Surface-Water Interactions Groundwater Recharge Impacts from Pumping Potential effect on
Overview. Christopher J. Neville S.S. Papadopulos & Associates, Inc. Last update: April 27, 2017
 Analytical solutions for the preliminary estimation of long-term rates of groundwater inflow into excavations: Long excavations and circular excavations Christopher J. Neville S.S. Papadopulos & Associates,
Movement and Storage of Groundwater The Hydrosphere
 Movement and Storage of Groundwater The Hydrosphere The water on and in Earth s crust makes up the hydrosphere. About 97 percent of the hydrosphere is contained in the oceans. The water contained by landmasses
Module 2. The Science of Surface and Ground Water. Version 2 CE IIT, Kharagpur
 Module 2 The Science of Surface and Ground Water Lesson 7 Well Hydraulics Instructional Objectives At the end of this lesson, the student shall be able to learn the following: 1. The concepts of steady
Groundwater 3/16/2010. GG22A: GEOSPHERE & HYDROSPHERE Hydrology
 GG22A: GEOSPHERE & HYDROSPHERE Hydrology Definitions Groundwater Subsurface water in soil or rock that is fully saturated. Aquifer Contains enough saturated material to yield significant quantities of
16.1 Confined aquifers, unsteady-state flow
 16 Slug tests In a slug test, a small volume (or slug) of water is suddenly removed from a well, after which the rate of rise of the water level in the well is measured. Alternatively, a small slug of
Estimating Streambed and Aquifer Parameters from a Stream/Aquifer Analysis Test
 Hydrology Days 2003, 68-79 Estimating Streambed and Aquifer Parameters from a Stream/Aquifer Analysis Test Garey Fox 1 Ph.D. Candidate, Water Resources, Hydrologic, and Environmental Sciences Division,
PARKER GROUNDWATER w Technology, Innovation, Management
 Hydrogeologic Consulting in Groundwater Resources Technical Memorandum September 16, 2017 To: W.A.T.E.R. & Gateway Neighborhood Association (GNA) From: Timothy K. Parker, PG, CEG, CHG, Parker Groundwater
*** IN THE PUMPING WELL
 Specific Capacity = discharge rate/max drawdown after pumping at a constant, known rate for a time until apparent equilibrium is reached (i.e., minimal change in drawdown with time) Theis et al, 1963 -
Karst Spring: Generalized Monitoring Strategy
 General Hydrologic Characteristics of Karst Springs Karst spring means a location of concentrated groundwater discharge from conduits in bedrock (predominantly solution enhanced conduits or zones in carbonate
22 Tubewell Drainage Systems
 22 Tubewell Drainage Systems WK Boehmer' and J Boonstra2 221 Introduction ' Tubewell drainage is a technique of controlling the watertable and salinity in agricultural areas It consists of pumping, from
T E C H N I C A L M E M O R A N D U M
 INTERA Incorporated 9600 Great Hills Trail, Suite 300W Austin, Texas, USA 78759 512.425.2000 T E C H N I C A L M E M O R A N D U M To: From: Barton Springs/Edwards Aquifer Conservation District Wade Oliver,
Introduction. Geology and Hydrogeology of the Lynden Area TECHNICAL MEMORANDUM
 TECHNICAL MEMORANDUM Date: June 18, 2008 To: Chris Shrive, City of Hamilton Copies: Gary Scott, GENIVAR From: Alicia Fraser, GENIVAR Project No.: 6333 Subject: Introduction A detailed review of available
Hydrogeology 101 3/7/2011
 Hydrogeology 101 W. Richard Laton, Ph.D., PG, CPG Associate Professor of Hydrogeology California State University, Fullerton Department of Geological Sciences 1 Hydrogeology 101 The objective is to obtain
Recharge Lake/Wetland: Generalized Monitoring Strategy
 General Hydrologic Characteristics of Recharge Lakes & Wetlands The primary sources of water for recharge lakes and wetlands are direct precipitation and surface runoff. The lake stage of a recharge lake
Wellhead Protection Plan. Part I
 Wellhead Protection Plan Part I Wellhead Protection Area Delineation Drinking Water Supply Management Area Delineation Well and Drinking Water Supply Management Area Vulnerability Assessments For Green
3.2.3 Groundwater Simulation. (1) Purpose
 Purpose") The Study on Water Supply Systems in Mandalay City and in the Central Dry Zone Part II Study for Mandalay City 3.2.3 Groundwater Simulation (1) Purpose Because the Central Dry Zone, Myanmar, including
The Study on Water Supply Systems in Mandalay City and in the Central Dry Zone Part II Study for Mandalay City 3.2.3 Groundwater Simulation (1) Purpose Because the Central Dry Zone, Myanmar, including
Black Butte Copper Project Mine Operating Permit Application (Revision 3) Evaluation of Open Access Ramps and Ventilation Raises in Closure
 Evaluation of Open Access Ramps and Ventilation Raises in Closure") Black Butte Copper Project Mine Operating Permit Application (Revision 3) APPENDIX M-3: Evaluation of Open Access Ramps and Ventilation Raises in Closure Tintina Montana, Inc. July 2017 Hydrometrics, Inc.
Black Butte Copper Project Mine Operating Permit Application (Revision 3) APPENDIX M-3: Evaluation of Open Access Ramps and Ventilation Raises in Closure Tintina Montana, Inc. July 2017 Hydrometrics, Inc.
WaterTech Brent Morin, B.Sc., P.Geol. Waterline Resources Inc.
 WaterTech 2017 Brent Morin, B.Sc., P.Geol. Waterline Resources Inc. Conceptual Hydrogeological Model (CHM) Well Completion Aquifer Testing Data Collection and Preparation Aquifer Test Analysis and Interpretation
RESPONSIBLE PLANNING FOR FUTURE GROUND WATER USE FROM THE GREAT FLATS AQUIFER : TWO CASE STUDIES: THE GEP ENERGY
 RESPONSIBLE PLANNING FOR FUTURE GROUND WATER USE FROM THE GREAT FLATS AQUIFER : TWO CASE STUDIES: THE GEP ENERGY Introduction PROJECT AND THE SI GREEN FUELS BOILER PROJECT Thomas M. Johnson Hydrogeologist,
HYDROLOGIC FACTORS AFFECTING SINKHOLE DEVELOPMENT IN A WELL FIELD IN THE KARST DOUGHERTY PLAIN, SOUTHWEST OF ALBANY, GEORGIA
 HYDROLOGIC FACTORS AFFECTING SINKHOLE DEVELOPMENT IN A WELL FIELD IN THE KARST DOUGHERTY PLAIN, SOUTHWEST OF ALBANY, GEORGIA Debbie Warner Gordon AUTHOR: Hydrologist, U.S. Geological Survey, Georgia Water
1.0 INTRODUCTION. 28 th November Hawke s Bay Project Management Limited 1139 Maraekakaho Road RD5 Hastings, 4175.
 28 th November 2016 Hawke s Bay Project Management Limited 1139 Maraekakaho Road RD5 Hastings, 4175 Attn: John Roil RE: IRONGATE INDUSTRIAL AREA WATER SUPPLY 1.0 INTRODUCTION Industrial development is
ANALYTICAL MODEL FOR SATURATEDlUNSATURATED HYPORHEIC ZONE FLOW DUE TO ALLUVIAL WELL DEPLETIONS. Garey Fox and Deanna Durnford
 Jay 1-3 GROUND WATER/SURFACE WATER INTERACTIONS AWRASUMMER SPECIALTY COIWEXENCE 2002 3 a ~g ~ f2g- ANALYTICAL MODEL FOR SATURATEDlUNSATURATED HYPORHEIC ZONE FLOW DUE TO ALLUVIAL WELL DEPLETIONS Garey Fox
Purpose. Utilize groundwater modeling software to forecast the pumping drawdown in a regional aquifer for public drinking water supply
 MODFLOW Lab 19: Application of a Groundwater Flow Model to a Water Supply Problem An Introduction to MODFLOW and SURFER The problem posed in this lab was reported in Chapter 19 of "A Manual of Instructional
FLOW NETS. 1. Determine the directions of groundwater flow using flow nets.
 9-12 FLOW NETS SUBJECTS: TIME: Science (Physical Science), Social Studies (Economics, Political Science) 1 class period MATERIALS: Copies of background information Student sheets OBJECTIVES The student
STATE UNIVERSITY OF NEW YORK COLLEGE OF TECHNOLOGY CANTON, NEW YORK
 STATE UNIVERSITY OF NEW YORK COLLEGE OF TECHNOLOGY CANTON, NEW YORK COURSE OUTLINE CONS 385 Hydrology and Hydrogeology Prepared By: Adrienne C. Rygel, Ph.D. CANINO SCHOOL OF ENGINEERING TECHNOLOGY Department
To construct or alter a bore
 Resource Consent Application Form 9A To construct or alter a bore For office use only Consent o Job o Important notes for the applicant You must complete this application form 9A and Resource Consent Application
10 Partially-penetrating wells
 10 Partially-penetrating wells Some aquifers are so thick that it is not justified to install a fully penetrating well. Instead, the aquifer has to be pumped by a partially penetrating well. Because partial
Case Study A Comparison of Well Efficiency and Aquifer Test Results Louvered Screen vs. Continuous Wire-Wrapped Screen Big Pine, California
 Case Study A Comparison of Well Efficiency and Aquifer Test Results Louvered Screen vs. Continuous Wire-Wrapped Screen Big Pine, California Executive Summary Aquifer test results demonstrated that the
Office of Land and Water Evaluations of Groundwater Resources of Southern Mississippi
 Office of Land and Water Evaluations of Groundwater Resources of Southern Mississippi Virtually all of the water used for public and domestic drinking water supplies in southern Mississippi is derived
SATEM 2002: Software for Aquifer Test Evaluation
 SATEM 2002: Software for Aquifer Test Evaluation ILRI publication 57 SATEM 2002: Software for Aquifer Test Evaluation J. Boonstra R.A.L. Kselik International Institute for Land Reclamation and Improvement/ILRI
Hydrogeologic Characterization. Thomas Doe Winter 2009
 Hydrogeologic Characterization Thomas Doe Winter 2009 What You Need to Know from Previous Lecture Hydrologic Cycle Vadose Zone Specific Yield Capillary pressure Groundwater Flow Systems Confined versus
Groundwater Occurrence & Movement:
 Groundwater Occurrence & Movement: An Introductory Discussion with Application to East-Central Illinois East-Central Illinois Regional Water Supply Planning Committee July 27, 2007 Allen Wehrmann, P.E.,
Chino Basin Optimum Basin Management Program. Management Zone 1 Subsidence Management Plan. October 2007
 Chino Basin Optimum Basin Management Program Management Zone 1 Subsidence Management Plan 9641 San Bernardino Road Rancho Cucamonga, CA 91730 Tel: 909.484.3888 Fax: 949.484.3890 www.cbwm.org OPTIMUM BASIN
NOTE ON WELL SITING AT CORNER OF CASTLE VALLEY DRIVE AND SHAFER LANE FOR TOWN OF CASTLE VALLEY, GRAND COUNTY, UTAH
 NOTE ON WELL SITING AT CORNER OF CASTLE VALLEY DRIVE AND SHAFER LANE FOR TOWN OF CASTLE VALLEY, GRAND COUNTY, UTAH Authors: Dr. Kenneth E. Kolm, Hydrologic Systems Analysis, LLC., Golden, Colorado and
GROUNDWATER AVAILABILITY MODELING OF THE WEST NISHNABOTNA AQUIFER IN IOWA. Iowa Geological Survey Water Resource Investigation Report 3
 GROUNDWATER AVAILABILITY MODELING OF THE WEST NISHNABOTNA AQUIFER IN IOWA Iowa Geological Survey Water Resource Investigation Report 3 Iowa Department of Natural Resources Patricia L. Boddy, Interim Director
POROSITY, SPECIFIC YIELD & SPECIFIC RETENTION. Physical properties of
 POROSITY, SPECIFIC YIELD & SPECIFIC RETENTION Porosity is the the ratio of the voids to the total volume of an unconsolidated or consolidated material. Physical properties of n = porosity as a decimal
Rudd Westside Winery Pump Test and Well Interference Analysis 4603 Westside Road, Healdsburg
 Rudd Westside Winery Pump Test and Well Interference Analysis 4603 Westside Road, Healdsburg APN 110-110-026 PRMD File Number 14-0031 Submitted to: Misti Harris, Project Planner Sonoma County Permit and
Depressurization Systems: Design, Construction, and Cost Considerations to Prevent Floor Heave
 MWA 1995 WATER RESOURCES AT RSK May 14-18, 1995 Denver American nstitute of Hydrology nternational Mine Water Association Depressurization Systems: Design, Construction, and Cost Considerations to Prevent
Hydrogeology Laboratory Semester Project: Hydrogeologic Assessment for CenTex Water Supply, Inc.
 Hydrogeology Laboratory Semester Project: Hydrogeologic Assessment for CenTex Water Supply, Inc. Matthew M. Uliana, Ph.D. Department of Biology Geology Program and Aquatic Resources Texas State University
HYDROGEOLOGY OF THE HUMBOLDT RIVER BASIN, IMPACTS OF OPEN-PIT MINE DEWATERING AND PIT LAKE FORMATION
 HYDROGEOLOGY OF THE HUMBOLDT RIVER BASIN, IMPACTS OF OPEN-PIT MINE DEWATERING AND PIT LAKE FORMATION June, 2015 Tom Myers, Ph.D., Hydrologic Consultant, Reno NV tom_myers@charter.net Prepared for: Progressive
2.0 REGULATORY AND ENVIRONMENTAL ASSESSMENTS
 2.0 REGULATORY AND ENVIRONMENTAL ASSESSMENTS Regional Solid Waste Master Plan The City of Sioux Falls is committed to complying with all regulatory requirements for the design, construction, and operation
Aquifer Test Evaluation Conducted on the Middle Gravel Unit of the TABLE Alluvial OF CONTENTS Aquifer in Upper Metro Storm Drain Area, Butte, MT.
 Aquifer Test Evaluation Conducted on the Middle Gravel Unit of the TABLE Alluvial OF CONTENTS Aquifer in Upper Metro Storm Drain Area, Butte, MT. Drill cuttings of the middle gravel unit of the alluvial
FAX
 21335 Signal Hill Plaza Suite 100 Sterling, Virginia 20164 www.geotransinc.com 703-444-7000 FAX 703-444-1685 Mr. William Kutash Florida Department of Environmental Protection Waste Management Division
Hydrogeology and Simulation of Ground- Water Flow in a Glacial-Aquifer System at Cortland County, New York
 In Cooperation with Cortland County Soil and Water Conservation District Hydrogeology and Simulation of Ground- Water Flow in a Glacial-Aquifer System at Cortland County, New York The City of Cortland
MEMORANDUM. Kathy Yager USEPA OSRTI Dick Goehlert USEPA Region 1 Darryl Luce USEPA Region 1 Mindy Vanderford, GSI Environmental, Inc.
 MEMORANDUM To: From: Kathy Yager USEPA OSRTI Dick Goehlert USEPA Region 1 Darryl Luce USEPA Region 1 Mindy Vanderford, GSI Environmental, Inc. (GSI) Doug Sutton, GeoTrans, Inc. Rob Greenwald, GeoTrans,
Feasibility Study for Groundwater Availability for Spring Creek Creation at Squalicum Creek Park
 Feasibility Study for Groundwater Availability for Spring Creek Creation at Squalicum Creek Park Prepared for: City of Bellingham Public Works Department Environmental Resource Division 210 Lottie St.
Groundwater Earth 9th Edition Chapter 17 Mass wasting: summary in haiku form Importance of groundwater Importance of groundwater
 1 2 3 4 5 6 7 8 9 10 11 Groundwater Earth 9 th Edition Chapter 17 Geology 100 Mass wasting: summary in haiku form The grass is greener over the septic system said Erma Bombeck. Importance of groundwater
Modeling with MLU. applying the multilayer approach to aquifer test analysis. Tutorial. Kick Hemker & Jeff Randall. Amsterdam Seattle 1
 Modeling with MLU applying the multilayer approach to aquifer test analysis Tutorial Kick Hemker & Jeff Randall Amsterdam Seattle 1 CONTENTS 1. Introduction.......................................................
DRAFT. APPENDIX F Groundwater Flow Model Proposed El Segundo Desalination Facility
 APPENDIX F Proposed El Segundo Desalination Facility Proposed El Segundo Desalination Facility 1. GROUNDWATER FLOW MODEL Based on review of offshore and onshore hydrogeologic data including the Summer
APPENDIX 5: SAMPLE MODEL RESULTS
 APPENDIX 5: SAMPLE MODEL RESULTS A. Evaluation of Groundwater Sustainability in the Ramsey Area B. Evaluation of Groundwater Sustainability in the Woodbury Area C. Evaluation of Future Drawdown Conditions
Index Well Program Update
 Index Well Program Update Kansas Water Office March 3, 2009 Geohydrology Section Kansas Geological Survey The index well program was developed to support delineation and enhanced management of aquifer
Lecture 21: Groundwater: Hydraulic Conductivity
 Lecture 21: Groundwater: Hydraulic Conductivity Key Questions 1. What causes groundwater to move? 2. What is the hydraulic conductivity? 3. What is Darcy s Law? 4. How is groundwater velocity estimated?
A Hydrologic Study of the North Hills, Helena, Montana
 A Hydrologic Study of the North Hills, Helena, Montana Andrew Bobst, Kirk Waren, James Swierc, and Jane Madison MBMG Groundwater Investigations Program 10/6/11 MT AWRA Background Groundwater Steering Committee