Kitimat Airshed Emissions Effects Assessment and CALPUFF Modelling
|
|
|
- Rosanna Copeland
- 6 years ago
- Views:
Transcription

1 Kitimat Airshed Emissions Effects Assessment and CALPUFF Modelling EMA of BC - May 2016 Session - Regional Air Topics Anna Henolson
2 Topics to Cover What is Air Dispersion Modelling? Types of Models CALPUFF Overview Kitimat Emissions Effects Assessment Example CALPUFF Concentration Results CALPUFF Deposition Results Translating lessons learned to permit modelling
3 What is Modeling? Modeling - a definition Modeling is the combined mathematical simulation of atmospheric processes which gives a convenient and physically meaningful way of relating sources/emissions to ambient air impacts
4
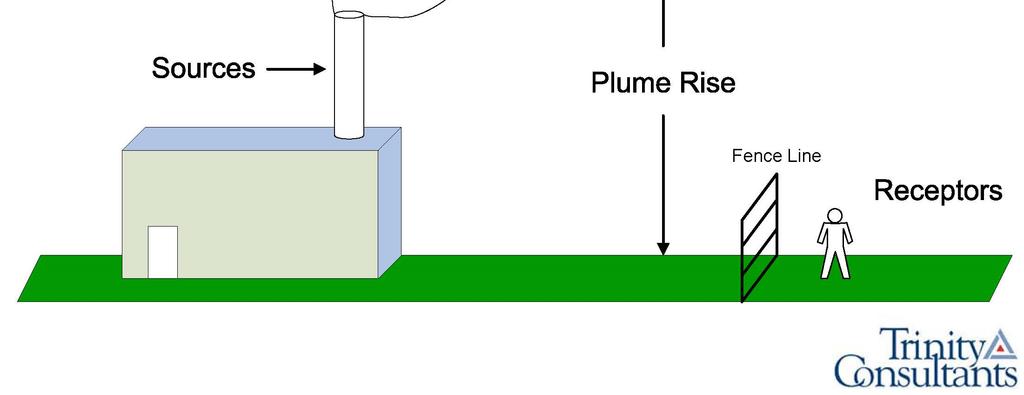
5 Structure of a Dispersion Model For Each Source Physical Height Pollutant Emission Rate Coordinates Stack Diameter Stack Gas Velocity Stack Gas Temperature Building Dimensions Used to Characterize Wake Effects Meteorology Stability Wind Direction Wind Speed Mixing Height Ambient Temperature For Each Receptor Coordinates Ground level Elevation Height Above Ground Simulation of Atmospheric Physics Adapted from Turner, 1994 Estimates of Air Pollutant Concentrations at Receptors
6 Dispersion Models SCREEN Models SCREEN3, AERSCREEN, CALPUFF Screen Models that give worst-case first-cut concentration. Refined Models ISC / AERMOD (<50 km) CALPUFF (>50 km and complex winds) Special Case Models CMAQ Community Mulitscale Air Quality (ozone) CAMx Comprehensive Air quality Model with extensions (ozone) CTDM Complex Terrain Dispersion Model RPM Reactive Plume Model SDM shoreline fumigation DEGADIS dense gas model
7 ISC / AERMOD vs CALPUFF Models (Steady State Plume vs Puff) Steady State Plume Model Plume Dispersion Local Winds Hour 1 Hour 2 Hour 3 Non-Steady State Puff Model Plume Dispersion Hour 1 Hour 4 Hour 2 Hour 2 Hour 3 Source Hour 3 Hour 1 Hour 4 Source Hour 4
8 CALPUFF used for Kitimat Emissions Effect Assessment Because: Complex Terrain Stagnation Conditions Long-range transport Deposition Buoyant Line Source (KMP aluminum smelter potlines)
 was simulated (highest S")
9 CALPUFF Modelling System BC MOE Guidance US Federal Guidance (EPA, FLAG, IWAQM) Meteorological, terrain, land use data Ambient chemistry, emission source data, receptor data Background concentrations, Humidity, Extinction efficiencies CALMET CALPUFF CALPOST Only one meteorological year (2008) was simulated (highest S deposition)

10 CALPUFF Chemical Transformation and Deposition Mechanisms
11 Chemical Transformation: MESOPUFF II Scheme Simulates the conversion of SO 2 SO 4 NO X HNO 3 : NO 3 Conversion of both is dependant on Relative Humidity, Background ozone, and Background ammonia Does not include aqueous phase transformation Does not treat NO and NO 2 separately (assumes immediate conversion to NO 2 )
12 Ozone and NH 3 Data Background concentrations affect chemical transformation of primary into secondary pollutants SO 2 (g) cloud droplets photochemical oxidants SO 4 (s) NO (g) NO 2 (g) photochemical oxidants HNO 3 NH 3 NO 3 (s) Data options Constant background based on land use type Monitored background (rural only?) Photochemical model output Data used: 80 ppb constant ozone (default) 0.5 ppb constant ammonia (forest landuse)
13 Deposition Mechanisms Dry Deposition Resistance deposition model. For gases (SO 2 ) applies: Pollutant diffusivity (cm/s) Aqueous phase dissociation constant, α* Pollutant reactivity Mesophyll resistance, rm (s/cm) Henry's Law coefficient, H (dimensionless) For particles (SO 4 ), applies: Diameter mean and Standard Deviation Wet Deposition Scavenging Coefficients Liquid: 3.0E-5 for SO E-5 for SO 4 Frozen: 0.0 for SO 2 3.0E-5 for SO 4
14 Kitimat Airshed Effects Assessment Example

15 Study Area 15

16 Stationary Emission Sources Assessed 16

17 Marine Transport Model Sources
18 Risk Framework Low No, or negligible, impact Moderate Impact expected, but of a magnitude, frequency, or spatial extent, or in locations, considered to be acceptable* High Impact of a magnitude, frequency or spatial extent, or in locations, considered to be not acceptable*; further investigation needed of assessment assumptions to determine if reducing uncertainties / refining inputs lowers impact category Critical Impact of a magnitude, frequency or spatial extent, or in locations, considered to be extremely unacceptable*; further investigation could be made into assumptions (as above) but unlikely to reduce impact sufficiently to be considered acceptable. * acceptability, based on QP s best professional judgement and on conventions followed elsewhere. Acceptability depends on values, and is ultimately a policy decision informed by this assessment. 18
19 Study Design Emissions and Atmospheric Pathways Sources Pathway Receptor Assessment Approach Aluminum Smelter LNG Terminals Oil Refinery Crude Oil Export Facility Gas Turbine Powered Electrical Generating Facilities Rail, Marine Transport Direct exposure to SO 2 and NO 2 in the air Indirect, through S and N deposition Human health Vegetation Soils Lakes Comparison of predicted contaminant concentrations to thresholds across scenarios Comparison of exceedance of critical loads across scenarios Literature search for health effects and impact thresholds; compare with dispersion model results for threshold exceedance; classify risk Literature search for plant damage thresholds; compare with dispersion model results for threshold exceedance; classify risk SSMB and N mass balance models; outputs used to map critical loads of nutrient N and acidification; compare with modeled deposition for CL exceedance; classify risk SSWC and FAB models; outputs used to map critical loads of acidification; compare with modeled deposition for CL exceedance; classify risk 19
20 Scenarios Scenario A_28.2 Smelter Full Treatment SO 2 NO X LNG SO 2 NO X Refinery SO 2 NO X Shipping SO 2 NO X SO 2 NO X Total Total t/d t/d t/d t/d t/d t/d t/d t/d t/d t/d All Electric Drive Off Smelter +LNG B_51.8 C_57.5 Partial Treatment Partial Treatment Base Case NO X treatment Mixed 60/ Off Smelter +LNG Off Smelter +LNG D_61.8 Partial Treatment Base Case Off Smelter +LNG E_66.1 Base Case Base Case NO X treatment F_72.6 Base Case Base Case NO X treatment Off Smelter +LNG On Smelter +LNG + Refinery G_76.2 Base Case Base Case Off Smelter +LNG H_82.6 Base Case Base Case On Smelter +LNG + Refinery
21 BC Hydro Scenarios Scenario Smelter, LNG, Refinery and Shipping SO 2 NO X BC Hydro SO 2 NO X SO 2 Total Total NO X t/d t/d t/d t/d t/d t/d Is_83.3 As for Scenario H_ Skeena 3.84E Im_83.3 As for Scenario H_ Minette 3.84E
22 SO 2 and NO x Emissions for each Source and Scenario 60 SO SO SO SO 2 SO BC Hydro Shipping 50 Kitimat Clean Refinery Triton KM LNG 40 SO 2 SO 2 SO Douglas Channel LNG Canada SO 2 and NO x Emissions (tpd) SO NO x 11.9 NO x 13.2 NO x 19.4 NO x 23.2 NO x 13.2 NO x 16.8 NO x 23.2 NOx 26.8 NO x 27.5 RTA BC Hydro Shipping Kitimat Clean Refinery Triton KM LNG Douglas Channel LNG Canada RTA 10 Series7 Series18 0 A_28.2 B_51.8 C_57.5 D_61.8 E_66.1 F_72.6 G_76.2 H_82.6 I_
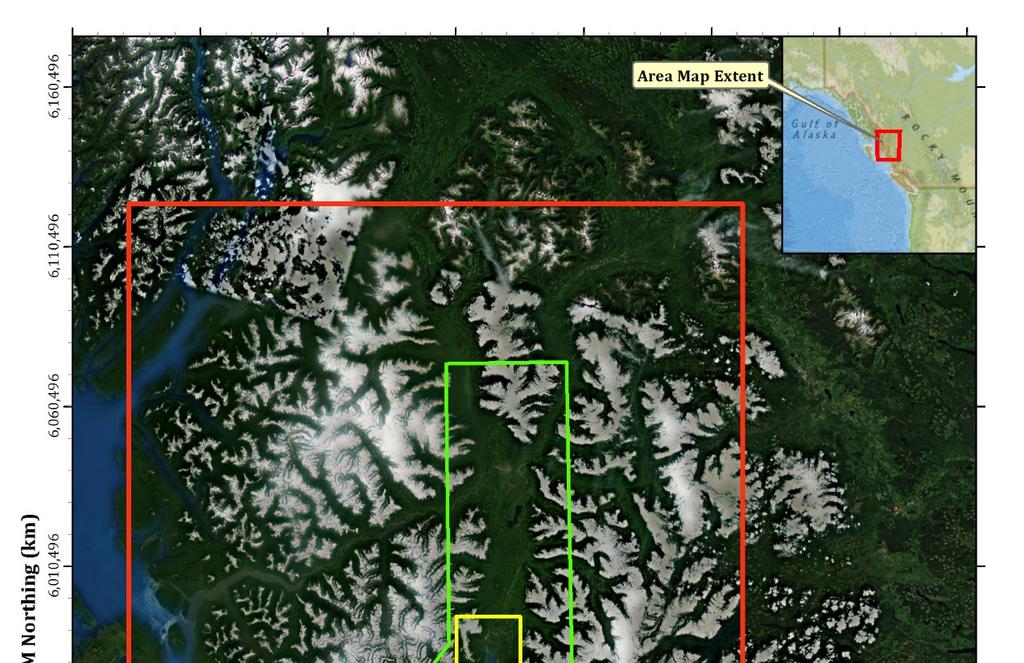
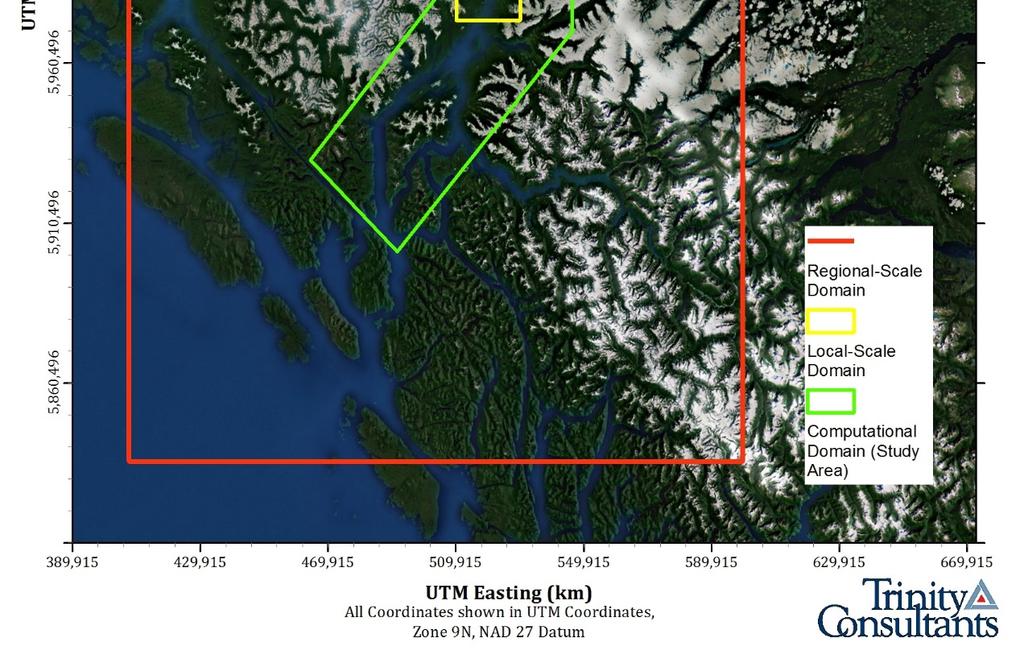
23 Meteorological and Computational Modeling Domains
 Green =residential")
24 Residential and Individual Receptors in Near Grid Red = All individual receptors (soils, lakes, and points of interest) Green =residential receptors
 Green =residential receptors Blue = grid")
25 Receptors within Study Area Red = All individual receptors (soils, lakes, and points of interest) Green =residential receptors Blue = grid receptors
26 Emission Source Data Basis & Uncertainty Smelter (RTA): Directly from proponent, final design Kitimat LNG: Directly from proponent, preliminary/intermediate design phase LNG Canada: Directly from proponent with exception of layout (based on Kitimat LNG), preliminary/intermediate design phase Douglas Channel: Directly from proponent, preliminary design phase Triton: Estimated based on Douglas Channel and Kitimat LNG Refinery: Directly from proponent, preliminary design phase Shipping: Calculated by Trinity based on emission factors provided by BCMOE and U.S. EPA calculation procedures BC Hydro: Emission rates provided directly by BC Hydro, stack parameters estimated based on similar facility Uncertainty Legend Dark green = very low Light green = low Light orange = low/moderate Dark orange = moderate Red = high
27 Key Emission Source Data Assumptions Model assumes 24-7 operation at full capacity No buildings included for all sources other than RTA Sulphur content of feed gas can greatly affect SO 2 emission rates Stack parameters based on preliminary estimates for all preliminary/intermediate design
28 Model Results Processing NO 2 /NO x Ratio Modelled NO x concentrations scaled based on US EPA guidance: Assume 80% of NO x is NO 2, for short term averaging periods (1 hour) Assume 75% of NO x is NO 2, for long term averaging periods (annual)
29 Model Results Scenario A to H, NO x Comparison Rio Tinto Alcan Full Treatment (1.0 tpd) Liquefied Natural Gas Facilities All Electric (3.2 tpd) No Refinery (0 tpd) Shipping (7.8 tpd) Rio Tinto Alcan Base Case (1.0 tpd) Liquefied Natural Gas Facilities Base Case (14.5 tpd) Refinery Included (1.1 tpd) Shipping (10.2 tpd)


30 98th Percentile 1 hour NO2 Concentration Scenario A_28.2 vs Scenario H_82.6
31
32 Scenario A to H, SO 2 Comparison Rio Tinto Alcan Full Treatment (6.5 tpd) Liquefied Natural Gas Facilities All Electric (9.6 tpd) No Refinery (0 tpd) Shipping (0.2 tpd) Rio Tinto Alcan Base Case (41.8 tpd) Liquefied Natural Gas Facilities Base Case (10.8 tpd) Refinery Included (2.9 tpd) Shipping (0.3 tpd) Scenario SO2 concentrations: [A] < [B C D] < [E F G H I]


33 99th Percentile 1 hour SO2 Concentration Scenario A_28.2 vs Scenario H_82.6 A H


34 A H Highest deposition levels are N of Kitimat and S of Lakelse Lake


35 BC Hydro Siting Exercise with SCR Skeena vs Minette [Increase in NO2] Smaller increase with Skeena
36 Translating lessons learned to permit modelling
37 Model Results Overall changes to emissions linear changes to modelled concentrations/deposition rates Particularly true for 1-hour Need to look at contribution Focus on highest contributing sources Also review assumptions NO to NO 2 conversion Sulphur content in fuel or feed
38 Overcoming Challenges for 1-hr SO 2 & NO 2 Evaluate costs of modeling improvements For example, new stack/ht change, necking stack, emissions controls, multiple scenario modeling, fenceline, property purchase For NO 2, implement NO to NO 2 Conversion Nov update to BC AQ Modelling Guideline included specific techniques: 100% conversion. If there are exceedances, use one of three methods described next. If there are adequate (at least one year) hourly NO and NO2 monitoring data, use the ambient ratio method. If adequate monitoring data are not available, use the ozone limited method. If AERMOD is used, apply the plume volume molar ratio method.
39 Overcoming Challenges for 1-hr SO 2 & NO 2 Focus on review on handful of exceeding receptors Build relationship with agency meteorologist modeller Helpful in getting the benefit of the doubt regarding the many gray areas in modeling Can provide helpful suggestions Investigate pairing modeled concentrations & background in time Consider operational and scheduling limitations Highest 1-hour concentration often occur at night

40 Questions Anna Henolson
Modeling 101: Intro to Dispersion Modeling Programs and Process
 1 Modeling 101: Intro to Dispersion Modeling Programs and Process Carolinas Air Pollution Control Association Presentation by: Pilar Johansson Trinity Consultants 2 Presentation Outline When are Models
Changes to Federal Ambient Air Quality Standards and the Affect on Industry in BC
 Changes to Federal Ambient Air Quality Standards and the Affect on Industry in BC EMA of BC - 2017 Workshop February 16, 2017 Anna Henolson Outline Background New SO2 CAAQS CAAQS Implementation in British
Comparison of Features and Data Requirements among the CALPUFF, AERMOD, and ADMS Models
 Comparison of Features and Data Requirements among the CALPUFF, AERMOD, and ADMS Models Prepared By: Russell F. Lee BREEZE SOFTWARE 12700 Park Central Drive Suite 2100 Dallas, TX 75251 +1 (972) 661-8881
APPENDIX H AIR DISPERSION MODELLING REPORT BY PROJECT MANAGEMENT LTD. (REF. CHAPTER 11 AIR QUALITY AND CLIMATIC FACTORS)
") 101050.22.RP.0001 A Environmental Impact Statement 15 th April 2005 APPENDIX H AIR DISPERSION MODELLING REPORT BY PROJECT MANAGEMENT LTD. (REF. CHAPTER 11 AIR QUALITY AND CLIMATIC FACTORS) S:\Projects\190900\101050
101050.22.RP.0001 A Environmental Impact Statement 15 th April 2005 APPENDIX H AIR DISPERSION MODELLING REPORT BY PROJECT MANAGEMENT LTD. (REF. CHAPTER 11 AIR QUALITY AND CLIMATIC FACTORS) S:\Projects\190900\101050
Significance of a CALPUFF Near-Field Analysis
 Significance of a CALPUFF Near-Field Analysis Paper #70052 Authors: Elizabeth A. H. Carper Trinity Consultants 20819 72 nd Avenue South, Suite 610 Kent, WA 98032 Eri Ottersburg Trinity Consultants 20819
Evaluation of a New Screening Technique for Regional Haze Impacts Using Standard AERMOD Output
 Evaluation of a New Screening Technique for Regional Haze Impacts Using Standard AERMOD Output Bret Anderson, US Forest Service Jason Reed, SLR International Corporation James Zapert, Carter Lake Consulting
Atmospheric Dispersion Modelling for Odour Impact: Practices, Issues & Recommendations
 Atmospheric Dispersion Modelling for Odour Impact: Practices, Issues & Recommendations Chris Scullion, Managing Consultant September 14-15, 2015 Toronto, ON trinityconsultants.com Odour Dispersion Modelling
Introduction to Air Quality Models
 Introduction to Air Quality Models Emission Model Meteorological Model Temporal and spatial emission rates Topography Chemical Transformation Pollutant Transport Equilibrium between Particles and gases
Update on FLAG. Bret Anderson. USDA Forest Service Air Resource Management Program Fort Collins, CO
 Update on FLAG Bret Anderson USDA Forest Service Air Resource Management Program Fort Collins, CO AWMA Modeling Conference April 12, 2016 Disclaimer The following presentation represents the current views
Modeling For Managers. aq-ppt5-11
 Modeling For Managers aq-ppt5-11 Types of Models Near-field *Preferred: EPA AERMOD model 50km CLASS II; Increment Far-field CALPUFF 50km 100+km CLASS I; Chemical Transformation What is used at MPCA History
5.3.1 Air Dispersion and Emission Modeling
 5.3.1 Air Dispersion and Emission Modeling The models that simulate the transport and dispersion of air contaminants from the point of release to potential receptors use known data on the characteristics
75th Air Base Wing. Comparison of CALPUFF and OBODM for Open Burn/Open Detonation Modeling. 22 May Mark Bennett, Ph.D.
 75th Air Base Wing Comparison of CALPUFF and OBODM for Open Burn/Open Detonation Modeling 22 May 2007 Mark Bennett, Ph.D. CH2M Hill, Inc Joint Services Environmental Management Conference and Exposition
AIR DISPERSION MODELLING IN COASTAL AREAS WITH ROUGH TERRAIN, USING CALPUFF PRIME
 AIR DISPERSION MODELLING IN COASTAL AREAS WITH ROUGH TERRAIN, USING CALPUFF PRIME Marcia C. Parsons, Fracflow Consultants Inc., 154 Major s Path, St. John s, NL, Canada, A1A 5A1, Faisal Khan, Memorial
Comparison of Two Dispersion Models: A Bulk Petroleum Storage Terminal Case Study
 Comparison of Two Dispersion Models: A Bulk Petroleum Storage Terminal Case Study Prepared By: Anthony J. Schroeder BREEZE SOFTWARE 12770 Merit Drive Suite 900 Dallas, TX 75251 +1 (972) 661-8881 breeze-software.com
DET NORSKE VERITAS. Report for Deposition and Soil Transport Modelling of Components from postcombustion amine-based CO 2 capture
 Report for Deposition and Soil Transport Modelling of Components from postcombustion amine-based CO 2 Gassnova SF Frame Agreement No. 257430114 Contract No. 257430173 E-Room No. FM07-AQZ00-S-RA-0005, Rev
Dodge Cove Improvement District comment on Aurora Application Calculation of NO2 concentrations over residential areas
 Dodge Cove Improvement District comment on Aurora Application Calculation of NO2 concentrations over residential areas We are concerned that Aurora underestimated NO2 concentrations over Dodge Cove in
Evaluation of Options for Addressing Secondary PM 2.5 and Ozone Formation. Bruce Macdonald, PhD Jason Reed, CCM
 Evaluation of Options for Addressing Secondary PM 2.5 and Ozone Formation Bruce Macdonald, PhD Jason Reed, CCM 1 Overview Timeline and reasoning Regulatory drivers in the U.S. Emerging approaches Qualitative
Pathways to Refining. Exposure Analysis:
 environmental failure analysis & prevention health technology development Exposure Analysis: Pathways to Refining Regulatory Risk Assessments Rick Reiss Exponent November 4, 2009 A leading engineering
AIR DISPERSION MODELING
 Click to edit Master title style AIR DISPERSION MODELING Use of AERMOD for NAAQS Area Designations and State Implementation Plan Submittals SPEAKER Stewart McCollam DATE February 10, 2016 USE OF AERMOD
NORTH CAROLINA PSD MODELING GUIDANCE
 NORTH CAROLINA PSD MODELING GUIDANCE January 6, 2012 NORTH CAROLINA DEPARTMENT OF ENVIRONMENT AND NATURAL RESOURCES DIVISION OF AIR QUALITY PERMITTING SECTION AIR QUALITY ANALYSIS BRANCH Introduction TABLE
Nitrogen and Sulfur Deposition Modeling for ROMANS with CAMx
 Nitrogen and Sulfur Deposition Modeling for ROMANS with CAMx Mike Barna 1, Marco Rodriguez 2, Kristi Gebhart 1, John Vimont 1, Bret Schichtel 1 and Bill Malm 1 1 National Park Service - Air Resources Division
Regional Photochemical Modeling - Obstacles and Challenges. Extended Abstract No Prepared By:
 Regional Photochemical Modeling - Obstacles and Challenges Extended Abstract No. 33594 Prepared By: Christine L Haman, PhD Consultant Abhishek S Bhat, PhD Senior Consultant Tiffany L Gardner BREEZE Product
Review of GHD s Modeling Assessment and Analysis of the Coal-fired Power Stations in the Latrobe Valley. Dr. H. Andrew Gray Gray Sky Solutions
 Review of GHD s Modeling Assessment and Analysis of the Coal-fired Power Stations in the Latrobe Valley Dr. H. Andrew Gray Gray Sky Solutions September 19, 2018 1 Introduction My name is Dr. H. Andrew
Single-Source Impacts on Secondary PM 2.5 Formation A Case Study
 Single-Source Impacts on Secondary PM 2.5 Formation A Case Study Midwest Environmental Compliance Conference Joe Stolle, PE, Senior Environmental Engineer Wendy Vit, PE, Senior Environmental Engineer May
National Ambient Air Quality Standards
 Modeling Issues with the New National Ambient Air Quality Standards James Red Oris Solutions / BEE-Line Software Presented to North Texas Chapter of the Air & Waste Management Association August 24, 2010
Present time air dispersion model results ARPAV, IDAEA, AirPACA, UNIGE, AUTH
 Present time air dispersion model results ARPAV, IDAEA, AirPACA, UNIGE, AUTH Federico Cassola - UNIGE Mitigating Air Pollution in the Mediterranean Port Cities The results of CAIMANs Project Venice, 12th
Oklahoma Department of Environmental Quality Air Quality Division
 Oklahoma Department of Environmental Quality Air Quality Division BART Application Analysis January 19, 2010 COMPANY: FACILITY: FACILITY LOCATION: TYPE OF OPERATION: Units REVIEWER: AEP- Public Service
Evaluation of LRT Models to Estimate Single Source Impacts on Secondary Pollutants as Part of the IWAQM Phase 3 Process
 Evaluation of LRT Models to Estimate Single Source Impacts on Secondary Pollutants as Part of the IWAQM Phase 3 Process Bret A. Anderson USDA Forest Service Air Resource Management Program Fort Collins,
FLAG, Flaws, Potential Improvements and Revisions. John Vimont National Park Service Air Resources Division
 FLAG, Flaws, Potential Improvements and Revisions John Vimont National Park Service Air Resources Division Disclaimer The following presentation represents the current views and ideas of the federal land
Air pollution modeling of the industrial complexes and cities in the Kurdistan region using AERMOD view
 First International Symposium on Urban Development: Koya as a Case Study 333 Air pollution modeling of the industrial complexes and cities in the Kurdistan region using AERMOD view H. Moradi 1,2, M. Rouhi
O3/PM2.5/Regional Haze Modeling Guidance Summary. Brian Timin EPA/OAQPS Western Met, Emissions, and AQ Modeling Workshop June 22, 2011
 O3/PM2.5/Regional Haze Modeling Guidance Summary Brian Timin EPA/OAQPS Western Met, Emissions, and AQ Modeling Workshop June 22, 2011 1 Ozone/PM2.5/Regional Haze Modeling Guidance Guidance on the use of
Overview of Appendix W Changes
 Overview of Appendix W Changes ERM Webinar January 10, 2017 Insert then choose Picture select your picture. Right click your picture and Send to back. Copyright 2015 by ERM Worldwide Limited and/or its
Molar Ratio Method (PVMRM) and Ozone Limiting Method (OLM) for Predicting Short-term NO 2 Impacts
 and Ozone Limiting Method (OLM) for Predicting Short-term NO 2 Impacts") Review of Plume Volume Molar Ratio Method (PVMRM) and Ozone Limiting Method (OLM) for Predicting Short-term NO 2 Impacts Elizabeth Hendrick, CCM Vincent Tino, CCM Dr. Bruce Egan, CCM Dr. Steven Hanna,
Review of Plume Volume Molar Ratio Method (PVMRM) and Ozone Limiting Method (OLM) for Predicting Short-term NO 2 Impacts Elizabeth Hendrick, CCM Vincent Tino, CCM Dr. Bruce Egan, CCM Dr. Steven Hanna,
2016 Midwest and Central States Air Quality Workshop. Air Quality Modeling in the GOMR Study. June 2016
 2016 Midwest and Central States Air Quality Workshop Air Quality Modeling in the GOMR Study June 2016 Holli Ensz Physical Scientist Holli.Ensz@boem.gov BOEM vs. USEPA GOMR Jurisdiction Map Purposes: A.
Air Dispersion Modelling Guideline for Ontario
 Air Dispersion Modelling Guideline for Ontario A Proposal for Consultation Air Dispersion Models and technical information relating to Ontario Regulation 346 (under the Environmental Protection Act) as
Application of the AERMOD modeling system for air pollution dispersion in the South Pars oilfield
 First International Symposium on Urban Development: Koya as a Case Study 339 Application of the AERMOD modeling system for air pollution dispersion in the South Pars oilfield 1,2 1,2 3 M. Rouhi, H. Moradi
Planning or Diagnostic Tool. Air Plume Modeling. Michael Gemelli, Lockheed-Martin/REAC, Edison, NJ. Keith Ocheski, Lockheed-Martin/REAC, Edison, NJ
 Air Plume Modeling Planning or Diagnostic Tool Rod Turpin, US EPA-ERT, Edison, NJ Greg De Angelis, US EPA Region II, Edison, NJ Paul Groulx, US EPA Region I, Boston, MA And Keith Ocheski, Lockheed-Martin/REAC,
AERMOD Modeling of PM2.5 Impacts of the Proposed Highwood Generating Station
 AERMOD Modeling of PM2.5 Impacts of the Proposed Highwood Generating Station September 10, 2007 Prepared for Montana Environmental Information Center and Citizens for Clean Energy Prepared by Khanh T.
Air Quality Assessment of the Canadian Pulp and Paper Industry. Gregory Crooks, M.Eng., P.Eng. July 14, 2009
 Air Quality Assessment of the Canadian Pulp and Paper Industry Gregory Crooks, M.Eng., P.Eng. July 14, 2009 Study Overview Health Canada is currently conducting a study of the effects on human health of
Key-Words: - Dispersion models, Meteorological models, Industrial source, CALPUFF, RAMS, PM 10, SO x, NO x.
 An application of the RAMS-CALMET-CALPUFF modelling system to assess the long-term contribution to atmospheric pollution from a large industrial source in Tuscany F. CALASTRINI, C. BUSILLO, G. GUALTIERI
2nd International Conference on WASTE MANAGEMENT, WATER POLLUTION, AIR POLLUTION, INDOOR CLIMATE (WWAI'08) Corfu, Greece, October 26-28, 2008
 Corfu, Greece, October 26-28, 2008") An application of the RAMS-CALMET-CALPUFF modelling system to assess the long-term contribution to atmospheric pollution from a large industrial source in Tuscany F. CALASTRINI, C. BUSILLO, G. GUALTIERI
An application of the RAMS-CALMET-CALPUFF modelling system to assess the long-term contribution to atmospheric pollution from a large industrial source in Tuscany F. CALASTRINI, C. BUSILLO, G. GUALTIERI
Clean TeQ Sunrise CCC meeting
 Clean TeQ Sunrise CCC meeting 15 February 2018 AGENDA General update Modification 4 Overview / update Transport assessment Clean TeQ s submission Modification 6 Working with and investing in our community
Sulphur Dioxide Environmental Effects Monitoring for the Kitimat Modernization Project
 Sulphur Dioxide Environmental Effects Monitoring for the Kitimat Modernization Project 2016 Annual Report Prepared for: Rio Tinto, BC Works 1 Smeltersite Road, P.O. Box 1800, Kitimat, BC, Canada V8C 2H2
ISSUES RELATED TO NO2 NAAQS MODELING
 ISSUES RELATED TO NO2 NAAQS MODELING Presented to North Texas Chapter of the Air & Waste Management Association By James Red Providence Engineering and Environmental November 17, 2015 1 OUTLINE Overview
A Comparative Air Quality Modelling Analysis of Options for Management of Waste After Recycling. GVS&DD Board June 12, 2009
 A Comparative Air Quality Modelling Analysis of Options for Management of Waste After Recycling GVS&DD Board June 12, 2009 Air Quality in Metro Vancouver and the FVRD Air quality in the Lower Fraser Valley
A comparison of CALPUFF air quality simulation results with monitoring data for Krakow Poland
 A comparison of CALPUFF air quality simulation results with monitoring data for Krakow Poland John S. Irwin 1, Joanna Niedzialek 2, Jerzy Burzynski 3 1 Atmospheric Sciences Modeling Division (Mail Drop
The results of CAIMANs project FUTURE TIME AIR DISPERSION MODEL RESULTS FOR THE TREND SCENARIO. Anastasia Poupkou AUTH
 The results of CAIMANs project FUTURE TIME AIR DISPERSION MODEL RESULTS FOR THE TREND SCENARIO Anastasia Poupkou AUTH Mitigation Air Pollution in the Mediterranean Port Cities Venice, 12th June 2015 Air
APPENDIX III. Air Quality Modelling of NO X and PM 10 (2007) RFI Report (Dec 2007)
 RFI Report (Dec 2007)") APPENDIX III Air Quality Modelling of NO X and PM 10 (2007) RFI Report (Dec 2007) 17 EPA Export 25-07-2013:22:32:47 Platin IPPC Licence Application Air Quality Modelling of NOx and PM (2007) EPA Export
APPENDIX III Air Quality Modelling of NO X and PM 10 (2007) RFI Report (Dec 2007) 17 EPA Export 25-07-2013:22:32:47 Platin IPPC Licence Application Air Quality Modelling of NOx and PM (2007) EPA Export
Chapter 5 FUTURE OZONE AIR QUALITY
 Chapter 5 FUTURE OZONE AIR QUALITY 5 FUTURE OZONE AIR QUALITY 5.1 INTRODUCTION AND SUMMARY Air quality models are used to predict ozone concentrations in future years. These models simulate the formation,
Tips to Improve Model Results
 Tips to Improve Model Results 2019 Missouri Air Compliance Seminar Joseph Stolle, PE, Senior Environmental Engineer Wendy Vit, PE, Senior Environmental Engineer March 7, 2019 What is an Air Model? Used
Appendix: Materials and methods
 Appendix: Materials and methods Atmospheric dispersion modeling for the case studies was carried out using version 7 (June 2015) of the CALPUFF modeling system. CALPUFF is an advanced non-steady-state
Dispersion Modeling of Mercury Emissions from Coal-Fired Power Plants at Coshocton and Manchester, Ohio
 65 Dispersion Modeling of Mercury Emissions from Coal-Fired Power Plants at Coshocton and Manchester, Ohio Sang-Sup lee and tim c. keener 1, department of civil and environmental engineering, university
AIR DISPERSION MODELLING GUIDELINE FOR ONTARIO
 July 2005 AIR DISPERSION MODELLING GUIDELINE FOR ONTARIO Version 1.0 Guidance for Demonstrating Compliance with The Air Dispersion Modelling Requirements set out in Ontario Regulation 419/05 Air Pollution
REPORT. Offshore Ironsands Project. Air Dispersion Modelling Study - Reciprocating Engines
 REPORT Offshore Ironsands Project Air Dispersion Modelling Study - Reciprocating Engines Prepared for Prepared by Date Job Number 29303.v2 Distribution: (FILE) 1 copy 1 copy Table of contents 1 Introduction
Air Quality Modelling. Table of Contents
 Table of Contents 1.0 Introduction... 5 1.1 Purpose of Modeling... 5 1.2 Phases of a Modeling Study... 5 1.2.1 Scoping Phase... 6 1.2.2 Screening Model Phase... 6 1.2.3 Refined Model Phase... 6 1.2.4 Presentation
A Primer on the British Columbia Air Quality Dispersion Modelling Guideline
 A Primer on the British Columbia Air Quality Dispersion Modelling Guideline Introduction The Ministry, with the assistance of experts in government and private industry, has developed the British Columbia
Meteorological and Air Dispersion Modeling Methodology and Discussion for INPRO Project
 Meteorological and Air Dispersion Modeling Methodology and Discussion for INPRO Project Introduction The transport and dilution of radioactive materials in the form of aerosols, vapors, or gases released
Assessing the air quality, toxic and health impacts of the Lamu coal-fired power plants
 Assessing the air quality, toxic and health impacts of the Lamu coal-fired power plants Lauri Myllyvirta 1 & Clifford Chuwah 2 Greenpeace Research Laboratories 3 Technical Report 06-2017 June 2017 Summary
Technical Manual Guideline on Air Quality Impact Modeling Analysis
 New Jersey Department of Environmental Protection Division of Air Quality Bureau of Technical Services Technical Manual 1002 Guideline on Air Quality Impact Modeling Analysis November 2009 Table of Contents
Guidance on Application of. Provincial Air Quality Objectives for SO 2. B.C. Ministry of Environment
 Guidance on Application of Provincial Air Quality Objectives for SO 2 B.C. Ministry of Environment February 7, 2017 Guidance on Application of Provincial Air Quality Objectives for SO 2 1. Purpose To
EPA Air Quality Modeling Updates
 EPA Air Quality Modeling Updates Tyler Fox, EPA/OAQPS Presentation for R/S/L Modelers Workshop November 15, 2016 Presentation Overview Final Revisions to EPA s Guideline on Air Quality Models Draft SILs
BART Control Technology Visibility Improvement Modeling Analysis Guidance
 BART Control Technology Visibility Improvement Modeling Analysis Guidance Air Pollution Control Division / Technical Services Program This document presents the Air Pollution Control Division (Division)
Technical Guidance Document for Air Quality Modeling
 Technical Guidance Document for Air Quality Modeling EAD-EQ-PCE-TG-12 Signature on Original Environment Quality Sector * Corporate Management Representative Secretary General Originated By Reviewed By
Energy Impact Analysis in Support of Class I Redesignation Requests. Prepared for. Fond du Lac Band of Lake Superior Chippewa Cloquet, Minnesota
 Energy Impact Analysis in Support of Class I Redesignation Requests Prepared for Fond du Lac Band of Lake Superior Chippewa Cloquet, Minnesota Prepared by August 2011 TABLE OF CONTENTS Section Page 1.0
MULTIPLE POINT SOURCE DISPERSION ANALYSIS OF CO, NO 2, PM 10 AND SO 2 FROM PAITON POWER PLANT USING CALPUFF
 International Journal of Civil Engineering and Technology (IJCIET) Volume 9, Issue 1, January 2018, pp. 837 846, Article ID: IJCIET_09_01_081 Available online at http://http://www.iaeme.com/ijciet/issues.asp?jtype=ijciet&vtype=9&itype=1
Saskatchewan s Air Modelling and Odour Guidelines Imran Maqsood, Ph.D., P.Eng. Ministry of Environment
 Saskatchewan s Air Modelling and Odour Guidelines Imran Maqsood, Ph.D., P.Eng. Ministry of Environment Air Quality in Saskatchewan, Saskatoon January 17, 2014 Outline Part 1: Air Modelling Guideline Part
Air Quality Assessment of Ozone, Particulate Matter, Visibility and Deposition - Program 91
 Air Quality Assessment of Ozone, Particulate Matter, Visibility and Deposition - Program 91 Program Description Program Overview Implementation of regulatory programs under the Clean Air Act requires the
2.3 A PHOTOCHEMICAL MODEL COMPARISON STUDY: CAMx AND CMAQ PERFORMANCE IN CENTRAL CALIFORNIA
 2.3 A PHOTOCHEMICAL MODEL COMPARISON STUDY: CAMx AND CMAQ PERFORMANCE IN CENTRAL CALIFORNIA Jinyou Liang *, Philip T. Martien, Su-Tzai Soong, and Saffet Tanrikulu Bay Area Air Quality Management District,
BART Modeling Protocol for VISTAS
 DRAFT BART Modeling Protocol for VISTAS Ivar Tombach, VISTAS Technical Advisor Pat Brewer, VISTAS Technical Coordinator With contributions from: Tom Rogers, Florida Department of Environmental Protection
The modification of global atmospheric Nitrogen cycling by human activities. David Fowler Centre for Ecology and Hydrology Edinburgh UK
 The modification of global atmospheric Nitrogen cycling by human activities David Fowler Centre for Ecology and Hydrology Edinburgh UK Background The N cycle Global N emissions Oxidised Nitrogen Reduced
MODELLING OF AMMONIA CONCENTRATIONS AND DEPOSITION OF REDUCED NITROGEN IN THE UNITED KINGDOM
 MODELLING OF AMMONIA CONCENTRATIONS AND DEPOSITION OF REDUCED NITROGEN IN THE UNITED KINGDOM Anthony Dore 1, Mark Theobald 1, Massimo Vieno 2 Sim Tang 1 and Mark Sutton 1 1 Centre for Ecology and Hydrology,
CALMET/CALPUFF BART Protocol for Class I Federal Area Individual Source Attribution Visibility Impairment Modeling Analysis
 CALMET/CALPUFF BART Protocol for Class I Federal Area Individual Source Attribution October 24, 2005 Colorado Department of Public Health and Environment Air Pollution Control Division Technical Services
AIR QUALITY MANAGEMENT PLAN FOR THE NORTHERN CAPE
 AIR QUALITY MANAGEMENT PLAN FOR THE NORTHERN CAPE MODEL PLAN OF STUDY To: From: Northern Cape Department of Environment and Nature Conservation Sasko Building 90 Long Street Kimberley, 8300 umoya-nilu
Major Science Issues in Atmospheric Transport and Dispersion Modeling of Accidental Releases of Ammonia to the Atmosphere
 Major Science Issues in Atmospheric Transport and Dispersion Modeling of Accidental Releases of Ammonia to the Atmosphere Steven Hanna Hanna Consultants, Kennebunkport, Maine USA, and Harvard T.H. Chan
MEMORANDUM. Ken Rairigh. To: Till Stoeckenius. From: Date: 4/7/2005. Subject: WY NO 2 PSD modeling: Final modeling results for Task 1
 MEMORANDUM To: From: Ken Rairigh Till Stoeckenius Date: /7/ Subject: WY NO PSD modeling: Final modeling results for Task This memo documents preliminary NO PSD increment modeling results for the Domain
Technical Manual Guidance on Preparing an Air Quality Modeling Protocol
 New Jersey Department of Environmental Protection Division of Air Quality Technical Manual 1002 Guidance on Preparing an Air Quality Modeling Protocol 2018 Table of Contents 1.0 Introduction... 1 1.1
Prepared for Capital Area Council of Governments (CAPCOG) P.O. Box Austin, TX and
 P.O. Box Austin, TX and") Analysis of the Impact of Reductions in Anthropogenic NO x and VOC Emissions on Ozone Concentrations in the Austin Area using the Rider 8 Photochemical Modeling Episode for May 31-July 2, 2006 Prepared
Analysis of the Impact of Reductions in Anthropogenic NO x and VOC Emissions on Ozone Concentrations in the Austin Area using the Rider 8 Photochemical Modeling Episode for May 31-July 2, 2006 Prepared
Diesel Powered Generators for STOR & Balancing Market: NO X Modelling & Impact Assessment Guidance
 Diesel Powered Generators for STOR & Balancing Market: NO X Modelling & Impact Assessment Guidance Alun Roberts-Jones Advisor, Air Quality Modelling and Assessment Unit (AQMAU) Environment Agency 4 December
PM2.5 NAAQS Implementation & Permitting in Georgia
 PM2.5 NAAQS Implementation & Permitting in Georgia Georgia Environmental Conference Jekyll Island, Georgia August 25, 2016 Brad James, P.E. Overview Current UFP Regulation (as PM 2.5 ) PM 2.5 NAAQS SIP
Prepared for Capital Area Council of Governments (CAPCOG) P.O. Box Austin, TX and
 P.O. Box Austin, TX and") Analysis of the Impact of Reductions in Anthropogenic NO x and VOC Emissions on Ozone Concentrations in the Austin Area using the Rider 8 Photochemical Modeling Episode for May 31-July 2, 2006 Prepared
Analysis of the Impact of Reductions in Anthropogenic NO x and VOC Emissions on Ozone Concentrations in the Austin Area using the Rider 8 Photochemical Modeling Episode for May 31-July 2, 2006 Prepared
REPORT. Offshore Ironsands Project. Air Dispersion Modelling Study - Gas Turbines
 REPORT Offshore Ironsands Project Air Dispersion Modelling Study - Gas Turbines Prepared for Prepared by Date Job Number 29303.v2 Distribution: (FILE) 1 copy 1 copy Table of contents 1 Introduction 1 2
Review of the 2009 Gauteng Air Quality Management Plan
 Review of the 2009 Gauteng Air Quality Management Plan GT/GDARD/154/2016 DISPERSION MODELLING PLAN OF STUDY To: From: Gauteng Provincial Treasury Imbumba House 75 Fox Street Marshalltown, Johannesburg
BART CALPUFF Class I Federal Area Individual Source Attribution Visibility Impairment Modeling Analysis for Cemex, Inc., Lyons Cement Plant
 BART CALPUFF Class I Federal Area Individual Source Attribution Visibility Impairment Modeling Analysis for November 1, 2005 Colorado Department of Public Health & Environment Air Pollution Control Division
EXAMPLE AIR QUALITY ANALYSIS CHECKLIST a
 EXAMPLE AIR QUALITY ANALYSIS CHECKLIST a 1. Source location map(s) showing location with respect to:! Urban areas b! PSD Class I areas! Nonattainment areas b! Topographic features (terrain, lakes, river
MODELING METHODOLOGY
 Paul Schleusener, Senior Engineer Specialist Michigan Department of Environmental Quality Air Quality Division Constitution Hall, 1 st Floor 525 West Allegan Street P.O. Box 30473 Lansing, MI 48909 7973
Combined Use of AERMOD, ArcGIS, and Risk Analyst for Human Health Risk Assessment. Paper No Prepared By:
 Combined Use of AERMOD, ArcGIS, and Risk Analyst for Human Health Risk Assessment Paper No. 33578 Prepared By: Aubrey Jones Senior Consultant/ Meteorologist Abhishek Bhat, PhD, EPI Senior Consultant Tiffany
Plume-in-grid modeling for particulate matter
 Atmospheric Environment 40 (2006) 7280 7297 www.elsevier.com/locate/atmosenv Plume-in-grid modeling for particulate matter Prakash Karamchandani a,, Krish Vijayaraghavan a, Shu-Yun Chen a, Christian Seigneur
Development of a 2007-Based Air Quality Modeling Platform
 Development of a 2007-Based Air Quality Modeling Platform US EPA Office of Air Quality Planning and Standards Heather Simon, Sharon Phillips, Norm Possiel 1 NEI Other EI Data Regulatory Modeling Platform
Status of EPA s Guideline on Air Quality Models
 Status of EPA s Guideline on Air Quality Models 2013 R/S/L Modelers Workshop April 23, 2013 Tyler Fox Office of Air Quality Planning and Standards Overview Challenges to Our Current Guideline Recent Guidance
Sensitivity of AERMOD to Meteorological Data Sets Based on Varying Surface Roughness. Paper No A-168-AWMA
 Sensitivity of AERMOD to Meteorological Data Sets Based on Varying Surface Roughness Paper No. 2009-A-168-AWMA Prepared by: Anthony J. Schroeder, CCM Senior Consultant George J. Schewe, CCM, QEP Principal
Cumberland Power Plant
 Reactive Plume Modeling with SCICHEM and CMAQ for Tennessee Valley Authority Cumberland Power Plant James T. Kelly and Kirk R. Baker Office of Air Quality Planning & Standards US Environmental Protection
AIR DISPERSION MODELLING GUIDELINE FOR ONTARIO [GUIDELINE A-11]
![AIR DISPERSION MODELLING GUIDELINE FOR ONTARIO [GUIDELINE A-11]](/thumbs/71/65628274.jpg "AIR DISPERSION MODELLING GUIDELINE FOR ONTARIO [GUIDELINE A-11]") AIR DISPERSION MODELLING GUIDELINE FOR ONTARIO [GUIDELINE A-11] Version 3.0 Guidance for Demonstrating Compliance with the Air Dispersion Modelling Requirements set out in Ontario Regulation 419/05 Air
AIR DISPERSION MODELLING GUIDELINE FOR ONTARIO [GUIDELINE A-11] Version 3.0 Guidance for Demonstrating Compliance with the Air Dispersion Modelling Requirements set out in Ontario Regulation 419/05 Air
Particulate Matter Science for Policy Makers: A. Ambient PM 2.5 EXECUTIVE SUMMARY MASS AND COMPOSITION RESPONSES TO CHANGING EMISSIONS
 Particulate Matter Science for Policy Makers: A NARSTO Assessment was commissioned by NARSTO, a cooperative public-private sector organization of Canada, Mexico and the United States. It is a concise and
Appendix 0 Air Dispersion Modelling Study Black Point Quarry Project Guysborough County, NS SLR Project No.:
 Appendix 0 Air Dispersion Modelling Study 2015 Black Point Quarry Project Guysborough County, NS SLR Project No.: 210.05913.00000 Black Point Quarry Air Dispersion Modelling Study Prepared for: CJ Spainhour
Annual Monitoring Network Plan for the North Carolina Division of Air Quality. Volume 1 Addendum 2
 2016-2017 Annual Monitoring Network Plan for the North Carolina Division of Air Quality Volume 1 Addendum 2 December 28, 2016 North Carolina Division of Air Quality A Division of the North Carolina Department
Influence of building-downwash effect on urban traffic pollution
 Influence of building-downwash effect on urban traffic pollution G. Latini, G. Passerini & S. Tascini Dipartimento di Energetica, Università Politecnica delle Marche, Italy Abstract Building-downwash has
Abstract. Introduction
 Modelling dispersion of pollutants with a simple software - it is a practical approach K. Oduyemi University of Abertay Dundee, Bell Street, Dundee DD1 1HG, UK Abstract One of the most important assessment
Analysis of SO 2 Modeling Issues for Ameren Power Plants in the Greater St. Louis Area
 Analysis of SO 2 Modeling Issues for Ameren Power Plants in the Greater St. Louis Area Prepared by AECOM August 19, 2014 1. Introduction In 2010, the United States Environmental Protection Agency (EPA)
IMPACTS OF PROPOSED OIL PRODUCTION ON NEAR SURFACE OZONE CONCENTRATIONS IN THE CASPIAN SEA REGION
 IMPACTS OF PROPOSED OIL PRODUCTION ON NEAR SURFACE OZONE CONCENTRATIONS IN THE CASPIAN SEA REGION J. Wayne Boulton*, Jeff Lundgren, Roger Barrowcliffe, Martin Gauthier RWDI, Guelph, Ontario, Canada Zachariah
Modeling Tools Used in New Jersey s 126 Petition Against Portland Power Plant
 Modeling Tools Used in New Jersey s 126 Petition Against Portland Power Plant Section 126 Clean Air Act A state may petition the Administrator for a finding that a major source or group of stationary sources