GREENHOUSE GAS EMISSIONS REPORTING PROGRAM. Overview of 2008 Facility Data
|
|
|
- Lizbeth Booker
- 6 years ago
- Views:
Transcription


1 GREENHOUSE GAS EMISSIONS REPORTING PROGRAM Overview of 2008 Facility Data
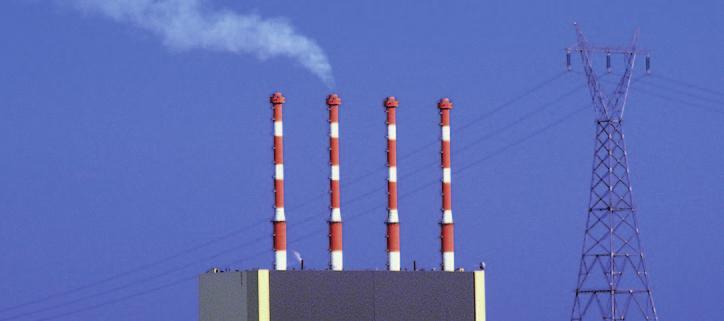
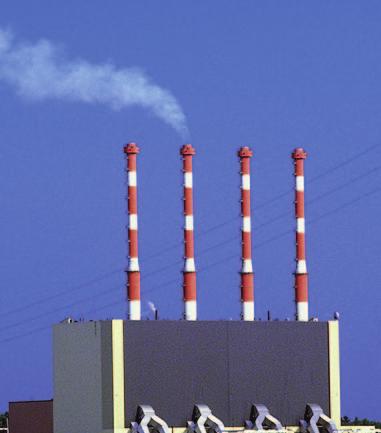
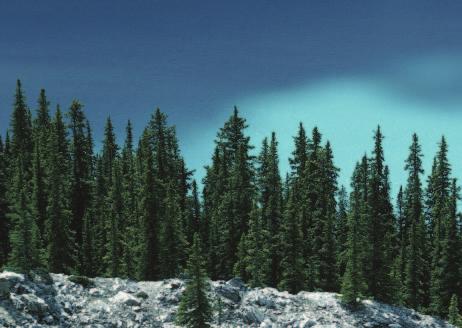
2 Photo credits: Cover page: Photocom Inside: Jim Moyes (p. 1); Photocom (p. 12) ISSN Her Majesty the Queen in Right of Canada, represented by the Minister of the Environment, 2009 Aussi disponible en français sous le titre Programme de déclaration des émissions de gaz à effet de serre : Aperçu des données des installations pour l année 2008
3 Overview of 2008 Facility Data Page 1 Facility Greenhouse Gas Emissions Reporting Program 1 2 Analysis of reported greenhouse gas emissions 2008 emissions 2 3 Short-term trend: Long-term trend: What do I need to know before using the reported facility level greenhouse gas information? 11 6 For more information 13 7 Contact us 13 8 Disclaimer 13 i
4
 emissions.")
5 Facility Greenhouse Gas Emissions 1 Reporting Program Overview of 2008 Facility Data In March 2004, the Government of Canada established the Greenhouse Gas Emissions Reporting Program, thus initiating a phased approach to the collection of information on greenhouse gas (GHG) emissions. This program continues to be part of Canada s ongoing effort to develop, through a collaborative process with the provinces and the territories, a harmonized and efficient GHG reporting system that minimizes duplication and eases the reporting burden for industry and governments alike. The program s four main objectives are to provide Canadians with timely information on GHG emissions; to enhance the level of detail in the National Greenhouse Gas Inventory; to support provincial and territorial requirements for GHG emissions information; and to support the development of regulations. A key change in the program s reporting requirements for 2009 data to be reported in 2010 is the lowering of the reporting threshold from 100 kilotonnes (kt) of CO 2 equivalent (CO 2 eq.) to 50 kt of CO 2 eq. This change will enable Environment Canada to obtain a better understanding of GHG emissions across Canada and improve alignment with existing data needs. The reporting requirements for 2009 data to be submitted next year are set out in the Notice with respect to reporting of greenhouse gases (GHGs) for published in the Canada Gazette. 1 This Notice can be viewed at 1
6 2 Analysis of reported greenhouse gas emissions 2008 emissions A total of 350 facilities reported GHG emissions for the 2008 calendar year, collectively emitting a total of 263 megatonnes (Mt 2 ) of CO 2 eq of GHGs. Facilities can voluntarily report their GHG emissions if their emissions are below the reporting threshold, and 53 facilities did so in Total facility GHG emissions in 2008 represent just over a third (35%) of Canada s total 2007 GHG emissions and just over half (54%) of Canada s 2007 industrial GHG emissions 3, as published in the National Inventory Report, : Greenhouse Gas Sources and Sinks in Canada 4. The data used in this overview report are current as of September 14, While facilities have the ability to submit updates to their data, these updates will only be reflected in Environment Canada s release conducted next year. Facilities in Alberta accounted for the largest share of reported emissions, with approximately 42% of the total, followed by those in Ontario with 26%. Saskatchewan and Quebec both accounted for 8% of reported emissions (Table 1). Table 1 Reported 2008 GHG emissions by province Province Number of Facilities Total Emissions (kt CO 2 eq) % of Total Emissions Newfoundland and Labrador % Prince Edward Island % Nova Scotia % New Brunswick % Quebec % Ontario % Manitoba % Saskatchewan % Alberta % British Columbia % Northwest Territories % Totals % Note: Totals may not add due to rounding. 2 1 Mt = 1000 kt. 3 Canada s industrial GHG emissions include the following GHG categories from the National Inventory Report, : Greenhouse Gas Sources and Sinks in Canada: Stationary Combustion Sources (except Residential), Other Transportation, Fugitive Sources, Industrial Processes and Waste. 4 National Inventory Report, : Greenhouse Gas Sources and Sinks in Canada at som-sum_eng.cfm. 2
7 When completing the GHG report, a reporter is required to identify the main activities occurring at its facility by selecting the North American Industry Classification System (NAICS) 5 code that corresponds to these activities. Three industrial sectors accounted for the majority of GHG emissions Utilities, primarily those generating electricity, representing 43%; Manufacturing, accounting for 32%; and Mining, Quarrying, and Oil and Gas Extraction, accounting for 21% (Figure 1). Examples of reporting facilities within Manufacturing include cement and lime manufacturing; pulp and paper mills; petroleum refineries; chemical manufacturing; and iron, steel and aluminium production facilities. Activities of reporting facilities within Mining, Quarrying, and Oil and Gas Extraction include production of petroleum and natural gas; oil sands mining and bitumen production; and mining of coal, iron ore, other metals, potash and diamond. In 2008, 292 of the 350 facilities that reported had GHG emission levels of less than 1 Mt. The remaining 58 facilities emitted GHGs in quantities greater than 1 Mt and accounted for 69% of the total reported emissions 6. Figure 1 Industrial sector contribution to 2008 reported GHG emissions Manufacturing (NAICS 31-33) 32% Other* 4% Mining, Quarrying, and Oil and Gas Extraction (NAICS 21) 21% Utilities (NAICS 22) 43% * Other includes Transportation and Warehousing, as well as Administrative and Support, Waste Management and Remediation Services industrial sectors. 5 The NAICS code is a six-digit code that was developed by Statistics Canada, the U.S. Office of Management and Budget and Mexico s Instituto Nacional de Estadistica Geografia e Informatica to enable the respective national agencies to collect comparable statistical data. The NAICS code in Canada consists of 20 sectors, 102 subsectors, 324 industry groups, 718 industries and 928 national industries. 6 Facility-level data is published on Environment Canada s Greenhouse Gas Division website at dataandreports_e.cfm. 3
8 3 Short-term trend: Over the past year, total reported emissions decreased by 15.7 Mt of CO2 eq (6%). This decrease occurred across all sectors, with the Utilities and Manufacturing sectors demonstrating the largest decline (8.7 Mt and 3.8 Mt respectively) (Table 2). The total number of facilities reporting dropped by 2, from 352 to 350. An additional 2 Mining, Quarrying, and Oil and Gas Extraction facilities reported over the past year. The total emissions from the 79 facilities that reported for 2007 and 2008 declined by 2.5 Mt. Four new Utilities facilities reported in Among the 77 facilities that reported for 2007 and 2008, emissions decreased by 9.1 Mt. There was a decline of 8 reporting facilities in the Manufacturing sector: 5 facilities closed in either 2007 or 2008, while the remaining 3 indicated that they fell below the reporting threshold. These 8 facilities accounted for 1.5 Mt of GHGs in These changes in reported emissions are likely due to differences in the number of facilities reporting, variability in production volumes or operations (e.g., plant closures, shutdown periods, decreases in demand), economic factors or emission reduction efforts. Of the reported six GHGs, sulphur hexafluoride has seen the largest percentage decline (93%) due to the closure of two magnesium facilities over the past year. Amongst the provinces and territories, British Columbia and the Northwest Territories had an increase in reported emissions, while other provinces saw a decline in reported emissions (Figure 2). The increase experienced by British Columbia is largely due to an increase in emissions from conventional oil and Table 2 Short-term trend by sector, , all facilities All Facilities Number of Facilities Emissions (kt CO 2 eq) NAICS Sector Difference 21 Mining, Quarrying, and Oil and Gas Extraction 22 Utilities Manufacturing Other Other Totals Note: Totals may not add due to rounding. 4
9 Figure 2 Provincial short-term trend, N.L. P.E.I. N.S. N.B. Province Que. Ont. Man. Sask. Alta. B.C. N.W.T Change in Emissions (kt CO 2 eq) gas extraction, while the Northwest Territories saw an increase in emissions from diamond mining. Ontario reported the largest decrease in emissions (7.0 Mt), the majority of which occurred within the Utilities sector, mainly fossil-fuel electric power generation (5.2 Mt), while Manufacturing accounted for a 1.1 Mt drop in reported emissions. The decrease in emissions from the Utilities sector is a result of the combination of hydraulic conditions, economic activity and increased conservation efforts. The cool, wet summer led to record hydroelectric production (a low-ghgemitting source) and lower demand for electricity. Coal-fired electricity generation decreased by 18% from Emissions from Alberta declined by 3.5 Mt. The two largest reductions are linked to oil and gas extraction activities and the Utilities sector (1.4 Mt each). The decrease in emissions from the Utilities sector is due to planned and unplanned outages resulting in a 1.3% reduction in coal-fired generation from Quebec saw a decline of 3.4 Mt, due largely to a 1.8 Mt decline in Manufacturing, followed by a 1.6 Mt drop in Utilities. The suspension of electricity generation from a naturalgas-powered facility led to the drop in emissions from Utilities 9. Comparable facilities are those that reported GHG emissions every year from 2004 to When comparing emissions 7 Source: Independent Electricity System Operator. 8 Source: Alberta Electric System Operator. 9 Source: Hydro Quebec. 5
10 between total facilities and comparable facilities, comparable facilities tend to dictate the emission trend (Figure 3). Understanding the trend from comparable facilities provides a more accurate representation of the overall trend as it removes the variability in the number of facilities reporting each year. There are 275 comparable facilities, which generally represent over 95% of the reported emissions from all facilities in any given year. Further data and analysis presented from this point forward in the report will focus on comparable facilities and their emissions. When comparing industries and their overall change in emissions, fossil-fuel electric power generation led with a decline in emissions of 7.6 Mt, followed by nonconventional oil extraction with a drop of 2.9 Mt. Overall, the industries shown in Figure 4 represent a decline of 14.8 Mt (94% of the total short-term decrease). As mentioned above, a number of factors contribute to these changes in emissions. For example, the decreased emissions in the cement industry are directly attributable to reductions (close to 10%) in the production of clinker (the main ingredient for cement), as observed in national statistics. The decrease in clinker production itself results from declines in domestic sales of cement, cement-derived products and cement exports 10. Figure 3 Comparable facilities versus all facilities, Emissions (kt CO 2 eq) Year All Facilities Comparable Facilities 10 Source: Statistics Canada and Industry Canada. 6
11 Figure 4 Top five short-term changes by industry, , comparable facilities Fossil-Fuel Electric Power Generation (NAICS: ) Non-Conventional Oil Extraction (NAICS: ) Industry Pipeline Transportation of Natural Gas (NAICS: ) Petroleum Refineries (NAICS: ) Cement Manufacturing (NAICS: ) Change in GHG Emissions (kt CO 2 eq) 7
12 4 Long-term trend: Over the long term, the total number of facilities reporting increased from 326 in 2004 to 350 in 2008, while total emissions decreased by 16 Mt (6%) in the same time frame (Table 3). As mentioned previously, analyzing comparable facilities (facilities that have reported every year) provides a more accurate trend analysis. If one focuses on comparable facilities over the longterm ( ), one sees that emissions declined 14.1 Mt during the period (Table 4). This represents a 5% reduction in reported emissions over the period. The provincial/territorial long-term trend (Figure 5) is similar to the short-term one, in that most provinces and territories display a decline in emissions. However, Alberta exhibited a slight increase, largely due to an increase of 3.8 Mt from nonconventional oil extraction. The decline in emissions in Ontario is mostly due to a drop of 5.3 Mt in the Manufacturing sector, followed by a drop of 1.1 Mt in the Utilities sector. New Brunswick displayed a 2.6-Mt drop in emissions, attributable to the Utilities sector, which accounted for 2.2 Mt. Emissions from British Columbia declined by 1.5 Mt, caused by a drop in emissions from conventional oil and gas extraction, manufacturing sector and pipeline transportation. Table 3 Long-term trend, , all facilities All Facilities Number of facilities Emissions (kt CO 2 eq) Annual Change (%) NA Change since 2004 (%) NA NA = Not applicable Table 4 Long-term trend, , comparable facilities Comparable Facilities Number of facilities Emissions (kt CO 2 eq) Annual Change (%) NA Change since 2004 (%) NA NA = Not applicable 8
13 Figure 5 Provincial long-term trend, , comparable facilities Province N.L. P.E.I. N.S. N.B. Que. Ont. Man. Sask. Alta. B.C. N.W.T Change in Emissions (kt CO 2 eq) Among the three largest contributors, emissions from Utilities and Manufacturing have declined, while emissions from Mining, Quarrying, and Oil and Gas Extraction have slightly increased (Figure 6). The Utilities sector exhibits significant variability that reflects the many factors that impact this sector, such as fuel cost (particularly oil and natural gas), weather, generation sources (nuclear, coal, hydro, wind) and demand by the manufacturing and residential sectors. The industries showing the largest change in GHG emissions are different in the short term (Figure 4) versus the long term (Figure 7). Also worth noting is the fact that the top contributors to the shortterm emission trend all show a reduction whereas, in the long term, non-conventional oil extraction increased by 3.6 Mt. One of the industries showing the largest change in emissions from 2004 to 2008 is iron and steel. The long-term emissions reductions in this industry correspond to the decreases observed in the national production levels for steel (8%). The decrease in steel production is mainly driven by the downturn in the automotive industry, one of the largest consumers of steel. This is reflected in a drop of 53% in the domestic sales of steel products to the sector of motor vehicles and parts Source: Statistics Canada. 9
14 Figure 6 Long-term sector trend, , comparable facilities Emissions (kt CO 2 eq) Year Mining, Quarrying, and Oil and Gas Extraction Utilities Manufacturing Figure 7 Top five long-term changes by industry, , comparable facilities Fossil-Fuel Electric Power Generation (NAICS: ) Non-Conventional Oil Extraction (NAICS: ) Industry Conventional Oil and Gas Extraction (NAICS: ) Pipeline Transportation of Natural Gas (NAICS: ) Iron and Steel Mills and Ferro-Alloy Manufacturing (NAICS: ) Change in GHG Emissions (kt CO 2 eq) 10
15 5 What do I need to know before using the reported facility level greenhouse gas information? Greenhouse gas emissions are reported in CO 2 eq units. Greenhouse gases are not equal in the effect they have on the atmosphere. In fact, each GHG has a unique average atmospheric lifetime and heat-trapping potential. Greenhouse gas emissions are often calculated in terms of how much CO 2 would be required to produce a similar warming effect. This is called the carbon dioxide equivalent (CO 2 eq) value and is calculated by multiplying the amount of the gas by its associated global warming potential (GWP). For example, the GWP for methane (CH 4 ) is 21, which means that each tonne of CH 4 emitted is considered to have a cumulative warming effect over the next 100 years equivalent to emitting 21 tonnes of CO 2. The scientific community has established a GWP for each of the GHGs subject to reporting under the Greenhouse Gas Emissions Reporting Program. A complete list can be found in the latest notice published in the Canada Gazette at p1/2009/ /html/notice-avis-eng. html#d101. Greenhouse gas emissions data are only required from facilities that meet the reporting requirements. Not all industrial facilities in Canada are required to report their annual GHG emissions to Environment Canada. The Greenhouse Gas Emissions Reporting Program only requires facilities that emit the equivalent of 100 kt or more of CO 2 eq to report. If desired, facilities with emissions below the reporting threshold can still participate in the Greenhouse Gas Emissions Reporting Program and report their emissions annually. Note that the threshold has been reduced to 50 kt for 2009 data to be reported in The number of reporting facilities may change from year to year. Fluctuation in the number of reporting facilities is not unexpected from year to year. A change in production levels, process and technology and/or type of fuel used at a facility could all result in either an increase or a decrease in the annual emissions reported by a facility. As a result, a facility may go below or attain the reporting threshold of 100 kt CO 2 eq. The Greenhouse Gas Emissions Reporting Program is not the National Pollutant Release Inventory (NPRI). Although both programs are delivered by Environment Canada under the authority of section 46 of the Canadian Environmental Protection Act, 1999, they are two distinct programs. The NPRI currently collects pollution data on a range of emissions of concern, including criteria air contaminants, whereas the Greenhouse Gas Emissions Reporting Program collects GHG information from facilities. Facilities reporting to the Greenhouse Gas Emissions Reporting Program are asked to report their NPRI identification number to facilitate searching and comparison of emissions from facilities that report to both programs. 11

16 There are a number of methods that a facility may choose to use to calculate its GHG emissions. The methods selected by reporting facilities must be consistent with the guidelines adopted by the United Nations Framework Convention on Climate Change and developed by the Intergovernmental Panel on Climate Change. The facility must ensure that the reported data are of good quality. Reporters have a legal obligation to keep copies of the information submitted, along with any calculations, measurements and other data on which the information is based. All information must be kept for a period of three years from the date on which the information was reported to Environment Canada. Reporters are also required to submit a statement of certification, signed by an authorized official, stating that the information contained in the attached emission report is accurate and complete, to the best of their knowledge. Environment Canada conducts a number of checks on the reported GHG data for compliance purposes and for completeness prior to publication; however, any interpretation of the reported data must consider the possible presence of estimation, calculation or input errors made by facilities. 12
17 6 For more 7 information Contact us Overview of 2008 Facility Data The GHG Division website provides public access to information from all facilities that reported GHG emissions. Data is provided in tables, a searchable database and in a downloadable format. Users can search by emissions of a specific gas or emissions of all gases, by facility name or NPRI identification number, by reporting company, by province, territory or city, or by industrial sector using the NAICS code. Do you have questions about this report or need more information about its contents? If so, please contact the GHG Division: ghg@ec.gc.ca Tel.: Fax: Website: GHG Division Facility GHG Reporting Data: Reporting of greenhouse gases: 8 Disclaimer GHG Division Canada s National GHG Inventory: Canada Gazette notice for reporting of 2008 GHG emissions analyzed above: 16/html/notice-avis-eng.html#d108 Canada Gazette notice for upcoming reporting of 2009 GHG emissions: 11/html/notice-avis-eng.html#d101 Data presented here is current as of September 14, Environment Canada conducted a number of data checks for compliance purposes and for completeness. Environment Canada will continue to analyze the data that may result in periodic updates to the data. The data provided within this report are for information purposes only. Any interpretation of the data must consider the possible presence of estimation, calculation or input errors made by facilities. 13
18 Additional information can be obtained at: Environment Canada Inquiry Centre 351 St. Joseph Boulevard Place Vincent Massey, 8th Floor Gatineau, Quebec K1A 0H3 Telephone: (in Canada only) or Fax: TTY:
Overview of Reported Emissions
 Facility Greenhouse Gas Emissions Reporting Program Overview of Reported Emissions 2013 April 2015 Cat. No.: En81-6/1-2013E-PDF Unless otherwise specified, you may not reproduce materials in this publication,
OVERVIEW OF 2015 REPORTED EMISSIONS APRIL 2017 FACILITY GREENHOUSE GAS EMISSIONS REPORTING
 OVERVIEW OF 2015 REPORTED EMISSIONS APRIL 2017 FACILITY GREENHOUSE GAS EMISSIONS REPORTING Cat. No.: En81-6/1E-PDF ISSN: 2371-1035 Unless otherwise specified, you may not reproduce materials in this publication,
Greenhouse gas emissions in the Canadian economy,
 Catalogue no. 11-624-MIE No. 001 ISSN: 1708-0169 ISBN: 0-662-34291-7 Analytical Paper Insights on the Canadian economy Greenhouse gas emissions in the Canadian economy, 1981-2000 by Tarek M. Harchaoui
Electricity and Petroleum Industries:
 September 22 F a c t s h e e t 2 Electricity and Petroleum Industries: 199-2 The Electricity and Petroleum Industries Fact Sheet is comprised of two sectors: the Electricity Generation sector and the Petroleum
CANADA S 2016 GREENHOUSE GAS EMISSIONS REFERENCE CASE. Environment and Climate Change Canada December P age
 CANADA S 2016 GREENHOUSE GAS EMISSIONS REFERENCE CASE Environment and Climate Canada December 2016 0 P age Cat. N o.: En14-309/2018E-PDF ISBN: 978-0-660-24649-9 Unless otherwise specified, you may not
TURNING THE CORNER TURNING THE CORNER
 TURNING THE CORNER March 2008 TAKING ACTION to Fight Climate Change TAKING ACTION to Fight Climate Change Climate change is a global problem that requires global solutions. Canadians have long known that
Alberta Greenhouse Gas Reporting Program 2012 Facility Emissions
 September 15, 2016 Title: Number: Program Name: Greenhouse Gas Reporting Program Effective Date: This document was updated on: ISSN No. 2369-5951 Disclaimer The information contained in this report has
Data Sources and Methods for the Greenhouse Gas Emissions from Large Facilities Indicator. May 2013
 Data Sources and Methods for the Greenhouse Gas Emissions from Large Facilities Indicator May 2013 ISBN : En4-144/36-2013E-PDF Cat. No.: 978-1-100-22035-2 Information contained in this publication may
Canada s Clean Fuel Standard The role of low carbon fuels in decarbonising transport: the emerging consensus from international initiatives
 Canada s Clean Fuel Standard The role of low carbon fuels in decarbonising transport: the emerging consensus from international initiatives Lorri Thompson Manager, Clean Fuel Standard Development Oil,
ALBERTA ENVIRONMENT SUMMARY REPORT ON 2004 NPRI AIR EMISSIONS
 ALBERTA ENVIRONMENT SUMMARY REPORT ON 2004 NPRI AIR EMISSIONS Disclaimer: The source of the industrial emissions data used in this report is the April 25, 2006 version of the 2004 National Pollutant Release
Data Sources and Methods for the National Greenhouse Gas Emissions Indicators. May 2013
 Data Sources and Methods for the National Greenhouse Gas Emissions Indicators May 2013 ISBN : En4-144/18-2013E-PDF Cat. No.: 978-1-100-22033-8 Information contained in this publication may be reproduced,
2012 Statistics on the International Movements of Hazardous Waste and Hazardous Recyclable Material
 2012 Statistics on the International Movements of Hazardous Waste and Hazardous Recyclable Material Waste Reduction and Management Division Environment Canada OCTOBER 2013 Cat. No.: En11-7E-PDF ISSN: 1927-2359
Evaluating government plans and actions to reduce GHG emissions in Canada: The state of play in 2016
 Evaluating government plans and actions to reduce GHG emissions in Canada: The state of play in 2016 Hadrian Mertins-Kirkwood, Canadian Centre for Policy Alternatives Bruce Campbell, CCPA & University
CANADA S 2008 GREENHOUSE GAS INVENTORY A Summary of Trends:
 CANADA S 2008 GREENHOUSE GAS INVENTORY A Summary of Trends: 1990 2008 Snapshot of National Emission Trends Each year, Canada prepares a national inventory of human-induced greenhouse gas (GHG) emissions
PROGRESS REPORT ON THE CANADA-WIDE ACID RAIN STRATEGY FOR POST-2000 PN 1490 ISSN PDF
 2010-2011 PROGRESS REPORT ON THE CANADA-WIDE ACID RAIN STRATEGY FOR POST-2000 PN 1490 ISSN 1911-1541 PDF Canadian Council of Ministers of the Environment, 2013 The Canadian Council of Ministers of the
NATIONAL INVENTORY REPORT : GREENHOUSE GAS SOURCES AND SINKS IN CANADA EXECUTIVE SUMMARY
 NATIONAL INVENTORY REPORT 1990 2016: GREENHOUSE GAS SOURCES AND SINKS IN CANADA CANADA S SUBMISSION TO THE UNITED NATIONS FRAMEWORK CONVENTION ON CLIMATE CHANGE EXECUTIVE SUMMARY Library and Archives Canada
Canada s Emissions Trends. Environment Canada
 Canada s Emissions Trends Environment Canada 2014 Cat. No.: En81-18/2014E-PDF ISSN: 2291-9392 Unless otherwise specified, you may not reproduce materials in this publication, in whole or in part, for the
Digging a Big Hole: How tar sands expansion undermines a Canadian energy strategy that shows climate leadership
 Digging a Big Hole: How tar sands expansion undermines a Canadian energy strategy that shows climate leadership Introduction Canadian provinces are developing an energy strategy together that will be finalized
DEPARTMENT OF ENVIRONMENTAL AFFAIRS NO JULY 2017
 STAATSKOERANT, 21 JULIE 2017 No. 40996 65 DEPARTMENT OF ENVIRONMENTAL AFFAIRS NO. 710 21 JULY 2017 66 No. 40996 GOVERNMENT GAZETTE, 21 JULY 2017 TABLE OF CONTENTS CHAPTER 1 DEFINITIONS AND PRIORITY POLLUTANT
IMPLEMENTING CANADA S PLAN TO ADDRESS CLIMATE CHANGE AND GROW THE ECONOMY
 IMPLEMENTING CANADA S PLAN TO ADDRESS CLIMATE CHANGE AND GROW THE ECONOMY PUTTING A PRICE ON CARBON POLLUTION Technical Briefing October 23, 2018 Addressing climate change and growing the economy Canada
Data from the Waste Management Industry Survey and the Household Environment Survey
 Household participation in composting Data from the Waste Management Industry Survey and the Household Environment Survey Amanda Elliott October 1 st, 2009 Who am I? Why am I here? Amanda Elliott Analyst,
PROGRESS REPORT ON THE CANADA-WIDE ACID RAIN STRATEGY FOR POST-2000 PN 1458 ISSN PDF
 2008-2009 PROGRESS REPORT ON THE CANADA-WIDE ACID RAIN STRATEGY FOR POST-2000 PN 1458 ISSN 1911-1541 PDF Canadian Council of Ministers of the Environment 2011 The Canadian Council of Ministers of the Environment
United States and Canadian Hogs and Pigs
 United States and Canadian Hogs and Pigs Released October 28, 2004, by the National Agricultural Statistics Service (NASS),, U.S. Department of Agriculture. For information on call Dan Lofthus at 202-720-3106
NATIONAL INVENTORY OF PCBs IN USE AND PCB WASTES IN STORAGE IN CANADA 1995 ANNUAL REPORT
 NATIONAL INVENTORY OF PCBs IN USE AND PCB WASTES IN STORAGE IN CANADA 1995 ANNUAL REPORT PREPARED FOR THE CANADIAN COUNCIL OF MINISTERS OF ENVIRONMENT BY: COMMERCIAL CHEMICALS EVALUATION BRANCH ENVIRONMENTAL
Natural Resources: Major Projects Planned or Under Construction 2018 to 2028
 Natural Resources: Major Projects Planned or Under Construction 2018 to 2028 Energy and Mines Ministers Conference Iqaluit, Nunavut August 2018 Natural Resources: Major Projects Planned or Under Construction
Canadian International Merchandise Trade
 Catalogue no. 65-001-X Vol. 66, no. 9. Canadian International Merchandise Trade. Statistical tables Table 1 Merchandise trade of Canada, balance of payments basis, seasonally adjusted Current dollars Export
Canadian International Merchandise Trade
 Catalogue no. 65-001-X Vol. 69, no. 7. Canadian International Merchandise Trade. Statistical tables Table 1 Merchandise trade of Canada, balance of payments basis, seasonally adjusted - Current dollars
Canadian International Merchandise Trade
 Catalogue no. 65-001-X Vol. 69, no. 9. Canadian International Merchandise Trade. Statistical tables Table 1 Merchandise trade of Canada, balance of payments basis, seasonally adjusted - Current dollars
Canadian International Merchandise Trade
 Catalogue no. 65-001-X Vol. 69, no. 12. Canadian International Merchandise Trade. Statistical tables Table 1 Merchandise trade of Canada, balance of payments basis, seasonally adjusted - Current dollars
April An Analysis of New Brunswick s Productivity Performance, : Labour Productivity Driven by Capital Intensity Growth CENTRE FOR
 April 2011 111 Sparks Street, Suite 500 Ottawa, Ontario K1P 5B5 613-233-8891, Fax 613-233-8250 csls@csls.ca CENTRE FOR THE STUDY OF LIVING STANDARDS An Analysis of New Brunswick s Productivity Performance,
Catalogue no X. Electric Power Generation, Transmission and Distribution
 Catalogue no. 57-202-X Electric Power Generation, Transmission and Distribution 2006 How to obtain more information For information about this product or the wide range of services and data available from
Canada s Greenhouse Gas Emissions Understanding the Trends. November 2008
 1990 2006 Canada s Greenhouse Gas Emissions Understanding the Trends November 2008 Canada s Greenhouse Gas Emission Library and Archives Canada Cataloguing in Publication Canada s greenhouse gas emissions:
Natural Resources: Major Projects Planned or Under Construction 2018 to 2028
 Natural Resources: Major Projects Planned or Under Construction 2018 to 2028 Energy and Mines Ministers Conference Iqaluit, Nunavut August 2018 Natural Resources: Major Projects Planned or Under Construction
DEPARTMENT OF ENVIRONMENTAL AFFAIRS NO JULY 2017 DECLARATION OF GREENHOUSE GASES AS PRIORITY AIR POLLUTANTS
 710 National Environmental Management: Air Quality Act (39/2004): Declaration of Greenhouse Gases as priority air pollutants 40996 STAATSKOERANT, 21 JULIE 2017 No. 40996 65 DEPARTMENT OF ENVIRONMENTAL
Data Sources and Methods for the Release of Toxic Substances to Water Indicators. July 2013
 Data Sources and Methods for the Release of Toxic Substances to Water Indicators July 2013 ISBN : En4-144/26-2013E-PDF Cat. No.: 978-1-100-22485-5 Information contained in this publication may be reproduced,
Advancing Energy Technology and Innovation: Enhanced Strategic Collaboration between Federal, Provincial, and Territorial Governments
 Advancing Energy Technology and Innovation: Enhanced Strategic Collaboration between Federal, Provincial, and Territorial Governments Energy and Mines Ministers Conference St. Andrews by-the-sea, New Brunswick
Carbon Risks and Opportunities in the Mining Industry Edward C. (Ted) Bell, P. Eng. Partner, Tax Services May 16, 2012
 Bell, P. Eng. Partner, Tax Services May 16, 2012") www.pwc.com/ca Carbon Risks and Opportunities in the Mining Industry Edward C. (Ted) Bell, P. Eng. Partner, Tax Services Agenda Just a Few Basics Climate change Broad Context What are the Drivers behind
www.pwc.com/ca Carbon Risks and Opportunities in the Mining Industry Edward C. (Ted) Bell, P. Eng. Partner, Tax Services Agenda Just a Few Basics Climate change Broad Context What are the Drivers behind
Overview of Reviewed Facility-Reported Data. National Pollutant Release Inventory (NPRI) 2014
 2014") Overview of Reviewed Facility-Reported Data National Pollutant Release Inventory (NPRI) 2014 Contact Information Cat. No.: En81-24-E-PDF ISSN: 2369-7733 For more information on the National Pollutant Release
Overview of Reviewed Facility-Reported Data National Pollutant Release Inventory (NPRI) 2014 Contact Information Cat. No.: En81-24-E-PDF ISSN: 2369-7733 For more information on the National Pollutant Release
IRELAND S EMISSIONS OF GREENHOUSE GASES FOR THE PERIOD
 Summary IRELAND S EMISSIONS OF GREENHOUSE GASES FOR THE PERIOD 1990-2004 March 2006 The Environmental Protection Agency (EPA) has finalised its latest inventory of Ireland s Greenhouse Gas (GHG) emissions.
This Standard is adopted under The Management and Reduction of Greenhouse Gases (Reporting) Regulation.
 Regulation.") . Introduction This Standard is adopted under The Management and Reduction of Greenhouse Gases (Reporting) Regulation. 2. Definitions 2006 Intergovernmental Panel on Climate Change (IPCC) Guidelines means
. Introduction This Standard is adopted under The Management and Reduction of Greenhouse Gases (Reporting) Regulation. 2. Definitions 2006 Intergovernmental Panel on Climate Change (IPCC) Guidelines means
Ireland s Provisional Greenhouse Gas Emissions
 Ireland s Provisional Greenhouse Gas Emissions 1990-2017 December 2018 CONTENTS KEY HIGHLIGHTS... 3 Introduction... 4 Ireland s Greenhouse Gas Emissions in 2017... 4 Changes in Emissions from Sectors between
National Inventory of PCBs in Use and PCB Wastes in Storage in Canada
 National Inventory of PCBs in Use and PCB Wastes in Storage in Canada 1997 Annual Report Prepared for Canadian Council of Ministers of the Environment by Toxics Pollution Prevention Directorate Environmental
Farm Credit Corporation (FCC) estimates that Canadian farmland values
 estimates that Canadian farmland values") Spring 1999 Farmland Values F a r m C r e d i t C o r p o r a t i o n National trends Methodology 2 Provincial trends Farm Credit Corporation (FCC) estimates that Canadian farmland values rose by only
Spring 1999 Farmland Values F a r m C r e d i t C o r p o r a t i o n National trends Methodology 2 Provincial trends Farm Credit Corporation (FCC) estimates that Canadian farmland values rose by only
NATIONAL POLLUTION PREVENTION PLANS REGULATIONS THE NATIONAL CLIMATE CHANGE RESPONSE POLICY
 NATIONAL POLLUTION PREVENTION PLANS REGULATIONS THE NATIONAL CLIMATE CHANGE RESPONSE POLICY AIR QUALITY GOVERNANCE LEKGOTLA 4 OCTOBER 2016 Purpose of the Presentation Request the 11 th Air Quality Governance
Pan-Canadian Approach to Carbon Pricing. High Level Regional Dialogue on Carbon Pricing January 22, 2018 Environment and Climate Change Canada
 Pan-Canadian Approach to Carbon Pricing High Level Regional Dialogue on Carbon Pricing January 22, 2018 Environment and Climate Change Canada Pan-Canadian Carbon Pricing Benchmark Timely introduction (in
Report May The Economic and Employment Impacts of Climate-Related Technology Investments. Energy, Environment and Transportation Policy
 Report May 2010 The Economic and Employment Impacts of Climate-Related Technology Investments Energy, Environment and Transportation Policy The Economic and Employment Impacts of Climate-Related Technology
Catalogue no. 16F0023X. Waste Management Industry Survey: Business and Government Sectors
 Catalogue no. 16F0023X Waste Management Industry Survey: Business and Government Sectors 2006 How to obtain more information For information about this product or the wide range of services and data available
Ireland s Final Greenhouse Gas Emissions
 Ireland s Final Greenhouse Gas Emissions 1990-2016 April 2018 CONTENTS KEY HIGHLIGHTS... 2 Introduction... 3 Ireland s Greenhouse Gas Emissions in 2016... 3 Changes in Emissions from Sectors between 2015
Operating revenues of businesses in the Employment Services Industry decreased 7.1% in 2009, dropping to $8.7 billion from a year earlier.
 Catalogue no. 63-252-X. Service bulletin Employment Services 2009. Highlights Operating revenues of businesses in the Employment Services Industry decreased 7.1% in 2009, dropping to $8.7 billion from
April An Analysis of Newfoundland and Labrador s Productivity, : Mining, and Oil and Gas Extraction Drives Strong Productivity Growth
 April 2011 111 Sparks Street, Suite 500 Ottawa, Ontario K1P 5B5 613-233-8891, Fax 613-233-8250 csls@csls.ca CENTRE FOR THE STUDY OF LIVING STANDARDS An Analysis of Newfoundland and Labrador s Productivity,
Ireland s Provisional Greenhouse Gas Emissions
 Ireland s Provisional Greenhouse Gas Emissions 1990-2016 November 2017 CONTENTS KEY HIGHLIGHTS... 2 Introduction... 3 Ireland s Greenhouse Gas Emissions in 2016... 3 Changes in Emissions from Sectors between
FutureMetrics LLC 8 Airport Road Bethel, ME 04217, USA
 Why is the Heating Pellet Market in Canada so Small? Why One Province Will Soon Embrace Pellets for Heating! By William Strauss, PhD October 30, 2015 The US heating pellet market consumes an estimated
Saskatchewan Labour Force Statistics
 Saskatchewan Labour Force Statistics February 2018 UNADJUSTED DATA According to the Statistics Canada Labour Force Survey during the week covering February 11 th to 17 th,, 2018, there were 555,800 persons
Statistical Overview of the Canadian Honey and Bee Industry and the Economic Contribution of Honey Bee Pollination
 Statistical Overview of the Canadian Honey and Bee Industry and the Economic Contribution of Honey Bee Pollination 2013-2014 Prepared by: Horticulture and Cross Sectoral Division Agriculture and Agri-Food
Saskatchewan Labour Force Statistics
 Saskatchewan Labour Force Statistics June 2017 UNADJUSTED DATA According to the Statistics Canada Labour Force Survey during the week covering June 11 th to 17 th,, 2017, there were 579,800 persons employed
Peter Smith P.Eng and Guy Van Uytven, M. Eng., MBA, P.Eng., FCSSE
 Peter Smith P.Eng and Guy Van Uytven, M. Eng., MBA, P.Eng., FCSSE Warming of the climate system is unequivocal, human influence on the climate system is clear, and limiting climate change will require
Regional Electricity Cooperation and Strategic Infrastructure (RECSI) ATLANTIC REGION. Summary AR-SPM FOR POLICY MAKERS
 ATLANTIC REGION. Summary AR-SPM FOR POLICY MAKERS") Regional Electricity Cooperation and Strategic Infrastructure (RECSI) ATLANTIC REGION Summary FOR POLICY MAKERS AR-SPM Aussi disponible en français sous le titre : Initiative de collaboration régionale
Regional Electricity Cooperation and Strategic Infrastructure (RECSI) ATLANTIC REGION Summary FOR POLICY MAKERS AR-SPM Aussi disponible en français sous le titre : Initiative de collaboration régionale
This article deals with the recent increase in the number
 Electoral and Political Implications Of a Larger Canadian Parliament Roberto Zepeda Martínez* This article deals with the recent increase in the number of seats in Canada s Parliament from 308 to 338,
Form F5 Change of Registration Information (sections 3.1 and 4.1)
") Form 33-109F5 Change of Registration Information (sections 3.1 and 4.1) General Instructions Complete and submit this form to notify the relevant regulator(s) or, in Québec, the securities regulatory authority,
Form 33-109F5 Change of Registration Information (sections 3.1 and 4.1) General Instructions Complete and submit this form to notify the relevant regulator(s) or, in Québec, the securities regulatory authority,
Saskatchewan Labour Force Statistics
 Saskatchewan Labour Force Statistics March 2018 UNADJUSTED DATA According to the Statistics Canada Labour Force Survey during the week covering March 11 th to 17 th,, 2018, there were 562,700 persons employed
NOVA Gas Transmission Ltd NGTL System Expansion Project Review of Related Upstream Greenhouse Gas Emissions Estimates
 NOVA Gas Transmission Ltd. 2017 NGTL System Expansion Project Review of Related Upstream Greenhouse Gas Emissions Estimates Draft for Public Comments June 1, 2016 This page intentionally left blank. 2
New Zealand Energy Sector Greenhouse Gas Emissions
 Energy and Building Trends New Zealand Energy Sector Greenhouse Gas Emissions 2015 Calendar Year Edition Ministry of Business, Innovation and Employment (MBIE) Hīkina Whakatutuki Lifting to make successful
B.C./CANADA STATISTICS
 B.C./CANADA STATISTICS CONTENTS 3 B.C./Canada Statistics 3.1 Forestry Practices... 78 Total Crown and private land available for timber production in 1991, by province... 78 Allowable annual cut on Crown
Data Sources and Methods for the International Comparison of Air Pollutant Emissions Indicators. June 2015
 Data Sources and Methods for the International Comparison of Air Pollutant Emissions Indicators June 2015 Suggested citation for this document: Environment Canada (2015) Canadian Environmental Sustainability
Saskatchewan Labour Force Statistics
 Saskatchewan Labour Force Statistics April 2018 UNADJUSTED DATA According to the Statistics Canada Labour Force Survey during the week covering April 15 th to 21 st, 2018, there were 558,300 persons employed
31 st March 2011 STATISTICAL RELEASE
 31 st March 2011 STATISTICAL RELEASE UK CLIMATE CHANGE SUSTAINABLE DEVELOPMENT INDICATOR: 2010 GREENHOUSE GAS EMISSIONS, PROVISIONAL FIGURES AND 2009 GREENHOUSE GAS EMISSIONS, FINAL FIGURES BY FUEL TYPE
BEHIND THE NUMBERS. Who Occupies the Sky? The Distribution of GHGs in Canada. By Marc Lee and Amanda Card. The Distribution of Canada s Emissions
 BEHIND THE NUMBERS economic facts, figures and analysis November 2011 Who Occupies the Sky? The Distribution of GHGs in Canada By Marc Lee and Amanda Card To create effective policy for reducing greenhouse
Council of the Federation Founding Agreement
 Council of the Federation Founding Agreement Preamble Premiers agreed to create a Council of the Federation, as part of their plan to play a leadership role in revitalizing the Canadian federation and
Farm and Off-Farm Income Statistics
 Catalogue no. 21-019-XIE Farm and Off-Farm Income Statistics 2001 Statistics Canada Statistique Canada How to obtain more information Specific inquiries about this product and related statistics or services
Impacts of. Canada s Cleaner Energy Exports. Global Greenhouse Gas Emissions. Whistler, B.C. Canada. May 2002
 Impacts of Canada s Cleaner Energy Exports on Global Greenhouse Gas Emissions Whistler, B.C. Canada May 2002 1. Introduction The North American economy is highly integrated. Canada and the United States
UPDATE ON THE ECONOMIC IMPACTS OF THE CANADIAN DAIRY INDUSTRY IN 2015
 UPDATE ON THE ECONOMIC IMPACTS OF THE CANADIAN DAIRY INDUSTRY IN 2015 Prepared for Dairy Farmers of Canada July 2016 Siège social : 825, rue Raoul-Jobin, Québec (Québec) Canada, G1N 1S6 Montréal : 201-1097,
Saskatchewan Labour Force Statistics
 Saskatchewan Labour Force Statistics June 2018 UNADJUSTED DATA According to the Statistics Canada Labour Force Survey during the week covering June 10 th to 16 th, 2018, there were 583,700 persons employed
Greenhouse Gases and Water Use Planning
 Greenhouse Gases and Water Use Planning Introduction The Water Use Planning (WUP) process being applied to BC Hydro's hydroelectric facilities is a collaborative process that strives to reach agreement
PUBLICATIONS. SPP Research Paper BIG AND LITTLE FEET: A COMPARISON OF PROVINCIAL LEVEL CONSUMPTION- AND PRODUCTION-BASED EMISSIONS FOOTPRINTS
 PUBLICATIONS SPP Research Paper Volume 10:23 September 2017 BIG AND LITTLE FEET: A COMPARISON OF PROVINCIAL LEVEL CONSUMPTION- AND PRODUCTION-BASED EMISSIONS FOOTPRINTS Sarah Dobson and G. Kent Fellows
We grow a lot more than you may think
 We grow a lot more than you may think Find out what makes our agriculture and agri-food industry the apple of Canada s eye Agriculture and Agri-Food Canada Agriculture et Agroalimentaire Canada Ag Facts
Bullfrog Power Green Energy Audit Report 2016 Table of Contents
 Bullfrog Power Green Energy Audit Report 2016 Table of Contents Bullfrog Power Green Energy Audit Report 2016 Bullfrog Audit Report 2016 Table of Contents Table of Contents Sale of Green Electricity and
Research Manitoba Greenhouse Gas Emissions, Reduction Targets, Reporting, Actions
 Research Manitoba Greenhouse Gas Emissions, Reduction Targets, Reporting, Actions Manitoba Wildlands compiled this research document in August 2007 to provide a picture of public, web-based information
QUEEN S UNIVERSITY GREENHOUSE GAS EMISSIONS INVENTORY SUMMARY 2015
 QUEEN S UNIVERSITY GREENHOUSE GAS EMISSIONS INVENTORY SUMMARY 2015 INTRODUCTION In 2010, Queen s University signed onto the University and College Presidents Climate Change Statement of Action for Canada,
British Columbia s Merchandise Trade with the World
 British Columbia s Merchandise Trade with the World Publication No. 2014-29-E 17 June 2014 Alexandre Gauthier Economics, Resources and International Affairs Division Parliamentary Information and Research
Fuel Focus. Understanding Gasoline Markets in Canada and Economic Drivers Influencing Prices. Issue 16, Volume 9
 Fuel Focus Understanding Gasoline Markets in Canada and Economic Drivers Influencing Prices Issue 16, Volume 9 September, 14 Copies of this publication may be obtained free of charge from: Natural Resources
PROVINCIAL-TERRITORIAL APPRENTICE MOBILITY GUIDELINES
 PROVINCIAL-TERRITORIAL APPRENTICE MOBILITY GUIDELINES SEPTEMBER 2017 1 TABLE OF CONTENTS About These Guidelines... 3 Provincial-Territorial Apprentice Mobility Transfer Guide... 3 1.0 Background... 3 2.0
Progress Report on The Canada-Wide Acid Rain Strategy for Post-2000
 2006-2007 Progress Report on The Canada-Wide Acid Rain Strategy for Post-2000 Federal/Provincial/Territorial Ministers of Energy and Environment ISSN 1911-1541 PN 1410 2006-2007 Progress Report on The
Fuel Focus. Understanding Gasoline Markets in Canada and Economic Drivers Influencing Prices. Issue 2, Volume 9
 Fuel Focus Understanding Gasoline Markets in Canada and Economic Drivers Influencing Prices Issue 2, Volume 9 February 21, 14 Copies of this publication may be obtained free of charge from: Natural Resources
The impact of the federal government s proposed electricity coal performance standards
 April 2012 : The impact of the federal government s proposed electricity coal performance standards A Product of IISD s Climate Insights Dave Sawyer and Seton Stiebert Overview The federal government has
MARKET STUDY ON WASTE HEAT AND REQUIREMENTS FOR COOLING AND REFRIGERATION IN CANADIAN INDUSTRY: OPPORTUNITIES FOR HEAT PUMPING TECHNOLOGIES
 - 1 - MARKET STUDY ON WASTE HEAT AND REQUIREMENTS FOR COOLING AND REFRIGERATION IN CANADIAN INDUSTRY: OPPORTUNITIES FOR HEAT PUMPING TECHNOLOGIES Daniel Giguère, Eng, Technology expert, CETC-Varennes,
Budget Paper E MADE-IN-MANITOBA CLIMATE AND GREEN PLAN
 Budget Paper E MADE-IN-MANITOBA CLIMATE AND GREEN PLAN MADE-IN-MANITOBA CLIMATE AND GREEN PLAN CONTENTS A MADE-IN-MANITOBA CARBON TAX... CARBON SAVINGS ACCOUNT... OUTPUT-BASED PRICING SYSTEM... CLIMATE
Facility Greenhouse Gas Emissions Reporting. Technical Guidance on Reporting Greenhouse Gas Emissions
 Facility Greenhouse Gas Emissions Reporting Technical Guidance on Reporting Greenhouse Gas Emissions October 2014 En81-6/2014E-PDF ISSN: 1719-0487 Unless otherwise specified, you may not reproduce materials
Greenhouse Gas Emissions in New Jersey
 Greenhouse Gas Emissions in New Jersey New Jersey Department of Environmental Protection Office of Climate and Energy Air and Waste Management Association February 23, 2010 Background Statewide Greenhouse
LAND CAPABILITY FOR AGRICULTURE PRELIMINARY REPORT
 LAND CAPABILITY FOR AGRICULTURE PRELIMINARY REPORT The Canada Land Inventory Report No. 10 1976 Reprinted 1977, 1978 LAND CAPABILITY FOR AGRICULTURE CANADA LAND INVENTORY A PRELIMINARY REPORT Environment
IRELAND S GREENHOUSE GAS EMISSIONS IN 2012 KEY HIGHLIGHTS
 EPA Headquarters PO Box 3000 Johnstown Castle Estate County Wexford, Ireland T +353 53 9160600 LoCall 1890 33 55 99 www.epa.ie 15 th April 2014 IRELAND S GREENHOUSE GAS EMISSIONS IN 2012 KEY HIGHLIGHTS
Where Do We Go From Here? Magnusson Consulting Group 1
 Where Do We Go From Here? Magnusson Consulting Group 1 Agenda Global Economic Outlook Effects on Agriculture Impact of China Us & Canadian Economy Oil & Gas Carbon Tax Magnusson Consulting Group 2 Impact
QUEEN S UNIVERSITY GREENHOUSE GAS INVENTORY REPORT 2017
 QUEEN S UNIVERSITY GREENHOUSE GAS INVENTORY REPORT 2017 September 2018 INTRODUCTION In 2010, Queen s University signed the University and College Presidents Climate Change Statement of Action for Canada,
Written Submission to the Labour Relations Code Review Panel
 Written Submission to the Labour Relations Code Review Panel Submitted by the International Brotherhood of Boilermakers, Iron Ship Builders, Blacksmiths, Forgers and Helpers (affiliated with the AFL-CIO
3. Energy. Figure 3-1: 2009 Energy Chapter Greenhouse Gas Sources. Figure 3-2: 2009 U.S. Fossil Carbon Flows (Tg CO 2 Eq.)
") 3. Energy Energy-related activities were the primary sources of U.S. anthropogenic greenhouse gas emissions, accounting for 86.7 percent of total greenhouse gas emissions on a carbon dioxide (CO 2 ) equivalent
3. Energy Energy-related activities were the primary sources of U.S. anthropogenic greenhouse gas emissions, accounting for 86.7 percent of total greenhouse gas emissions on a carbon dioxide (CO 2 ) equivalent
Supporting skills development in small- and medium-size enterprises
 Supporting skills development in small- and medium-size enterprises Jean-Pierre Voyer, SRDC Canada-Manitoba Roundtable on SMEs and Skills Development, Winnipeg, February 10, 2011 THE RESEARCH MANDATE 1.
FORM F3 BUSINESS LOCATIONS OTHER THAN HEAD OFFICE (section 3.2)
") FORM 33-109F3 BUSINESS LOCATIONS OTHER THAN HEAD OFFICE (section 3.2) GENERAL INSTRUCTIONS Complete and submit this form to notify the relevant regulator(s) or, in Québec, the securities regulatory authority,
FORM 33-109F3 BUSINESS LOCATIONS OTHER THAN HEAD OFFICE (section 3.2) GENERAL INSTRUCTIONS Complete and submit this form to notify the relevant regulator(s) or, in Québec, the securities regulatory authority,
Transportation:
 September 2002 F a c t s h e e t 3 Transportation: 1990-2000 The Transportation sector includes estimates of all human induced greenhouse gases (GHG) resulting from the consumption of fossil fuels to move
CANADIAN CRUDE OIL AND NATURAL GAS PRODUCTION, SUPPLY COSTS, ECONOMIC IMPACTS
 Study No. 173 CANADIAN ENERGY RESEARCH INSTITUTE CANADIAN CRUDE OIL AND NATURAL GAS PRODUCTION, SUPPLY COSTS, ECONOMIC IMPACTS AND EMISSIONS OUTLOOK (2018-2038) Canadian Energy Research Institute Relevant
Clark University Greenhouse Gas Emissions Update: Clark University on Track for Carbon Reduction and Carbon Neutrality Goals.
 Clark University Greenhouse Gas Emissions Update: 2012 Clark University on Track for Carbon Reduction and Carbon Neutrality Goals Background In June 2007 President Bassett signed the American College and
A Checklist for Alberta s Climate Change Plan: What to Look for in a Comprehensive Action Plan for Alberta to Fight Global Warming
 A Checklist for Alberta s Climate Change Plan: What to Look for in a Comprehensive Action Plan for Alberta to Fight Global Warming By Marlo Raynolds 1 January 2008 Context: The Government of Alberta completed