System Dynamics Modeling of Corn Ethanol as a Bio Transportation Fuel in the United States
|
|
|
- Archibald Townsend
- 6 years ago
- Views:
Transcription

1 University of Nebraska Lincoln of Nebraska Lincoln Publications, Agencies and Staff of the U.S. Department of Commerce U.S. Department of Commerce 21 System Dynamics Modeling of Corn Ethanol as a Bio Transportation Fuel in the United States Deogratias Kibira National Institute of Standards and Technology Guodong Shao National Institute of Standards and Technology Stephen Nowak Franciscan University of Steubenville Follow this and additional works at: Part of the Environmental Sciences Commons Kibira, Deogratias; Shao, Guodong; and Nowak, Stephen, "System Dynamics Modeling of Corn Ethanol as a Bio Transportation Fuel in the United States" (21). Publications, Agencies and Staff of the U.S. Department of Commerce This Article is brought to you for free and open access by the U.S. Department of Commerce at DigitalCommons@University of Nebraska Lincoln. It has been accepted for inclusion in Publications, Agencies and Staff of the U.S. Department of Commerce by an authorized administrator of DigitalCommons@University of Nebraska Lincoln.
2 [April 21] System Dynamics Modeling of Corn Ethanol as a Bio Transportation Fuel in the United States Deogratias Kibira 1, Guodong Shao 1, and Stephen Nowak 2 1 Manufacturing Systems Integration Division, National Institute of Standards and Technology, Gaithersburg, MD 2899, USA; 2 Franciscan University of Steubenville, Steubenville, OH 43952, USA. Abstract The production capacity of corn ethanol as a transportation fuel is experiencing rapid growth in the United States. The demand is driven by increased prices of gasoline, government mandates, incentives, desire for cleaner fuels, and the need to achieve energy independence. Continued strong growth of the corn ethanol industry will depend on profitability by both suppliers and producers. This in turn will be influenced by several factors such as demand, government incentives, feedstock availability and prices, processing plant capacity, and efficient farm and ethanol processing technologies. How and to what extent will the projected growth of the corn ethanol industry in the United States be influenced by some or all of these factors? We use system dynamics modeling to construct the causalloop structure of the corn ethanol industry and a stock and flow diagrams to explore how changes in projected factors will affect the industry. Currently, planners and researchers explore various energy supply options by the year 23, when world energy usage is expected to double that of 29. By developing and executing a system dynamics model, this paper explores different possible growth scenarios of the industry for the next twenty one years. Keywords: Renewable energy; Energy independence; Corn ethanol production; System dynamics 1. Introduction The United States (U.S.) is facing increasing energy costs and environmental pressures calling for reduction in greenhouse gas emissions. A solution to escalating costs of imported oil is to promote renewable energy sources such as ethanol. Brazil has managed to develop a fuel ethanol industry based on sugar cane. The U.S., on the other hand, has been primarily producing ethanol using corn as feedstock. Ethanol is produced by process manufacturing. But since it is a cleaner fuel its wider application in transportation and manufacturing would promote sustainable manufacturing, which is a core research topic in the Manufacturing Systems Integration Division (MSID) at the National Institute of Standards and Technology (NIST). This section discusses the current state of the ethanol industry in the U.S. and its effect on other sectors such as food prices. An overview of system dynamics modeling for energy analysis is presented along with the contents of the rest of the paper. 1.1 Background to energy needs and policy Fossil fuels such as coal, oil, and gas are the major source of world energy, accounting for more than 8 % of the total energy produced [1]. Petroleum oil is the preeminent source of transportation energy. As of 28 the U.S. consumes about 2 million barrels of oil per day, 6 % of which is imported [2]. The price of oil has been escalating because of increasing demand, 1
3 especially from energy intensive economies of developing countries, geopolitics, and speculation about shortage of supplies, among other factors. The average price of oil during the 199s was $2 per barrel but rose to an average of $59 during 26. The highest price of oil exceeded $14 per barrel during 28 [3]. Although the credit crunch later in the year 28 saw a fall to $3 per barrel, the price of oil started going up again to more than $7 during 29 and is expected to continue rising. In addition to price, the U.S. is interested in developing cleaner and renewable energy technologies for environmental protection, and to reduce greenhouse gases emissions. As an alternative to oil for transportation, the U.S. is developing and planning to produce renewable energies such as bio fuels on a large scale. Ethanol is one of the bio fuels with potential to promote energy independence. In 26 President George Bush outlined the Advanced Energy Initiative, which among other objectives, aims to reduce reliance on foreign energy sources [4]. A study by the Department of Energy/United States Department of Agriculture (DOE/USDA) suggests that with aggressive technology developments, bio fuels could potentially supply 6 billion gallons 1 (238 billion liter) of ethanol by the year 23, which is 3 percent of the nation s current use of gasoline [4]. The ethanol plan is continued in the current administration. Ethanol is a highoctane fuel that can be used as a gasoline additive and extender. It can be produced by the fermentation of carbohydrates such as sugar, starch, and cellulose. The U.S. produces 97 % of its ethanol from corn [5]. In addition, a study by the U.S. Department of Agriculture has shown that it is also economically feasible for the U.S. to produce ethanol from sugar crops adapted to U.S. weather conditions [6]. After all, the energy requirements for producing ethanol from sugar are half the requirements for production from corn. Cellulose ethanol production is also underway on a pilot scale. To promote the ethanol industry, the government has instituted a subsidy of $.45 per gallon ($.11 per liter), although this is set to expire in 21. Imported ethanol is subject to a 2.5 % ad valorem tariff and a secondary tariff of $.54 per gallon ($.14 per liter). The total tariff for ethanol imported at a price of $2. per gallon is $.59 ($.15 per liter). In addition, the depreciation of the U.S. dollar has pushed Brazilian ethanol per gallon from $1.1 to between 1.2 and $1.7 even though domestically in Brazil the cost has changed little [5]. The process of ethanol production in the plant requires electricity and direct thermal energy. Much of this energy is produced by burning fossil fuels. How sustainable is corn ethanol in terms of net savings in environmental pollution and carbon emissions in comparison with using pure gasoline? To answer this question, estimates put the lifecycle reduction in CO 2 pollution to be about 2 % in comparison with using pure gasoline [7]. In addition, ethanol energy requirements are met using coal, natural gas, nuclear, and other sources that are domestically available. Thus, overall ethanol contributes to energy independence regardless of its requirements for production. The price of gasoline is estimated to be less by between $.19 and $.4 per gallon because of the effect of the presence of ethanol [8]. This reduction in price benefits motorists directly. The system dynamics model uses currently available information and forecasts to determine corn availability, production capacity, ethanol blend demand, and cost and revenue elements. The model can be run using different scenarios of demand and costs of corn, energy, and corresponding incomes from ethanol and animal feeds. The different scenarios obtained after model runs are not predictions but a starting point to discuss possible alternative outcomes. 1 1 gallon = 3.79 liter 2
4 1.2 Current state of corn ethanol production Fuel ethanol is an alcoholic product of fermentation of carbohydrates. It is the same as that produced in spirits, wine, beers, etc. but is highly concentrated. Ethanol is produced by process type of industry where the materials required for a final product are mixed in given proportions at various stages in manufacturing, requires energy inputs, and involves chemical transformation. It requires continuous production and the final product is made in bulk. Such industries include chemical production, food and beverages, pharmaceuticals, and petroleum products. This is contrasted with discrete manufacturing where a product is made or assembled individually. The Manufacturing Engineering Laboratory (MEL) at NIST largely researches in discrete manufacturing. But, as mentioned earlier, the promotion and production of cleaner fuels like ethanol has implications on sustainable manufacturing. Through the Sustainable and Lifecycle Informationbased Manufacturing (SLIM) project, the MEL is developing information technologies and standardsbased technologies to product lifecycle problems. The use of ethanol in industry and in transportation would reduce manufacturers carbon footprint. There are two major industrial methods for producing ethanol; wet milling and dry milling. Wet milling, where the grain is first soaked in water, is used to produce many products such as high fructose corn syrup (HFCS), biodegradable plastics, food additives, and corn oil besides the fuel ethanol. The process of soaking the grain softens it making it easier to separate the starch, fiber, and germ, which are processed separately into the variety of products. This process requires more capital investment. With dry milling, on the other hand, the whole grain is processed and the residual components are separated at the end of the process [9]. In both processes, enzymes break down the starch from the corn into sugar. Ethanol is in turn produced by yeast fermentation of the sugars and has to be extracted from the corn mash by distillation. About 7 % of the U.S. ethanol is produced by dry milling. Both processes produce animal feeds as useful byproducts. The corn ethanol produced in the U.S. in 26 consumed 2.2 billion bushels 2 (55.9 million metric tons) of corn. To cope with increased demand for ethanol, corn yields are expected to increase. Corn available for ethanol production is projected to be 12 billion bushels (35 million metric tons) by the year 23 [11]. This will be against a total corn production projected to be 15.7 billion bushels (4 million metric tons) in 215, 19.2 billion bushels (488 million metric tons) in 22, and 24.6 (625 million metric tons) billion bushels in 23. Using this information, we can project the total corn availability for ethanol production each year starting with 29 when ethanol production is expected to be 1.5 billion gallons (39.8 billion liter). Each bushel of corn currently yields 2.75 gallons (1.4 liter) of ethanol and 17 pounds (7.7 kg) of dried distiller s grains with solubles (DDGS). The ethanol yield is expected to increase to 2.9 gallons (11. liter) per bushel by 23. Wet milling also produces corn gluten meal (CGM) and corn gluten feed (CGF). Each liter of ethanol consumes.18 kwh of electrical energy to produce or.69 kwh per gallon. Improvements in processing technology are projected to reduce this energy requirement to.98 kwh per liter by 23 [11]. As of 29 each bushel costs about $4. ($158. per metric ton) while ton of DDGS fetches $12. ($19. per metric ton). CGM and CGF sell for approximately $5 per ton ($45 per metric ton). The proceeds from the sale of these byproducts contribute to profitability of corn ethanol. The net distribution costs are approximately $.45 per gallon ($.12 per liter). 2 1 bushel = 25.4 kg 3
5 The U.S. is now the world s largest producer of ethanol fuel having produced 9 billion gallons (34 billion liter) during 28 and surpassed Brazil that produced 6.47 billion gallons (25 billion liter) in the same year. The U.S. industry consists of 17 plants operating in 26 states. Increasing investments in ethanol production have pushed the installed capacity to 12 billion gallons (45 billion liter) during the year 29, although production is estimated to be 1.5 billion gallons (4 billion liter) [7]. Three plants using sugarcane adapted to U.S. weather were planned to be installed in 29 [6]. The U.S. government is advocating a policy for increased use of ethanol in automotive transportation. As of September 29, there were ten states that mandated a 1 % ethanol mixed with gasoline (E1) and federal government wants to increase this blending level to 15 % (E15) [12]. To understand the implications of further expansion of corn ethanol the structure of the industry needs to be investigated. As such, many questions can be asked, for example; what will be the effect of additional ethanol production on the price of gasoline? What would happen if government subsidy is removed? What will be the effect of water usage during corn production and in ethanol processing? What will be the effect of oil prices on the costbenefit of producing ethanol? What would happen if there is sudden increase in demand of ethanol in future compared with what is projected? What is the effect on food availability and food prices? A previous model seems to suggest that promoting food sources as feedstock for biofuels would lead to increase in food prices in the long run [13]. The rest of the paper is arranged as follows. Section 2 introduces system dynamics and describes how it can be used to model energy problems. Section 3 describes the causal loop diagram of the ethanol system, the supply chain for ethanol, the boundaries of the problem modeled in the paper, and the stock and flow diagram. Section 4 is model testing and executing. It also describes the model behavior under different scenarios. Section 5 discusses and concludes the paper. 2. Modeling ethanol fuel dynamics 2.1 Introduction to system dynamics System dynamics modeling was developed by researchers led by Forrester at the Sloan School of Management at Massachusetts Institute of Technology in the late 195s [14]. This was after realizing that management sciences were not providing enough understanding of complex systems. Forrester defined Industrial Dynamics as the study of the informationfeedback characteristic of industrial activity to show how organization structure, amplification, and time delays interact to influence the success of the enterprises [15]. Industrial dynamics later became to be known as System dynamics. System dynamics deals with feedback and delays that affect system behavior over time. It has had greater use in policy analysis and design. It addresses a problem based on the premise that the structure of a system, that is the way the essential system components are connected, generates its behavior. Two essential features of the system have to be i) they are dynamic and ii) they have a feedback where item x affects another item y and y in turn affects x perhaps through a chain of causes and effects. There are two major stages in developing a system dynamics model. The first stage is to construct building blocks relating to the cause and effect of the behavior of factors in the system. This is called the causal loop diagram (CLD). With the CLD you can graphically visualize the interrelationships between different factors relevant to the system. The factors are connected by 4
6 links, which are often drawn as arrows. If an arrow goes from A to B it indicates that factor A causes factor B. A polar sign is added between connecting arrows to indicate the direction that one factor influences another. A positive sign indicates that one factor influences the other positively, while a negative sign means that the factor influences the other negatively. The second stage is to develop a quantitative model and represent it in terms of flow rates, levels and delays. And most importantly, studying the link between x and y independent of other links between y and x cannot predict how the system will behave. Rather the study of the system as a whole with its feedback links can lead to correct conclusions and understanding. System dynamics involves studying the impact of delays on system behavior. Specifically, what are the implications when a cause takes a long time to exert its effect? System dynamics has been used to model dynamic systems with different time and spatial scale [16]. It can model the behavior of systems in diverse areas such as economics and other social sciences, supply chain, education policy, biology, and engineering. A number of systems dynamics simulation tools such are available on the market. 2.2 System dynamics and energy modeling One of the earliest major applications of system dynamics in policy oriented modeling was the World3 model, published in 1972 [17]. The World3 model preceded Forrester s World2 model of These models were used to predict that the current usage and depletion of natural resources as the basis for economic growth, coupled with exponential population growth will impose limits to physical growth sometime during the 21 st century. More than 3 years after publication of World3 a new version called World33 was developed. It included more scenarios than previous models. This model is explained in Limits to Growth The 3 Year Update [18]. This model explains that the current unprecedented growth in population, food production, resource consumption, and industrial production cannot be sustained in the long run without exceeding the earth s limits. If this ever happens, the natural system, industrial and agricultural production, and human population would inevitably collapse. However, the model shows that if humanity adopts technology that uses renewable resources, controls population growth, and reduces pollution, this collapse would be avoided and the resulting world would sustain high living standards and human welfare. Early energy models such as those developed by Naill [19] and Sterman [2] were used to model fossil fuel usage. An investigation and modeling framework for transition to bio fuels has been developed [21]. The outcome of such models can be used to determine and direct energy policy to help alleviate potential economic and social problems. System dynamics models have been developed in a number of bio fuel situations but overall the literature available on the subject is still relatively scanty. In the Noblis corporate energy initiative, it is proposed that system dynamics could aid in assessing energy supplychain scenarios to manage the transition to a more sustainable energy future [22]. Bush et al. [23] use system dynamics to explore potential market penetration scenarios for bio fuels in the U.S. The investigation into bioenergy and land use to understand the interaction between economic conditions and land competition between different crops using system dynamics is done by Scheffran et al. [24]. While Franco et al. use system dynamics to understand the difficulties in fulfilling government requirements for biofuels blending and to evaluate the effect of different government policies in the production of ethanol and biodiesel [25]. A systems dynamics modeling in the U.S. Department of Energy biomass program is described in Riley et al. [26]. 5
7 Regarding ethanol modeling, West [27] along with other researchers at Sandia National Laboratories and General Motors, describe a system dynamics model to investigate the feasibility, economics and environmental impact of producing 9 billion gallons (341 billion liter) of ethanol per year by 23. There is also a system dynamics model for forecasting the future of bio diesel production growth in the U.S. [28]. This model has conducted sensitivity analysis to determine the parameters that most affect the feasibility, cost competitiveness, and greenhouse gas impact of large scale bio diesel production. This model investigates the effect of several key factors such as market growth, government incentives, stock prices, etc. on the viability and sustained growth of the industry. Our motivation for corn ethanol is similar to that of this bio diesel research. 3. Model conceptualization This section discusses the causal loop diagram and stock and flow diagrams of the corn ethanol system. We used the system dynamics modeling tool Vensim, which allows the analyst to connect words with arrows representing relationships between variables and recorded as causal relationships. The stock and flow diagram of the ethanol system in Vensim is made up of variables auxiliaries or constants, box variables that represent stocks/accumulations [29]. This information is used by the equation editor to complete the modeling process. 3.1 The causal loop diagram Figure 1 shows the causal loop diagram of the corn ethanol industry system. These factors show the interactions and relationships between the corn ethanol industry and the overall transportation energy, corn production, and food systems. The diagram comprises of multiple loops that show how corn production, corn price, level of ethanol production, government tax incentives and oil price influence the industry. We examine a loop that starts with the Corn ethanol production factor, as an example. An increase in Corn ethanol production influences a reduction in Ethanol price. But an increase in Ethanol price decreases Ethanol demand, hence the negative polarity of the connecting arrow. Since we have a decrease in Ethanol price there will be an increase of Ethanol demand followed by the Gap between ethanol demand and supply. This will call for both increased Ethanol production investment and demand for more Allocation of corn to ethanol production. An arrow closes the loop with positive polarity since an increase in Allocation of corn to ethanol production means an increase in Corn ethanol production. This loop represents an example of positive feedback selfreinforcing process. However, the loop would be prevented from increasing the levels of each factor indefinitely because other factors outside the loop such as Total production costs actually influence the Ethanol price. Gasoline price also influences Ethanol demand. Another example starts with Profitability, which when it increases will positively affect further Ethanol production investment and Allocation of corn to ethanol production. The effect of this is to increase Corn ethanol production and decrease the Ethanol price by the forces of supply and demand. A lower Ethanol price would mean reduced Profitability. This is an example of a self balancing loop, where growth is attenuated and checked from within the loop. Such a subsystem would tend to be innately stable. 6
8 Transportation costs Water and energy usage at farm Water and energy costs at farm Agricultural efficiency Available agricultural farmland Corn production Farmland for corn farming Environmental pollution Allocation of corn to food and animal feed Human corn food and animal feed price Corn yield per acre Demand for corn for human food and animal feed Corn price Ethanol produced per bushel of corn Gap between demand and corn allocated for food Allocation of corn to ethanol production Gap between demand and corn allocated to ethanol Demand for allocation of corn to ethanol Gap between ethanol demand and supply Ethanol production investment Ethanol production efficiency Ethanol price Corn ethanol production Ethanol demand Gasoline demand Gasoline price DDGS and CGF/CGM (animal feed) revenue Profitability Total production costs Oil price Incentives Poduction water costs Production energy costs Other operating costs Figure 1: Causal loop diagram of the dynamics of corn ethanol The key factors relevant to the level of ethanol production are Ethanol production investment (in terms of plant) and the Allocation of corn to ethanol production. The profitability depends on Total production costs, Ethanol price, Revenue from animal feeds, and government Incentives. Corn price plays a role in total production costs. Figure 1 also shows the relationship between factors that influence the amount of corn produced, farmland, water usage, environmental pollution, allocation between competing demands, and the corn price. 3.2 Model overview We review the flow of corn from farms to ethanol in the dispensing fuel pumps. Figure 2 is a schematic representation of stock, product, and information flow in the corn ethanol industry. Farm equipment is required to clear the land, cultivate, plant, grow, and harvest the corn. The farmers use fertilizers that can release nitrous oxide into the atmosphere. Farming also uses water for irrigation although in the U.S. only a small fraction of corn farming uses irrigation. Corn transportation to plants and ethanol production activities use fossil fuels contributing to demand of these fuels and also increasing carbon emissions into the atmosphere. The corn produced is used as animal feeds and human food, for ethanol production, and for other industrial applications. Some corn produced in the U.S. is exported. Ethanol has also to be transported from the plants to distribution centers around the country, mostly using tracks. An improved infrastructure where rail 7
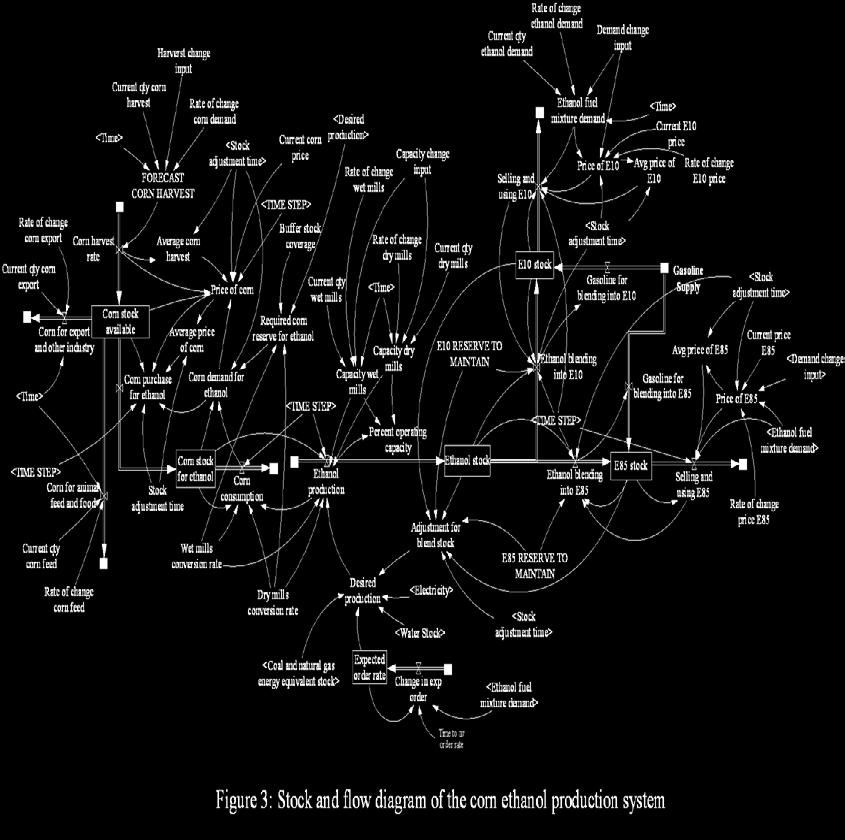
9 is used would reduce transportation costs. The quantity of ethanol to be produced would influence and be influenced by investment in the infrastructure. The ethanol is used in blended form, with gasoline, whose supply is assumed to be constant. The sale of animal feeds byproducts of ethanol production contributes to overall revenue. The model boundary indicated in Figure 2 shows the core part of the ethanol production and distribution system that is included in the stock and flow diagram model [1]. Corn Farming Forecast Food Market Human, Animal feed Water Sources Water Tables Rivers Harvest Corn Transport CO 2, N 2O Release Model boundary Investment Capital Corn Ethanol Production CO 2 Release Ethanol Transport Gasoline Supply Assumed constant Blending and Selling Energy Sources Natural Gas Electricity Coal Energy Market Industrial Production Transportation Heating, Living Figure 2: Overview of the corn ethanol production and distribution system 3.3 Stock and flow diagrams The data and relationship between factors was based on projected corn availability and investment in the industry [11]. The estimates are aggregated for the entire corn ethanol industry in the U.S. There are four sectors in the model (Figures 3 to 6). Figures 4 to 6 are shown in the Appendix. The first is the main corn ethanol production sector that depicts the supply and demand dynamics of corn and ethanol. The second, called secondary production, models animal feeds production as a byproduct of ethanol production. The third sector models the energy used during production. The fourth sector models the capital flows of income and expenditures. The forecast horizon starts from 29 to 23. But we use a month as the time unit and the model performs computations every 1/8 th of a month. We use previous research data and projection into the potential role of corn ethanol in meeting energy needs of the U.S. [11]. 8
10 9
11 Using this information, we model the ethanol production sector. We use the forecast for corn harvest over the modeling horizon, and by linear interpolation determine the total corn production each year between 29, when production will be 13.1 billion bushels (333 million metric tons), and 23 where projection puts production at 24.6 billion (625 million metric tons). With this information, the corn available for ethanol production would grow from 4 billion bushels (12 million metric tons) during 29, representing 3 % of total corn production, to 12 billion bushels (35 million metric tons) in 23, representing 49 % of total corn expected to be produced. We assume the amount of ethanol to be mixed with gasoline before sale will depend on the demand. This is a pull system. The corn harvest system, on the other hand, is modeled as a push system where corn is harvested as projected and stored. In case the demand for corn is less than that anticipated, it would accumulate in the reserve. If the demand happens to be higher than what is projected and the production plant capacity is available, there would be no corn left in reserve as it will all be consumed. In this case, corn availability would be the constraining factor in ethanol production. The demand for corn for other purposes, i.e., animal feed and human food, other industrial applications, and export are modeled according to the projection. The price of corn depends on the rate at which corn is purchased for ethanol production and the rate at which it is harvested. If the purchase rate increases the price goes up and vice versa. The available corn stock and harvest also affect the price. If the stock is low the price increases. The demand for ethanol and production plant capacity increases in the same proportion as the amount of corn harvested. The current proportion of production from the two types of mills, i.e., 7 % by dry milling and 3 % by wet milling is used in the model. However, in a given period, not all orders for ethanol may be satisfied since the ethanol delivered will depend on stock level and production during the period. The price of ethanol blend also depends on the demand. Corn is purchased for ethanol production depending on the demand, price, and corn availability. The corn demand depends on production requirements and maintenance of stock reserve. This stock level of corn to maintain, in turn, depends on the desired ethanol production, buffer stock coverage, and conversion rate of the mills. Buffer stock coverage is measured in a number of months supply. The ethanol production rate depends on the demand and to fill the reserve stocks for each blend that should be maintained. Two other factors affect the production rate: the installed capacity of the processing mills and the availability of corn. At any given time, one of the three constraining factors above would determine the quantity of ethanol produced before next computational step (called Time Step ). We model two blends of ethanol; the E1 and E85 to constitute 8 % and 2 % of total demand respectively. This distribution of demand for different blends has a consequence on the ethanol required from the production system. For example, 1 liter of blended fuels would constitute 2 liter of E85 and 8 liter of E1. The 2 liter of E85 would contain 17 liter of ethanol while the E1 would have 8 liter. This implies a total of 25 liter of corn ethanol required. Therefore, for any quantity demand for the blend fuel, the volume of ethanol required would be one quarter of the total blend. The supply of gasoline for blending with ethanol is assumed to be constant. The drivers of the model are demand and production of ethanol. The demand for the blend in the model represents total demand of ethanol already mixed with gasoline in the various proportions described earlier in this paragraph. 1
12 The secondary production, i.e., for DDGS and CGF/CGM, as a byproduct of ethanol production, is shown in Figure 4. This sector model also includes water usage. CGF/CGM is only produced from the wet mills. The rate of production of these products depends is factored into the quantity of ethanol produced. The price of these products affects the quantities sold. Figure 5 shows energy utilization in production. Electricity is used for lighting and running machinery and equipment. The heating is provided by natural gas and coal on a 55 basis in terms of the heat produced from the energy source but not necessarily that the cost is the same. Electricity consumption is measured in kwh. Natural gas is priced in dollars per British Thermal Unit (BTU) (1 BTU = 155 J) but coal is priced in dollars per ton. The price of coal generally differs depending on the quality of the coal. We assume an average price for coal. To represent quantity of coal and natural gas with a single unit of measure in the model, we determine the BTUs available in one ton of coal (Joules in one metric ton of coal). The capital flow model of Figure 6 shows (Appendix) the income and expenditures associated with ethanol production. 4. Running the model on the ethanol production sector The validity of the structure of the model was first checked for dimensional consistency. The model was then executed. Corn ethanol production on a large scale as a transportation fuel is a recent development in the U.S. with no significant historical data. The unit of time used in modeling is one month and the model is run for a period of 21 years (252 months) into the future. The base run of the model is set at forecast levels of ethanol demand, ethanol prices, corn production, and plant production capacity. After the base run, the model is executed using a new set of scenarios to view the behavior. Figures 7, 8 and 9 show what happens when there is a change from the projected levels. In the first case, it is assumed that half way through the 252 months simulation, the demand changes while the other factors remain as previously projected. In the second case, the production plant capacity changes while the other factors including demand remain unchanged. In the third, we run a scenario where the demand, production plant, and corn harvest change by the same percentage. 4.1 Change in demand Figure 7 graphs show the variation of selected factors and stocks during a simulation run. It shows the parameters: Ethanol fuel mixture demand, E1 stock, Selling and using E1, Ethanol stock, Desired production, Corn demand for ethanol, Corn purchase for ethanol, and Corn stock available. An initial stock of 4 billion gallons (15.2 billion liter) of E1 blend is assumed but the rest supply line for ethanol and corn for ethanol production is empty. The initial sales are supplied from the stock. This causes the sudden drop in the stock as shown in Graph 7B. When this stock is depleted the sales also drop. This is shown in Graph 7C. The beginning of a run also shows sudden increase in desired production, demand for corn, and corn purchase. This is reflected in Graphs 7E, 7F, and 7G respectively. As the simulation executes, the corn and ethanol begin to flow through the system, the E1 stock builds up. The sale of E1 rises until it catches up with the demand. There is no backlogging of ethanol demand and any unfulfilled demand is lost. E1 stock will also rise as reflected in Graph 7B until it reaches the predetermined reserves of 4 billion gallons. At this 11
13 time, no further rise in E1 stock is seen in the graph. This is because we used the rule that the blending rate is to satisfy the need for the buffer stock and to satisfy the demand for the ethanol blend. Further production of ethanol beyond these requirements will lead to a buildup of the ethanol stock. This accumulation of ethanol leads to a slight reduction in the rate of corn purchase around week 7, shown in Graph 7G. The corn in stock begins to rise since the corn harvest rate remains unchanged (Graph 7H). Graph 7A shows the 2 % change in projected demand. Correspondingly, the sales increase as shown in Graph 7C, but for a short time before falling. This is because the additional demand is satisfied from stock. The blend and ethanol stocks also drop, as shown in Graphs 7B and 7D. When this stock is depleted the sales reduce to a level commensurate with the rate of production of ethanol, which is constrained by the capacity of the mills and corn availability. The Graphs 7E and 7F show the increase for Desired production and Corn demand. The Corn purchase, shown in Graph 7G, increases steeply reflecting the increase in demand but drops suddenly to previous level. This is because the increase is satisfied from the Corn stock available until it is depleted as shown in Graph 7H. 4.2 Change in plant capacity Next is the simulation execution when only the production capacity surges by 2 % during month 126. The results of this scenario are shown in the graphs of Figure 8. Since there is no change in demand the sales remain unchanged as shown in Graphs 8A. However, the Ethanol production increases due to increase in capacity. This is shown in Graph 8D.Therefore, the Ethanol stock increases sharply (Graph 8B). The increase in ethanol stock up to a given level reduces the desired production for ethanol, which Graph 8C indicates. Because the ethanol production had increased, the Corn demand and Corn purchase for ethanol also went up. This is shown in Graphs 8E and 8F. However, the Corn purchase is short lived since the Corn stock for ethanol production and Corn stock available are soon depleted as Graphs 8G and 8H, respectively show. We also note that the increased ethanol production lasts only as long as the corn in stock is available. Once the stock, previously accumulated, is used up the corn purchase and ethanol production revert to base levels. The net result of the surge happens to be the depletion of Corn reserves and increase in ethanol stock. 4.3 Change in demand, plant capacity, and corn production The graphs in Figure 9 are the results of running a scenario where the demand, production capacity, and corn availability were increased simultaneously by 2 % during the month 126. The blend stocks would be maintained and the ethanol stock would increase slightly. This is shown in Graphs 9B and 9C. The Ethanol production, Corn demand for ethanol, Corn purchase for ethanol, and Corn stock for ethanol also increase in correspondence with the 2 % rise (Graphs 9D, 9E, 9F, and 9G respectively). Lastly, since the increase is in the corn harvest and ethanol demand without increase in other uses of corn, the Corn stock available increases (Graph 9H). 12
14 2 B Ethanol fuel mixture demand 6 B E1 stock 15 B gal/month 1 B 4.5 B gal 3 B 5 B 1.5 B Ethanol fuel mixture demand : Demand rise Ethanol fuel mixture demand : Base run 1 B Graph 7A Selling and using E1 E1 stock : Demand rise E1 stock : Base run 1 B Graph 7B Ethanol stock 7.5 B gal/month 5 B 7.5 B gal 5 B 2.5 B 2.5 B Selling and using E1 : Demand rise Selling and using E1 : Base run 2 B Graph 7C Desired production Ethanol stock : Demand rise Ethanol stock : Base run 2 B Graph 7D Corn demand for ethanol 15 B gal/month 1 B 1.5 B bsh/month 1 B 5 B 5 M Desired production : Demand rise Desired production : Base run 1 B Graph 7E Corn purchase for ethanol Corn demand for ethanol : Demand rise Corn demand for ethanol : Base run 2 B Graph 7F Corn stock available 75 M bsh/month 5 M bsh 1.5 B 1 B 25 M 5 M Corn purchase for ethanol : Demand rise Corn purchase for ethanol : Base run Graph 7G Corn stock available : Demand rise Corn stock available : Base run Graph 7H Figure 7: Comparison between base run and surge in demand (1 gal = 3.79 l, 1 bushel = 25.4 kg) 13
15 Selling and using E1 Ethanol stock 1 B 4 B 7.5 B gal/month 5 B 3 B gal 2 B 2.5 B 1 B Selling and using E1 : Capacity rise Selling and using E1 : Base run 1 B Graph 8A Desired production Ethanol stock : Capacity rise Ethanol stock : Base run 4 B Graph 8B Ethanol production 7.5 B gal/month 5 B gal/month 3 B 2 B 2.5 B 1 B Desired production : Capacity rise Desired production : Base run 2 B Graph 8C Corn demand for ethanol Ethanol production : Capacity rise Ethanol production : Base run 1 B Graph 8D Corn purchase for ethanol 1.5 B bsh/month 1 B 75 M bsh/month 5 M 5 M 25 M Corn demand for ethanol : Capacity rise Corn demand for ethanol : Base run 6 B Graph 8E Corn stock for ethanol Corn purchase for ethanol : Capacity rise Corn purchase for ethanol : Base run 2 B Graph 8F Corn stock available 4.5 B 1.5 B bsh 3 B bsh 1 B 1.5 B 5 M Corn stock for ethanol : Capacity rise Corn stock for ethanol : Base run Graph 8G Corn stock available : Capacity rise Corn stock available : Base run Graph 8H Figure 8: Comparison between base run and surge in production capacity (1 gal = 3.79 l, 1 bushel = 25.4 kg) 14
16 2 B Selling and using E1 6 B E1 stock 15 B gal/month 1 B gal 4.5 B 3 B 5 B 1.5 B Selling and using E1 : Three factor rise Selling and using E1 : Base run 2 B Graph 9A Ethanol stock E1 stock : Three factor rise E1 stock : Base run 4 B Graph 9B Ethanol production 15 B 3 B gal 1 B gal/month 2 B 5 B 1 B Ethanol stock : Three factor increase Ethanol stock : Base run 2 B Graph 9C Corn demand for ethanol Ethanol production : Three factor increase Ethanol production : Base run 2 B Graph 9D Corn purchase for ethanol 1.5 B bsh/month 1 B 1.5 B bsh/month 1 B 5 M 5 M Corn demand for ethanol : Three factor rise Corn demand for ethanol : Base run bsh 6 B 4.5 B 3 B 1.5 B Graph 9E Corn stock for ethanol Corn purchase for ethanol : Three factor increase Corn purchase for ethanol : Base run 4 B 3 B bsh 2 B 1 B Graph 9F Corn stock available Corn stock for ethanol : Three factor increase Corn stock for ethanol : Base run Graph 9G Graph 9H Figure 9: Comparison between base run and simultaneous increase in corn production, plant capacity, and demand (1 gal = 3.79 l, 1 bushel = 25.4 kg) 15 Corn stock available : Three factor increase Corn stock available : Base run
17 4.4 Overall assessment These preceding simulation runs show model behavior and factor variations that would not be apparent without the model. As an example, the system behavior in the first few months before steady state conditions are achieved would have been difficult to foretell without the model. Another is the relatively short period of time for which a surge in demand can be satisfied before production capacity and/or corn availability force the sales to drop to base values. Additional experiments can be performed to determine the behavior using alternative inputs or if we have a reduction in inputs rather than an increase. Other inputs such as change in prices of ethanol blend or corn, a drop in the availability of corn, or improvement in conversion rate of the mills could be used to determine their effect. We keep in mind that the relationships between factors such as determination of prices, or between demand for ethanol and demand for corn in ethanol production are set by intuition in this model. Different analytical expressions can be developed after further research into the interaction between these factors and the application of sophisticated mathematical analysis. Secondly, the model is relatively complex and many factors can be used as the basis for comparison of different set scenarios. The demonstrations delved in factors from the main corn ethanol production system. Factors from the remaining sectors can also be used. In addition, other ethanol blend fuel combinations of demand can likewise be investigated. 5. Discussion and conclusion The paper has described a system dynamics model that can be used to study the state of corn ethanol fuel industry in the U.S., and the effect of changes to the forecast future trend on the operating parameters. The importance of energy independence cannot be overestimated. Oil prices are expected to rise in the years ahead as reserves are depleted and the process of extraction of the remaining oil becomes more expensive. Corn ethanol is one of the biofuels currently promoted since corn can be readily grown. As a consequence, corn production is projected to increase and more processing plants are being set up. Ethanol for transportation purposes is used in blended form with gasoline, in general. It can be used to oxygenate gasoline as an alternative to methyl tertiary butyl ether (MTBE) and as an extender. Improvements in farming technology are expected to increase the number of bushels produced per acre grown. The ethanol produced per bushel of corn is also expected to increase while electrical and direct thermal energy required per gallon of ethanol is expected to decrease. Nonetheless, promoting corn, which is a food source to be an alternative form of energy, is believed to lead to increase in food prices. There is also a question of what would happen to the corn ethanol industry as prices of ethanol fluctuate in response to availability and supply of alternative transportation energy sources. There is also need to be able to investigate the situation where there are changes from projected corn production, corn prices, capacity, demand and other factors relevant to the industry. This type of problem was seen to be amenable to system dynamics modeling, a tool that has proven effective in holistic modeling of dynamic systems. The model developed includes four sectors: the main corn ethanol production, the secondary production, the energy usage, and the capital flow. The data used is based on literature. One of the major challenges was determining functional relationships between the factors. The other challenge was the determination of and inclusion within the model, of operating policies and decision rules. Executing the model has shown how it responds to independent changes in demand and capacity. 16
18 It has also been demonstrated what would happen if three factors are changed simultaneously. The model can be used as a methodological tool to conduct sensitivity analyses on other issues. Additional information about the industry can be used to improve the model. The model can also be extended to include factors such as the current and future supply of other alternative fuels and petroleum. Models are as useful as the data used in their construction and the analysts understanding and inclusion of important and relevant factors. However, production of bio fuels on a large scale is a new undertaking in the U.S. with more studies in the literature making future projections than those reporting past historical data. As such, the model is useful in exploring changes in expected trends. This model can be extended to include the entire bio fuel industry. In this mode, it would provide a holistic picture and provide an investigative tool of the future impact of bio fuels on transportation in the U.S. ACKNOWLEDGMENT Work described in this report was sponsored by the Sustainable and Lifecycle Informationbased Manufacturing (SLIM) program at the National Institute of Standards and Technology (NIST), Gaithersburg, Maryland. The SLIM program applies information technologies and standardsbased approaches to manufactured product lifecycle problems. The initial study was carried out by Stephen Nowak under the Summer Undergraduate Research Fellowship (SURF) program, to which this research is indebted. The work described was funded by the United States Government and is not subject to copyright. DISCLAIMER A number of software products are identified in context in this paper. This does not imply a recommendation or endorsement of the software products by the authors or NIST, nor does it imply that such software products are necessarily the best available for the purpose. 17
19 References [1] Energy Information Administration, U.S. Department of Energy. World Consumption of Primary Energy by Energy Type and Selected Country Groups, 19824, July 31 26, Retrieved October 8, 29. Available on line at: [2] U.S. Energy Information Administration: Independent Statistics and Analysis, Petroleum Statistics, 28, Retrieved on December 16, 29. Available on line at: [3] BBC News. Oil Hits New High on Iran Fears, July 11 28, Retrieved October 9, 29. Available on line at: [4] The White House National Economic Council. Advanced Energy Initiative, February 26. Retrieved October 9, 29, Available on line at: [5] Wikipedia. Ethanol Fuel in the United States, Retrieved October 9, 29. Available on line at: [6] United States Department of Agriculture. The Economic Feasibility of Ethanol Production from Sugar in the United States, July 26, Retrieved October 9, 29. Available on line at: [7] Wikipedia, Ethanol Fuel, Retrieved October 9, 29. Available on line at: [8] Du, X. and D. Hayes. Working Paper 8WP 467: The Impact of Ethanol Production of U.S. and Regional Gasoline Prices and on the Profitability of the U.S. Oil Refinery Industry, April 28, Retrieved on October 9, 29. Available on line at: [9] Mosier, S. N. and K. Ileleji. How Fuel Ethanol is Made from Corn, Retrieved October 13, 29. Available on line at: [1] Nowak, S. A Prototypical System Dynamics Model of the Corn Ethanol Fuel Industry, 29. NIST SURF Abstract [11] Korves, R. The Potential Role for Corn in Meeting the Energy Needs of the United States on 21623, October 28, Retrieved October 13, 29. Available on line at: [12] The New York Times: Energy and Environment, Bigger Share of Ethanol is sought in Gasoline, March 6, 29, Retrieved November 23, 29. Available on line at: 18
20 [13] Sandvik, S. and E. Moxnes. Peak Oil, Bio fuels, and Longterm Food Security, Proceedings of the 27 th International Conference of the System Dynamics Society, July 263, 29, Albuquerque, New Mexico, U.S.A. Retrieved on October 28, 29. Available on line at: [14] Lin C., T. S. Baines, J. O Kane, and D. Link. A Generic Methodology that Aids the Application of System Dynamics to Manufacturing System Modeling, International Conference on SIMULATION, 3 September 2 October 1998, pp 34349, Conference Publication No [15] Forrester, J. W. Industrial Dynamics, Cambridge, Pegasus Communications Inc, [16] Sterman, J. D. Business Dynamics: Systems Thinking for a Complex World, Irwin McGrawHill, 2. [17] Meadows, D.H., D. L. Meadows, J. Randers, and W.W. Behrens III. The Limits to Growth: A Report for THE CLUB OF ROME S Project on the Predicament of Mankind, Potomac Associates, Universe Books, [18] Meadows, D., J. Randers, and D. Meadows. Limits to Growth: The 3 Year Update, Earthscan, Chelsea Green Publishing Company, 24. [19] Naill, R. A System Dynamics Model for National Energy Policy Planning, System Dynamics Review, 26, Volume 8, Issue 1, Pages 119. [2] Sterman, J. D. Model of EnergyEconomy Interactions, 197, Retrieved October 15, 29. Available on line at: [21] Yeoryios, S. and P. George. An Investigation and Modeling Framework of Biofuels as a New Sociotechnical Regime, Proceedings of the 26 th International Conference of the System Dynamics Society, July 224, 28, Athens, Greece. Retrieved on October 28, 29. Available on line at: [22] Amin, Y., R. A. Baker, R. D. Banks, E. Escalera, R. K. Lay, T. P. Nelson, and W. H. Smith. Noblis Corporate Energy Initiative Special Report, 26, pp 4852, Sigma: Energy Security. [23] Bush, B., M. Duffy, D. Sandor, and S. Peterson. Using System dynamics to model the transition to biofuels in the United States, System of Systems Engineering, SoSE, IEEE International Conference, June 28, National Energy Renewable Laboratory, Golden, Colorado, pp 16. [24] Scheffran, J. and T. BenDor. Bioenergy and land use: A spatialagent dynamic model of energy crop production in Illinois, International Journal of Environment and Pollution, 29, Volume 39, Number 12, pp 427. [25] Franco, C., M. C. Ochoa, and A. M. Florez. A System Dynamics Approach to Biofuels in Colombia, Proceedings of the 27 th International Conference of the System Dynamics Society, 19
21 July 263, 29, Albuquerque, New Mexico, U.S.A. Retrieved on October 15, 29. Available on line at: [26] Riley, C., R. Wooley, and D. Sandor. Implementing Systems Engineering in the U S Department of Energy Office of the Biomass Program, International Conference on System of Systems Engineering: SOSE in Service of Energy and Security San Antonio, Texas, 27, Retrieved on October 15, 29. Available on line at: [27] West, T., K. DunphyGuzman, A. Sun, L. Malczynski, D. Reichmuth, R. Larson, J. Ellison, R. Taylor, V. Tidwell, L. Klebanoff, P. Hough, A. Lutz, C. Shaddix, C. Wheeler, and D. O Toole. Feasibility, Economics, and Environmental Impact of Producing 9 Billion Gallons of Ethanol per year by 23, Preprint, 29, Retrieved on October 15, 29. Available on line at: 376J.pdf [28] Bantz, S. G. and M. Deaton. 26. Understanding U.S. Biodiesel Industry Growth Using System Dynamics Modeling, Retrieved on October 15, 29. Available on line at: [29] Ventana Systems Vensim Version 5, Inc, 28, User s Guide. 2


22 Appendix Figure 4: The stock and flow diagram of the animal feed byproducts production Figure 5: The stock and flow diagram of the energy use 21

23 Figure 6: Stock and flow diagram of the capital flow 22
MODELING OF U.S. CORN ETHANOL INDUSTRIAL GROWTH
 Proceedings of the ASME 211 5th International Conference on Energy Sustainability ES211 August 71, 211, Washington, DC, USA ES21154 MODELING OF U.S. CORN ETHANOL INDUSTRIAL GROWTH Deogratias Kibira and
Corn Wet Mill Improvement and Corn Dry Mill Improvement Pathways Summary Description
 Corn Wet Mill Improvement and Corn Dry Mill Improvement Pathways Summary Description DE Pathway bjectives The Biomass Program objective for both the corn wet mill and dry mill pathways is to improve the
THE ROLE OF THE U.S. ETHANOL INDUSTRY IN FOOD AND FEED PRODUCTION
 FEEDING THE FUTURE: THE ROLE OF THE U.S. ETHANOL INDUSTRY IN FOOD AND FEED PRODUCTION SEPTEMBER 2008 RENEWABLE FUELS ASSOCIATION ONE MASSACHUSETTS AVENUE, NW WASHINGTON, D.C. 20001 202.289.3835 www.ethanolrfa.org
Pocket Guide to Ethanol
 Pocket Guide to Ethanol 1. ETHANOL FACTS AT A GLANCE 2. CORN USE/ DDG PRODUCTION 3. ECONOMIC IMPACTS/ OIL REDUCTIONS 4. ENVIRONMENTAL PROFILE 5. RFS2 6. TAX INCENTIVE/TARIFF 7. CELLULOSIC 8. HIGHER LEVEL
An Ethanol Policy That Benefits All Americans
 SIEPR policy brief Stanford University June 2007 Stanford Institute for Economic Policy Research on the web: http://siepr.stanford.edu An Ethanol Policy That Benefits All Americans By Frank A. Wolak In
Examination of Ethanol Marketing and Input Procurement Practices of the U.S. Ethanol Producers
 Examination of Ethanol Marketing and Input Procurement Practices of the U.S. Ethanol Producers Aslihan D. Spaulding Timothy J. Schmidgall Illinois State University Department of Agriculture Campus Box
Ethanol: Friend or Foe?
 Ethanol: Friend or Foe? Last summer, due to the rising fuel costs, I decided to buy a motorcycle that gets 70 miles to the gallon. When it comes to filling it up, the motorcycle is much easier on my wallet
Understanding Ethanol Plant Economics: Will Boom Turn Bust?
 EXTENSION EC849 Understanding Ethanol Plant Economics: Will Boom Turn Bust? David J. Peters Extension Community Rural Economic Development Specialist Understanding Ethanol Plant Economics: Will Boom Turn
CONTRIBUTION OF THE ETHANOL INDUSTRY TO THE ECONOMY OF THE UNITED STATES
 CONTRIBUTION OF THE ETHANOL INDUSTRY TO THE ECONOMY OF THE UNITED STATES Prepared for the Renewable Fuels Association by John M. Urbanchuk Managing Partner February 17, 2014 The environment facing the
ACE 427 Spring Lecture 7. by Professor Scott H. Irwin
 ACE 427 Spring 2012 Lecture 7 Forecasting Crop Prices Using Fundamental Analysis: Maximum Bid Price Models by Professor Scott H. Irwin Required Reading: Babcock B.A. Mandates, Tax Credits, and Tariffs:
Proceedings of the 2007 CPM Short Course and MCPR Trade Show
 Proceedings of the 2007 CPM Short Course and MCPR Trade Show December 4 6, 2007 Minneapolis Convention Center Do not Reproduce or Redistribute Without Written Consent of the Author(s) The Realities of
US Energy Mandates and the Promises of Biofuels
 US Energy Mandates and the Promises of Biofuels Dr. Elena del Campillo BSCI442 October 30, 2008 THE 21ST CENTURY AMERICA S CHALLENGES: 1- SECURE ENERGY FUTURE 2- DECREASED DEPENDENCE ON FOREIGN OIL 3-
Projected U.S. Corn Exports, Acreage and Production Under E-10, E-12 and E-15 Ethanol Policies
 Projected U.S. Corn Exports, Acreage and Production Under E-10, E-12 and E-15 Ethanol Policies Daniel O Brien, Extension Agricultural Economist, K-State Research and Extension July 19, 2010 This article
World. Nation. Fueling a. Feeding the THE ROLE OF THE U.S. ETHANOL INDUSTRY IN FOOD AND FEED PRODUCTION.
 Fueling a Nation Feeding the World THE ROLE OF THE U.S. ETHANOL INDUSTRY IN FOOD AND FEED PRODUCTION www.ethanolrfa.org The American ethanol industry has established itself as a major supplier of liquid
FAPRI Ethanol Briefing Materials for Congressman Peterson
 FAPRI Ethanol Briefing Materials for Congressman Peterson March 2006 www.fapri.missouri.edu FAPRI-UMC Report #02-06 Inside Cover Blank Page These briefing materials summarize information about ethanol
Biomass Use at Dry-Grind Ethanol Plants: Less Greenhouse Gases and More Profits
 Biomass Use at Dry-Grind Ethanol Plants: Less Greenhouse Gases and More Profits Douglas G. Tiffany University of Minnesota Adv. Biomass Energy Workshop W.C. Research and Outreach Ctr. University of Minnesota
COMPARING RESIDUAL PRODUCTION FROM TWO ALCOHOL FUEL PROCESSES: AN ECONOMIC EVALUATION. Stephen L. Ott
 ..... ESO 863 S~T~ 1i
CORN: HIGHER PRICES COMES EARLY
 CORN: HIGHER PRICES COMES EARLY OCTOBER 2006 Darrel Good 2006 NO. 7 Summary The 2006 U.S. corn crop is expected to be the third largest ever, but it is small in relation to expected consumption during
Ethanol. America s Homegrown Fuel
 Ethanol America s Homegrown Fuel Ethanol is an advanced biofuel that we use every day and it is moving America forward. It is renewable, homegrown and already 10 percent of the gasoline in our tanks. It
USDA s 2002 Ethanol Cost-of-Production Survey
 United States Department of Agriculture Agricultural Economic Report Number 841 July 25 USDA s 22 Ethanol Cost-of-Production Survey Hosein Shapouri and Paul Gallagher U.S. Department of Agriculture, Office
ELEMENTARY CURRICULUM CORN ETHANOL. Fueling Our Future
 ELEMENTARY CURRICULUM CORN ETHANOL Fueling Our Future I. Enduring Knowledge: Students will understand how the application of new technologies in corn production can transform Wisconsin farming to make
Global Warming. Department of Chemical Engineering
 Global Warming How Can Biofuels Help? Clint Williford Department of Chemical Engineering Introduction ti Greenhouse emissions Reducing growth of GHG emissions Biofuels Why and why now? What they are? How
POCKET GUIDE TO ETHANOL 2017
 POCKET GUIDE TO ETHANOL 2017 x ETHANOL BASICS Ethanol is a biodegradable, high-octane motor fuel derived from the sugars, starches, and cellulosic matter found in plants. It has been used as a fuel since
BIOENERGY OPPORTUNITIES AT GAY & ROBINSON. E. Alan Kennett President, Gay & Robinson, Inc.
 BIOENERGY OPPORTUNITIES AT GAY & ROBINSON E. Alan Kennett President, Gay & Robinson, Inc. Alan Kennett & Gay & Robinson President and CEO of Gay & Robinson, Inc. Gay & Robinson, Inc. is 7,500 acre sugar
CORN: SMALLER SUPPLIES ON THE HORIZON. April 2001 Darrel Good No. 3
 CORN: SMALLER SUPPLIES ON THE HORIZON April 2001 Darrel Good 2001- No. 3 Summary The USDA s March Grain Stocks and Prospective Plantings report released on March 30 provided some fundamentally supportive
What Are Our Alternatives, If Fossil Fuels Are a Problem?
 What Are Our Alternatives, If Fossil Fuels Are a Problem? George W. Bush has given us one reason why we need to make changes Unstable foreign oil supply. Al Gore has given us another reason Climate change.
Everything you need to know about biomass - Interesting energy articles - Renewables-info.com
 Biomass is renewable source of energy that includes different biological material from living, or recently living organisms such as wood, waste and alcohol fuels. There are three different ways to convert
Biofuels: An Important Part of a Low-Carb Diet
 Biofuels: An Important Part of a Low-Carb Diet Steven Bantz Union of Concerned Scientists Washington, DC The Union of Concerned Scientists is a science-based organization in DC, Berkeley, CA, and Cambridge,
Growing Crops for Biofuels Has Spillover Effects
 Growing Crops for Biofuels Has Spillover Effects VOLUME 7 ISSUE 1 Scott Malcolm smalcolm@ers.usda.gov 10 Marcel Aillery maillery@ers.usda.gov Federal mandates for biofuel production promote expanded crop
U.S. Ethanol Market & Policy Outlook Prepared for 2011 Crop Insurance Workshop Series (CO, NE, KS, OK) November 1 4, 2011
 November 1 4, 2011") U.S. Ethanol Market & Policy Outlook 2011 Crop Insurance Workshops Daniel O Brien, Ph.D. Extension Agricultural Economist Kansas State University Ethanol Policy & Markets A. U.S. Ethanol Policy B. U.S.
U.S. Ethanol Market & Policy Outlook 2011 Crop Insurance Workshops Daniel O Brien, Ph.D. Extension Agricultural Economist Kansas State University Ethanol Policy & Markets A. U.S. Ethanol Policy B. U.S.
How Much Energy Does It Take to Make a Gallon of Ethanol?
 How Much Energy Does It Take to Make a Gallon of Ethanol? David Lorenz and David Morris August 1995 1995 Institute for Local-Self Reliance (ILSR) Reproduction permitted with attribution to ILSR One of
ERS/USDA Briefing Room - Corn: Market Outlook
 1 of 19 7/21/2006 8:12 PM Briefing Rooms Corn: Market Outlook USDA Feed Grains Baseline, 2005-14 The gross domestic product is expected to grow in the United States and around the world, raising incomes
Corn Ethanol Process and Production Economics
 1 Corn Ethanol Process and Production Economics Presented to the 2007 Fertilizer Outlook and Technology Conference Arlington, VA November 8, 2006 John M. Urbanchuk Director, LECG LLC 1255 Drummers Lane,
Office of the Chief Economist Office of Energy Policy and New Uses. November 19, 2008
 THE CURRENT STATUS AND POLICY FRAMEWORK FOR INDUSTRIAL BIOMASS IN THE UNITED STATES BY Dr. Marvin Duncan USDA/OCE/OEPNU November 19, 2008 This presentation has five sections Background Current biofuels
The Economic and Policy Challenges of Biofuels
 The Economic and Policy Challenges of Biofuels Madhu Khanna Department of Agricultural and Consumer Economics University of Illinois, Urbana-Champaign Economic, Environmental and Policy Challenges Growing
U.S. Ethanol Policy Possibilities for the Future
 Purdue University Purdue e-pubs Historical Documents of the Purdue Cooperative Extension Service Department of Agricultural Communication 9-24-2015 U.S. Ethanol Policy Possibilities for the Future Wallace
Measuring Supply-Use of Distillers Grains in the United States
 Measuring Supply-Use of Distillers Grains in the United States Daniel O Brien, Extension Agricultural Economist, K-State Research and Extension Robert Wisner, University Professor Emeritus, Iowa State
Liquid Biofuels for Transport
 page 1/11 Scientific Facts on Liquid Biofuels for Transport Prospects, risks and opportunities Source document: FAO (2008) Summary & Details: GreenFacts Context - Serious questions are being raised about
US Biofuels Analysis Under Uncertainty and Volatility in the Biofuels Industry: FAPRI Stochastic Modeling
 US Biofuels Analysis Under Uncertainty and Volatility in the Biofuels Industry: FAPRI Stochastic Modeling Presented at Biofuels, Food and Feed Tradeoffs Farm Foundation, 12-13 April 2007 Saint Louis, Missouri
POCKET GUIDE 2016 ETHANOL INDUSTRY OUTLOOK
 2016 ETHANOL INDUSTRY OUTLOOK POCKET GUIDE TO ETHANOL 2018 WHAT IS ETHANOL? How is Ethanol Made? Fuel ethanol is made through the DRY MILL or WET MILL process. Most ethanol today is made by DRY MILLS,
Biofuels A policy driven logistics and business challenge
 Biofuels 2020 A policy driven logistics and business challenge Research and Innovation, Position Paper 02-2010 This is DNV DNV is a global provider of services for managing risk. Established in 1864, DNV
Institute of Transportation Studies University of California, Davis
 Institute of Transportation Studies University of California, Davis Liquid Biofuels for Transportation National Academies Workshop on Oil Peaking Daniel Sperling Professor and Director October 20, 2005
AN ANALYSIS OF THE PROJECTED GLOBAL WARMING IMPACT OF CORN ETHANOL PRODUCTION (YEARS )
") AN ANALYSIS OF THE PROJECTED GLOBAL WARMING IMPACT OF CORN ETHANOL PRODUCTION (YEARS 2010-2030) Prepared for: Illinois Corn Marketing Board ProExporter Network Prepared by: Steffen Mueller Stefan Unnasch
AN ANALYSIS OF THE PROJECTED GLOBAL WARMING IMPACT OF CORN ETHANOL PRODUCTION (YEARS 2010-2030) Prepared for: Illinois Corn Marketing Board ProExporter Network Prepared by: Steffen Mueller Stefan Unnasch
ECONOMIC IMPACT. In 2015, the ethanol industry contributed nearly $44 billion to the nation s GDP and added nearly $24 billion to household income.
 ETHANOL FAST FACTS ECONOMIC IMPACT In 2015, the ethanol industry created and supported nearly 339,000 jobs. Moving to a widespread adoption of E15 would create an additional 136,000 jobs. The U.S. renewable
Biofuels: Costs and Potential for Mitigating Greenhouse Gases
 Biofuels: Costs and Potential for Mitigating Greenhouse Gases Madhu Khanna Department of Agricultural and Consumer Economics Energy Biosciences Institute University of Illinois, Urbana-Champaign GHG Emissions
Impact on Hog Feed Cost of Corn and DDGS Prices
 November 15, 2006 Ames, Iowa Econ. Info. 1946 Impact on Hog Feed Cost of Corn and DDGS Prices Rising corn prices this fall have resulted in higher feed cost for hog producers. Depending on feed efficiency
Fueling the Commercializationof Cellulosic Ethanol
 University of Massachusetts Amherst ScholarWorks@UMass Amherst Conference on Cellulosic Biofuels September 2008 Fueling the Commercializationof Cellulosic Ethanol John Howe Verenium Corp., John.Howe@verenium.com
NON-TRADITIONAL PRODUCTS FROM CORN
 NON-TRADITIONAL PRODUCTS FROM CORN W. Robert Schwandt A.E. Staley Manufacturing Co. The productivity of our farm sector is one of the great success stories of history. The application of genetics, fertilizers,
SOYBEANS: SURPLUS GROWS, ACREAGE TO DECLINE
 SOYBEANS: SURPLUS GROWS, ACREAGE TO DECLINE JANUARY 2007 Darrel Good 2007 NO. 2 Summary The 2006 U.S. soybean crop was a record 3.188 billion bushels, but was 16 million smaller than the November 2006
Dispelling the Myths aboutwater b t use in Ethanol Production
 Dispelling the Myths aboutwater b t use in i Ethanol Production Presented by Myke Feinman Biofuels Journal It takes 1,700 1 Myth Gallons of Water to Produce a Gallon of Ethanol This often repeated value
CONTRIBUTION OF THE ETHANOL INDUSTRY TO THE ECONOMY OF THE UNITED STATES
 CONTRIBUTION OF THE ETHANOL INDUSTRY TO THE ECONOMY OF THE UNITED STATES Prepared for the Renewable Fuels Association by John M. Urbanchuk Technical Director Environmental Economics Updated January 31,
Range Fuels Plans for the Commercialization of Cellulosic Ethanol
 Range Fuels Plans for the Commercialization of Cellulosic Ethanol Bio-Energy Wood Supply Chain Conference: New Opportunities, New Issues Bill Schafer, Sr. Vice President, Business Development Range Fuels,
Second Generation Biofuels: Economic and Policy Issues
 Second Generation Biofuels: Economic and Policy Issues Wally Tyner With Input from Farzad Taheripour March 27, 2012 Presentation Outline New data on global land use change Sources of uncertainty for second
AGEC 429: AGRICULTURAL POLICY LECTURE 26: U.S. AGRICULTURAL RESOURCE AND ENVIRONMENTAL POLICY
 AGEC 429: AGRICULTURAL POLICY LECTURE 26: U.S. AGRICULTURAL RESOURCE AND ENVIRONMENTAL POLICY AGEC 429 Lecture #26 U.S. AGRICULTURAL RESOURCE AND ENVIRONMENTAL POLICY Basic Premise of Resource and Environmental
Biofuels Potential and Sustainability
 Biofuels Potential and Sustainability Andy Aden, PE National Renewable Energy Laboratory (NREL) 2008 Rocky Mountain Land Use Institute Conference March 6, 2008 1 Outline Biofuels potential Current state
ACE ANNUAL CONFERENCE. Jim Galvin CEO & Director Lakeview Energy LLC
 ACE ANNUAL CONFERENCE Jim Galvin CEO & Director Lakeview Energy LLC LAKEVIEW ENERGY Operations across 6 US States- IA, OH, MO, IL, SD and TN 3 bio-refineries operating in IA, OH and MO Corn merchandising
20 in 10 Summary. Reduce U.S. Gasoline Usage By 20% In The Next Ten Years
 20 in 10 Summary Reduce U.S. Gasoline Usage By 20% In The Next Ten Years Increase supply of renewable and alternative fuels Set Alternative Fuels Standards at 35 billion gallons per year by 2017 Equates
THE ECONOMICS OF CELLULOSIC ETHANOL
 THE ECONOMICS OF CELLULOSIC ETHANOL 2007 Mike Woolverton Kansas State University mikewool@agecon.ksu.edu Renewable Fuel Production Drivers 1. Energy Security 2. High Cost of Transportation Fuel 3. Post-peak
Alternate Energy Sources, part II
 Alternate Energy Sources, part II FIGURE V01_T1: Bird kills from commercial wind turbines Tidal Power Rise and fall of water used to move turbines, producing electricity Clean energy no water or air pollution
will also enhance America's energy security by displacing imported crude oil. Specifically, expansion of the U.S. biofuels industry will:
 1 of 9 5/22/2014 9:12 AM Competency 0002 Writing to Sources Passage A Bob Dinneen from "Should Congress Reassess the Renewable Fuel Standard in the Energy Independence and Security Act? Con: Renewable
Opportunities for Renewable Energy on Farms. Agenda. What is Bio-energy? NYSERDA Innovations in Agriculture
 Opportunities for Renewable Energy on Farms NYSERDA Innovations in Agriculture Brent Gloy Cornell University March 4, 2008 Brent Gloy, February 2008 Agenda The factors driving renewable energy in agriculture
Economic Feasibility of Sugar Beet Biofuel Production in North Dakota
 Economic Feasibility of Sugar Beet Biofuel Production in North Dakota Thein Maung and Cole Gustafson North Dakota State University The Economics of Alternative Energy Resources and Globalization: The Road
Impact of Changes in Energy Input Prices on Ethanol Importation and Prices
 Journal of Agribusiness 29, 2 (Fall 2011) Agricultural Economics Association of Georgia Impact of Changes in Energy Input Prices on Ethanol Importation and Prices Elizabeth A. Yeager and Allen M. Featherstone
IMPACTS OF ETHANOL CO-PRODUCTS ON 2011/12 CORN AND SOYBEAN SUPPLIES AND ACREAGE
 IMPACTS OF ETHANOL CO-PRODUCTS ON 2011/12 CORN AND SOYBEAN SUPPLIES AND ACREAGE December 2012 KEY POINTS While biofuel critics claim 40% of the corn supply is being used for ethanol production, the actual
The Brazilian Bio-ethanol Experience
 The Brazilian Bio-ethanol Experience International Conference on Bioenergy and Liquid Biofuel Development and Utilization LAMNET Project Workshop Beijing, P.R. China April 2004 Arnaldo Walter awalter@fem.unicamp.br
API Southern Region/ State Working Groups Spring Conference Charleston, SC
 THE FUTURE OF ETHANOL Presentation to API Southern Region/ State Working Groups Spring Conference Charleston, SC By Mike D. McDaniel, Ph.D. LSU Center for Energy Studies May 20, 2008 THE FUTURE OF ETHANOL
Ethanol Reshapes the. Corn Market. Allen Baker Steven Zahniser
 Ethanol Reshapes the VOLUME 5 SPECIAL ISSUE Corn Market Allen Baker albaker@ers.usda.gov 66 Steven Zahniser zahniser@ers.usda.gov Work is underway to add another 6.2 billion gallons to the annual capacity
FUELING THE FUTURE. Reading Practice
 Reading Practice FUELING THE FUTURE The world s 750 million motor vehicles emit well over 900 million metric tonnes of carbon dioxide each year. Traffic-related air pollution has been responsible for 6%
Biofuels, Energy Security, and Global Warming Policy Interactions
 Biofuels, Energy Security, and Global Warming Policy Interactions by Wallace E. Tyner Purdue University Paper presented at the National Agricultural Biotechnology Council conference, South Dakota State
An Economic Analysis of Corn-based Ethanol Production
 Agribusiness & Applied Economics Report No. 626 April 2008 An Economic Analysis of Corn-based Ethanol Production Won W. Koo and Richard Taylor Center for Agricultural Policy and Trade Studies Department
Ethanol (EtOH) & Other Renewables IAEE Houston Chapter June 14, Chuck Hoffheiser
 & Other Renewables IAEE Houston Chapter June 14, Chuck Hoffheiser") Ethanol (EtOH) & Other Renewables IAEE Houston Chapter June 14, 2007 Chuck Hoffheiser 281-352-0939 The following represents the observations of the presenter and not of any firm or organization. Any discussion
Ethanol (EtOH) & Other Renewables IAEE Houston Chapter June 14, 2007 Chuck Hoffheiser 281-352-0939 The following represents the observations of the presenter and not of any firm or organization. Any discussion
Grains & Oilseeds Outlook. USDA's Interagency Commodity Estimates Grains and Oilseeds Committees
 Agricultural Outlook Forum Presented: February 23-24, 2012 U.S. Department of Agriculture Grains & Oilseeds Outlook USDA's Interagency Commodity Estimates Grains and Oilseeds Committees United States Department
A Prospective Analysis of US-Brazil Biofuel Policies
 A Prospective Analysis of US-Brazil Biofuel Policies Héctor M. Núñez and Hayri Önal Madhu Khanna, Xiaoguang Chen, Haixiao Huang University of Illinois at Urbana-Champaign Energy Biosciences Institute CTBE-IEA
Biofuel thematic paper Biofuel potential
 November 2007 Biofuel thematic paper Biofuel potential The potential for biofuel production/usage is assessed below. The assessments cover: EU, the U.S., China, Brazil, Denmark and the whole world; they
Methodology for calculating subsidies to renewables
 1 Introduction Each of the World Energy Outlook scenarios envisages growth in the use of renewable energy sources over the Outlook period. World Energy Outlook 2012 includes estimates of the subsidies
CONTRIBUTION OF THE ETHANOL INDUSTRY TO THE ECONOMY OF THE UNITED STATES
 CONTRIBUTION OF THE ETHANOL INDUSTRY TO THE ECONOMY OF THE UNITED STATES Prepared for the Renewable Fuels Association by John M. Urbanchuk Technical Director February 2011 2010 was a year of continued
Future Biofuels Policy Alternatives
 Future Biofuels Policy Alternatives by Wallace E. Tyner Farzad Taheripour Purdue University Paper presented at a conference on Biofuels, Food, and Feed Tradeoffs St. Louis, MO April 12-13, 2007 1 Future
CORN: CROP PROSPECTS TO DOMINATE PRICES
 CORN: CROP PROSPECTS TO DOMINATE PRICES JULY 2002 Darrel Good 2002 NO. 5 Summary The USDA s June Grain Stocks report confirmed a rapid rate of domestic corn consumption during the third quarter of the
US ranchers face a big challenge in the years
 Evaluating Strategies for Ranching in the 21st Century: Ranching in the Ethanol Era By James Mintert US ranchers face a big challenge in the years ahead. Feed grain prices have increased dramatically in
Statement Of Scott Weishaar Vice President, Commercial Development POET US House of Representative Committee on Agriculture
 Statement Of Scott Weishaar Vice President, Commercial Development POET US House of Representative Committee on Agriculture POET s commitment to cellulosic ethanol May 18, 2010 1 Mr. Chairman and distinguished
GRAIN PRICE OUTLOOK: SEASONALITY, ACREAGE, CHINA ON GMO, ETHANOL
 March 1, 2002 Ames, Iowa Econ. Info. 1833 GRAIN PRICE OUTLOOK: SEASONALITY, ACREAGE, CHINA ON GMO, ETHANOL Seasonal Tendencies in Grain Prices Historically, corn and soybean prices have tended to decline
Seventh Biennial Report on Progress toward Greenhouse Gas Reduction Goals
 Report to the Joint Standing Committee on Environment and Natural Resources 128 th Legislature, Second Session Seventh Biennial Report on Progress toward Greenhouse Gas Reduction Goals January 2018 Contact:
Indiana Conference on Energy Management Renewable Energy
 Indiana Conference on Energy Management Renewable Energy eglobal Consulting, Inc. Jynell D. Berkshire, Esq. 1320 E. Vermont Street Indianapolis, IN 46202 PH: (317) 752-1276 FAX: (317) 951-94669466 jynell.berkshire@eglobalconsultinginc.com
Economics of a New Generation of Bioenergy Crops: Implications for Land Use and Greenhouse Gases
 Economics of a New Generation of Bioenergy Crops: Implications for Land Use and Greenhouse Gases Madhu Khanna Department of Agricultural and Consumer Economics University of Illinois, Urbana-Champaign
Emerging Biofuels: Outlook of Effects on U.S. Grain, Oilseed, and Livestock Markets
 Emerging Biofuels: Outlook of Effects on U.S. Grain, Oilseed, and Livestock Markets Simla Tokgoz stokgoz@iastate.edu 515-294 6357 Center for Agricultural and Rural Development Iowa State University Outline
Special issue: Renewable Fuels and the Bioeconomy
 Number 69 February 16, 2007 Special issue: Renewable Fuels and the Bioeconomy Renewable Fuels and More: Creating a Sustainable Bioeconomy for the Nation was the title of the January 31, 2007 Agronomy Seminar
Economy-wide Implications from U.S. Bioenergy Expansion
 Economy-wide Implications from U.S. Bioenergy Expansion Mark Gehlhar*, Agapi Somwaru*, Peter Dixon**, Maureen Rimmer** and Ashley Winston** Abstract The Energy Independence and Security Act of 2007 (EISA)
Railroads and Grain. Association of American Railroads June Summary
 s and Grain Association of American s June 2017 Summary s are critical to grain transportation. In 2016, U.S. Class I railroads originated 1.54 million carloads of grain (5.6 percent of total carloads)
The Impact of Applying RINS to U.S. Ethanol Exports on Farm Revenue and the Economy. Prepared For: Growth Energy
 The Impact of Applying RINS to U.S. Ethanol Exports on Farm Revenue and the Economy Prepared For: Growth Energy October 2017 Table of Contents I. EXECUTIVE SUMMARY... 5 II. BACKGROUND... 7 III. METHODOLOGY...
Midwest Transportation Consortium
 Midwest Transportation Consortium Energy Issues in Transportation Floyd E. Barwig US Energy Use for Transportation 50 40 Figure 2: Primary Energy Consumption by Sector, 1970 2020 (quadrillion Btu) History
GRASS BIOMASS. By Jock Gill Grass Energy Collaborative, Inc. September Overview
 GRASS BIOMASS By Jock Gill Grass Energy Collaborative, Inc. September 2006 Overview One of the most exciting renewable energy potentials emerging for farm development is grass and other herbaceous bioenergy
The Renewable Fuel Standard (RFS) Program
 Program") The Renewable Fuel Standard (RFS) Program Presentation for The Nexus of Biofuels Energy, Climate Change, and Health Workshop (Institute of Medicine) January 25, 2013 Karl Simon, Director Transportation
The Renewable Fuel Standard (RFS) Program Presentation for The Nexus of Biofuels Energy, Climate Change, and Health Workshop (Institute of Medicine) January 25, 2013 Karl Simon, Director Transportation
Ethanol Production from Food Crops should be Limited
 Ethanol Production from Food Crops should be Limited Introduction Ethanol is an alcohol molecule that is a main component in alcoholic beverages, largely used as a solvent and in recent times as a fuel
Appendix A: KEY TECHNOLOGICAL DEVELOPMENTS NEEDED TO HELP REACH THE BIOENERGY POTENTIAL
 Appendixes Appendix A: KEY TECHNOLOGICAL DEVELOPMENTS NEEDED TO HELP REACH THE BIOENERGY POTENTIAL. The 1985 bioenergy potential probably can be achieved with relatively direct development of existing
Florida Water Availability and Water Needs In 2020, Chuck Aller Florida Department of Agriculture and Consumer Services February 28, 2008
 Florida Water Availability and Water Needs In 2020, 2060 Chuck Aller Florida Department of Agriculture and Consumer Services February 28, 2008 Florida Agriculture Today 41,000 farms and ranches 14.3 million
An Update on Range Fuels Soperton Plant Project
 An Update on Range Fuels Soperton Plant Project Range Fuels Focus Commercial production of cellulosic biofuels, including cellulosic ethanol, and clean renewable power from renewable biomass that cannot
Biofuels Incentives: A Summary of Federal Programs
 Order Code RL33572 Biofuels Incentives: A Summary of Federal Programs Updated July 29, 2008 Brent D. Yacobucci Specialist in Energy and Environmental Policy Resources, Science, and Industry Division Biofuels
The Impact of Ethanol and Ethanol Subsidies on Corn Prices: Revisiting History
 CARD Policy Briefs CARD Reports and Working Papers 4-2011 The Impact of Ethanol and Ethanol Subsidies on Corn Prices: Revisiting History Bruce A. Babcock Iowa State University, babcock@iastate.edu Jacinto
2007 U.S CORN PRODUCTION RISKS: WHAT DOES HISTORY TEACH US? Darrel Good and Scott Irwin May 17, 2007 MOBR 07-01
 2007 U.S CORN PRODUCTION RISKS: WHAT DOES HISTORY TEACH US? Darrel Good and Scott Irwin May 17, 2007 MOBR 07-01 INTRODUCTION From May to October each year, the corn market typically finds direction from
Ethanol Energy Balances
 David Andress & Associates, Inc. 11008 Harriet Lane (301) 933-7179 Kensington, Maryland 20895 Ethanol Energy Balances Prepared by: David Andress David Andress & Associates, Inc. 11008 Harriet Lane Kensington,