James River Alternatives Analysis June 23, 2005
|
|
|
- Beverley Parsons
- 6 years ago
- Views:
Transcription
1 James River Alternatives Analysis June 23, 2005 Prepared by: Virginia Department of Environmental Quality in cooperation with the U.S. EPA Chesapeake Bay Program Office
2 [ THIS PAGE INTENTIONALLY LEFT BLANK ]
3 EXECUTIVE SUMMARY The existing Virginia Water Quality Standards regulation (9 VAC and 20) designates all waters for the propagation and growth of a balanced, indigenous population of aquatic life, including game fish, which might reasonably be expected to inhabit them and requires that substances which nourish undesirable or nuisance aquatic plant life will be controlled (9 VAC ). Existing implementation of these narrative requirements did not prevent the tidal James River from being listed as impaired under the Clean Water Act 303(d). The impairments in the tidal James River are tied to eutrophication. The Chesapeake 2000 Agreement specifies a goal to remove the Bay from the impaired waters list by To that end, a need for appropriate water quality standards was identified in order to define accurate water quality goals for assessment. The Virginia State Water Control Board adopted numerical criteria for dissolved oxygen, water clarity and submerged aquatic vegetation and a narrative criterion for chlorophyll a for the Chesapeake Bay and its tidal tributaries to drive nutrient and sediment reduction measures. These amendments are all based on recommendations from the U.S. EPA Ambient Water Quality Criteria for Dissolved Oxygen, Water Clarity and Chlorophyll a for the Chesapeake Bay and its Tidal Tributaries, April 2003 and Technical Support Document for Identification of Chesapeake Bay Designated Uses and Attainability, October 2003 (and their 2004 addendums). However, the best information available indicates that the nutrient impairment in the tidal James River will not be sufficiently addressed by the actions taken to attain dissolved oxygen or clarity criteria. From past experience, it is questionable whether a narrative criterion alone will provide the water quality protection needed in James River. Therefore, it was determined by U.S. EPA and VA Department of Environmental Quality (DEQ) that numerical criteria for chlorophyll a needs to be applied to the tidal James River to quantify the water quality conditions necessary for the protection already required by the narrative criteria within the existing Virginia Water Quality Standards Regulation. EPA also strongly encourages numerical chlorophyll a criteria when there are existing nutrient related impairments and the impairments will likely persist after nutrient and sediment reductions are made in order to remove dissolved oxygen or water clarity related impairments. This is the case in the tidal James River. Because of scientific and economic impact concerns raised about the numerical chlorophyll a criteria during the public comment process, the VA DEQ along with the U.S. EPA Chesapeake Bay Program Office committed to investigate various cap load allocation scenarios for the tidal James River and to do an analysis to see if different cap load allocations could provide equivalent environmental benefits with much lower economic impacts to localities before adopting these numerical chlorophyll a criteria. To best accomplish this evaluation, the Chesapeake Bay Eutrophication Model was used to simulate a range of nutrient load scenarios and associated chlorophyll a, water clarity and submerged aquatic vegetation changes expected to occur in the tidal James River. Ultimately, thirteen scenarios were evaluated. Nine management scenarios assessed loadings and concentrations ranging from 1985 conditions through E3 (everything, everybody, everywhere). In addition, four scoping scenarios were tested where nutrient concentrations varied in the James Basin but sediments loadings were kept low. i
4 A summary of the findings include: Thirteen model simulations captured anticipated responses of chlorophyll, water clarity and submerged aquatic vegetation (SAV) under wide ranges of loadings reductions across ten years of varying hydrology: nitrogen ( million pounds), phosphorus ( million pounds) and sediment ( million tons). The tidal fresh James River displayed the highest estimated summer chlorophyll a concentrations of all the Chesapeake Bay Program segments in the 1985 Reference Scenario and the second highest summer average concentration in the 2002 Assessment Scenario; however, these seasonal ten year average concentrations should not be used to measure attainment of the proposed chlorophyll a criteria. The greatest reductions in chlorophyll a concentrations for the tidal James River were associated with the largest nutrient reductions such as Tier 3, Virginia Tributary Strategy and Scoping Scenario D. The following summarizes chlorophyll a attainment in tidal James River segments responding to a range of nutrient reductions: Lower tidal fresh (JMSTF1) was responsive during both spring and summer, but greatest during the summer. Spring chlorophyll a attainment was between 12 and 22 µg/l for TN loads between 22 and 37 million pounds. Summer chlorophyll a attainments ranged from 20 µg/l (loads between 22 and 26 million pounds of TN) to above 30 µg/l of chlorophyll a (34 to 47 million pounds of TN). The oligohaline (JMSOH) chlorophyll a attainment changed between seasons with the spring having lower attainment levels than summer over the range of TN loads. For example, spring chlorophyll a attainment was from 11 to 20 µg/l between 22 and 38 million pounds of TN while summer chlorophyll a attainment levels ranged from 21 to 25 µg/l for the same loadings. The mesohaline (JMSMH) was most responsive during spring with chlorophyll a attainments between 11 and 13 µg/l below TN loads of 30 million pounds and above 15 µg/l for TN loads greater than 30 million pounds. Summer chlorophyll a attainments were less than 12 µg/l across the range of TN loads. The polyhaline (JMSPH) showed a similar pattern as the oligohaline with spring chlorophyll a attainments less than 14 µg/l below TN loads of 30 million pounds and above 15 µg/l for TN loads greater than 30 million pounds. Again, summer chlorophyll a attainment was less than 10 µg/l across the range of TN loads for this segment. While nutrients were the primary driver of chlorophyll a concentrations and sediments the driver for water clarity improvements, almost all segments showed an increase in submerged aquatic vegetation (SAV) acreage from combined nutrient and sediment reductions. While the Eutrophication Model could not be used to quantify exactly how each scenario (each with its own estimated chlorophyll a concentrations) might impact the aquatic food web directly, it was used to estimate how much lower chlorophyll a concentrations should get in the tidal James River in response to key scenarios. Based on basic principals of ecology, published scientific research, and this alternatives analysis, several conclusions were reached: ii
5 o Segments characterized as impaired consisted of imbalanced algal communities dominated by undesirable and nuisance forms with risk of algal blooms greater then 50%. o As chlorophyll a concentrations approached least-impaired or reference concentrations, algal communities would be more balanced with fewer undesirable and nuisance forms and risks of algal blooms reduced to less then 10%. o Management scenarios Virginia Tributary Strategy and Virginia Tributary Strategy Alternative were closest to reference conditions. o Two independent scientific reviews by Virginia Institute of Marine Sciences (VIMS) and Virginia Commonwealth University (VCU) confirmed that the proposed chlorophyll a concentrations do not pose a threat to the long-term productivity of finfish and shellfish populations in James River. o Monitoring data from a station in the lower tidal fresh found 72% of the summer chlorophyll a concentrations in the lower tidal fresh James River were at levels associated with the risk of short term adverse health outcomes. o This alternatives analysis indicates that significant improvements could be obtained under the cap loads associated with the management scenarios Virginia Tributary Strategy, Virginia Tributary Strategy Alternative, and Scoping Scenario D. However, other scenarios such as Tier 2, Option 2 and Scoping B, also showed improvements in certain segments. This indicates that additional investigation of a combination scenario would prove beneficial. iii
6 TABLE OF CONTENTS EXECUTIVE SUMMARY...I INTRODUCTION...1 CHAPTER 1: BACKGROUND...3 CHAPTER 2: MANAGEMENT AND SCOPING SCENARIOS...7 CHAPTER 3: SPRING AND SUMMER MEAN CHLOROPHYLL A FOR ALL BAY SEGMENTS AND JAMES CFD ANALYSIS...15 CHAPTER 4: SUBMERGED AQUATIC VEGETATION RESPONSE TO MANAGEMENT AND SCOPING SCENARIOS...43 CHAPTER 5: RELATING CHLOROPHYLL CONCENTRATIONS AND STANDARD NITROGEN LOADS...49 CHAPTER 6: QUESTIONS RELATED TO THE ALTERNATIVES ANALYSIS FOR CHLOROPHYLL-A STANDARDS WILLIAMS SB APPENDIX A...65 APPENDIX B...71 APPENDIX C...79 iv
7 INTRODUCTION In Virginia proposed numerical water quality criteria for chlorophyll a applicable to the tidal James River. These criteria were part of a larger rulemaking that included new designated uses and nutrient and sediment related criteria for Chesapeake Bay and its tidal tributaries. As a result of the public comment process for that rulemaking, the VA Department of Environmental Quality along with the U.S. EPA Chesapeake Bay Program Office committed to investigate alternative cap load allocation scenarios for the James River to see if different cap load allocations could provide equivalent environmental benefits with much lower economic impacts to localities before adopting these numerical chlorophyll a criteria. This document describes that analysis. The analysis is laid out in six Chapters. Chapter 1 provides the background of Virginia s water quality regulatory history related to the current rulemaking. Descriptions of the thirteen management and scoping scenarios used in this analysis are included in Chapter 2. These scenarios are the 1985 Reference, 2002 Assessment, Tier 1, Tier 2, Tier 3, Virginia Tributary Strategy, Virginia Tributary Strategy Alternative, Option 4, and E3 Scenario as well as four scoping scenarios. Chapter 3 contains model simulated spring and summer mean chlorophyll a concentrations for all Bay segments and model simulated attainment levels of the proposed numerical chlorophyll a criteria for all the tidal James River segments. Chapter 4 is an analysis of model simulated James River light attenuation levels. Model simulated water quality criteria attainment and estimated acreages of restored SAV are examined as well. Chapter 5 contains plots of chlorophyll a concentrations and estimated chlorophyll a criteria attainment related to James total nitrogen loads. For all of these analyses, both spring or summer seasons are used, with spring season set at March through May while a summer season consists of July through September. The appropriate SAV growing seasons are used for the clarity attainment criteria. Chapter 6 contains a response to questions raised during 2005 General Assembly with the introduction of SB 809 (Williams) and the Alternative Analysis for Chlorophyll a Standards (see Appendix A). 1
8 [ THIS PAGE INTENTIONALLY LEFT BLANK ] 2
9 Chapter 1: BACKGROUND The existing Virginia Water Quality Standards regulation (9 VAC ) designates all waters for the propagation and growth of a balanced, indigenous population of aquatic life, including game fish, which might reasonably be expected to inhabit them. The intent of the use designation is to maintain balanced populations of all aquatic life from the base of the food chain (algae) up to commercial and recreational fishes. Virginia's existing narrative criteria in the Water Quality Standards further require that substances which nourish undesirable or nuisance aquatic plant life will be controlled (9 VAC ). To meet that requirement, Virginia adopted the Nutrient Enriched Waters (9 VAC ) and Policy for Nutrient Enriched Waters (9 VAC 25-40) in These existing regulations also recognized that nutrients were contributing to undesirable growths of aquatic plant life, classified waters as nutrient enriched and imposed phosphorus limits on discharges to waters classified as nutrient enriched. The Chesapeake Bay and its tidal tributaries were all classified as nutrient enriched under these regulations. Chlorophyll a was also recognized in the Nutrient Enriched Waters sections of the regulation as an indicator of nutrient enrichment. Virginia's existing Water Quality Standards narrative criteria have been in place since However, the tidal James River has the most 'unbalanced' phytoplankton community compared to Virginia s other tidal waters with numerous observations of over-abundances of undesirable plant life. Also, in May 1999, the tidal James River was included on the 303(d) impaired waters list due to violations of the general narrative criteria and nutrients. Waters included on the impaired waters list require the development of a total maximum daily load (TMDL). The Chesapeake 2000 Agreement specifies a goal to remove the Bay and its tidal tributaries from the impaired waters list by Thus, the development of a TMDL has been postponed until 2010 anticipating the Bay watershed states can achieve water quality standards by that time thereby making a TMDL unnecessary. To that end, a need for appropriate water quality standards was identified in order to define accurate water quality goals for assessment. After the 303(d) impairment listing, it was clear to the Virginia Department of Environmental Quality (DEQ) that continuing with a narrative criteria approach to the tidal James River ecosystem will not provide the technical basis for implementing the necessary nutrient loading reduction actions needed to restore balance to that ecosystem. Narrative criteria are difficult to implement and enforce. Therefore, it has been recommended by the U.S.EPA that the Commonwealth needs numerical criteria for chlorophyll a applied to the tidal James River to quantify the water quality conditions necessary for the protection already required by the use designation and narrative criteria within the existing Virginia Water Quality Standards Regulation. To further support the need for numerical chlorophyll a criteria, U.S. EPA strongly encourages numerical chlorophyll criteria when there s existing nutrient related impairment and that impairment will likely persist after nutrient and sediment reductions are made in order to remove dissolved oxygen or water clarity impairments. This is the case in the tidal James River. 3
10 In November 2004, DEQ proposed for public comment five new use designations and nutrient and sediment related numerical and narrative criteria for the Chesapeake Bay and its tidal tributaries. These amendments are all based on recommendations from the U.S. EPA Ambient Water Quality Criteria for Dissolved Oxygen, Water Clarity and Chlorophyll a for the Chesapeake Bay and its Tidal Tributaries, April 2003 and Technical Support Document for Identification of Chesapeake Bay Designated Uses and Attainability, October 2003 and their 2004 addendums. The Department also proposed numerical chlorophyll a criteria for the tidal James River. In March 2005, all U.S. EPA recommended use designations and numerical criteria were adopted into State Water Quality Standards by the Virginia State Water Control Board except for the numerical chlorophyll a criteria for the James River and special dissolved oxygen criteria for the Mattaponi and Pamunkey Rivers. The postponement was necessary to respond to many technical comments received from the Virginia Municipal Wastewater Agencies (VAMWA) on the numerical chlorophyll a criteria. In addition, the technical comments prompted Senator Williams to offer SB 811 to the General Assembly. The bill would have required an analysis of the benefits, detriments, and the economic and social costs associated with alternatives when the State Water Control Board considered adoption of a chlorophyll standard. While the bill remained in the Committee of Agriculture, Conservation and Natural Resources, the DEQ committed to investigate alternative chlorophyll a criteria or load allocation scenarios for the James River, which could provide equivalent environmental benefits with much lower economic impacts to localities before adopting these numerical chlorophyll a criteria. Based on various correspondences, a list of scenarios were developed with a focus on isolation of James River and Focus on Nutrients, not Sediment (Pomeroy 2005a,b). While impossible to address all their concerns with the tools at our disposal, both DEQ and USEPA staff feel all of the critical issues are addressed in the following report. To best accomplish this evaluation, the Chesapeake Bay Eutrophication Model was used to simulate a range of nutrient load scenarios and associated chlorophyll a concentrations and water clarity (SAV acreage) changes expected to occur in the tidal James River. VAMWA requested one scenario representative of existing (2002) conditions, one of the Virginia 2004 tributary strategy and three to test various levels of nutrient removal where sediment load were kept low (Table 1). Ultimately, thirteen scenarios were evaluated. Loadings and concentrations ranged from 1985 conditions through E3 (everything, everybody, everywhere) and four scoping scenarios where nutrient concentrations varied in the James Basin but sediments loadings were kept at 2005 tributary strategy levels. These model scenarios are described in Chapter 2. Resulting chlorophyll a concentrations and levels of estimated chlorophyll a attainment are presented in Chapter 3. As requested by VAMWA, estimated attainment of a range of alternative incremental chlorophyll a criteria concentrations for each scenario are presented (Pomeroy 2005b). There are other non-regulatory, regulatory and legislative actions that are related to this analysis. Before criteria or impairments were identified, the U.S. EPA Chesapeake Bay Program, along with the Bay states, established non-regulatory Tributary Strategies for each basin to improve living resources in the watershed. These strategies were updated in 2005 and contain agreed upon nutrient cap load allocations for each basin. These goals are voluntary agreements but were based on EPA s recommendations for water quality standards for the Chesapeake Bay and its tidal tributaries. These are the same standards now in regulatory development in Virginia. 4
11 Table 1.1. List of alternative model scenarios proposed by VAMWA in the James Alternatives Analysis Scenario Descrip TS (rev.) *** Progress Regional nutrient removal assumptions AFL TF LE 1996 Progress 2002 Progress 3 Intermed Progress BNR equivalent 2002 Progress 1996 Progress 2002 Progress Tier Progress James sediment removal assump. VATS Progress VATS 2005 Northern Bay* nutrient removal 2003 Cap Allocation 2002 Progress 2003 Cap Allocation 4 Intermed. 2 Tier 1 Tier 1 Tier 1** VATS Cap Allocation 5 VATS 2005 VATS 2005 Source: Pomeroy 2005a VATS 2005 VATS 2005 VATS Cap Allocation New or existing scenario New Scoping scenarios A Existing 2002 Progress New New Existing B C VATS 2005 * Northern Bay is represented by the Rappahannock River and north. ** Tier 1 reflects performance of 8 mg/l TN at existing BNR facilities and year 2000 loads at non BNR plants. *** 2002 Progress was later renamed 2002 Model Assessment or 2002 Assessment hereafter (refer to Chapter 2) AF L= Above fall line James River.Basin TF = Tidal fresh water region tidal river segment JMSTF LE = Lower estuary region tidal river segments JMSOH, JMSMH, and JMSPH. As previously mentioned, DEQ committed to consider the results of this analysis before adopting the numerical chlorophyll a criteria for the tidal James River (Table 1.2). To implement these criteria (and the dissolved oxygen and water clarity criteria), amendments to the Water Quality Management Planning Regulation and the Policy for Nutrient Enriched Waters are being considered. The Water Quality Management Planning Regulation specifies nitrogen and phosphorus loading allocations for significant dischargers in the Chesapeake Bay watershed. The final chlorophyll a criteria, along with the other new criteria, will dictate the nutrient and sediment loading reductions necessary within the James basin. The Policy for Nutrient Enriched waters (renamed Regulation for Nutrient Enriched Waters) specifies technology based nutrient limits for certain dischargers. Also, the 2005 Virginia General Assembly established a watershed general permit and point source nutrient trading program to assist in meeting the load allocations for the Chesapeake Bay. The resulting regulation from that legislation will provide a cost-effective means to achieve the nutrient reductions needed to meet the assigned nutrient allocations for point source dischargers. 5
12 Table 1.2. Proposed numerical chlorophyll a (µg/l) criteria for tidal James River. Segment/Season Spring Chl a (mg/l) Summer Chl a (mg/l) Tidal Fresh Upper (JMSTF2) Tidal Fresh Lower (JMSTF1) Oligohaline (JMSOH) Mesohaline (JMSMH) Polyhaline (JMSPH) Source: Virginia DEQ 2004 (revised 2005) References: Pomeroy, C.D. 2005a. Alternative Analysis for Chl STD. dated February 09, Pomeroy, C.D. 2005b. Alternative Analysis for Chl STD. dated April 15, Virginia Department of Environmental Quality Virginia Department of Environmental Quality Technical Report: Chlorophyll a Numerical Criteria for the tidal James River. November 30, 2004 (revised January 12, 2005). 6
13 Chapter 2: MANAGEMENT AND SCOPING SCENARIOS This chapter contains a description of the thirteen model scenarios used in this analysis for the tidal James River. It is separated into two sections. The first is a brief history followed by a description of the scenarios employed during this investigation. There were nine management scenarios (1985 Reference, 2002 Model Assessment, Tier 1, Tier 2, Tier 3, Virginia Tributary Strategy (VATS), Virginia Tributary Strategy Alternative, Option 4, and E3) as well as four scoping scenarios. Virginia Department of Environmental Quality along with the U.S. EPA Chesapeake Bay Program Office committed to investigate alternative chlorophyll a criteria for various load allocation scenarios for the tidal James River. This investigation was to assess if different nutrient cap load allocations could provide equivalent environmental benefits with much lower economic impacts to localities before adopting the proposed numerical chlorophyll a criteria. To best accomplish this evaluation, the Chesapeake Bay Eutrophication Model was used (Cerco and Noel 2004). The modeling framework provided projections of expected water habitat quality responses in the tidal James River under a variety of nutrient and sediment loading options. The management scenarios were developed as part of the Chesapeake 2000 Agreement and EPA s document for the Regional Criteria Guidance that included Designated Uses and Attainability. For example, 1985 Reference was used to establish a reference to compare other scenarios. This reference represented the entire Chesapeake Bay and its tidal tributaries in 1985 with respect to point and non-point sources as well as atmospheric loadings. The 2002 Model Assessment examined progress anticipated from reducing nutrient and sediment loadings from 1985 to The Tier 1, 2 and 3, Option 4, and E3 scenarios were developed and fully described as part of the Technical Support Document for Identification of Chesapeake Bay Designated Uses and Attainability (USEPA 2003a) and the Setting and Allocating the Chesapeake Bay Basin Nutrient and Sediment Loads (USEPA 2003b). The two Virginia Tributary Strategy Scenarios (VATS and VATS Alternative) were designed to assess expected water and habitat quality anticipated with local tributary strategies described in Chesapeake Bay Nutrient and Sediment Reduction Tributary Strategy for the James River, Lynnhaven and Poquoson (Virginia 2005). Four scoping scenarios were intended to examine different nutrient levels combined with a high level of sediment controls as defined under Virginia Tributary Strategy. However, the scoping runs were acknowledged to be unrealistic as management scenarios. For example, in the case of Scoping Scenario A, non-point source management practices for controlling sediment at the 2005 Tributary Strategy level would also reduce nutrient loads, particularly phosphorus, beyond that of the 2002 Assessment Scenario. All of the scenario results were based on a ten-year simulation period of varying hydrology in the Chesapeake watershed with emphasis on water quality and living resource responses to tidal James River. The simulation period included the 1985 to 1994, inclusive. 7
14 DESCRIPTION OF SCENARIOS The thirteen scenarios used in this analysis were the 1985 Reference, 2002 Model Assessment, Tier 1, Tier 2, Tier 3, Virginia Tributary Strategy (VATS), Virginia Tributary Strategy Alternative, Option 4, and E3 Scenarios and four scoping scenarios which apply high levels of sediment load reduction while exploring different levels of nutrient reductions. Table 2.1 and 2.2 lists the James nutrient and sediment loads from the watershed model for each of the thirteen scenarios of this analysis. Additional scenario documentation and watershed model description can be found in Technical Support Document for Identification of Chesapeake Bay Designated Uses and Attainability (USEPA 2003a) and Setting and Allocating the Chesapeake Bay Basin Nutrient and Sediment Loads (USEPA 2003b). Point source loads by basin segment for each scenario from watershed model are in Table 2.3. A description of each scenario follows with Table 2.4 outlining the basic assumptions used for nutrient and sediment loadings employed Reference Scenario The 1985 Reference Scenario was an estimate of the nutrient and sediment loads to the tidal Chesapeake under 1985 conditions. This scenario was used as a measure of progress since 1985, when the highest level of nutrient and sediment loads were entering the Bay. The 1985 Reference Scenario used 1985 land use, point source flows, and animal population estimates as input data. Shoreline sediment input was consistent with the year 2000 shoreline management practices Model Assessment Scenario (VAMWA Scenario 2) The 2002 Model Assessment Scenario (previously referred to as the 2002 Progress Scenario hereafter called 2002 Assessment) estimated nutrient and sediment loads delivered to the tidal Chesapeake under implementation of 2002 BMPs and point source loads. Estimated loads for the 2002 Model Assessment Scenario provided an assessment of current levels of nutrient and sediment load controls. This simulation used 2002 land use, point source flows, and animal population estimates as input data. Shoreline sediment input was consistent with the year 2000 shoreline management practices. It corresponds to Scenario 2 from Table 1.1. Tier 1 Scenario The Tier 1 Scenario assumed the current rates of implementation of nutrient and sediment controls projected to a 2010 land use, point source flows, and animal population estimates. Shoreline sediment input was consistent with the year 2000 shoreline management practices. Tier 2 Scenario The Tier 2 Scenario assumed an accelerated rate of implementation of nutrient and sediment controls applied to 2010 land use, point source flows, and animal population estimates as input data. All significant point sources were set at the estimated 2010 flows with nitrogen concentrations of 8.0 mg/l, and phosphorus concentrations of 1.0 mg/l or their current permit, whichever was less. Significant industrial dischargers reduce nutrient dischargers to half that of Tier 1 loads or to the permit limit, whichever was less. Shoreline sediment input was consistent with the year 2000 shoreline management practices. Tier 3 Scenario The Tier 3 Scenario assumed the maximum practical rate of acceleration of nutrient and sediment control implementation applied to 2010 land use, point source flows, and animal 8
15 population estimates as input data. All significant point sources were set at the estimated 2010 flows with nitrogen concentrations of 5.0 mg/l, and phosphorus concentrations of 0.5 mg/l or their current permit, whichever was less. Significant industrial dischargers reduce nutrient dischargers to 80% that of Tier 1 loads or to the permit limit, whichever was less. Shoreline sediment input was consistent with the year 2000 shoreline management practices. Virginia Tributary Strategy Scenario (VATS) (VAMWA Scenario 5) The Virginia Tributary Strategy Scenario used the information provided by the Virginia Tributary Strategies combined with information from the Pennsylvania, Maryland, and District of Columbia tributary strategies to generate estimates of loads as close as possible to the final tributary strategies. Final tributary strategies were not available from New York, West Virginia, or Delaware and from these States the loads from the Confirmation scenario, a condition described as a best guess of the final tributary strategy, were used. Shoreline management was applied as specified in the Tributary Strategy, which was slightly more than a 20% reduction of shoreline loads used in Option 4. Virginia Tributary Strategy Alternative Scenario The Virginia Tributary Strategy Alternative Scenario applied controls of enhanced nutrient reduction on point source dischargers in the James mesohaline and polyhaline regions. Enhanced nutrient removal was set at levels of total nitrogen control at 5.0 mg/l and phosphorus at levels of total phosphorus control of 0.5 mg/l. These control levels harmonized the level of the Virginia Tributary Strategy point source discharge controls more consistently throughout the James River basin. Apart from the point source reductions in the mesohaline and polyhaline regions of the Bay this scenario was identical to the Virginia Tributary Strategy Scenario. Shoreline management was applied as specified in the Tributary Strategy, which was slightly more than a 20% reduction of shoreline loads used in Option 4 scenario described below. Option 4 Scenario The Option 4 Scenario assumed an overall Bay-wide load of 188 million pounds nitrogen and 13.3 million pounds phosphorus. This load was achieved by setting the basins of the Potomac and above to the Tier 3 level of loads, and the Rappahannock, York, James, and East Shore Virginia basin to their existing (1998) tributary strategy levels of nutrient reductions. Shoreline sediment reductions of 20% were from the base calibration. E3 Scenario The E3 Scenario has been described as everyone, everywhere, does everything. It was based on a level of implementation that would occur if there were no constraints on costs or certain physical limitations as to the practical level of implementation of some BMPs using 2010 estimated land use. All significant point sources were set at estimated 2010 flows (industries set to 2000 flows) with nitrogen concentrations of 3.0 mg/l, and phosphorus concentrations of 0.1 mg/l or their current permit limit, whichever was less. Shoreline sediment input was consistent with the year 2000 shoreline management practices. Scoping Scenario A (VAMWA Scenario 1) This was the first of four scoping scenarios that focus on estimated water quality effects from different nutrient load levels while maintaining a high level of sediment reductions. Non-point source loads (including land use and animal population) of nitrogen and phosphorus were at 9
16 2002 Model Assessment Scenario levels, and non-point source sediment loads were set at the higher levels of the 2005 James Tributary Strategy load. James point source loads varied by region. In the free flowing James River watershed above Richmond, typically represented as above the fall line and for all regions of the tidal James but the tidal fresh, point source flows and loads were set at the level of 1996 flows and loads. For the tidal fresh region of James River, point source flows were at 1996 levels and point source loads were determined by a an assumed level of BNR control with a level of nitrogen control of 8.0 mg/l and a point source phosphorus concentration of 2.0 mg/l. Industrial loads were decreased by half their 1996 loads (representing a 1996 flow and 50% reduction in 1996 nutrient concentrations). The tidal fresh region of the James is shown in Figure 2.1. The five major regions of the James including the Tidal Fresh Upper, Tidal Fresh Lower, Oligohaline, Mesohaline, and Polyhaline are shown in Figure 2.2. Tributary Strategies were used for all basins with 2010 levels of land use except James River. Shoreline management was applied as specified in the Tributary Strategy, which was slightly more than a 20% reduction of shoreline loads used in Option 4. This scoping simulation corresponds to Scenario 1 from Table 1.1. Scoping Scenario B (VAMWA Scenario 3) This second scenario used the 2002 Model Assessment Scenario nutrient loads as described above in all the tidal regions of James River but the tidal fresh. The tidal fresh James region nutrient loads were set at Tier 2 (2010) levels for point and non-point sources. Tier 2 point source loads were set at 8.0 mg/l nitrogen and 1.0 mg/l phosphorus for municipal dischargers and industrial dischargers have nutrient levels reduced to half that of the Tier 1 levels or set at the permit limit, whichever is less. Throughout the James, the sediment loads were set at 2005 James Tributary Strategy levels. Tributary Strategies were used for all basins with 2010 levels of land use but James River. Shoreline management was applied as specified in the Tributary Strategy, which was slightly more than a 20% reduction of shoreline loads used in Option 4 scenario. This scenario corresponds to Scenario 3 from Table 1.1. Scoping Scenario C (VAMWA Scenario 4) Scoping Scenario C used Tier 1 nutrient loads in the James as described in the Tier 1 Scenario above, but substituted the 2005 James Tributary Strategy load of suspended sediment. Scoping Scenario C has the highest nutrient loads of all the scoping scenarios because Tier 1 point source loads were calculated as 2010 flows from point source dischargers combined with the 2000 point source concentrations (USEPA 2003b). Tributary Strategy loads were used for all basins, except for James with 2010 land use. Shoreline management was applied as specified in the Virginia Tributary Strategy scenario, which was slightly more than a 20% reduction of shoreline loads used in Option 4 scenario. This scenario corresponds to Scenario 3 from Table 1.1. Scoping Scenario D Scoping Scenario D used Tier 3 nutrient loads in the James as described in the Tier 3 Scenario above, but substituted the 2005 James Tributary Strategy load of suspended sediment. Tier 3 point source loads were at 5.0 mg/l and 0.5 mg/l for nitrogen and phosphorus respectively for municipal dischargers. Industrial dischargers reduce nutrient loads to 80% that of Tier 1 or the permit limit, whichever was less. Tributary Strategy loads were used for all basins with 2010 land use with the exception of James River. Shoreline management was applied as specified in the Virginia Tributary Strategy scenario, which was slightly more than a 20% reduction of shoreline loads used in Option 4 scenario. 10
17 References Cerco, CF and MR Noel The 2002 Chesapeake Bay Eutrophication Model. EPA 903-R- 04, U.S. EPA Chesapeake Bay Program Office, Annapolis, MD. July. USEPA. 2003a. Technical Support Document for Identification of Chesapeake Bay Designated Uses and Attainability. EPA 903-R , U.S. EPA Chesapeake Bay Program Office, Annapolis, MD. October. USEPA. 2003b. Setting and Allocating the Chesapeake Bay Nutrient and Sediment Loads. EPA 903-R , U.S. EPA Chesapeake Bay Program Office, Annapolis, MD. December. Virginia Chesapeake Bay Nutrient and Sediment Reduction Tributary Strategy for the James River, Lynnhaven and Poquoson (March). Table 2.1. James River basin model estimated total nitrogen (TN), total phosphorus (TP), and total suspended sediment (TSS) loads for point and non-point sources delivered to tidal waters. Nutrients in million pounds; sediments in million tons. Scenario TN TP TSS * 1985 Reference Assessment Tier Tier Tier VATS VATS Alternate Option E Scoping Scenario A Scoping Scenario B Scoping Scenario C Scoping Scenario D * TSS loads were calculated from the watershed sediments but don't include: shoreline sediment reductions below the fall line. Source: U.S. EPA Chesapeake Bay Program Office 11
18 Table 2.2. James River basin model estimated point source nitrogen and phosphorus loads and as a percent of total loads delivered to tidal waters. Nutrients in million pounds. Point Source Nitrogen Phosphorus Million Million Scenario Pounds Percent Pounds Percent 1985 Reference % % 2002 Assessment % % Tier % % Tier % % Tier % % VATS % % VATS Alternate % % Option % % E % % Scoping Scenario A % % Scoping Scenario B % % Scoping Scenario C % % Scoping Scenario D % % Source: U.S. EPA Chesapeake Bay Program Office Table 2.3. James River point source total nitrogen (TN) and total phosphorus (TP) loads (million pounds) delivered to the basin segment from the watershed model. (AFLabove fall line; lower estuary everything below the tidal fresh) TN TP SCENARIO AFL Tidal Fresh Lower Estuary TN Total AFL Tidal Fresh Lower Estuary TP Total 1985 Reference Assessment Tier Tier Tier VATS VATS Alternative Option E Scoping A Scoping B Scoping C Scoping D Source: U.S. EPA Chesapeake Bay Program Office 12
19 Table 2.4. Management and scoping scenarios with a description of nutrient and sediment loadings. AFL- above fall line; TF tidal fresh; LE lower estuary; TS tributary strategy; PSsig significant point Description 1985 Reference 2002 Assess (VAMWA Scn 2) sources; nutrients are given in million pounds, sediments in million tons. Regional nutrient removal assumptions AFL TF LE James sedim. removal assump. Northern Bay nutrient removal Year of land use flow animal pop n Assess Tier 1 Tier 1 Current 2002 Assess Tier Current 2002 Assess Tier 1 Current 2002 Assess 2002 Assess 2002 Tier 1 Tier Tier 2 Tier 2 Tier 2 Tier 2 Tier 2 Tier Tier 3 Tier 3 Tier 3 Tier 3 Tier 3 Tier VATS (VAMWA Scn 5) VATS Alternative Option 4 VATS VATS VATS VATS Tributary Strategies (TS) VATS (except PS loading reductions increased in MH and PH) 2000 Allocation 2000 Allocation 2000 Allocation 2010 VATS TS Allocation Tier 3 Potomac and North 2000 Allocation Rapp, York, ES 2010 E3 E3 E3 E3 E3 E Ind =2000 Flow Scope A (VAMWA Scn 1) Scope B (VAMWA Scn 3) Scope C (VAMWA Scn 4) BNR = 8 & Progress Tier Progress 1996 VATS TS VATS TS 2002 James Land Use & Animal Pop 1996 Flow All Others James Land Use & Animal Pop 2010 Flow All Tier 1 Tier 1 Tier 1 VATS TS 2010 Other Information PS sig NPS TN 46.9 mil lbs TP 8.51 mil lbs TSS 1.28 mil ttons For existing NRT Sig PS TN 8mg/l Others TN 2000 All TP 2000 Ind = Current includes 2000 flows TN 37.7 TP 5.8 TSS 1.18 TN 37.3 TP 6.2 TSS 1.14 TN 28.2 TP 5.04 TSS 1.07 TN 8mg/l TP 1 mg/l Ind ½ Tier 1 TN 23 TP 3.91 TSS.95 TN 5 mg /l TP.5 mg/l Ind 80% Tier 1 TN 25.4 TP 3.49 TSS..82 TN 23.9 TP 3.37 TSS.82 TN 5 mg/l TP.5 mg/l In James MH and PH TN 28.1 TP 3.75 TSS.97 TN 15.2 TP 2.83 TSS.79 TN 3 mg/l TP.1 mg/l Ind = ½ conc. TN 37.6 TP 6.31 TSS.82 TN 8 TP 1 Ind = ½ Tier 1 TN 36.1 TP 6.13 TSS Conc. Varies by BMP See TSD Appendix A for descriptions NPS Sediment at VATS TN TP at 2002 TN 33.8 TP 5.77 TSS.82 Scope D New Tier 3 Tier 3 Tier 3 VATS TS 2010 TN TP 3.9 TSS.82 TN 5 mg/l TP.5 mg/l Ind 80% Tier 1 13
20 14
21 Chapter 3: SPRING AND SUMMER MEAN CHLOROPHYLL a FOR ALL BAY SEGMENTS AND JAMES CFD ANALYSIS This chapter of the report summarizes the model estimated spring and summer chlorophyll a concentrations (µg/l) for all Bay segments and the cumulative frequency distribution (CFD) based attainment assessment of the proposed James River chlorophyll a criteria. This analysis was based on specific requests (Pomeroy 2005a,b). The chapter is organized in three sections preceded by key findings. Section 3.a contains model estimated ten-year average spring and summer chlorophyll a concentrations for thirteen scenarios for all major Chesapeake Bay segments. Table 3.1 contains estimates for key management scenarios while Table 3.2 reflects results calculated for the scoping scenarios. Section 3.b contains the CFD based attainment assessment of the proposed chlorophyll a criteria for the tidal James River segments for both a ten-year average and a running three-year average are presented in Tables 3.3 to 3.12 for nine management scenarios while Tables 3.13 to 3.22 present results for the four scoping scenarios. At the time of this analysis, there was no published reference CFD so a default reference curve was used that allowed for 10% non-attainment over space and time. It is believed this may have created more non-attainment than would be expected from a true reference curve. The last section, 3.c, has box and whisker plots of observed and simulated chlorophyll a concentrations by tidal James River segment (Figures 3.1 through 3.14). Observed data from 1985 to 2004 by segment are presented in Figures 3.1 to 3.4. All Values includes all single observations, Monthly Means is the monthly average of all values and Annual Means is the annual means of the twenty years of observations. Shown are the range, the 25 th and 75 th percentiles, and the median. Figures 3.5 through 3.14 represent model estimates of the seasonal chlorophyll a concentrations of the range, the 25 th and 75 th percentiles, and the median under the management and scoping scenarios. These estimates are based on monthly means across the ten year simulation. Key Findings: The James Lower Tidal Fresh (JMSTF1) was the critical segment for nutrient reductions. o This region displayed the highest estimated summer chlorophyll a concentrations of all the segments and shows the greatest response to nutrient reductions with lower chlorophyll a concentrations based on 10 year averages and medians (Tables 3.1 and 3.2 and Figures ). o 10-year mean was reduced by 11.5 µg/l from 2002 Assessment VATS. o While useful comparisons for temporal and spatial responses, these seasonal averages should not be used to measure attainment. Except for JMSTF1, the mean concentrations do not vary more than 3.5 ug/l for the other segments (Table 3.1). Medians exhibit the same invariable pattern (Figures ). Maximum values responded better than means or medians to nutrient reductions (Figures ) indicating the frequency and magnitude of algal blooms is reduced. Table 3.1 indicates all criteria are met as 10 year averages under Tier 2 and Scoping Scenario B, but this same table does not reflect how attainment will be measured. Attainment is measured using 3-years of data and subjected to a cumulative frequency 15
22 analysis or CFD as shown in Tables The CFD analysis results in nonattainment in segments that appear to be meeting the criteria in Tables 3.1 and 3.2. The CFD analysis was done without the aid of published reference curve for chlorophyll and observed data were compared to a default reference curve that allows non-attainment of 10% over space and time. A true reference curve based on the reference condition should result in better attainment in these segments. The ten-year CFD attainment results show more attainment than three-year CFD results. The CFD analysis (Tables ) show attainment over many three year periods from 1986 through 1994 with all segments except TF1 and OH (summer) and MH and PH (spring). The CFD analysis of the scoping scenarios A C (Tables ) show a higher degree of non-attainment in TF2, TF1, OH (summer), MH (spring), PH (spring) than under VATS. Nutrient loads were the primary influence of chlorophyll a concentrations. Chlorophyll a criteria attainment improves significantly in scenarios where the sediment load reductions remain constant but nutrient levels decrease. This was seen when comparing scoping scenarios A - C to the Virginia Tributary Strategy scenario where the sediment loadings are set constant but nitrogen loadings decrease from 37.6 to Non-attainment improved from 40% to below 1%. Sediment reductions alone did not improve chlorophyll a concentrations but could actually increase levels in certain regions. This included JMSTF2 and PAXTF as seen with Tiers 1, 2, 3, Opt 4 and VATS (Table 3.1) Section 3.a: Ten-Year Average Spring and Summer Chlorophyll a Concentrations The model estimated ten-year average spring and summer chlorophyll a concentrations for all major Chesapeake Bay segments (CB segments) are presented in Table 3.1. The spring chlorophyll season included the months of March through May. The summer chlorophyll season runs from July through September. The James Lower Tidal Fresh (JMSTF1) displayed the highest estimated summer chlorophyll a concentrations of all the CB segments in the 1985 Reference Scenario, and the second highest summer average concentration in the 2002 Assessment Scenario. Table 3.2 contains the ten-year average spring and summer chlorophyll a concentrations for the scoping scenarios A-D. Scoping Scenario C was comparable to the Tier 1 Scenario as both had the same nutrient loads to the tidal James but Scoping Scenario C had the higher sediment reductions associated with Virginia Tributary Strategy. In comparing the ten-year average chlorophyll a concentrations between these scenarios only minor differences were seen. Scoping Scenario D and Tier 3 were an analogous case, with the main difference being the higher levels of the Virginia Tributary Strategy controls on sediment loads included in Scoping Scenario D. Again, differences in the ten-year chlorophyll a concentrations were trivial, indicating that nutrient loads are the primary influence of chlorophyll a concentrations. With the exception of the E3 scenario, which was considered to be currently economically infeasible, the best overall performance in proposed chlorophyll a criteria attainment was shown by scenarios with the largest nutrient controls such as the Virginia Tributary Strategy Alternative Scenario, followed by the Virginia Tributary Strategy Scenario (VATS). The better performance of the Virginia Tributary Strategy Alternative Scenario was particularly noted in the spring season in the 16
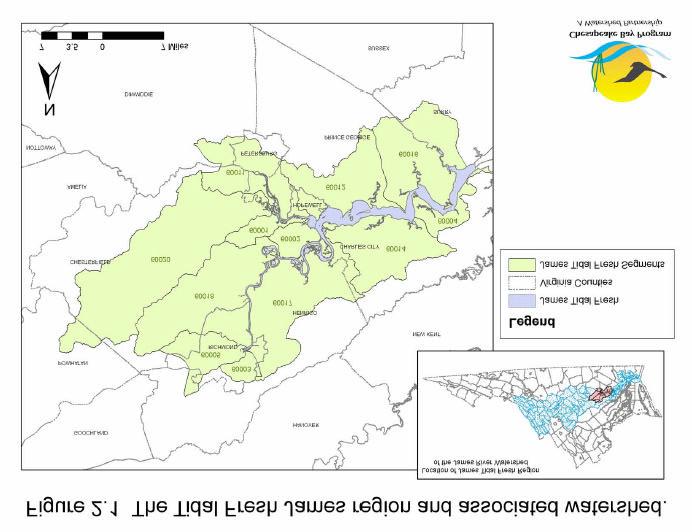
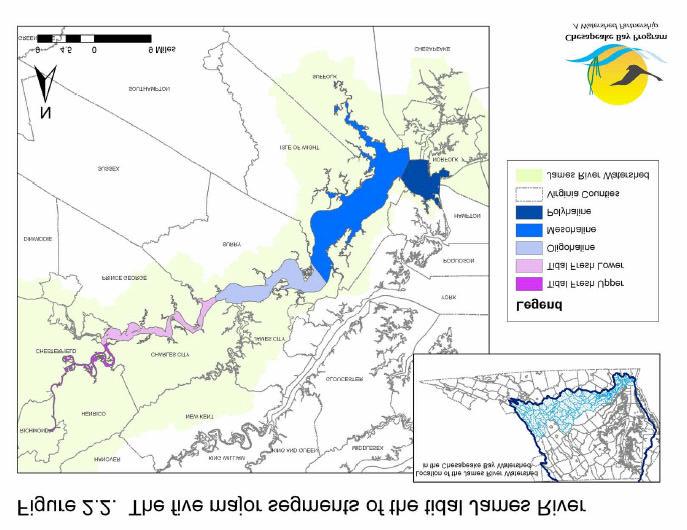
23 mesohaline tidal James River. A summary of three year seasonal means for the same period is provided in Appendix B. Section 3.b: James River CFD Analysis of Criteria Attainment Tables 3.3 to 3.12 provide the cumulative frequency distribution (CFD) based chlorophyll a attainment assessment results. These results were stated as percent (%) non-attainment, for the five tidal James River segments of the Upper Tidal Fresh, Lower Tidal Fresh, Oligohaline, Mesohaline, and Polyhaline for both a ten-year average and a running three-year average. A green A represents attainment of the proposed water quality criteria, and red values indicate the percent of time and space the segment was not meeting the proposed chlorophyll a criteria. A blue value represents a value of one percent or less of the time and space a segment is in nonattainment. Generally, attainment is assessed by plotting the data as a CFD and comparing that curve to a CFD developed from reference site data. The reference CFD estimates an accepted level of naturally occurring non-attainment. If the observed CFD is within the reference CFD, then the criterion is attained and all uses are met. However, for this analysis there is no published reference curve for chlorophyll and observed data are compared to a default reference curve that allows non-attainment of 10% over space and time. EPA has convened an academic committee to work on publication of a reference curve. EPA expects a reference curve based on the reference condition will result in more natural non-attainment. This will result in better attainment in these segments. Table 3.3 shows an unusual condition where almost all years achieve the chlorophyll a criteria except the last three-year period of 1992 to In this period the cause of non-attainment was due to one month, in one year, May In late April 1994 high flows were observed and simulated, along with high levels of nutrient loads delivered to the James Upper Tidal Fresh. A few weeks later, in May, blooms where observed in the James Upper Tidal Fresh. May s monthly average chlorophyll observed in the three James Upper Tidal Fresh tidal monitoring stations of TF5.2, TF5.2A, and TF5.3 were 19.5 µg/l, 47.3 µg/l, and 57.0 µg/l, respectively. This was an example of where hydrologic conditions cause high nutrient loads, in a once in a decade occurrence, which were estimated to exceed the criteria even under high and effective levels of nutrient control. Tables 3.13 to 3.22 present the scoping scenario CFD based chlorophyll a attainment assessment results for each tidal James River segment. As described above, Tier 1 Scenario could be compared with Scoping Scenario C, and Tier 3 Scenario compared with Scoping Scenario D. With respect to the time and space considerations of criteria attainment as estimated by the CDF, criteria attainment based on chlorophyll between these management and scoping scenarios were trivial. This indicated nutrients were the primary driver of chlorophyll a concentrations. Nuances can be seen, for example in the James Upper Tidal Fresh summer where the Scoping Scenario C has a higher non-attainment (5.3%) compared to the Tier 1 Scenario (2.8%). This could be attributed to the greater reduction of suspended sediment in the water column under the Scoping Scenario C conditions reducing algae light limitations. The overall result was increased chlorophyll non-attainment. Alternately, in the James Lower Tidal Fresh Summer, Scoping Scenario C has a slightly improved level of criteria attainment (50.4%), compared to Tier 1 17
Chesapeake Bay Water Quality Restoration:
 Chesapeake Bay Water Quality Restoration: The Transition to a Regulatory Approach Building on Decades of Cooperative Partnership Rich Batiuk Assoc. Director for Science Chesapeake Bay Program Office U.S.
Rationale Supporting Application of a Reference Curve for Assessment of the Chesapeake Bay Deep Channel Dissolved Oxygen Criterion
 Rationale Supporting Application of a Reference Curve for Assessment of the Chesapeake Bay Deep Channel Dissolved Oxygen Criterion Briefing Document for the CBP Scientific and Technical Advisory Committee
COG Region s Potomac Water Quality & Wastewater Treatment Fact Sheet (current draft, as of 7/28/09)
") COG Region s Potomac Water Quality & Wastewater Treatment Fact Sheet (current draft, as of 7/28/9) Background: Current Fact Sheet was prepared several years ago to summarize trends for certain water quality
COG Region s Potomac Water Quality & Wastewater Treatment Fact Sheet (current draft, as of 7/28/9) Background: Current Fact Sheet was prepared several years ago to summarize trends for certain water quality
Total Maximum Daily Load Development for Unnamed Tributary to Pitts Creek. Public Meeting March 26, Why Are We Here
 Total Maximum Daily Load Development for Unnamed Tributary to Pitts Creek Public Meeting March, Why Are We Here. Learn about water quality of the stream. Discuss the Total Maximum Daily Load (TMDL) development.
James River CHLa Study 2014 Review WQGIT. October 8, 2014
 James River CHLa Study 2014 Review WQGIT October 8, 2014 James River Watershed Virginia s largest river 3rd largest tributary to Chesapeake Bay Over 10,000 square miles (about 25% of VA) Home to 1/3 of
Phosphorus Goal Setting Process Questions and Answers 2010
 Lake Winnipesaukee Watershed Management Plan Phase I: Meredith, Paugus, Saunders Bays 1. What is phosphorus? Phosphorus (P) is a naturally occurring element and a major nutrient required for biological
Chlorophyll-based Water Quality Criteria for Protecting Aquatic Life Designated Uses
 Chlorophyll-based Water Quality Criteria for Protecting Aquatic Life Designated Uses Paul Bukaveckas Virginia Commonwealth University pabukaveckas@vcu.edu Eutrophication: A Long-standing Water Quality
Assessment of Chesapeake Assimilation Capacity Application to Phase III Draft Targets
 Assessment of Chesapeake Assimilation Capacity Application to Phase III Draft Targets Water Quality Goal Implementation Team January 22, 2018 Lew Linker, EPA-CBPO, Gary Shenk, USGS and Richard Tian, UMCES
COMMONWEALTH of VIRGINIA
 COMMONWEALTH of VIRGINIA Chesapeake Bay Nutrient and Sediment Reduction Tributary Strategy for the James River, Lynnhaven and Poquoson Coastal Basins March 2005 To the Citizens of the James River Basin:
U.S. Environmental Protection Agency s Interim Expectations for the Phase III Watershed Implementation Plans
 U.S. Environmental Protection Agency s Interim Expectations for the Phase III Watershed Implementation Plans The U.S. Environmental Protection Agency (EPA) provided expectations for the Phase I 1 and Phase
Biological Reference Curves for Assessing the James River Chlorophyll a Criteria
 Biological Reference Curves for Assessing the James River Chlorophyll a Criteria Final Report September 8, 2014 Prepared by Claire Buchanan, PhD Interstate Commission on the Potomac River Basin for Chesapeake
Reducing Nitrogen, Phosphorus and Sediment Pollution Progress Update. Jeff Corbin, Senior Advisor to the EPA Administrator
 Reducing Nitrogen, Phosphorus and Sediment Pollution Progress Update Jeff Corbin, Senior Advisor to the EPA Administrator Reducing Pollution Briefing Package Overview 1. 29-11 Milestones 2. 211 Progress
EXECUTIVE SUMMARY DRAFT CHESAPEAKE BAY TMDL
 EXECUTIVE SUMMARY DRAFT CHESAPEAKE BAY TMDL Introduction The U.S. Environmental Protection Agency has released the draft Chesapeake Bay Total Maximum Daily Load (TMDL), a pollution diet that will compel
U.S. Environmental Protection Agency s Interim Expectations for the Phase III Watershed Implementation Plans
 U.S. Environmental Protection Agency s Interim Expectations for the Phase III Watershed Implementation Plans The U.S. Environmental Protection Agency (EPA) provided expectations for the Phase I 1 and Phase
2017 Revised Guide for Chesapeake Bay Water Quality Two-year Milestones
 2017 Revised Guide for Chesapeake Bay Water Quality Two-year Milestones Purpose Based upon agreements by the Chesapeake Executive Council beginning in 2008, EPA created an accountability framework that
Decision Rationale. Total Maximum Daily Load for Phosphorus for the Sassafras River, Cecil and Kent Counties, Maryland 4/1/2002
 Decision Rationale I. Introduction Total Maximum Daily Load for Phosphorus for the Sassafras River, Cecil and Kent Counties, Maryland 4/1/2002 The Clean Water Act (CWA) requires a Total Maximum Daily Load
Observations on Nutrient Management and the Chesapeake Bay TMDL
 Observations on Nutrient Management and the Chesapeake Bay TMDL Introduction William J. Rue and Sadie B. Barr EA Engineering, Science & Technology, Inc. 15 Loveton Circle, Sparks, MD 21152 On 29 December
A restoration goal for Chesapeake Bay phytoplankton communities. Executive Summary
 A restoration goal for Chesapeake Bay phytoplankton communities Executive Summary A Phytoplankton Index of Biotic Integrity (PIBI) has been developed for Chesapeake Bay. 1 It is currently used to analyze
Appendix E. Summary of Initial Climate Change Impacts on the Chesapeake Bay Watershed Flows and Loads
 Appendix E. Summary of Initial Climate Change Impacts on the Chesapeake Bay Watershed Flows and Loads The potential effects of climate change have not been explicitly accounted for in the current Chesapeake
Fact Sheet. Pennsylvania s Chesapeake Bay Tributary Strategy Goals for Nutrient and Sediment Reduction and Habitat Restoration
 Fact Sheet Commonwealth of Pennsylvania Department of Environmental Protection Pennsylvania s Chesapeake Bay Tributary Strategy Goals for Nutrient and Sediment Reduction and Habitat Restoration Why were
Water Quality Trading and Offsets in the Chesapeake Bay Watershed. Beth McGee Chesapeake Bay Foundation
 Water Quality Trading and Offsets in the Chesapeake Bay Watershed Beth McGee Chesapeake Bay Foundation Founded: 1967 Staff: 170 Members: 220,000 Offices: Annapolis, Richmond, Harrisburg, Washington, Norfolk
MARYLAND ASSOCIATION OF MUNICIPAL WASTEWATER AGENCIES, INC. VIRGINIA ASSOCIATION OF MUNICIPAL WASTEWATER AGENCIES, INC. M E M O R A N D U M
 MARYLAND ASSOCIATION OF MUNICIPAL WASTEWATER AGENCIES, INC. VIRGINIA ASSOCIATION OF MUNICIPAL WASTEWATER AGENCIES, INC. M E M O R A N D U M TO: FROM: CC: CBP Water Quality Steering Committee Representatives
Adjustments to the Bay s Assimilative Capacity & Determination of Additional Nitrogen and Phosphorus Loads
 Adjustments to the Bay s Assimilative Capacity & Determination of Additional Nitrogen and Phosphorus Loads Rich Batiuk Associate Director for Science, Analysis and Implementation U.S. EPA Chesapeake Bay
Full Title of Priority: Enhanced Analysis and Explanation of Water-Quality Data for the TMDL Mid-Point Assessment
 MIDPOINT ASSESSMENT PRIORITY WORK PLAN: MEASURE AND EXPLAIN WATER-QUALITY CHANGES LEAD: SCIENTIFIC, TECHNICAL ANALYSIS, AND REPORT (STAR) TEAM 2016-17 EXPECTATIONS Full Title of Priority: Enhanced Analysis
LAKE TARPON WATER QUALITY MANAGEMENT PLAN SCOPE OF WORK
 LAKE TARPON WATER QUALITY MANAGEMENT PLAN SCOPE OF WORK Project Background Lake Tarpon With a surface area of approximately four square miles and a watershed of approximately 52 square miles, Lake Tarpon,
Qian Zhang (UMCES / CBPO) Joel Blomquist (USGS / ITAT)
 Joel Blomquist (USGS / ITAT)") CBP STAC Water Clarity Workshop Solomons, MD, 02/06/2017 Long-term Riverine Inputs from Major Tributaries to Chesapeake Bay Relevant to Water Clarity Qian Zhang (UMCES / CBPO) Joel Blomquist (USGS / ITAT)
CBP STAC Water Clarity Workshop Solomons, MD, 02/06/2017 Long-term Riverine Inputs from Major Tributaries to Chesapeake Bay Relevant to Water Clarity Qian Zhang (UMCES / CBPO) Joel Blomquist (USGS / ITAT)
Assessment Protocol for Numeric James River Chlorophyll-a Criteria: Issues and Options
 Assessment Protocol for Numeric James River Chlorophyll-a Criteria: Issues and Options Tish Robertson VA Department of Environmental Quality Criteria Assessment Protocol Workgroup August 9 th, 2016 Richmond
Jordan River TMDL Update
 Jordan River TMDL Update 2010 Watershed Symposium August 4 th, 2010 Hilary N. Arens Utah Division of Water Quality Jordan River TMDL Outline What is a TMDL and what is the Jordan impaired for? Evaluation
APPENDIX A. Nutrient Trading Criteria Specific for the Chesapeake Bay Watershed
 Purpose: APPENDIX A Nutrient Trading Criteria Specific for the Chesapeake Bay Watershed The purpose of Appendix A is to provide additional program specific information regarding the use and incorporation
Evaluation of Water Quality in. Sylvia Heaton Water Bureau, MDNRE
 Evaluation of Water Quality in Ford and Belleville Lakes Sylvia Heaton Water Bureau, MDNRE Objectives of 2010 TMDL Reevaluation Evaluate nutrient (total phosphorus) levels in Ford and Belleville Lakes
Critical Period for the Chesapeake Bay TMDL
 Critical Period for the Chesapeake Bay TMDL September 29 th and 30 th, 2009 Presentation C Bob Koroncai and Mike Haire U.S. EPA Region III Water Protection Division and U.S. EPA Office of Water Choosing
chapter vi Summary and Economic Analyses
 163 chaptervi Summary and Economic Analyses In developing revised water quality criteria, designated uses and boundaries for those uses in the Chesapeake Bay and its tidal tributaries, the Chesapeake Bay
DRAFT. Tidal Trends in Water Quality: Potomac River 2017 Tributary Summary
 DRAFT Tidal Trends in Water Quality: Potomac River 2017 Tributary Summary Sept 26, 2018 1 Contents 1. Location... 3 1.1 Watershed Physiography... 3 1.2 Tidal Waters and Stations... 4 2. Tidal Water Quality
Protecting & Restoring Local Waters and the Chesapeake Bay
 Protecting & Restoring Local Waters and the Chesapeake Bay Restore America s Estuaries National Conference Gregory Barranco Chesapeake Bay Program Office November 2010 The Chesapeake Bay and Watershed
Content Overview of the next Chesapeake Bay Ambient Water Quality Criteria Technical Addendum
 Content Overview of the next Chesapeake Bay Ambient Water Quality Criteria Technical Addendum Peter Tango USGS@CBPO February 12, 2016 STAC Criteria Addendum Review Panel The Water Quality Standards Framework
2014 Chesapeake Bay Watershed Agreement:
 2014 Chesapeake Bay Watershed Agreement: Management Strategy for the 2017 WIP Outcome, 2025 WIP Outcome, and Water Quality Standards Attainment & Monitoring Outcome Introduction Draft February 9, 2015
Retrospective analysis of hydrologic impacts in the Chesapeake Bay watershed
 Retrospective analysis of hydrologic impacts in the Chesapeake Bay watershed Harsh Beria1,3, Rob Burgholzer2, Venkat Sridhar3 Indian Institute of Technology Kharagpur, India & Summer intern Virginia Department
Nutrients & Algal Blooms Developing water quality standards for the James River.
 Nutrients & Algal Blooms Developing water quality standards for the James River. Dr. Paul A. Bukaveckas and Dr. Joseph Wood Department of Biology Center for Environmental Studies http://wp.vcu.edu/jamesriver/
The Chesapeake Bay Blueprint:
 PHASE II The Chesapeake Bay Blueprint: THE BEST HOPE FOR RESTORING CLEAN WATER THIS NATION HAS EVER SEEN Peter McGowan/U.S. Fish and Wildlife Service Strategic Plan 2016-2020 The Chesapeake Bay Foundation
The Virginia Chesapeake Bay Watershed Nutrient Credit Exchange Program. *CH2M HILL, 1100 Wayne Ave, Suite 670, Silver Spring, MD 20904
 The Virginia Chesapeake Bay Watershed Nutrient Credit Exchange Program Cy, Jones*, M. Haley 1, G. Harvey 2, and E. Bacon 3 *CH2M HILL, 1100 Wayne Ave, Suite 670, Silver Spring, MD 20904 1 City of Hopewell,
Some Context behind the Implementation of Numeric Nutrient Criteria or Why do we have these Water Quality Regulations?
 Some Context behind the Implementation of Numeric Nutrient Criteria or Why do we have these Water Quality Regulations? Mark W. Clark and Thomas Obreza Soil and Water Science Department University of Florida,
Fact Sheet Commonwealth of Pennsylvania Department of Environmental Protection
 Fact Sheet Commonwealth of Pennsylvania Department of Environmental Protection Pennsylvania s Chesapeake Bay Tributary Strategy Frequently Asked Questions Why is Pennsylvania revising its Chesapeake Bay
Chapter Seven: Factors Affecting the Impact of Nutrient Enrichment on the Lower Estuary
 Chapter Seven: Factors Affecting the Impact of Nutrient Enrichment on the Lower Estuary As presented in Chapter Six, the water quality data for the upper stations of the tidal freshwater Potomac Estuary
Anthony Moore Assistant Secretary for Chesapeake Bay Restoration
 Anthony Moore Assistant Secretary for Chesapeake Bay Restoration Chesapeake Bay Program History 1980 Chesapeake Bay Commission 1983 Chesapeake Bay Agreement 1987 Chesapeake Bay Agreement 40% nutrient reduction
Chesapeake Bay Program Indicator Analysis and Methods Document Water Quality Standards Achievement Updated 12/20/2017
 Chesapeake Bay Program Indicator Analysis and Methods Document Water Quality Standards Achievement Updated 12/20/2017 Indicator Title: Water Quality Standards Achievement Relevant Outcome(s): Water Quality
Fact Sheet. Chesapeake Bay Water Quality
 Fact Sheet Chesapeake Bay Water Quality Water quality is a critical measure of the Chesapeake Bay s health. For the Bay to be healthy and productive, the water must be safe for people and must support
Chesapeake Bay Program Indicator Analysis and Methods Document Water Quality Standards Achievement Updated 10/9/2018
 Chesapeake Bay Program Indicator Analysis and Methods Document Water Quality Standards Achievement Updated 10/9/2018 Indicator Title: Water Quality Standards Achievement Relevant Outcome(s): Water Quality
Climate Change, Marsh Erosion and the Chesapeake Bay TMDL
 Climate Change, Marsh Erosion and the Chesapeake Bay TMDL Rising sea level in Chesapeake Bay is inexorable. One environmental effect associated with sea level rise is marsh erosion. Marsh erosion can impact
Chesapeake Bay 2017 Midpoint Assessment Policy Issues for Partnership Decisions. Water Quality Goal Implementation Team Meeting December 4-5, 2017
 Chesapeake Bay 2017 Midpoint Assessment Policy Issues for Partnership Decisions Water Quality Goal Implementation Team Meeting December 4-5, 2017 PSC Approved Schedule December 19-20, 2017: PSC 2-day retreat
TOTAL MAXIMUM DAILY LOAD (TMDL)
") TOTAL MAXIMUM DAILY LOAD (TMDL) For Nutrients In Black Point Channel (WBID 1637) Prepared by: US EPA Region 4 61 Forsyth Street SW Atlanta, Georgia 30303 September 2009 TABLE OF CONTENTS 1.0 INTRODUCTION...
TOTAL MAXIMUM DAILY LOAD (TMDL) For Nutrients In Black Point Channel (WBID 1637) Prepared by: US EPA Region 4 61 Forsyth Street SW Atlanta, Georgia 30303 September 2009 TABLE OF CONTENTS 1.0 INTRODUCTION...
Factoring in Climate Change into the Jurisdictions Phase III WIPs. Mark Bennett, CBP Climate Resiliency Workgroup Co-Chair
 Factoring in Climate Change into the Jurisdictions Phase III WIPs Mark Bennett, CBP Climate Resiliency Workgroup Co-Chair 1 Accounting for the Changing Conditions The Climate Resiliency Workgroup and the
ARKANSAS NUTRIENT CRITERIA DEVELOPMENT. EPA Region 6 Nutrient RTAG Dallas, Texas April 14, 2015
 ARKANSAS NUTRIENT CRITERIA DEVELOPMENT EPA Region 6 Nutrient RTAG Dallas, Texas April 14, 2015 CRITERIA DEVELOPMENT MILESTONES Assessment Methodology Beaver Lake Wadeable Streams Nutrient Trading-Act 335
Narrative Water Quality Objective
 Narrative Water Quality Objective Waste discharges shall not contribute to excessive algal growth in inland surface receiving waters. (Basin Plan, 1995, pg. 4-5) Excessive is not defined No numeric standard
Septic Systems 4% Chemical Fertilizer: Agricultural Land 15%
 Chesapeake Bay Draft TMDL Overview of the Draft TMDL and WIP Evaluations September 2010 Sources of Nitrogen Loads to Bay Municipal & Industrial Wastewater 20% Septic Systems 4% Chemical Fertilizer: Agricultural
Water Quality Standards Attainment
 2017 WIP, 2025 WIP and Water Quality Standards Attainment Management Strategy 2015 2025, v.1 I. Introduction For the past 30 years, the Chesapeake Bay Program (CBP) partnership 1 has been committed to
The Chesapeake Bay TMDL. How did we get here?
 The Chesapeake Bay TMDL How did we get here? About the Chesapeake Bay The nation s largest estuary worth $1 trillion Covers 64,000 square miles 6 states and the District of Columbia contribute: PA, VA,
How Nutrient Trading Can Help Restore the Chesapeake Bay
 WRI FACT SHEET How Nutrient Trading Can Help Restore the Chesapeake Bay Congress is considering proposals to revise and strengthen the Clean Water Act for the Chesapeake Bay region and improve the health
Planning Targets. For WQGIT Review Draft November 7, 2017
 Chesapeake Bay Program Partnership Development and Review of the Draft Phase III WIP Planning Targets On December 19-20, 2017, the Water Quality Goal Implementation Team (WQGIT) will be seeking the approval
Chesapeake Bay Program in Pennsylvania. Karl G. Brown Executive Secretary PA State Conservation Commission
 Chesapeake Bay Program in Pennsylvania Karl G. Brown Executive Secretary PA State Conservation Commission 1 PA s Chesapeake Basin Over 50 percent of the land in PA drains to the Chesapeake Bay The Susquehanna
2012 Nutrient Regulations Update
 2012 Nutrient Regulations Update OWEA Government Affairs Workshop March 1, 2012 Guy Jamesson, PE, BCEE Malcolm Pirnie, The Water Division of ARCADIS Imagine the result Agenda Nutrient impacts Nutrient
Nitrogen Management through Land Use. Holly Greening, Tampa Bay Estuary Program July 2010
 Nitrogen Management through Land Use Holly Greening, Tampa Bay Estuary Program July 2010 Importance of Water Quality Management Eutrophication (excess nutrients) common to many estuaries, streams and lakes
for the Chesapeake Bay
 Economic Study of Nutrient Credit Trading PRESENTED BY for the Chesapeake Bay George Van Houtven (RTI International) PRESENTED TO Scientific and Technical Advisory Committee (STAC) Quarterly Meeting Annapolis,
CHESAPEAKE BAY TMDL PHASE III WIP NORTHERN VIRGINIA OPENING STAKEHOLDER MEETING AUGUST 17, 2018 NORMAND GOULET NVRC
 CHESAPEAKE BAY TMDL PHASE III WIP NORTHERN VIRGINIA OPENING STAKEHOLDER MEETING AUGUST 17, 2018 NORMAND GOULET NVRC TODAYS AGENDA TMDL BACKGROUND WIP DEVELOPMENT PROGRESS AND TIMELINE 2017 NUTRIENT PROGRESS
From Programmatic Goals to Criteria for Phytoplankton Chlorophyll a
 From Programmatic Goals to Criteria for Phytoplankton Chlorophyll a A report prepared by Claire Buchanan, PhD Interstate Commission on the Potomac River Basin February 26, 2016 ICPRB Report 16-1 (Minor
Finalizing the Chesapeake Bay Health Index (BHI)
") Finalizing the Chesapeake Bay Health Index (BHI) Part 1: Water Quality Index Part 2: Biotic Index Bill Dennison Ben Longstaff, Michael Williams, Claire Buchanan, Roberto Llansó, and Peter Bergstrom On
Finalizing the Chesapeake Bay Health Index (BHI) Part 1: Water Quality Index Part 2: Biotic Index Bill Dennison Ben Longstaff, Michael Williams, Claire Buchanan, Roberto Llansó, and Peter Bergstrom On
Chesapeake Bay Program Partnership s Scientific, Technical Assessment and Reporting (STAR) Team Briefing and Options Paper:
 Team Briefing and Options Paper:") Chesapeake Bay Program Partnership s Scientific, Technical Assessment and Reporting (STAR) Team Briefing and Options Paper: Addressing CBP Partnership s and Non-tidal Monitoring Network s 2013 Funding
Chesapeake Bay Program Partnership s Scientific, Technical Assessment and Reporting (STAR) Team Briefing and Options Paper: Addressing CBP Partnership s and Non-tidal Monitoring Network s 2013 Funding
Eutrophication: Tracing Nutrient Pollution Back to Penns Creek
 Eutrophication: Tracing Nutrient Pollution Back to Penns Creek Nutrients are substances that life depends on for growth and reproduction. However, when these nutrients enter our planets waterways in excess,
MARYLAND DEPARTMENT OF THE ENVIRONMENT 1800 Washington Boulevard Baltimore MD
 MARYLAND DEPARTMENT OF THE ENVIRONMENT 1800 Washington Boulevard Baltimore MD 21230 410-537-3000 1-800-633-6101 Martin O Malley Governor Anthony G. Brown Lieutenant Governor November 6, 2009 Shari T. Wilson
North Dakota s Nutrient Reduction Strategy. Presented to the 2016 ND Water Quality Monitoring Conference March 4, 2016
 North Dakota s Nutrient Reduction Strategy Presented to the 2016 ND Water Quality Monitoring Conference March 4, 2016 Nutrients Nutrients, in appropriate amounts, are essential to the growth and health
Chesapeake Bay Program Indicator Analysis and Methods Document Reducing Pollution Indicators Updated May 2018
 1 Chesapeake Bay Program Indicator Analysis and Methods Document Reducing Pollution Indicators Updated May 2018 Indicator Title: Reducing Pollution Relevant Outcome(s): 2017 Watershed Implementation Plans
Chesapeake Bay and Virginia Waters Clean-up Plan. September 17, 2007 Meeting of House Appropriations Committee
 Chesapeake Bay and Virginia Waters Clean-up Plan September 17, 2007 Meeting of House Appropriations Committee Background Plan required by HB 1150 [adopted by 2006 General Assembly] Prepared by Secretary
Chesapeake Bay. report card
 Chesapeake Bay report card 2010 C- C Healthy water quality provides better habitat conditions for crabs, fish, and other aquatic species. issolved oxygen is essential to the survival of all these organisms;
Florida Department of Environmental Protection Numeric Nutrient Criteria: Current Status
 Florida Department of Environmental Protection Numeric Nutrient Criteria: Current Status Russ Frydenborg, Drew Bartlett, Daryll Joyner, Ken Weaver Division of Assessment and Restoration Support Nutrient
OLD DOMINION UNIVERSITY. Old Dominion University, Norfolk, Virginia Virginia Department of Environmental Quality Richmond, Virginia 23230
 OLD DOMINION UNIVERSITY 1 Department of Biological Sciences Old Dominion University, Norfolk, Virginia 23529 2 Department of Chemistry and Biochemistry Old Dominion University, Norfolk, Virginia 23529
CBP Climate Resiliency Workgroup. June 20, 2016
 2017 Midpoint Assessment Management Needs: Estimated Influence of 2025 and 2050 Sea Level Rise and Tidal Marsh Loss on Chesapeake Bay Water Quality Standards CBP Climate Resiliency Workgroup June 20, 2016
Guiding the Restoration of the Chesapeake Bay: The EPA Chesapeake Bay Program Partnership. Keely Clifford U.S. Embassy Paris
 Guiding the Restoration of the Chesapeake Bay: The EPA Chesapeake Bay Program Partnership Keely Clifford U.S. Embassy Paris PISCES Workshop June 14, 2011 1 Chesapeake Bay Watershed About 17 million people
Upper Mississippi River Lake Pepin Water Quality Model July INTRODUCTION
 1. INTRODUCTION This report describes the development, calibration/confirmation, and application of a linked hydrodynamic-sediment transport-water quality model for the Upper Mississippi River from Lock
Pennsylvania s Chesapeake Bay Tributary Strategy Implementation Plan for NPDES Permitting
 The strategy outlined in this guidance document is intended to supplement existing requirements. Nothing in the strategy shall affect regulatory requirements. The information herein is not an adjudication
2016, 2017 Estuarine Water Quality and Modeling in the Royal and Cousins Rivers
 2016, 2017 Estuarine Water Quality and Modeling in the Royal and Cousins Rivers Angela Brewer and Robert Mohlar Division of Environmental Assessment Bureau of Water Quality Protecting Maine s Air, Land
Protocol for Setting Targets, Planning BMPs and Reporting Progress for Federal Facilities and Lands
 June 22, 2015 Protocol for Setting Targets, Planning BMPs and Reporting Progress for Federal Facilities and Lands Purpose This document describes the process for setting nitrogen, phosphorus and sediment
Florida Nutrient Criteria Update
 Standards and Assessment Florida Nutrient Criteria Update Russ Frydenborg Path Forward March 15, 2013: FDEP and EPA announced agreement to continue the protection of Florida s waterways from excess nitrogen
An Introduction to Aggregate Air-Water Exchanges
 An Introduction to Aggregate Air-Water Exchanges Air Directors Meeting March 25, 2013 Lewis Linker CBP Modeling Coordinator linker.lewis@epa.gov 1 In the Chesapeake TMDL exchanges of nitrogen are allowed
Baltimore City Department of Public Works
 Baltimore City Department of Public Works Back River WWTP Process and Construction Overview Michael F. Gallagher, Chief Wastewater Facilities Division Wastewater Treatment Chesapeake Bay Restoration Water
Chesapeake Bay TMDL and Maryland s Watershed Implementation Plan. Robert M. Summers, Ph.D. Acting Secretary Maryland Department of the Environment
 Chesapeake Bay TMDL and Maryland s Watershed Implementation Plan Robert M. Summers, Ph.D. Acting Secretary Maryland Department of the Environment TMDL Background TMDL = Total Maximum Daily Load. The maximum
Potential Effects of Reclaimed Water options on Nitrogen Loading to Tampa Bay. Tampa Bay in the 1970s
 Potential Effects of Reclaimed Water options on Nitrogen Loading to Tampa Bay Holly Greening, Tampa Bay Estuary Program February 15, 2010 1 Tampa Bay in the 1970s Phytoplankton and macroalgae dominated
Virginia s Chesapeake Bay Strategy
 Virginia s Chesapeake Bay Strategy PA Planning Association Workshop May 2, 2008 John Kennedy VA DEQ Chesapeake Bay Program jmkennedy@deq.virginia.gov 804-698 698-4312 VA s Strategy: Chesapeake Bay and
CODE OF VIRGINIA - STORMWATER NUTRIENT OFFSETS
 CODE OF VIRGINIA - STORMWATER NUTRIENT OFFSETS 10.1-603.8:1. Stormwater nonpoint nutrient offsets. A. As used in this section: "Nonpoint nutrient offset" means nutrient reductions certified as nonpoint
Strategy to Accelerate the Protection and Restoration of Submerged Aquatic Vegetation in the Chesapeake Bay
 December 2003 Strategy to Accelerate the Protection and Restoration of Submerged Aquatic Vegetation in the Chesapeake Bay E X E C U T I V E S U M M A R Y This document presents a strategy to accelerate
Chesapeake Bay Restoration -- Phase III JULY 13, 2018
 Chesapeake Bay Restoration -- Phase III ANN JENNINGS JULY 13, 2018 POTOMAC WATERSHED ROUNDTABLE FORUM Virginia Achieves Midpoint Clean Water Goals 3 2017 60% 2025 ecoreportcard.org Overall bay health in
Chesapeake Bay Program Models:
 Chesapeake Bay Program Models: A Guide to Better Understanding Modeling and Decision Support Tool Forum Penn State Harrisburg August 1, 2011 1 Mark Dubin Agricultural Technical Coordinator University of
CLMP+ Report on Grass Lake (Anoka County) Lake ID# CLMP+ Data Summary
 Lake ID# CLMP+ Data Summary") CLMP+ Report on Grass Lake (Anoka County) Lake ID# 02-0113-00 2012-2013 CLMP+ Data Summary October 2014 Authors Shannon Martin, MPCA Editing and graphic design Public Information Office Staff The (MPCA)
CLMP+ Report on Grass Lake (Anoka County) Lake ID# 02-0113-00 2012-2013 CLMP+ Data Summary October 2014 Authors Shannon Martin, MPCA Editing and graphic design Public Information Office Staff The (MPCA)
Boulder Elkhorn TMDL Project. TMDL Document Public Comment Meeting June 27, 2013
 Boulder Elkhorn TMDL Project TMDL Document Public Comment Meeting June 27, 2013 Presentation Outline: What are TMDLs? Boulder Elkhorn TMDL Project Area What s in a TMDL document? Sediment Overview Temperature
Murky Waters. More Accountability Needed for Agricultural Pollution in the Chesapeake Bay
 Murky Waters More Accountability Needed for Agricultural Pollution in the Chesapeake Bay July 14, 2014 About the Environmental Integrity Project The Environmental Integrity Project (EIP) is a nonpartisan,
Understanding the Effect of the Conowingo Dam and Reservoir on Bay Water Quality
 Understanding the Effect of the Conowingo Dam and Reservoir on Bay Water Quality Background The Susquehanna River has a major influence on Chesapeake Bay Water Quality. The Susquehanna watershed is 43%
Application of SLAMM to Estimate N removal services in tidal wetlands
 Application of SLAMM to Estimate N removal services in tidal wetlands JENNIFER B RYA N L O R A H A R R IS* H A R R IS@UMCES.EDU 410-326-7391 Global Mean SLR Boesch et al. 2013 Maryland SLR Estimates Boesch
Incorporating monitoring, modeling and trends analyses into management decisions: a Choptank River example
 Incorporating monitoring, modeling and trends analyses into management decisions: a Choptank River example Emily Trentacoste, PhD EPA Chesapeake Bay Program WQGIT Meeting 7/10/2017 DRAFT. DO NOT CITE OR
Application of the 2017 Phase 6 Models
 Application of the 2017 Phase 6 Models Water Quality Goal Implementation Team November 27, 2017 Lew Linker, Gary Shenk, Gopal Bhatt, Carl Cerco, and the CBP Modeling Team Chesapeake Bay Program Science,
Understanding the Influence of the Conowingo Reservoir Infill on Expectations for States Nutrient and Sediment Pollutant Load Reductions
 Understanding the Influence of the Conowingo Reservoir Infill on Expectations for States Nutrient and Sediment Pollutant Load Reductions Presented to the Water Quality Goal Implementation Team October
The Chesapeake Bay Program Biennial Strategy Review System: A Guide to Your Quarterly Progress Meeting
 The Chesapeake Bay Program Biennial Strategy Review System: A Guide to Your Quarterly Progress Meeting Table of Contents Executive Summary...2 Introduction...3 Quarterly Progress Meeting Template...4 Appendix
CHESAPEAKE BAY HABITAT CRITERIA SCORES AND THE DISTRIBUTION OF SUBMERSED AQUATIC VEGETATION IN THE TIDAL POTOMAC RIVER AND POTOMAC ESTUARY,
 U. S. Department of the Interior U. S. Geological Survey CHESAPEAKE BAY HABITAT CRITERIA SCORES AND THE DISTRIBUTION OF SUBMERSED AQUATIC VEGETATION IN THE TIDAL POTOMAC RIVER AND POTOMAC ESTUARY, 1983-1997