Urban microclimate and thermal comfort evaluation
|
|
|
- Randolph Phelps
- 6 years ago
- Views:
Transcription
1 Urban microclimate and thermal comfort evaluation Anna Psefteli SID: SCHOOL OF SCIENCE & TECHNOLOGY A thesis submitted for the degree of Master of Science (MSc) in Energy Systems OCTOBER 2011 THESSALONIKI GREECE
2
3 Urban microclimate and thermal comfort evaluation Anna Psefteli SID: Supervisor: Prof. Agis M. Papadopoulos SCHOOL OF SCIENCE & TECHNOLOGY A thesis submitted for the degree of Master of Science (MSc) in Energy Systems OCTOBER 2011 THESSALONIKI GREECE
4
5 DISCLAIMER This dissertation is submitted in part candidacy for the degree of Master of Science in Energy Systems, from the School of Science and Technology of the International Hellenic University, Thessaloniki, Greece. The views expressed in the dissertation are those of the author entirely and no endorsement of these views is implied by the said University or its staff. This work has not been submitted either in whole or in part, for any other degree at this or any other university. Signed:... Name: Anna Psefteli Date: 21 October 2011 i
6 ii
7 Abstract This dissertation was written as a part of the MSc in Energy Systems at the International Hellenic University. The dissertation studies the urban microclimate and outdoor thermal comfort conditions and defines the relationship between them. The study is carried out at two outdoor spaces of different characteristics situated in the Municipality of Kalamaria in the city of Thessaloniki, Greece. The two areas are of different characteristics. The City Hall Square is a concrete paved square with limited green and the old tobacco warehouses is an open green space with lots of trees. The climatic parameters in the two areas were monitored during the summer and the outdoor thermal comfort conditions that exist in these areas were evaluated through questionnaires in order to define the correlation between the urban microclimate and outdoor thermal comfort and to compare the findings. Further the research of this study concentrates on the influence of green areas as well as structure materials on the microclimate and the thermal comfort conditions in the City Hall Square. A sensitivity analysis was conducted with the use of the ENVI-met simulation model in order to evaluate the parameters that influence thermal comfort and the influence green areas and surface materials have on the microclimate. Apart from the sensitivity analysis, other improvement measures are proposed. Anna Psefteli 21 October 2011 iii
8
9 Acknowledgements The dissertation in hand has been realized thanks to an extensive support group that offered me all the needed help in order to fulfil this task. I would like to express my sincere gratitude to my supervising professor Dr. Agis M. Papadopoulos for cooperating with me for this dissertation and for his encouragement, guidance and support throughout the course of this study. His in-depth knowledge and expertise have served as an inspiration and have helped improve my research skills. I am deeply grateful for the opportunity he has given me to explore new areas and broaden my knowledge. I would also like to thank Mr. Ioannis Tsionas from the urban planning department of the Municipality of Kalamaria for his contribution. Thanks are owed to Christina Konstantinidou, Ifigenia Theodoridou, Katerina Christodoulou and Konstantina Leonidaki for their assistance and help which proved to be more than valuable. I cannot but thank my lifetime support team, the people who helped me begin it all, my family. An extra special thanks to my parents Gianni and Kalliopi for giving me the opportunity to do this master programme and for believing in me as well as to my sisters Eleni and Nicky who once again stood by my side. Last but not least, thanks to my good friends Antonis Nanakoudis, Georgia Gregoriou, Myrto Lavasa and Victoria Votsari for their moral support and for offering everything they possibly could. v
10 Contents ABSTRACT... III ACKNOWLEDGEMENTS... V CONTENTS... VI LIST OF FIGURES... IX LIST OF TABLES... X 1 INTRODUCTION BACKGROUND PROBLEM DEFINITION AIM OF THE THESIS SCOPE OF THE THESIS STRUCTURE OF THESIS OVERVIEW URBAN HEAT ISLAND PHENOMENON URBAN MICROCLIMATE AND THERMAL COMFORT THERMAL COMFORT INDICES Wet-bulb globe temperature (WBGT) index Discomfort index (DI) Humidex (HD) Predicted Mean Vote (PMV) Standard effective temperature (SET) Physiological Equivalent Temperature (PET) Actual Sensation Vote (ASV) URBAN GREEN AND THE INFLUENCE ON THE MICROCLIMATE AND THERMAL COMFORT STRUCTURE MATERIALS AND THE INFLUENCE ON MICROCLIMATE AND THERMAL COMFORT Cool materials LITERATURE REVIEW vi
11 3.1 URBAN HEAT ISLAND URBAN MICROCLIMATE AND THERMAL COMFORT EVALUATION URBAN GREEN STRUCTURE MATERIALS URBAN AREA AND CLIMATE OF THE MUNICIPALITY OF KALAMARIA MUNICIPALITY OF KALAMARIA GRABS PROJECT What is it? GRaBS project and the Municipality of Kalamaria METHODOLOGY DESCRIPTION OF SELECTED SITES Site A Site B DATA COLLECTION Climatic data collection SIMULATION OF MICROCLIMATE AND OUTDOOR THERMAL COMFORT ENVI-met simulation model ENVI-met limitations MEASUREMENTS Climatic parameters Surface temperatures Questionnaires Simulation process RESULTS MICROCLIMATE SIMULATION City Hall Square Old tobacco warehouses THERMAL COMFORT SIMULATION City Hall Square Old Tobacco Warehouses DISCUSSION vii
12 7.1 SENSITIVITY ANALYSIS OF PARAMETERS INFLUENCING COMFORT CONDITIONS Scenario 1 Cool coating Scenario 2 - Urban green Scenario 3 Cool coating and urban green FURTHER PROPOSALS FOR IMPROVEMENT OF PREVAILING CONDITIONS CONCLUSION CONCLUSIVE REMARKS BIBLIOGRAPHY APPENDIX GLOSSARY APPENDIX INTERVIEW QUESTIONNAIRE viii
13 List of figures Figure 1: Energy balance of human body Figure 2: PPD as a function of PMV Figure 3: Urban green space coverage in Europe and green space per citizen provision Figure 4: Ecological qualities of a tree Figure 5: View of City Hall Square from above Figure 6: View of old tobacco warehouses from above Figure 7: Thermal imaging of City Hall Square and pedestrian street Figure 8: Thermal imaging of old tobacco warehouses Figure 9: Topographic map of City Hall Square Figure 10: Area input file for City Hall Square Figure 11: Area input file for Old tobacco warehouses Figure 12: Air temperature at 1.60 meters at City Hall Square at 09: Figure 13: Air temperature at 1.60 meters at City Hall Square at 12: Figure 14: Air temperature at 1.60 meters at City Hall Square at 15: Figure 15: Air temperature at 1.60 meters at City Hall Square at 18: Figure 16: Air temperature at 1.60 meters at City Hall Square at 21: Figure 17: Air temperature at 1.60 meters at Old Tobacco Warehouses at 09: Figure 18: Air temperature at 1.60 meters at Old Tobacco Warehouses at 12: Figure 19: Air temperature at 1.60 meters at Old Tobacco Warehouses at 15: Figure 20: Air temperature at 1.60 meters at Old Tobacco Warehouses at 18: Figure 21: Air temperature at 1.60 meters at Old Tobacco Warehouses at 21: ix
14 Figure 22: PMV values at 1.60 meters at City Hall Square at 19:00 on the 21/07/ Figure 23: PMV values at 1.60 meters at Old Tobacco Warehouses at 19:00 on the 21/07/ Figure 24: Air temperature at 1.60 meters at City Hall Square at 12:00 - Scenario Figure 25: Air temperature at 1.60 meters at City Hall Square at 15:00 - Scenario Figure 26: Air temperature at 1.60 meters at City Hall Square at 12:00 - Scenario Figure 27: Air temperature at 1.60 meters at City Hall Square at 15:00 - Scenario Figure 28: Air temperature at 1.60 meters at City Hall Square at 12:00 - Scenario Figure 29: Air temperature at 1.60 meters at City Hall Square at 15:00 - Scenario List of tables Table 1: Classification of discomfort index values Table 2: Ranges and levels of humidex index Table 3: PMV thermal sensation scale Table 4: Relationship of SET values with other parameters Table 5: PET ranges for different thermal perception and physiological stress Table 6: Location data and population statistics for Kalamaria Table 7: Member states and partners taking place in the GRaBS Project Table 8: Climatic data measurements Table 9: Thermal comfort votes per day Table 10: Thermal comfort votes per day x
15 Table 11: Jendritzky outdoor PMV model Table 12: Comparative analysis of air temperatures Scenario Table 13: Comparative analysis of air temperatures Scenario Table 14: Comparative analysis of air temperatures Scenario xi
16
17 1 Introduction 1.1 Background Urbanisation is a phenomenon that developed during the Industrial Revolution and has been increasing ever since. Developed countries have a higher percentage of urbanised population than less developed ones. However, in recent years, the population of less developed countries has started to migrate from rural to urban areas causing a rapid increase in the urban population. According to the World Urbanization Prospects-The 2009 Revision report conducted by the United Nation, in mid 2009 the world population in urban areas exceeded the population in rural areas. It is estimated that by 2050 the world s urban population is going to be 84% of the total population. This increase will arise mostly from developing countries, since the rate of urban population growth of developed countries is expected to drop. More specifically, in Europe the urbanisation process started around 1950 with 51.3% of the European population urbanised. By 2009 this percentage was increased to 72.5% and it is estimated that by 2050 it will reach 84.3% [1]. In Greece, the process started after the Second World War. Today 61.2% of the total population is settled in urban areas. By 2050 the percentage is projected to rise to 77.6% [1]. 1.2 Problem definition Urban Heat Island The increase of population in urban areas caused by urbanisation increased the need for housing. In order to accommodate the rapidly increasing population, a large number of buildings needed to be constructed as well as the needed infrastructure leading to the growth of these areas under no specific urban plan. Single houses, trees and green spaces were occupying space that was needed for this purpose and so houses were replaced with multi-storey buildings and concrete and asphalt constructions replaced green spaces and trees. As a re- 1
18 sult the structure of urban areas became densely built, unfriendly to the environment as well as to the dwellers. Apart from the urban structure and the lack of green spaces and trees, other factors of the urban area cause side effects as well. Factors such as anthropogenic heat and pollution that accumulate in urban areas and surface materials have a negative impact on the area as well. As a result the temperatures of urban areas are higher than those of the surrounding rural areas. This phenomenon is called Urban Heat Island (UHI). Urban microclimate and thermal comfort The temperature is not the only parameter that is altered where the Urban Heat Island occurs. Other climatic parameters such as local wind patterns are modified, humidity increases and changes in the precipitation rate occur [2]. Thus, the local climate of the urban area, known as the urban microclimate, is influenced. The microclimate is characterised by various climate variables. The basic variables are temperature, humidity, solar radiation, wind speed and pressure. Air pollution and its concentration in an urban environment is another variable that could be used to characterise the microclimate. Wind direction can also be used additionally to wind speed and temperature can be divided into surface temperature and air temperature. Thermal comfort is defined as a situation in which a person feels satisfaction with the thermal environment and does not want to alter it in any way. Climatic variables that are used to define thermal comfort conditions are mainly air temperature, humidity, wind speed and solar radiation but the influence of air pollution and wind direction could be combined in order to examine thermal comfort conditions. Hence, the urban microclimate and thermal comfort are linked and the microclimatic conditions could be considered as an indicator of thermal comfort. Both outdoor and indoor thermal comfort conditions are influenced by the microclimate of an urban area. However, climatic parameters are not the only factors that influence thermal comfort. Physiological and psychological parameters in- 2
19 fluence the comfort level of individuals as well as personal factors such as activity level and clothing. To evaluate thermal comfort conditions a range of thermal indices have been introduced. Depending on the index, the evaluation depends on climatic parameters or on multiple combinations of both climatic and physiological parameters. A number of thermal indices will be presented later in this study. It is important to be able to evaluate comfort conditions for outdoor spaces; not only to reduce energy consumption and to improve outdoor conditions for the urban population but also for health reasons since extreme climatic conditions can cause various health problems to sensitive groups of people. 1.3 Aim of the thesis The aim of this study is to broaden the knowledge of the urban microclimate and outdoor thermal comfort and to define the relationship between them. The study is carried out at two outdoor spaces of different characteristics situated in the Municipality of Kalamaria in the city of Thessaloniki, an area with a typical Mediterranean climate with hot and dry summers. Additionally it aims to identify the effects the amount of green in outdoor spaces as well as the structure materials used have on the parameters that define the microclimate and the thermal comfort. The result of this study could be used as a guideline for the improvement of outdoor areas in the city of Thessaloniki as well as for similar areas in comparable climates. 1.4 Scope of the thesis The scope of this thesis is to monitor the climatic parameters in two areas of the Municipality of Kalamaria during the summer and to evaluate the outdoor thermal comfort conditions that exist in these areas through questionnaires in order to define the correlation between the urban microclimate and outdoor thermal comfort and to compare the findings. The two areas are different in structure and surface materials, since one is a concrete paved square with almost non- 3
20 existent shading, with only a few trees around its perimeter and the other area is an open green space with lots of trees which provide shading. The research of this study concentrates on the influence of green areas as well as structure materials on the microclimate and the thermal comfort conditions of an urban area. A sensitivity analysis will be conducted with the use of simulation tools in order to evaluate the parameters that influence thermal comfort and the influence green areas and surface materials have on the microclimate. What would happen if the concrete paved square was firstly paved with different materials, secondly had more green and thirdly both the above combined? Finally after the prevailing conditions have been evaluated and conclusions have been drawn from the simulation process, measures will be proposed in order to alter prevailing conditions and to improve the local microclimate and thus the outdoor thermal comfort. 1.5 Structure of thesis This thesis is organized into eight chapters. Chapter one is the introductory chapter were the aim, the structure and the scope of this thesis are described along with a brief background and description of concepts that will be used in the thesis. It is important to understand concepts such as Urban Heat Island, urban microclimate, thermal comfort in order to understand the thesis subject. In chapter two, concepts briefly described in chapter one are more broadly explained. Chapter three is an analytical literature review of the subject. Studies that have been carried out for Urban Heat Island, urban microclimate and thermal comfort, thermal comfort indices, urban green spaces and vegetation as well as structure materials and their influences on the urban microclimate are presented and commented on. In chapter four the urban area of Kalamaria and its climate are noted. Chapter five describes the sites that have been chosen for the purposes of this thesis along with the measurements that took place at these sites. The results of the measurements are presented and discussed in chapter six. Chapter seven includes the sensitivity analysis of the under discus- 4
21 sion sites as well as the proposed measures for the improvement of the prevailing conditions. Last, chapter eight concludes on all the examined issues. 5
22 6
23 2 Overview This chapter describes concepts central to this thesis. At first it deals with the urban heat island, the microclimate and thermal comfort, followed by an overview of thermal comfort indices that have been introduced. Furthermore, the influence of urban green and urban structure materials is evaluated. A glossary is given in Appendix Urban heat island phenomenon Urban Heat Island is a built urban area that has higher temperatures than the surrounding rural areas. This phenomenon can occur during daytime (diurnal UHI) or night time periods (nocturnal UHI) and has an impact mostly during summer periods. This phenomenon has occurred in urban areas due to the urban structure and the density of the buildings, the materials that are used on the surfaces of the urban area, limited green spaces and vegetation and the high population density in urban areas that increase the amount of anthropogenic heat released to the environment by extensive anthropogenic activities. It is needless to say that all the above cause various problems and especially environmental problems. However these problems are not restricted to the environment but also have a social and an economic side to them. The increase in urban temperature and the alteration of other parameters that are influenced by the UHI phenomenon such as wind patterns, precipitation rate and humidity levels have deteriorated outdoor and indoor thermal comfort conditions. Indoor thermal comfort deterioration influences the energy cost for urban dwellers since there is an extensive use of cooling systems. Apart from the cost, it influences the quality of the outdoor spaces since the pollution levels increase and thus the air quality of outdoor spaces decrease in urban areas due to the use of fossil fuels. 7
24 The deterioration of outdoor thermal comfort conditions not only influence the environment but they also cause social isolation and in turn influence the economy. Urban dwellers avoid going outdoor for social purposes and activities preferring to stay indoors unless they have to fulfil obligations since the outdoor conditions cause discomfort to the dwellers. In turn the economy of commercial outdoor activities in urban areas takes a downfall since they can not be supported this way. The two main causes of the UHI phenomenon are anthropogenic heat and the urban structure [3]. The excess heat that is released by human activities to the environment, known as anthropogenic heat, can come from the industrialisation that follows urbanisation, from the increase in cars, in electrical equipment, in heating and cooling systems and others. This heat is released to the environment directly and along with a part of the solar radiation that directly heats the environment increases the temperature instantly. The part of the solar radiation that does not heat up the environment directly is absorbed and retained in the materials which are used in structures. The materials used in urban structures and how they behave will be analysed later. As the sun sets the temperature decreases and the environment cools down. The heat that has been accumulating in the surface materials throughout the day is released to the environment, intensifying the urban heat island. As the difference in temperature of urban area and rural area increases, the UHI increases. The magnitude of the UHI depends on population, industrial development, topography and layout and the climate and the meteorological conditions of the area [3]. 2.2 Urban microclimate and thermal comfort The climatic variables that describe the microclimate of an urban area are mainly temperature, humidity, solar radiation, wind speed and pressure. The urban microclimate is strongly correlated with thermal comfort and is an indicator of human thermal comfort. In order to improve human thermal comfort in urban outdoor areas it is important to improve outdoor thermal comfort conditions by upgrading the quality of outdoor spaces. 8
25 Taking the variables it is evident that a number of measures can be taken into account to alter these climatic variables and thus to improve the urban microclimate, thermal comfort conditions and in turn the quality of outdoor spaces. These measures are: Suitable shading or insolation Wind protection or suitable use of local wind patterns Materials and colours used on surfaces Green areas and vegetation Use of water features for cooling purposes With the use of suitable shading the microclimate of an area can be improved. Shading can be provided by trees, which have a cooling effect on the surrounding area as well. Deciduous trees are appropriate since they block the sun during summer months when it is unwanted and allow the sun to pass during winter months when it has a positive impact on the thermal comfort. Apart from trees, shading structure could be constructed to fulfil this purpose. The impact these structures have on the microclimate depends on the type of structure, its colour and its texture. For example louvers situated at the appropriate angle can be used to block the sun during summer and to allow it to pass during winter just as deciduous tree would work. By changing the wind flow in an area the microclimate and thermal comfort conditions could deteriorate or improve. It is most appropriate to take the wind regime into account during the urban planning of an area as so to design it in the most suitable way. However, the urban geometry can not be changed in existing urban built environments. Even so, the wind flow could be regulated with the use of appropriate structures or trees. By placing wind protection structures or trees in the right place the outcome could be positive. Additionally, the choice of materials used in urban structures and even their colour has a significant effect on the microclimate. Materials that have low reflectivity and emissivity values develop a higher surface temperature and effect the microclimate negatively. The same applies to dark coloured surfaces. Materials with high reflectivity and emissivity values should be used or even lighter col- 9
26 oured materials are a better solution in order to reduce the surface temperatures. Another solution is to use more permeable paving to help capture humidity that will evaporate from the surface and help with cooling the area. This issue will be further analysed later in the study. The increase in green spaces, trees and vegetation and the choice of the most appropriate species to use along with the careful design can only have a positive effect on the microclimate. In an urban area, trees and vegetation can reduce energy consumption by 35% [4]. If an extensive green area would be created in a city, like a large park, the temperature in that area can be decreased up to 5 C [4]. If trees were planted in streets the temperature could drop up to 2.5 C [4]. If the vegetation in an urban area is increase by 12% there can be a reduction in the mean temperature of 3 C overall [4]. Apart from these positive impacts, trees also provide shading during summer. The ability plants have to capture pollutants and particles is an additional property that can help mitigate the UHI effect and improve thermal comfort by improving the outdoor air quality. It is evident that many parameters should be taken into account in the designing of an urban area. However, even if these parameters have not been taken into account during the designing phase, they could be altered with the use of various interventions. 2.3 Thermal comfort indices As mentioned before, climatic variables that are used to define thermal comfort conditions are air temperature, humidity, wind speed and solar radiation. It is clear why air temperature, wind speed and solar radiation effect thermal comfort. Humidity on the other hand influences thermal comfort through a mechanism of the human body. During warm periods humans sweat in order to regulate their body s temperature. Sweat, which mostly contains water, covers the surface of the skin and cools the body down when it evaporates due to the latent heat of water evaporation. When the atmosphere has high humidity levels the evaporation rate decreases and this process is limited. This causes the human body to sense a higher temperature and thus increases discomfort. 10
27 However, thermal comfort is not only influenced by the climatic variables. Physical and psychological parameters have an influence on the thermal comfort levels as well. Physical parameters influencing thermal comfort are activity level of the individual, thermo-physical properties as well as clothing. Naturally humans deep body temperature must be equal to about 37 C with small fluctuations of ±1 C. In order for the body to maintain this temperature a constant exchange of heat between the body and the environment takes place [5]. Thermal comfort depends on this heat exchange between body and environment and is related to the climatic variables mentioned above as well as the activity level, the thermo-physical properties and clothing according to a relevant energy balance equation [6]. The relevant energy balance equation is [7]: M+W+R+C+E D +E Re +E Sw +S= 0 Where, M: the metabolic rate (internal energy production), W: the physical work output, R: the net radiation of the body, C: the convective heat flow, E D : the latent heat flow to evaporate water diffusing through the skin (imperceptible perspiration), E Re : the sum of heat flows for heating and humidifying the inspired air, E Sw : the heat flow due to evaporation of sweat, S: the storage heat flow for heating or cooling the body mass. The individual terms in this equation have positive signs if they result in an energy gain for the body and negative signs in the case of an energy loss (M is always positive; W, E D and E Sw are always negative) [7]. The unit of all heat flows is in Watts [7]. The convective heat flow (C) and the sum of heat flows for heating and humidifying the inspired air (E Re ) are directly influenced by the air temperature. Humidity levels influence the latent heat flow (E D ), heat flows for heating and humidifying the inspired air (E Re ) and the heat flow due to evaporation of sweat (ESw). The convective heat flow (C) and the heat flow due to evaporation of sweat (ESw) are influenced directly by the wind speed and the 11
![mean radiant temperature is influenced by the net radiation of the body (R) [8]. In the figure below (Figure 1) the exchange of energy between the human body and the environment is depicted.](/docs-images/74/71011064/images/28-0.jpg "In the figure the notations stand for: I= direct solar radiation H= diffused solar radiation (I+H) refl = reflected solar radiation E a, E u = thermal radiation from the environment W= thermal")
28 mean radiant temperature is influenced by the net radiation of the body (R) [8]. In the figure below (Figure 1) the exchange of energy between the human body and the environment is depicted. In the figure the notations stand for: I= direct solar radiation H= diffused solar radiation (I+H) refl = reflected solar radiation E a, E u = thermal radiation from the environment W= thermal radiation from the human body. Source: Figure 1: Energy balance of human body. To evaluate thermal comfort conditions a range of thermal indices have been introduced. Depending on the index, the evaluation depends on climatic parameters or on multiple combinations of both climatic and physiological parameters. Most indices were developed to evaluate thermal comfort in indoor spaces. A number of them were altered in order to be used in outdoor spaces. Below the most widely used thermal indices for outdoor spaces are briefly described Wet-bulb globe temperature (WBGT) index The wet-bulb globe temperature was introduced in 1905 by Haldane. According to that the measurement of only the wet-bulb globe temperature was sufficient 12
29 to evaluate thermal comfort. In 1957, Yaglou & Minard develop the wet-bulb globe temperature index. To find the thermal comfort level with this index the dry-bulb temperature (Ta), the wet-bulb temperature (Tw) and the black-globe temperature (Tg) needs to be measured. Those three temperatures along with coefficients that have been empirically determined are intergraded into the following equation in order to get the thermal comfort value [5]. WBGT=0.7Tw+0.1Ta+0.2Tg Today the WBGT index is the most widely used thermal comfort index worldwide Discomfort index (DI) Thom introduces the discomfort index in The discomfort index examines and evaluates heat stress yielded on an individual taking into account the drybulb temperature (Ta) and the wet-bulb temperature (Tw). The following equation is used [9]. DI=0.4 (Ta+Tw) +4.8 The discomfort values of this index are presented in the following table (Table 1). Table 1: Classification of discomfort index values Discomfort Index range Classifications DI<21 C 21 DI<24 C 24 DI<26 C DI 26 C DI 26.7 C DI>32 C No discomfort 10% of the total population feels discomfort 50% of the total population feels discomfort Most of the population suffers discomfort The discomfort is very strong and dangerous State of medical emergency Source: [9] Thom s discomfort index (DI) is a very practical thermal index and is used extensively. 13
30 2.3.3 Humidex (HD) The Humidex index was introduced by Masterton and Richardson in 1979 [6]. This index combines temperature and humidity to get the thermal comfort value. It is mainly used in Canada. The Humidex is given by the following equation, considering a general formulation for the estimation of vapour pressure, where t a is the air temperature (ºC) and ur is the relative humidity [10]. HU = t a + (5/9) [(6, tar / ( tar) ur/100) - 10] Humidex range along with the thermal discomfort levels are presented in the table below (Table 2). Table 2: Ranges and levels of humidex index Humidex range Thermal discomfort level 20 C HD 29 C Comfort 30 C HD 39 C Some discomfort 40 C HD 45 C Great discomfort, avoid exertion Above 45 C Above 54 C Dangerous Heat stroke imminent Source: [6] Predicted Mean Vote (PMV) The PMV index was introduced by Fanger in 1970 and predicts the mean vote on a nine point scale of a large population of people that are exposed to a certain environment. It applies only to long term exposure to constant environmental conditions and constant metabolic rate [11]. The nine point thermal sensation scale used is presented in the table 3 (Table 3). The measure of the percentage at each PMV of people that are not satisfied with the thermal environment is given by the Predicted Percentage Dissatisfied (PPD) index. PPD increases as the PMV deviates positively or negatively from zero [11]. It is concluded after the examination of a large volume of data that approximately 5% of the examined population will be dissatisfied with the thermal environment even if the PMV is zero. The curve in figure 2 (Figure 2) pre- 14
31 sents the Predicted Percentage Dissatisfied as a function of the Predicted Mean Vote [12]. Table 3: PMV thermal sensation scale Thermal sensation scale +4 Very hot +3 Hot +2 Warm +1 Slightly warm 0 Neutral -1 Slightly cool -2 Cool -3 Cold -4 Very cold Source: < Figure 2: PPD as a function of PMV 15
32 2.3.5 Standard effective temperature (SET) The standard effective temperature was presented by Gagge in According to Gagge the standard effective temperature is the air temperature of a reference environment at which an individual has the same skin temperature and wetness as the real environment [10]. Gagge introduced some standardised conditions starting with standardised clothing for given activities and evolving it to certain metabolic rate and clothing. The data used for the reference environment are: mean radiant temperature (t rm ) = air temperature (t a ) air speed (v a ) = 0.15 m/s relative humidity (ur) = 50% metabolism (M) = 1.2 met clothes resistance (I clo ) = 0.9 clo The SET is related to the average body temperature when there is thermal equilibrium. The equations showing this relationship differ depending on the temperature. When the temperature is between 23 C and 41 C the equation is [12]: Below 23 C: Above 41 C: SET = T b SET = (36.4-T b )0.7 SET = (T b -36.9)0.87 In the following table the relationship between SET values, comfort votes, sensation and physiology are presented [12]. 16
33 Table 4: Relationship of SET values with other parameters SET Vote Sensation Physiology > 37.5 > 3 very hot, great discomfort incr. failure of evaporative regulation to +3 hot, very unacceptable profuse sweating to +2 warm, uncomfortable, unacceptable to +1 slightly warm, slightly unacceptable sweating slight sweat, vasodilatation ,+0.5 comfortable, acceptable physiological thermal neutrality Physiological Equivalent Temperature (PET) This index was introduced by Höppe in He proposes the Munich energy balance model for individuals (MEMI) which is based on parameters taken from the two node Gagge model as well as the human body thermal balance equation [13] that was analysed in subchapter 3.3. Höppe defines the PET as: the equivalent temperature to the air temperature, for a given situation, in which, for a typical internal situation, the thermal balance of the human does not change, considering the same core and skin temperatures as in the original situation [14]. The internal situation is defined by [10]: mean radiant temperature (trm) = air temperature (ta) air speed (va) = 0.1 m/s vapour pressure (pv) = 12 hpa relative humidity (ur) = 50% at ta=20 C metabolism (M) = 114W clothes resistance (Iclo) = 0.9 clo 17
34 The calculation steps involve, firstly the calculation of the body s thermal conditions using MEMI with given meteorological parameters and secondly inserting mean skin temperature and core temperature into the MEMI model and solving the energy balance equation for air temperature. The air temperature that is found is the PET [15]. The clothes external surface temperature, the skin surface temperature and the core temperature are calculated by solving the energy balance equation, by calculating the heat flux from body core to skin and the heat flux from skin to clothes external surface. In the following table the PET ranges depending on the thermal perception and physiological stress are presented (Table 5). Table 5: PET ranges for different thermal perception and physiological stress. PET Thermal perception Grade of physiological stress 4 C 8 C 13 C 18 C 23 C 29 C 35 C 41 C Very cold Cold Cool Slightly cool Comfortable Slightly warm Warm Hot Very hot Extreme cold stress Strong cold stress Moderate cold stress Slight cold stress No thermal stress Slight heat stress Moderate heat stress Strong heat stress Extreme heat stress Source: [15] Actual Sensation Vote (ASV) In 2004, Nikolopoulou proposes a model through project RUROS. Project RU- ROS as mentioned before, aimed to examine, evaluate and improve the quality of outdoor urban spaces by improving environmental and thermal, visual and audible comfort conditions in open spaces. The parameters needed to calculate the ASV are: air temperature (Tair_met C) 18
35 total solar radiation (Sol_met, W.m -2 ) wind speed (V_met, m.s -1 ) relative humidity (RH_met,%) Nikolopoulou states that the model is representative of the different European climate conditions. CRES presents a series of design guidelines and in these guidelines present the different ASV models for different European cities. A combined European ASV model is also presented. The equation for the combined model is [16]: ASV = Tair_met Sol_met V_met RH_met For the city of Thessaloniki the equation is [16]: ASV = Tair_met Sol_met V_met RH_met The equations are suitable for air temperatures between 5 ºC and 35 ºC and the data used must be taken from a meteorological station [10]. 2.4 Urban green and the influence on the microclimate and thermal comfort As populations in urban areas grew green areas were limited and trees were cut down in order to use the space to build accommodation for the increasing urban population along with the needed infrastructure. Due to the rise in urban population as well as the limited green areas and vegetation the quality of life in urban areas has decreased. Air and noise pollution has increased, the microclimate has been altered, the water cycle is has been disturbed and aesthetically the environment has been degraded. The existing regime has led to unsustainable urban areas. For these reason urban areas are in need of green spaces and vegetation since they could help mitigate these problems of urban living. According to the World Health Organization, the average of green spaces in an urban area must be at least 8 to 10 square meters per citizen [17]. Unfortunately though, these standards are not met in all countries. In Europe, according to 19

36 Fuller and Gaston, the percentage of green space coverage widely differs among cities and ranges from 1.9% in Reggio di Calabria, Italy to 46% in Ferrol, Spain and the square metres of green space per citizen varies from 3-4 square metres in certain cities in Spain as well as Italy and less in some other European cities up to more than 300 square metres in specific cities in Belgium, Finland and France [18]. Greek cities have a very low average of green spaces [17]. The capital city Athens has an average of 2.8 square metres of green space per citizen [17] and the second largest Greek city, Thessaloniki, has an average of 1.4 square metres of green space per citizen [19]. In the following figure (Figure 3) each country is coloured according to the green space per citizen provision and the points represent and are coloured according to the green space coverage [18]. Source: Figure 3: Urban green space coverage in Europe and green space per citizen provision. Green areas upgrade the environmental conditions of urban areas; they change the landscape and upgrade the health and psychological conditions of urban dwellers [18]. The urban microclimate and thus the thermal comfort conditions 20
37 in outdoor spaces, the air and soil quality; noise pollution and lighting conditions are all influenced by green spaces. Microclimate The urban microclimate is influenced since trees and green spaces have an effect on air temperatures and humidity levels in an urban area. As analysed in chapter 2.1, urban microclimates are affected by the Urban Heat Island phenomenon which results in urban areas having higher temperatures than surrounding rural areas. As mentioned, one of the main causes of this heat accumulation in urban areas is the construction materials used in urban structures. These materials have a great heat capacity and conductivity. They absorb and store solar radiation and radiate it to the environment. Vegetation can help mitigate the UHI phenomenon by reducing air temperatures by shading building elements of urban structures and so moderating solar heat gains, reducing conductive and convective heat gains because of lower dry-bulb temperatures achieved through evapotranspiration and by converting incident solar radiation to latent heat [20]. Trees can absorb, reflect and transmit part of the solar radiation through their foliage [17], [21]. The most appropriate trees for urban areas are deciduous trees since during the summer they can absorb solar radiation, they can shade building elements and so reduce temperatures. During winter though, solar radiation should be permitted to reach the ground for a pleasant warm feeling for urban dwellers and warm building structures to reduce heating needs for buildings. During to the transpiration of plants large amounts of heat are absorbed because of water absorption. Trees reduce air temperature and cool the surrounding area through this process. According to Karameris, for the evaporation of one gram of water, 590 calories of energy are needed. A beech tree consumes kcal of energy daily for transpiration [21]. Through this example it is understood that large amounts of energy can be removed from the environment through the planting of trees and thus the temperature of the surrounding area is reduced. Construction materials used in urban structure do not only have great heat capacity and conductivity but they are also impermeable leading to lower levels of humidity due to the higher temperatures and water runoffs. Plants can affect the air humidity through the respiration process [21]. During this process the plants 21
38 absorb carbon dioxide, energy, elements from the soil and water and produce organic matter and at the same time emit oxygen to the atmosphere [21]. In order for a plant to produce one gram of dry matter it losses approximately ml of water and so cools the air [21]. Trees cool the surrounding area with the same mechanisms used in air conditioning units. Wind flows could be regulated and controlled with the planting of trees. Due to the high coefficient of friction they can reduce wind speeds and protect certain areas from unpleasant winds [21]. For this reason it is very important to place the trees in the right place for the outcome to be positive. It is evident that green can reduce the urban heat island phenomenon. Conclusively, plants present higher emissivity and reflectivity values than most urban structures. They shade urban structures and buildings and influence the air temperature and the energy consumption. What makes them a better solution than shading structures is that they are living organisms and so evapotranspire and thus further reduce air temperatures. Furthermore, plant soil retains humidity and evapotranspires itself [22]. In addition plants absorb large amounts of solar radiation. Air quality Urban areas have low oxygen content and the air has large quantities of sulphure dioxide, carbon monoxide and dioxide, fthorium, nitrogen oxides, chloride and ozon [17]. Plants can act as filters. Through the process of respiration plants absorb carbon dioxide and release oxygen to the atmosphere. In this manner oxygen can be renewed in urban areas. The foliage of the trees can also capture and withhold dust and airborne particles and so reduce the air pollution in urban areas. The dust that is laid on the tree leaves gets washed away by rain and thus enriches the soil with nutrients [22]. Water and soil In an urban area, due to the materials that are used in urban structures, water from rains are not absorbed since these materials are impermeable leading to large water runoffs, at a high speed and evidently to soil erosion. Vegetation and trees have a positive effect on the hydrology cycle of an area since they re- 22

39 duce water runoffs and therefore prevent soil erosion. The roots from the trees withhold soil and thus soil landslips are not noticed. Additionally trees can absorb pollutants and chemicals from polluted soil and store them or even transform them to less harmful forms. In total, they improve the quality of water as well as the quantity. Figure 4: Ecological qualities of a tree Source: [56] Water and soil In an urban area, due to the materials that are used in urban structures, water from rains are not absorbed since these materials are impermeable leading to large water runoffs, at a high speed and evidently to soil erosion. Vegetation and trees have a positive effect on the hydrology cycle of an area since they reduce water runoffs and therefore prevent soil erosion. The roots from the trees withhold soil and thus soil landslips are not noticed. Additionally trees can absorb pollutants and chemicals from polluted soil and store them or even trans- 23
40 form them to less harmful forms. In total, they improve the quality of water as well as the quantity. Noise pollution and lighting conditions Urban areas have been polluted in many ways. Noise pollution is one of them. Trees can help mitigate this problem. The flexible parts of a tree, its foliage and branches, absorb sound waves [17]. Larger parts such as bigger branches and the trunk divert and break sound. Trees also reduce glare that is caused by materials used in urban areas by reflecting or blocking solar radiation or artificial lighting [22]. They also reduce the intensity of light. Aesthetic improvement Green spaces can improve the urban area aesthetically. Trees and plants can block unpleasant views and along with the improvement of air quality, the reduction of noise pollution and the improvement of lighting conditions they can form an aesthetically pleasing environment. They also soften the exterior appearance of urban buildings and interact dynamically with the environment since the colour and density of their foliage is different in every season. Additionally, they offer visual comfort to urban dwellers due to the fact that they reduce the intensity of lights. 2.5 Structure materials and the influence on microclimate and thermal comfort The materials used on urban surfaces behave in a very different manner than natural surfaces. Natural surfaces, such as soil, or any kind of vegetation, restrain moisture and use a large amount of the solar radiation that they absorb for evaportranspiration. This process gives out latent heat and water vapour which have a cooling effect on the surrounding area. On the other hand, materials such as bricks, concrete and asphalt, which are widely used in cities, do not absorb water, letting it drain away. Furthermore these materials have low reflectivity and emissivity values. This results to the absorption and retention of the solar radiation and in addition to the rise in surface material temperature. Through this process, the energy balance is increased in total and air tempera- 24
41 tures rise [23]. When the difference between air temperature and surface temperature is small, the infrared radiation that is emitted from the ground surfaces is balanced out by the infrared radiation from the atmosphere [24]. When the temperature difference is large though, the infrared radiation from the ground surface is larger than the infrared radiation from the atmosphere causing the increase of the energy balance and thus atmospheric heating of the area [24]. This makes building materials an important factor in the urban environment that influences the microclimatic conditions of the area and thus the thermal comfort conditions. In order to reduce the energy balance of an urban environment and to improve thermal comfort conditions, it is important to keep surfaces cooler by reducing the thermal gains from the absorption of solar radiation. As said before, this could be achieved from shading structures with trees. Another way to achieve thermal gain reductions is with the use of materials that present a better thermal performance. Thermal and optical characteristics of materials such as albedo and emissivity values characterise their thermal performance. Pavements contribute to the Urban Heat Island effect in an urban area by affecting the microclimate significantly since they cover a large part of a city. The most common materials that are used on pavements are concrete and asphalt. These materials have low reflectance and low emittance. Concrete and asphalt solar reflectance values range from 0.04 to 0.45 [25]. Due to the low values of reflectance and emittance, they absorb and store solar radiation, developing high surface temperatures in this manner and emitting it into the atmosphere at later hours of the day when the ambient air temperature has decreased. There is a category of materials, namely cool materials, which have a high solar reflectance and high infrared emittance. Such materials develop lower surface temperatures due to these properties and so when used on urban surfaces the heat release to the atmosphere through heat convection is decreases and thus there is a reduction in the increase of the air temperature. 25
42 2.5.1 Cool materials Cool materials have a high solar reflectance and high infrared emittance. An index that incorporates solar reflectance and infrared emittance in one value has been introduced in order to evaluate how hot a material will get when exposed to the sun. This index is the solar reflectance index (SRI). By definition a standard black surface has a SRI value of zero and a standard white surface has a SRI value of 100. The SRI compares the steady state surface temperature of the material surface to the steady state temperatures of a standard black and a standard white surface under the same environmental conditions [26]. To calculate the SRI the following equation is used [25]: SRI = [(T black -T surface ) / (T black T white )] x 100 Where, T black steady state temperature of the standard black surface T white steady state temperatures of the standard white surface T surface steady state temperatures of material surface Taking the equation into account, one can see that very hot materials can have negative SRI values and very cool materials can have values greater than 100 [25]. Cool materials can be divided into two main categories [25]. The first category is cool materials used for roofs [25]. This category will not be analysed since it is not relevant to the subject of this dissertation. The second category is cool materials used for paving [25]. According to the Cool Pavement Report conducted by Cambridge Systematics Inc. there are three ways to reduce the effect of pavements on the urban thermal environment. Firstly with the use of surfaces that present higher solar reflectance values, secondly by using materials that have increased surface permeability and thirdly by using materials with an increased cooling ability of the pavements material during the night [27]. 26
43 Permeable pavements The effects of concrete and asphalt pavements on the urban environment have been studied extensively. A recommendation in many of these studies for the reduction of these effects is permeable pavements. Traditional pavements do not allow water to infiltrate and so the water drains away. This is not only negative for the environment and in particular the soil, since it causes soil erosion, but it also increases the need for drainage systems and thus increasing development costs. However, permeable pavements allow water to seep into the underlying soil and effectively reduce water runoffs. Another problem permeable pavements help mitigate is the pollution of run off water by pollutants such as hydrocarbons and heavy metals. These pollutants are carried away by run off water and end up in sewage systems, in water tables, in rivers and streams polluting them in turn. Permeable pavements allow water to be filtered in various layers under their surface that withhold these pollutants. Last but not least, since the water and the atmosphere can interact with these pavements, evaporation can occur at the surface and thus the temperature increases can be reduced and as a result help with the mitigation of the UHI phenomenon. Reflective pavements High albedo pavements concentrate on less solar radiation absorption leading to lower surface temperatures and thus less heat discharge to the atmosphere. There are many available methods to increase the albedo of pavement materials. In research this methods can be divided into four phases [25]. The four phases are [25]: Phase one: In this phase research focused on white materials that presented high reflectivity and emissivity values. It was concluded that the temperatures these materials develop are only slightly higher than the ambient temperature during the day and slightly lower during the night. The thermal performance of white coatings was found better than that of natural white materials. Phase two: Following, cool coloured materials with infrared reflective pigments have been developed. These materials present a higher reflectivity value than materials of the same colour as well as coating of the same colour. 27
44 Phase three: The materials developed during the third phase of research are cool coatings of different colours integrated with nano-materials that have high heat storage in order to increase the coatings heat capacity. These materials, called phase change materials (PCM) store and release latent heat through chemical bonds. During the day they absorb heat and undergo a melting process and during the night they release the heat through solidification. Phase four: During this phase, materials with dynamic optical characteristics have been researched. According to temperature or solar radiation such materials adapt by changing their reflectivity. Thermochromic coatings are considered as such. Thermochromic coating adapt to the surrounding environment by changing their colour reversibly. The material presents high reflectivity during summer and high absorption during winter. Benefits of cool materials Cool materials have a high albedo and high infrared emissivity. The most significant benefit these materials have to offer is that the materials surface is kept cooler resulting in less heat convection from the surface to the air and thereby decreasing the increase of the surrounding air temperature. An increase of 0.25 in albedo can result to a decrease of 10 C in temperature [28]. With the smaller increase of air temperatures due to the absorption and storage of solar radiation in surface materials, cooling loads during summer periods are reduced too. This decreases the concentration of air pollutants in the urban area which helps mitigate the UHI phenomenon and the concentration of greenhouse gases which can help mitigate the global greenhouse effect. Additionally cool materials could increase the life expectancy of pavements since their performance is affected by temperature [28]. They could also improve visibility during the night, thus making it safer and also reducing the street lights needed, saving energy and reducing costs in this manner [25]. Disadvantages of cool materials The main problem caused by cool materials is glare. It could be a problem for drivers as well as for people in areas where they are exposed to the radiation for long periods of time [25]. As mentioned above, cool materials can decrease cooling loads during summer periods. However, during winter the heating needs 28
45 may increase [25]. Another problem that could be caused is that light coloured pavements darken due to dirt [28] and thus albedo values are altered. It is evident that the advantages of cool materials are more significant than the disadvantages. Even the problem with glare has been studied and new materials are developed that have high reflectivity values like other cool materials but that absorb the visible part of the solar spectrum in order for them to appear darker [25]. 29
46 3 Literature Review Various studies have been carried out as to evaluate urban microclimate and thermal comfort conditions. Numerous parameters that influence the microclimate and by extension thermal comfort conditions have been studied as well as the problems they cause and various mitigation measures have been examined and proposed. In this chapter the concepts identified in the introductory chapter are further developed and a number of relevant studies that have been carried out will be presented and analysed. A glossary is given in Appendix Urban Heat Island Many studies have been conducted in order to identify the causes of the urban heat island phenomenon, the parameters of the urban structure influencing it and the mitigation measures have been extensively studied in order to understand this phenomenon. It is not possible to draw general conclusions when it comes to this phenomenon. Each urban area is different, not only in structure, but also in climate. For that reason there are many techniques used to study the Urban Heat Island effect. The mitigation measures are specific, but in each case the weight of each measure differs. Because of its complexity of this phenomenon is the most well documented phenomenon of climatic change [29]. For the city of Athens, Greece many studies have been carried out confirming the existence of this phenomenon [30], [31], [32]. All prior studies conducted for the UHI in Athens show that the UHI phenomenon is most intense during summer periods. For that reason K. Giannopoulou et al. [33] study Athens to analyse the Urban Heat Island phenomenon focusing on summer months and not all year round. Twenty five fixed meteorological stations were installed in the centre and around Athens. The greater area of Athens was divided into five parts, the city centre, northern, eastern, southern and western part. Specific temperature data for the three summer months, June, July and August of 2009 were selected. As a result of the analysis of the mean monthly air temperatures, the northern and eastern parts were found to have lower temperatures due to the presence of green areas in a high percentage and the non existence of an 30
47 industrial zone. On the other hand, the city centre and western part of Athens had the highest temperatures, owing to the densely built environment, the increased traffic loads and the lack of green areas and vegetation. The study also analysed the diurnal and nocturnal air temperatures. The city centre meteorological station was considered the reference station. The differences of the hourly temperatures of all stations and the reference station were calculated and showed that the centre and western part of Athens have an intense UHI phenomenon that may even reach the difference of 5 C. Mainly the western part developed the UHI phenomenon during night time. Conclusively, even though Athens does develop high temperatures during the summer due to its position and the high mountains surrounding it, parameters such as a densely built environment, increased traffic, industrialisation and the lack of green spaces and vegetation intensify the temperatures and cause an Urban Heat Island. On the other hand lower temperature arises in areas with significant vegetation and no industrial zone [33]. The complexity of this phenomenon can be seen through this study. Different areas get influenced by a mixture of parameters. It is very difficult for these parameters to be the same in different urban areas thus making it difficult to arrive at uniform conclusions. However the negative impact anthropogenic activities and the positive impact of green areas and vegetation are obvious. Degraded indoor thermal conditions have led extensive use of cooling systems (air conditioners) during summer months and sequentially increased the energy demand. The increased demand for energy not only increases the energy cost for the dwellers, but can also cause problems in energy supply, such as power blackouts. Additionally, the increase in energy demand intensifies the concentration of harmful pollutant emissions due to the consumption of fossil fuels. The higher concentration of these gases and particles degrade the outdoor air quality and can have consequences on the health of the urban dwellers. M. Santamouris et al. [34] estimate the ecological footprint of the Urban Heat Island effect over Athens. The goal of this study is not to confirm the existence of the phenomenon, they take it as granted, but to estimate the direct as well as the indirect impacts that the Urban Heat Island has on the environment. To do 31
48 so they estimated the increase in energy demand for cooling through simulation and translating it to environmental cost. Data from twenty three different climatic stations in Athens were taken during the summer periods of 1997 and Hourly ambient air temperature and humidity readings were used. Each site that was chosen had different building density and different traffic loads. One of the stations was situated at an altitude of 500 meters on the Hymettus Mountain. The area had no buildings and no traffic load. The vegetation was moderate. This site was used as the reference rural area and was compared to the other sites. Using this data the energy cost of the Urban Heat Island phenomenon in Athens was calculated as well as the CO 2 emissions caused by this phenomenon. The conclusion drawn from this study was that there is a high potential for increase of energy cost and CO 2 emissions in Athens due to this phenomenon showing that it is a growing problem [34]. Once again the positive impact of vegetation, low building density areas, low traffic loads and in general low anthropogenic heat releases are evident. Although Athens is the largest city in Greece, there is an interest in the existence of Urban Heat Island effect in other cities of Greece as well. D. Kolokotsa et al. [35] study the UHI in Chania, a small town on the island if Crete, Greece. Even though it is a small town it is densely populated making it an interesting case study. For the purpose of the study nine urban and three rural meteorological stations were set up. The stations were spread out throughout the town in order to enclose all different areas. The stations were set up in the city centre, in densely built areas around the city as well as along the coast line. Measurements were taken from May 2007 until October 2007, the months it is considered summer in the southern part of Europe. Initial measurement of air temperature and humidity showed that the city centre had higher temperatures than the suburban areas and that the city centre had the lowest humidity percentages than any other station. The coastal line on the other hand had the maximum percentages of humidity. The UHI phenomenon was confirmed. After June the UHI intensity increased and after September it started to drop. Differences noticed during day time varied with major differences. However, the UHI phenomenon during night time was stable, with small differences throughout the period of the measurements. The influence of various parameters on the UHI 32
49 was studied, concluding that summer heat waves intensify the phenomenon, confirming the correlation between the microclimate of the area and UHI, recording that the city layout obstructs winds that could reduce the temperature differences and that rainfalls decrease the intensity of the phenomenon. The outdoor thermal comfort conditions were also studied. The result was that thermal comfort conditions follow the UHI. In urban areas, were the UHI was noticed, the discomfort levels were higher than in other areas [35]. Through this study we can notice how the UHI, the microclimate and the thermal comfort conditions of an area are all correlated and move together. We can also become aware of how many different parameters of these three aspects can be studied in order to draw these conclusions. It is interesting to see that parameters that are almost impossible to changed, such as the city layout, can intensify the UHI phenomenon alter the microclimate and decrease thermal comfort and to understand that this problem occurred due to the fact that it was never taken into account during the design phase of urban area. It is significant although for contemporary urban planners to take it into account. However, since there is little to do about that in already existing urban areas, emphasis should be given to the best design of public open spaces in order to improve the microclimate and hence the thermal comfort conditions and reduce the UHI effect. For example, a way to accomplished this is by increasing vegetation in urban areas. However, the studies analysed above give notice to parameters that influence the atmospheric UHI. Another type of Urban Heat Island that has been studied is surface UHI. The difference between surface UHI and atmospheric UHI is that atmospheric UHI is defined by using air temperatures taken by regular, ground meteorological stations. On the other hand, surface UHI is estimated by measuring the thermal radiation emitted by the surface. M. Stathopoulou et al. [36] conducted a study focusing on the surface UHI. They evaluate the thermal environment of five major cities in Greece during warm season; they detect hot spots, areas of intense thermal radiation, and estimate daytime UHI. The five cities that are studied are Athens, Thessaloniki, Volos, Patra and Heraklion. To estimate surface UHI Satellite images combined with land cover information were used. The land cover types used are five. Urban/densely built areas, suburban areas, mixed urban areas, rural areas and sea areas. Satellite images of 33
50 surface temperatures of the cities and land cover maps are integrated and mean surface temperatures are calculated for each type of land cover. The study concludes that mixed urban areas in all of the cities had high surface temperatures. Thessaloniki had the highest surface UHI followed by Patra. Athens and Thessaloniki s mixed urban areas were hot spots. In Athens and Heraklion suburban and mixed urban areas were warmer than the central urban areas when compared to rural areas. In Volos urban areas were warmer than rural areas and mixed urban areas that included some industrial activity were found to be hot spots [36]. In all studies the complexity of this phenomenon is apparent. Even though it is such a well studied phenomenon, it is area specific, depending and being influenced by a significantly large amount of parameters making it impossible to draw general conclusions even when dealing with a small area. 3.2 Urban microclimate and thermal comfort evaluation In order to improve outdoor conditions a large-scale project started in 2001 for the evaluation of comfort conditions across Europe. Project RUROS (Rediscovering the Urban Realm and Open Spaces) lasted until Its scope was to examine, evaluate and improve the quality of outdoor urban spaces by improving environmental and thermal, visual and audible comfort conditions in open spaces. In order to evaluate the prevailing conditions, questionnaires were completed. The project included field surveys across Europe. Fourteen different sites, in five different European countries were studied. Studies took place in Athens (GR), Thessaloniki (GR), Milan (IT), Fribourg (CH), Kessel (D), Cambridge (UK) and Sheffield (UK). In each city two areas with different characteristics were examined. M. Nikolopoulou and S. Lykoudis [37] analyse the thermal comfort conditions of these areas. The results show a correlation between microclimate and comfort conditions. Air temperatures along with solar radiation are found to be important parameters that influence comfort conditions. These conditions were examined from July 2001 until September 2002 in order for the survey to cover all sea- 34
51 sons. All cities had an over 75% comfort level throughout the year, even though the cities have very different climatic conditions. This proves that physical and psychological adaptation is present. Physically, people adapt through clothing variations and change in activities each season. With higher air temperatures, activities that have a slower metabolic rate are preferred. Psychologically people expect certain changes, such as warmer temperatures in autumn, since it follows summer than in spring, since it follows winter. It was also noted that people who chose to be present in an outdoor space and to be exposed to certain environmental and comfort conditions are more tolerant to them than those who are obliged to be there [37]. Even though the sites studied in this project had a very different climate air temperature and solar radiation were found to be important variables influencing thermal comfort at all sites. It was concluded that climatic variables and the microclimate are not the only parameters influencing thermal comfort but that physical and psychological adaptation play an important role in thermal comfort. However the adaptation is not in the scope of this thesis and will not be analysed any further. Following M. Nikolopoulou and S. Lykoudis [38] decide to take project RUROS a step further by examining the effect the microclimate has on the use of urban spaces using Athens, Greece as the reference site but generalising the results for the Mediterranean climate. The study includes some of the results of the RUROS project. Two areas in Athens were chosen. They are both in the municipality of Alimos but have very different characteristics. The first site is Karaiskaki Square and the second is the seashore of Alimos. Field surveys were conducted in both areas from July 2001 to March 2002 as to enclose all seasons. The people in different spaces of each area were counted in order to evaluate the use of the outdoor space. The microclimatic conditions were also monitored using mini portable weather stations. The sites were monitored on a weekly basis in order to capture weekly patterns. The surveys were carried out at different times according to the season. Once again, as in project RUROS, air temperature and solar radiation was found to be the most significant parameters influencing the microclimate and thus the use of space. A strong correlation between microclimate and use of space was found. The distribution of the people at the sites is also found to be significant for the use of space and 35
52 changes according to the season. It was noted that during summer Karaiskaki Square had less people than Alimos seashore. This is probably due to the fact that people can swim at the seashore. In winter though Karaiskaki Square and in particular the areas with no shading were more popular than Alimos seashore. Even though benches at Alimos seashore are not shaded and people can sit in the sun, the wind from the sea is chilled and has a negative effect. High wind speeds have a positive effect during summer, but during winter the effect is negative [38]. It is evident that even though air temperature and solar radiation were found again to be the most significant variables influencing the microclimate, as in project RUROS, the wind influences thermal comfort at a significant level as well. N. Gaitani, M. Santamouris and G. Mihalakakou [39] carried out a study on thermal comfort conditions in open spaces and focus on outdoor spaces once again in Athens. They use thermal comfort conditions as an indicator of the microclimate. They calculate thermal comfort conditions in twelve different outdoor spaces in Athens during summer. Using simulation tools they simulate the prevailing condition of the areas and as a second scenario they simulate various architectural improvements to the areas in order to evaluate how they improve the microclimatic conditions as well as the thermal comfort conditions. Conclusively, green spaces and high reflectivity and emissivity as well as the use of water spots to cool the air are the measures that influence the microclimate and are proposed [39]. Similar studies have been conducted in other areas as well. A notable study of the microclimatic conditions in the Historic Centre in Tirana, Albania was carried out in order to rehabilitate specific open spaces [40]. Emphasis was given amongst others to the materials used the construction of buildings and infrastructure since the city of Tirana has grown rapidly in the past years. These new constructions have led to environmental problems and degrading of the microclimate and by extension to poor comfort conditions. This study carried out by N. Fintikakis et al. aimed to improve the microclimate of the area by decreasing air temperature during the summer months and by this to improve thermal comfort conditions. Another goal of this study was to decrease pollution levels and 36
53 to reduce energy usage of the buildings surrounding the Historic centre. In order to achieve this goal the area s climate was monitored during September Air temperatures, humidity levels, wind speed and direction, pollution levels and surface temperatures were monitored. By monitoring surface temperatures they concluded that materials that are shaded have much lower temperatures than those that are not. The colour of the material also influences its temperature. Higher temperatures occur on dark coloured materials than on light coloured ones. High reflectivity materials also have lower temperatures than low reflectivity materials. They concluded that the poor microclimatic conditions of the area are caused by the lack of shade and evapotranspiration (since there are no high trees), the use of inappropriate, dark materials in constructions and due to the heat from cars. The existing conditions were simulated with a simulation tool. Afterwards various improvement measures were proposed. Using a simulation tool once again the proposed measures were analysed to evaluate their impact on the microclimate. A comfort index that takes mean ambient temperature and wind speed into account was used to evaluate the thermal comfort of the people. Before the proposed measures the comfort level was between warm and quite hot and after the interventions it was evaluated between warm and comfort. In this study, the influence of green, materials and anthropogenic heat on the microclimate is evident [40]. 3.3 Urban green Since this thesis is negotiating thermal comfort and urban microclimate in a Mediterranean city, previous studies that have examined the influence of urban green and vegetation in such cities are presented. Case studies from Greece, Italy, Portugal and Israel are presented. Dimoudi and Nikolopoulou [20] describe work that was carried out for the project PRECis: assessing the potential for renewable energy in cities. Generic urban textures with and without vegetation were studied under typical climatic conditions of Athens through CDF analysis. Four different cases were studied. The base case consisted of buildings only. The central building was replaced with a park in the second case and in the third case the size of the park was larger. In the fourth case both the size of the buildings and the park were in- 37
54 creased. It was found that vegetation affects the ambient air temperatures significantly. It does not only influence the temperatures inside the park but also the temperatures of the street on the leeward side of the park. If the green area is increased, the reduction in the ambient air temperature is greater. The results of the study show that for every 100 m 2 of vegetation added to the park, the temperature is reduced by 1K and for every 10% increase to the green to built area ration a 0.8K reduction is expected [20]. An existing green area in Athens, specifically the National garden, has been studied in order to evaluate the effect it has on the thermal environment of the surrounding area [41]. The study was conducted in two different scales. Firstly the temperature in the garden was compared to the temperature of the immediate surroundings. However, the influence of the garden in surrounding temperatures was not clear since it depended significantly on the characteristics of the surrounding areas. When the temperatures of the garden were compared to the temperatures of location situated in the wider city area, it was found that the garden influences the temperatures since lower temperatures were found in it. Various parks in Florence, Italy, with different surfaces were studied in [42], both in summer and winter, aiming to evaluate the thermal differences according to the size of the green area and the vegetation coverage. The study concludes that even small areas of vegetated areas can influence the air temperature. However, the larger the green area is the more evident the temperature difference. During winter and during summer nights there is a linear relationship between the temperature reduction in urban and green areas. The discomfort index rises during winter due to this temperature difference in green areas but reduced during summer. As far as human comfort is concerned, the most comfortable microclimate was found to be a small green area surrounded by houses. This area performed best during both months. The thermal performance of a small green space in Lisbon was evaluated in order to assess its influence on the microclimate of the area. The garden was found to be cooler both in the sunny and the shaded areas in comparison to shaded areas outside the garden. However, when streets with trees were studied and compared with streets without trees, the mean temperatures found were 38
55 very similar. This could be explained due to the heavy traffic load that existed in the street with the most trees. The results of the study conclude that green spaces in urban areas create a park cool island and this effect is mostly evident in cities with urban heat island and on hot and dry days in cities with a Mediterranean climate [43]. Another study was conducted in Lisbon for a medium-sized green space aiming to evaluate thermal differences once again between the green area and the built environment during the day and night [44]. The green space studied was the Gulbenkian Park. During summer, in 83% of the cases the median temperature in the park was lower than the temperature of the surrounding built environment. During winter the differences were hardly noticeable. The largest difference found was during the summer with very hot conditions and was equal to 9.5 C [44]. It was found that thermal differences and solar radiation are correlated. Measurements were taken inside and outside the park in areas with shading and without. It was found that areas outside the park with shading were cooler than areas inside the park without shading. However, non shaded areas in the park compared to non shaded areas outside it were found to be cooler. Conclusively, the green space was cooler during all seasons, with the difference in temperature being more significant during summer. The highest difference found between shaded areas was 5 C and between non shaded areas between 2 C and 3 C [44]. Three parks with different vegetation and tree types are studied in Tel Aviv and the results are presented in [45]. Climatic parameters were measured in the parks and in the surrounding built environment in order to compare them. The first park studied had grass and a few small trees. The second had medium sized trees and the third park had high trees with a wide canopy. It was found that in the third park the maximum difference found in temperature was 3.5 C. In the second park the maximum difference was 2.5 C but during the night due to the reduction of wind velocity and the increase in humidity the park had unpleasant climatic conditions. The first park was found to be warmer than the other two parks and even than the surrounding urban area and presented the worst thermal comfort conditions. The highest cooling effect was noticed in the 39
56 park with high and wide canopy trees as well as the best human comfort conditions. It was proven that solar radiation is one of the most significant factors that influence human thermal comfort. The study concluded that parks increase humidity but that does not mean that they will always be cooler and that parks containing trees have the potential to decrease air temperatures during the day since they block solar radiation. 3.4 Structure materials Various studies have been carried out in order to evaluate thermal and optical properties of various materials to find the most appropriate to be used in an urban environment. Doulos et al. [46] study ninety three different materials in relation to the surface temperature. Infrared thermograph imaging was used for the measurements. It was found that mean daily surface temperatures vary from 29.7 C, the temperature of a white marble tile, to 46.7 C, the temperature of a black asphalt tile. Most of the materials had a higher average surface temperature than the average air temperature except for the white marble tiles. It was concluded that dark coloured materials are warmer than light coloured ones and smooth and flat tiles do not heat up as much as rough and anaglyph surfaces. Asphalt developed the highest surface temperature due to its dark colour and rough surface. Marble, mosaic and stone tiles were found to be cooler than the rest of the construction materials. The study also revealed that the construction material affects emissivity and thus determines the thermal balance during the night and surface colour affects the albedo and thus influences the thermal balance during the day. Therefore it is important for the material as well as its colour to be taken into account when lower surface temperatures are desired [46]. A solution for pavements with better thermal performance is permeable pavements. Studies that have been conducted for this type of pavements are presented below. Permeable pavements Asaeda et al. [24] conduct a study at the Saitama University Campus in Tokyo to evaluate the heat storage of pavements as well as its effect on the lower at- 40
57 mosphere on summer days. Various pavement materials were observed as well as soil. It was found that asphalt heats up more than other materials and releases a large amount of heat to the atmosphere. Concrete pavement of black colour stored heat during the day and released it to the atmosphere during the night. During the day the black coloured concrete pavement had a lower surface temperature than the asphalt pavement but its surface temperature was higher during the night due to large heat storage below the surface concluding that lower heat conductivity pavement materials result in warmer days in contrast to high conductivity pavement materials that result to warmer nights [24]. According to the same study, soil absorbs large amount of solar radiation but the surface is heated at a slower rate than that of other materials due to the use of solar radiation for the evaporation process of the water in soil. Asaeda et al. [24] recommend that pavements in urban areas should be constructed with water permeable pavement materials in order reduce the effects of pavements on the thermal climate of an urban area. Another study is conducted by Asaeda et al. in 2000 [47]. In this study the thermal characteristics and behaviour of permeable and typical pavements are analysed during the summer along with the impact they have on the thermal environment. Field experiments were carried out where ten sample blocks of different types of pavement materials were tested. Out of the ten materials many had similar behaviour and thermal characteristics and thus only four where analysed eventually. The types of surface materials evaluated were porous block pavement, dark non-porous asphalt, natural grass and ceramic porous pavement. The porous block pavement was found to be rather dry since it could not retain water in its pores because of their large size. Since no water was retained no evaporation was observed and thus the solar radiation that was absorbed was used to heat up the surface as in the case of the black non-porous asphalt. The porous bock pavement and the non-porous asphalt developed very high temperatures that reached up to 54 C at noon [47]. The ceramic porous pavement, due to the various pore sizes in its structure, could withhold water for several days as well as absorb a large amount of water from the underlying soil. Evaporation was observed and therefore lower surface temperatures were developed than those of the non-porous asphalt and the porous block pavement. The tem- 41
58 perature of this sample was almost the same as the natural grass sample with the grass sample having a slightly lower surface temperature. At noon they developed similar temperatures that reached 43 C [47]. The heat storage and temperature below the surface of the samples practically followed the same pattern, with some alterations. The porous block pavement had higher sub surface temperatures during the day and stored more heat than the non-porous asphalt sample, because of the higher conductivity value of the materials. Hence, during the night the two samples had almost the same surface temperature or the porous block would develop higher temperatures. The ceramic pavement had a lower sub surface temperature than the porous block and the asphalt material, but was higher than the grass sub surface temperature due to the higher conductivity value of the ceramic pavement. The natural grass sample appeared to have the lowest surface temperature than all as well as the lowest sub surface temperature since it has low conductivity. The soil under the sample did not heat up. Once again it is emphasized that natural surfaces have the appropriate thermal characteristics for an urban environment. However, due to the fact that pavements can not be replaced by such surfaces, it is important to find materials that could replace the typical surface materials that are more environmental friendly and help mitigate the problems in urban areas. Cool materials For the above reasons, research has turned to materials with high solar reflectance and infrared emittance values, namely cool materials. Even though the development of cool materials for roofs is highly developed, the same does not apply for cool paving materials. A few studies that have been conducted on various cool material technologies, most of which study reflective coatings. A few studies of reflective coatings are presented below along with a study for phase change materials and a study for thermochromic coatings. Reflective coatings Synnefa et al. [48] study fourteen different types of commercially available coatings that where applied on concrete tiles. The thermal performance of these coatings was monitored by infrared thermograph imaging throughout the day in 42
59 order to evaluate the rise in their temperature during the day and their cooling potential during the night. The same measurements were done for an uncoated concrete tile, a black coated tile, a white marble tile and a white mosaic tile in order to compare the findings. Tiles with white coating were found to have the minimum daily surface temperatures. The maximum surface temperatures were observed for silver coloured coatings. The white coatings had higher emissivity than the silver coloured aluminium-pigmented coatings. During the day white coloured coatings reduced the temperature of the concrete tile. On the other hand the silver coating increased the temperature. In the warmest month the black coated concrete tiles had a higher temperature than the uncoated one. The majority of coatings reduced the temperature of the concrete tile during the night. In comparison to the ambient air temperature, all the coated tiles had higher average surface temperature than the ambient air temperature. However, during the night all coated tiles had lower average temperatures than the ambient air temperature. Half of the coatings thermally performed better during the day than the marble and mosaic tiles. During the night the mean temperature of the coated tiles were very similar or slightly higher than those of the marble and mosaic tiles. This study shows the significant effects that reflective coatings can have in the heating of urban surfaces and therefore in the mitigation of the urban heat island phenomenon. Another study evaluates the thermal and optical properties of ten prototype cool coloured coatings that contain near infrared reflective colour pigments and compares them to conventionally pigmented coatings of matching colour [49]. The cool coloured coatings have the same visible reflectance as the conventional coatings. However the cool coloured coatings reflect large parts of the solar infrared radiation instead of absorbing it and by this, lower surface temperatures are achieved. The maximum solar reflectance difference that was found between cool coloured and conventional coating was equal to 22 with a corresponding 10.2 C temperature difference [49]. Cool coloured thin layer asphalt is another technology that could help reduce ambient air temperatures in urban areas. According to [50], after five different coloured thin layer asphalt samples were tested along with a reference conven- 43
60 tional black asphalt sample, it was concluded that all thin layer asphalt samples had higher reflectance values and lower surface temperatures than the conventional black asphalt sample. The reflectance of the black asphalt sample was found to be equal to 4%, a much lower value than the 27% reflectance found for the red and green thin layer asphalt samples and the 55% reflectance of the offwhite thin layer asphalt sample. The research of this study did not stop here. A CDF simulation was conducted in order to evaluate the influence of thin layer asphalt in an urban environment. It was found that when the off-white thin layer asphalt was applied to a road a temperature reduction of 5 C in the air temperature was noticed [50]. Phase Change materials Thirty six coatings of different colour and different quantities of PCM and different melting points were studied and presented in [51]. Cool coatings and common materials of the same colour were also evaluated in order to compare them. It was found that all phase change materials developed lower surface temperatures than the common materials and cool coatings. PCM doped coatings in comparison to common materials developed 2.9 C to 8.3 C lower surface temperatures. In comparison to cool coatings, PCM doped coatings had differences in surface temperatures ranging from 0.6 C to 2.6 C. It was concluded that the application of PCM doped coatings on urban structures can lower urban surface temperatures and thus reduce the urban heat island. Thermochromic coatings Eleven developed thermochromic coatings for buildings and urban structures are studied and compared to common materials and high reflective coatings by Karlessi et al. The colour changing temperature of these thermochromic coatings was 30 C. In [52], the thermochromic coatings were divided into two groups, coatings with TiO 2 and coating without TiO 2. Thermochromic samples with TiO 2 had lower surface temperatures than thermochromic coatings without TiO 2. It was noticed that the thermochromic coatings were colourless at high temperatures and thus reflected solar energy, opposing to low temperatures were they were coloured and absorbed solar energy. All thermochromic coatings developed lower surface temperatures than the common and cool samples of the same colour even during the thermochromic coatings coloured phase. 44
61 Thermochromic coating developed temperatures between 23.8 C and 38.4 C, cool materials developed temperatures between 28.1 C and 44.6 C and common materials developed temperatures between 29.8 C and 48.5 C [52]. 45
62 4 Urban Area and Climate of the Municipality of Kalamaria 4.1 Municipality of Kalamaria The municipality of Kalamaria (40 34' 57" N, 22 57' 1" E) is situated on the southeast area of Thessaloniki and reaches up to the Thermaikos Bay. The municipality covers an area of 7200 acres, or 29 km 2. It is surrounded by sea on the Northwest and Southeast side of it [19]. The total coastline is 6.5 km long. It has a typical Mediterranean climate and the summers are hot and dry. The wind regime is usually moderate north-northwest in the morning and weak southeast during the afternoon [19]. It is one of the most developed municipalities in Greece regarding the population, its development and its commercial activities. It is considered the second largest municipality in Thessaloniki in terms of population. In the whole of Greece it is the ninth largest [53]. As seen in table 6 (Table 6), the population according to the 2001 population census was 87,312 people. This shows an increase of 12.4% since 1991 population census. The rate of the municipality s population growth is around 8.2% [54]. Table 6: Location data and population statistics for Kalamaria Municipality of Kalamaria Coordinates 40 34' 57" N, 22 57' 1" E Area 29 km 2 Coastline 6.5 km Population 87,312 Population density 13,642.5 people/km 2 Annual growth rate 8.2 % Source: [54] The municipality of Kalamaria is a residential area with its own commercial centre, sufficient infrastructure, schools etc. The commercial centre is situated on and around the pedestrian street, part of which is adjacent to the City Hall 46
63 Square. Even though the municipality of Kalamaria is one of the most developed, especially in terms of economy, it has a lack of green open public spaces. Taking into account the land use in this part of Thessaloniki, it is evident that the area is mostly build making it hard to find space for the construction of open public spaces. However, the existing spaces could be reconstructed in a more pleasing way. As mentioned before, the world standard average of green spaces to citizen is 8-10 square metres. In Greece, ten square metres per citizen is considered an acceptable level. Unfortunately though, such levels are scarce in Greece. The city of Thessaloniki has an average of 1.4 square metres per citizen [19]. In Kalamaria this percentage is higher and equal to 5.58 square metres per citizen with 9.93% of the total area consisting of green spaces [55]. Even though the green areas are not so many, the existing ones contribute in the improvement of the microclimate of the area. The microclimate of the area is better than that of the city centre. The seafront and thus the sea breeze, the land use, the lower building density in comparison to the city centre and the local winds also improve the microclimatic conditions [19]. 4.2 GRaBS project What is it? GRaBS (Green and Blue Space Adaptation for Urban Areas and Eco towns) is an urban green and blue space adaptation project. Various organizations take place in this project in order to adapt regional planning and development to climate change. A total of fourteen partners take place in this project, from eight member states [53]. These member states and the partners are shown in the table below (Table 7). 47
64 Table 7: Member states and partners taking place in the GRaBS Project Member States Austria Greece Italy Lithuania Netherlands Slovakia Sweden UK Partners Provincial Government of Styria Municipality of Kalamaria Etnambiente SRL / University of Catania / Province of Genoa KU CORPI The Amsterdam City District of Nieuw- West Regional Environment Centre for Eastern Europe (Slovakia) City of Malmö TCPA / University of Manchaster / London Borough of Sutton / NWDA / Southampton City Council Source: The GRaBS project is financed by the European Union's Regional Development Fund and the funding is approximately 300 million euros. According to the GRaBS project s site the main objectives of the project are [53]: To raise awareness and increase the expertise of key bodies responsible for spatial planning and development as to how green and blue infrastructure can help new and existing mixed use urban development adapt to projected climate scenarios. To assess the delivery mechanisms that exist for new urban mixed use development and urban regeneration in each partner country and to develop good practice adaptation action plans to co-ordinate the delivery of urban greening and adaptation strategies, as well as cooperation amongst: planners, policy-makers, stakeholders, and local communities 48
65 To develop an innovative, cost effective and user friendly risk and vulnerability assessment tool, to aid the strategic planning of climate change adaptation responses To improve stakeholder and community understanding and involvement in planning, delivering and managing green infrastructure in new and existing urban mixed use development, based on positive community involvement techniques GRaBS project and the Municipality of Kalamaria As mentioned before, Thessaloniki and thus the Municipality of Kalamaria have a typical Mediterranean climate with hot and dry summers. The Municipality of Kalamaria, at its present state does not have any significant green infrastructure even though it could help mitigate problems experienced because of the urban environment. The Municipality also expects a great increase in the use of air conditioning units that could only intensify the UHI phenomenon in an urban area and thus impact the climate. This is the reason the municipality takes place in this project. Its goal according to the GRaBS site is to develop awareness and knowledge amongst local and regional planners, developers, urban designers and architects, about the important role and multi-functionality of green and blue space infrastructure in creating climate change resilient development. The ultimate objective is to provide a higher quality of life for communities in the municipality s urban areas. [53]. 49
66
67 5 Methodology The methodology of this study is of multidisciplinary character. Its main objective is to understand how the microclimate and in turn the thermal comfort in an urban area are influenced by parameters such as the selection of materials to be used in urban structures and the amount of green in outdoor areas. The study is approached in a combined quantitative method through experiment and simulation. The experimental part of the study focuses on the measurement of the microclimatic conditions and the evaluation of thermal comfort conditions of two significantly different in characteristics areas in the Municipality of Kalamaria. The sites chosen are different in terms of green and surface materials. With the numerical simulation the aim was firstly to determine the impact of independent variables on the microclimatic and thermal comfort conditions and secondly to predict the effects of possible interventions that could be implemented. 5.1 Description of selected sites For the purpose of this study, two significantly different sites were selected. The different in characteristics sites were selected deliberately. The aim was to compare the prevailing conditions and to examine the impact if independent variables were to be altered. The main differences of the two sites are the surface materials as well as the existence of vegetation and green Site A The first selected site, site A, is the City Hall Square in Kalamaria (Figure 5). It is situated in a densely built area, it has limited vegetation and is paved with grey concrete tiles. In areas of the square s perimeter, surrounding several green areas, black graphite slabs have been fitted that are used as seating. The Northeast side of the square is adjacent to a pedestrian street that attracts many inhabitants of the area and others that come for shopping, for food or 51

68 drinks, for walks, in order to accompany their children for play and other activities. It has multiple purposes and attracts various age groups, from very young children to pensioners. The city hall building is situated on the Northwest of the square. It is a low, but long, two storey building. On the southeast side of the square there is a construction with shading louvers and benches situated under it for visitors of the square. The material used for the paving under the canopy is red cement gravel. Behind the benches there is an area covered in grass with a water feature. However this area is significantly small compared to the size of the square. On the southwest side there are tables and chairs from a cafeteria as well as on the east side. There are a few trees situated around the square that provide some shade. Figure 5: View of City Hall Square from above Source: Google Earth There are a few trees situated in the pedestrian street. Some of the trees on the pedestrian street have benches beneath them. The pedestrian street is paved with concrete slabs of different colours in different areas. There are red, yellow and dark grey gravel tiles. Apart from the city hall building there is a small build- 52
. It is a twenty seven acre piece of land that has only the bases of the warehouses since they burned down.")
69 ing to the left of it (it cannot be seen in figure 5 since it is hidden by the trees) and another small building on the southeast side of the square Site B The second site is the old tobacco warehouses (Figure 6). It is a twenty seven acre piece of land that has only the bases of the warehouses since they burned down. There are two concrete paved bases on the site along with a third base that has been turned into two basketball courts that are currently paved with asphalt, as well as a gravel paved soccer field. The rest of the area has soil and vegetation as a surface material. There are many trees in the area. The trees situated centrally are relatively small. The perimeter of the area however is covered by large trees and on the northeast side of the basketball courts there is a small boscage with large trees. Under a few trees in the central area there are benches. In the central area there is a playground for children to play. The passages between the bases are paved with lose grey gravel. Source: Google Earth Figure 6: View of old tobacco warehouses from above 53
70 The area is mainly visited by inhabitants of the surrounding area. The area attracts adults accompany their children in order for them to play, teenager and adults that go for walks as well as children and a few adults that play soccer or basketball. 5.2 Data collection Climatic data collection In order to evaluate the microclimate and the thermal comfort conditions of the area, measurements of specific climatic parameters were needed. In addition, a number of questionnaires were filled out. A total of twenty questionnaires were filled out at each site on two different days in July in the late afternoon. On site the questionnaires were completed with simultaneous recording of the air temperature and the humidity levels. The air temperature and humidity were monitored by using the HOBO U14 Temperature/Relative Humidity data logger. Thermal images of the two sites, with the use of a thermal infrared camera, were captured in order to monitor the surface temperatures of the two areas. The rest of the needed climatic parameters such as wind speed and wind direction were taken from the meteorological station of the Aristotle University of Thessaloniki. For the evaluation of the thermal comfort, a five point scale was used, where -2 was considered very cold and 2 very hot. Various people of different gender, age groups and activities, situated in different spots of the two areas were questioned. On each questionnaire the air temperature, the humidity, the areas characteristics, such as material used for paving, colour of material and the existence of green were put down along with the gender and age group of the questioned individual, the reason for their visit to the area and their level of thermal comfort. The questionnaire used can be found in Appendix 2. 54
71 5.3 Simulation of microclimate and outdoor thermal comfort ENVI-met simulation model For the evaluation of the microclimate and the outdoor thermal comfort the EN- VI-met simulation model will be used. ENVI-met is a microclimate model that simulates and evaluates the microclimate in an urban environment. It is based on three dimensional computational fluid dynamics (CFD) and energy balance model. The model is designed to simulate the microclimate by taking into account the micro-scale interactions in the urban environment between the atmosphere, the surface, the buildings and the existing vegetation. The typical time frame of the model is between 24 and 48 hours. The maximum time step that can be used is 10 seconds. As a first step for the analysis of a model an area input file must be created. The file consists of a main model area divided into grid cells, whose size are defined by the user. The model can cover areas from 100m x 100m up to 1km x 1km with a grid size extending from 0.5m to 5m. The input data necessary for the program to run are the climatic data such as air temperature, wind speed and direction and humidity, data for the buildings such as indoor temperature, heat transmission of the building elements (u-values) and albedo values for both walls and roof. It is also required to insert the longitude and latitude of the studied area. The second step of the simulation process is the creation of a configuration file. The main configuration file consists of the name of the simulation, model area and output files, the date and time the simulation will start, the total simulation time and climatic data. Different sections can be added to the configuration file as well. If no additional sections are added, the default values that exist in EN- VI-met are used. After these files are created the model can be run. There are three versions available depending on the size of the model grid. The three versions are 100x100x30, 180x180x30 and 250x250x30. 55
72 The model generates a large amount of output files. The output files contain all data regarding the state of the model, in specific the atmosphere, surface and soil output data. These files are binary files that can be visualised with the LE- ONARDO software through the creation of two dimension maps. XTract software can be used as well ENVI-met limitations The ENVI-met model has a few limitations that should be taken into account. Firstly the model can be used only for micro-scale modelling and the model times are limited. Additionally the only features of the urban environment that can be designed in the model area are buildings, ground material such as soils and pavements and trees and vegetation. Shading structures for example cannot be created. It should be pointed out that the buildings in the model all have the same indoor temperature and no thermal mass along with the same albedo and thermal resistance for walls and roofs. These parameters cannot be different for individual buildings making the model unrealistic which is a significant limitation. Furthermore water bodies are part of the soil profile and thus only still water can be analysed making it impossible to add fountains to the model. 5.4 Measurements Climatic parameters The climatic parameters that were measured on site were temperature and humidity. Day one had significantly higher temperatures than day two. The humidity levels were very similar. The wind speed and wind direction data was taken from the meteorological station of the Aristotle University of Thessaloniki. Both days had very low wind speeds and wind directions fluctuating from 160 to 230. The climatic data collected for the city hall square and the old tobacco warehouses are presented in the table below (Table 8). 56
73 Table 8: Climatic data measurements Day Air temperature ( C) Relative Humidity (%) City hall Square Wind speed (m/s) Wind direction ( ) Old tobacco warehouses Surface temperatures The surface temperatures were calculated by thermal infrared camera. The captures were taken at between 19:00 and 20:00 on a random summer day in July on both sites. The time was selected in order to see how the materials react when the solar radiation is not strong and the materials release the heat they have accumulated in their mass during the day. Even though the images (Figure 7) were captured in the early evening the concrete tiles used to pave the city hall square had developed very high temperatures. As it can be seen in the thermal infrared image of the concrete tiles the maximum temperature that was developed was 44.7 C and the lowest was 38 C which was noticed on the marble strips that are placed between the blocks of concrete tiles. It is evident that these temperatures are higher than the ambient air temperature. In the second image, showing an overview of the square the maximum temperature is noticed on the concrete tiles again and is approximately equal to the value depicted before. The lowest temperature in this capture is in the green area that is situated on the northeast side of the square. The temperature of this area is equal to 32.3 C. The value is not precise since the angle of the image is not the appropriate. In the third image the difference in temperature between the concrete tiles and the green space is more evident. The minimum value in this case is 29 C and the maximum is 44.5 C. The pedestrian street which is with different types of paving has surface temperatures between 40 C and 44.8 C. 57
74 At the second site (Figure 8), the old tobacco warehouses the maximum temperatures were noticed on the asphalt paved basketball court. The temperature developed in that area reached 42.9 C. The boscage in the background has a temperature of 31.8 C but once again this value is not precise due to the angle of the capture. The vegetated are of the site has a surface temperature of 31 C and the concrete bases surface temperatures rise up to 40.8 C. The difference in temperature between natural materials and artificial materials is evident. Natural materials have a temperature very similar to that of the ambient air temperature but artificial materials develop much higher temperatures. All the excess heat that artificial materials store in their mass is given out to the environment and thus has negative effects on the surrounding microclimate. From the measurements done at the two sites it is evident that the City Hall Square had significantly higher temperatures than those of the old tobacco warehouses. 58


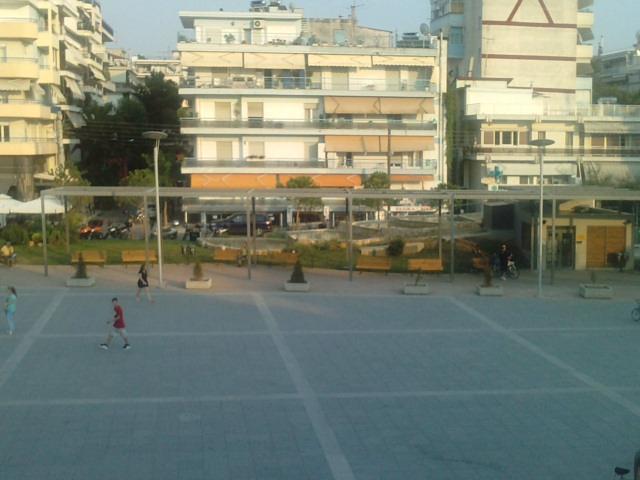


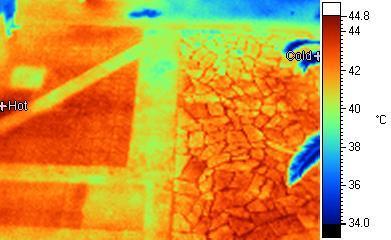
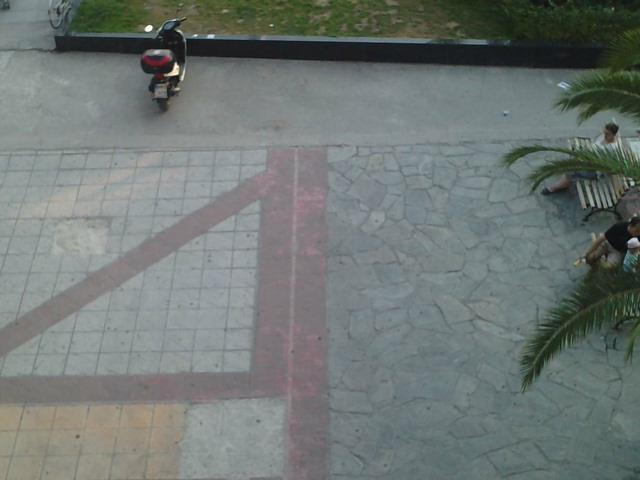
75 Figure 7: Thermal imaging of City Hall Square and pedestrian street 59


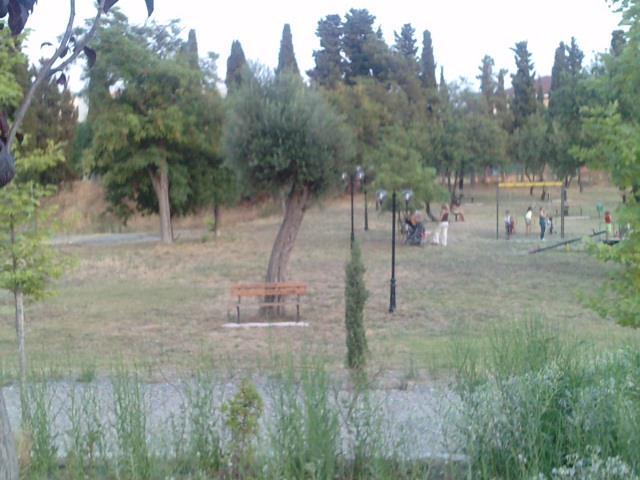

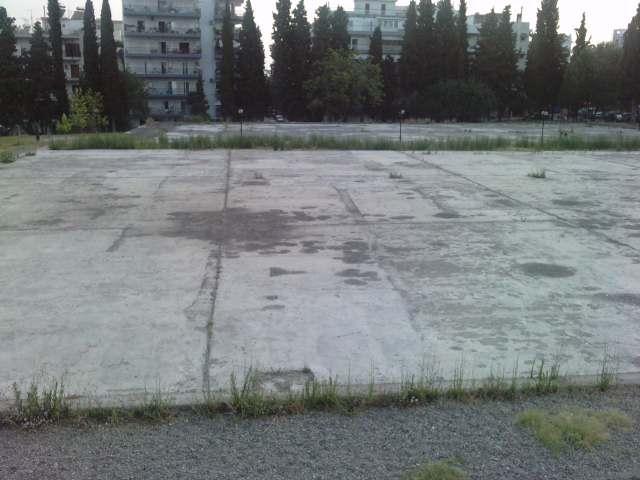
76 60 Figure 8: Thermal imaging of old tobacco warehouses
77 5.4.3 Questionnaires Site A City Hall Square Totally twenty questionnaires were completed for this site on two different days in July during late afternoon hours. On the first day the air temperature was 35.5 C in the square and its perimeter. On the pedestrian street however, which is adjacent to the square, the temperature was higher and reached 36.1 C. The relative humidity was 32% at both areas. On the second day the air temperature in the area of the square was 31.2 C and 31.4 C on the pedestrian street. The relative humidity was 30% in both areas. The majority of the thermal comfort votes on day one were Very hot votes. The individuals questioned were passing by, working or sitting in the surrounding cafeterias in the area. They belonged to various age groups and both gender. On day two, the majority of the votes were Neutral. The Very hot votes were given by individuals that were working in the area. They belonged to the same age group but opposite gender. The thermal comfort votes for each day separately are presented in the following table. Table 9: Thermal comfort votes per day Day 1 Day 2 Level Percentage Level Percentage 0 Neutral 10% 0 Neutral 60% 1 Hot 40% 1 Hot 20% 2 Very hot 50% 2 Very hot 20% With a total of twenty questionnaires completed in two days and four different temperatures on Site A, the overall thermal comfort that was evaluated for both days in total can be seen in the following graph (Graph 1). 61
78 Very hot, 35% Very cold, 0% Cold, 0% Neutral, 35% Hot, 30% Graph 1: Percentage of thermal comfort votes Site B Old Tobacco Warehouses Another twenty questionnaires were completed for site B on the same two days in July as for site A at late afternoon hours. On the first day the air temperature was 35.1 C throughout site B. The relative humidity was 35%. On the second day the air temperature was equal to 30.4 C. The relative humidity was 30%. The thermal comfort votes for site B on both days separately are given in the below table (Table 10). Table 10: Thermal comfort votes per day Day 1 Day 2 Level Percentage Level Percentage 0 Neutral 14% 0 Neutral 67% 1 Hot 43% 1 Hot 42% 2 Very hot 43% 2 Very hot 0% Day one had very high temperatures and most votes were Very hot and Hot. The individuals that were asked were mainly adults of both genders and of the same age group accompanying a child to play. Day two had significantly lower temperatures than day one. Most votes were Neutral with a few Hot. No Very hot votes were given. On the second day people were passing by, or were there to accompanying a child to play, for walks or for multiple reasons. 62
79 With a total of twenty questionnaires completed in two days and on Site B, the overall thermal comfort that was evaluated for both days in total can be seen in the following graph (Graph 2). Very hot 15% Very cold 0% Cold 0% Neutral 45% Hot 40% Graph 2: Percentage of thermal comfort votes Simulation process Input data for City Hall Square As mentioned above the first step of the simulation process is the creation of an area input file. For the creation of the City Hall Square s area input file a grid size of x=2m, y=2m, z=2m was used. The total number of grid cells along the x axis were 60, the y axis 70 cells and the z axis 30 grid cells. Eight of those grids on the left and right side of the model and five of them on the top and bottom were added so the buildings could have a sufficient distance from the model border (Figure 10). The model area was rotated by 45 degrees. The buildings situated on the northeast and southwest boundaries of the model were created with an average height of 15 meters. The city hall building was created with a height of 8 meters and the smaller buildings with a height of 4 meters. In order to design the urban structure of site A figure 5 (Figure 5) was used along with the map seen in figure 9 (Figure 9). The second step necessary to run the model was the creation of the configuration file. The simulation started on the 20/01/2011 and at 15:00. The total simulation time was 30 hours. The initial temperature that was used for the simulation was the average of the temperatures measured during the two day questionnaire process and was equal to 33.6 C. The wind speed inputted was

80 m/s. An average was not taken for this value since it is recommended to use values over 0.5 m/s in the model. The wind direction was 160. The relative humidity was taken as 31%. Figure 9: Topographic map of City Hall Square Source: Municipality of Kalamaria Apart from the basic configuration settings additional sections were added. The position section was altered and the correct longitude and latitude values were inserted. In the building section the heat transmission values for the walls and roofs of the buildings were altered along with the albedo values. A u-value of 1.00 W/m²K was used for both walls and roofs since it was assumed that the buildings had insulation on both vertical and horizontal building elements. The albedo used for walls was 0.6 and for roofs 0.2. Unfortunately these values cannot be different for each building. It was considered that for the PMV section an average state of the questionnaires that were completed was the best way to go. In most of the questionnaires the individuals were sitting in some area of the square. So the walking speed in this section was set to 0 m/s. According to the manual of ENVI-met the energy exchange value for a seated individual is approximately 70 and thus the mechanical factor according to the same source is 0. Since it was a hot summer day, the clo-value used was that of casual cloth 64
81 with shorts and was equal to 0.4. The forced type of lateral boundary conditions was used. The model ran at the 100x100x30 version. The outputs produced from the model were visualized through the LEONARDO software and will be discussed in the next chapter. Input data for Old Tobacco Warehouses For the design of the second site, the old tobacco warehouses, the grid cell size was x=3m, y=3m, z=2m and the number of grid cells in the area were 74 on the x axis, 65 cells on the y axis and 20 grid cells on the z axis. In the image of the area input file (Figure 11) only the vegetation and trees are depicted. The rest of the elements of the area are depicted in the soil profile of the area. The model area was rotated by 30 degrees. In order to design the urban structure of site B figure 6 (Figure 6) was used. In the configuration file the simulation was set to start at 15:00 on the 20/07/2011. The total simulation time was 30 hours. The initial temperature that was used for the simulation was the average of the temperatures measured during the two day questionnaire process and was equal to 32.7 C. The wind speed inputted was 0.7 m/s and the wind direction was 160. The relative humidity was taken as 32%. Once again the temperature and humidity values were the average of the temperatures and humidity levels measured during the two day questionnaire process. The additional sections of this configuration were the same as in the city hall square configuration file, with the same values except for the building section that was not added since there are no buildings in the model. The model ran at the 100x100x30 version. The outputs produced from the model were visualized through the LEONARDO software and will be discussed in the following chapter. 65


82 Figure 10: Area input file for City Hall Square Figure 11: Area input file for Old tobacco warehouses 66
83 6 Results In this chapter the results from the simulation of the microclimate and the thermal comfort conditions in both areas are presented. The LEONARDO 3.75 software was used to visualize the results. The results of both sites are analysed separately at first. 6.1 Microclimate simulation The output files from the ENVI-met simulation model were analysed and visualised through maps with the use of the LEONARDO 3.75 software. The air temperature at 1.60 meters was visualized for both sites at five different hours of the day. The results along with the maps are presented below City Hall Square Notes The step size of the temperatures in the different maps should not be ignored since they are coordinated to the colour scale. The first five and last five grids on both the x and y axis should not be taken into account since they are not part of the model area as mentioned before. It is recommended that the initialisation of the simulation is around noon. Since the simulation starts at 15:00 on the 20/07/2011 results for all hours of the day are available for day two and thus the results for the 21/07/2011 are analysed. Air temperatures at City Hall Square at 09:00 From the visualisation of the output file that was produced for 09:00 on the 21/07/2011 (Figure 12) it can be seen that the air temperatures around the green area with the water feature situated on the right side of the map are slightly lower than the air temperatures of the close surrounding area. However the other green area of the square seems to not influence the air temperature. This could be due to the fact that it is a relatively small area compared to the surrounding. However, it must be noted that in the middle of this green patch there is a concrete paved block. This surely influences the effect this green area 67
84 has on the surrounding environment. In reality though the concrete paved block situated in this green area is shaded by a shading structure. Unfortunately though as mentioned before shading structures cannot be created in the specific simulation model and it seems that this block is open to solar radiation. Therefore the reality is different to the outcome of this simulation concerning this area. The coolest areas depicted in this map are the areas which are shaded at this specific time of the day. The buildings on the top of the map have a height of fifteen meters and thus shade the area in front. The warmest areas are those which are not shaded and are warmed by the sun. The bottom buildings which are in direct sunlight reflect the solar radiation from their walls and thus heat the area in front of them. The area behind the City Hall is warmer most of the day and this is due to the fact that the building is an obstacle to the wind flow. Air temperatures at City Hall Square at 12:00 As the sun rises higher the square gets heated in more areas as it can be seen in the map (Figure 13). Once again the green area with the water feature influences the air temperature around the close surroundings slightly, even though the air temperature in that area is higher than in other areas of the square. The differences are not large but then again neither is the size of the green area. Green and vegetation can influence the surrounding air temperature but only slightly. Large temperature reductions cannot be accomplished only with vegetation especially with vegetation of this size. The green area with the concrete paved block in the middle along with the trees that are situated on the west side of it seem to cool the close surrounding area at a small level. At this time the area behind the City Hall is cooler than the wider area. Even though the building blocks the wind flow, at this time of the day the area is shaded by the building and thus the air temperatures are lower. The warmest areas are observed around the buildings on the top right corner and bottom area of the map. The temperature difference when comparing the maximum temperature observed in the area at 09:00 and 12:00 is approximately 6 C. Air temperatures at City Hall Square at 15:00 The air temperature results for the City Hall Square that have been extracted from the simulation model for 15:00 are very similar to the results for 12:00 with 68
85 hardly noticeable temperature differences (Figure 14). The distribution of the temperature is almost the same. The differences observed are in the area on left corner of the map which seems to have slightly lower temperatures at 15:00 than it did at noon. The right side of the map also seems to have lower temperatures. However the differences are very small and are not worth analysing. To understand this better the difference of the maximum temperatures of the area at both times was found to be only 0.4 C. Air temperatures at City Hall Square at 18:00 The temperature distribution in the area is altered during the day (Figure 15). At 18:00 the temperature distribution in the area is significantly different compared to that at noon and 15:00. The strip that was the warmest area during noon and 15:00 is the coolest at this time of the day. Apart from the distribution, the air temperature seems to be significantly lower too with a difference in the maximum temperatures observed at 15:00 and 18:00 being almost 7 C. Air temperatures at City Hall Square at 21:00 It is observed that the distribution of the temperature in the area moves towards the left part of the map as the hours of the day pass. At 21:00 it is noticed that the temperature distribution is similar to that at 18:00 with a few differences (Figure 16). It is observed that heat accumulates at the lower left buildings of the map and behind the City Hall building. However the air temperatures are much lower at this time of the day than earlier hours. If the maximum temperatures calculated in the area at 21:00 and 18:00 are compared an approximately 4 C difference is noticed. Observations The largest step sizes are present during noon and 15:00. At these times the steps are 0.76 and 0.61 respectively. A rise is noticed at 12:00 compared to 09:00. After 12:00, which has the largest step size, a small reduction is noticed at 15:00 and after that there it reduces significantly ever studied hour. The step sizes show how large the air temperatures differences are in the area. During the hottest hours of the day, namely noon and 15:00, the difference in air temperatures between the hottest and the coolest areas of the site are between 6 C and 7.5 C which is a significant difference. 69
86 It is observed that as the hours pass the hot spots seem to move towards the left side of the map. There is no specific explanation for this. However it could be caused due to the wind flow. The direction of the wind is from the right bottom corner of the map towards the top left corner. 70


87 Figure 12: Air temperature at 1.60 meters at City Hall Square at 09:00 Figure 13: Air temperature at 1.60 meters at City Hall Square at 12:00 71


88 Figure 14: Air temperature at 1.60 meters at City Hall Square at 15:00 Figure 15: Air temperature at 1.60 meters at City Hall Square at 18:00 72

89 Figure 16: Air temperature at 1.60 meters at City Hall Square at 21:00 73
90 6.1.2 Old tobacco warehouses Notes The step size of the temperatures in the different maps should not be ignored since they are coordinated to the colour scale. The bottom left corner grids in the map with no vegetations or trees should not be taken into account since it is not part of the model area. It is recommended that the initialisation of the simulation is around noon. Since the simulation starts at 15:00 on the 20/07/2011 results for all hours of the day are available for day two and thus the results for the 21/07/2011 are analysed. Air temperatures at old tobacco warehouses at 09:00 From the visualisation of the output file that was produced for 09:00 on the 21/07/2011 for the old tobacco warehouse site (Figure 17) it can be seen that the temperatures in the area range from approximately 31 C to 36 C. The step size of this map is equal to 0.5. It is observed that the areas with natural surface materials have the lowest air temperatures in the area. The highest air temperature is noticed at the asphalt paved basketball court. The soccer field covered with gravel also has higher air temperatures than the natural materials. The concrete paved bases have air temperatures ranging between 33 C and 35.4 C. This proves that the surface material does influence the air temperature even at a height of 1.60 meters. Air temperatures at old tobacco warehouses at 12:00 At noon the temperature distribution in the area almost changes completely (Figure 18). The bottom part of the map presents higher temperatures in an odd manner and this cannot be explained. It could be caused by the simulation model due to the lateral boundary conditions that were used. The forced lateral boundary conditions were used for this simulation. In this condition the border values are copied from the one dimensional model. The air temperatures range from 33.8 C to 42.6 C and the step size is Once again the highest air temperature is at the asphalt paved court. However it is worth pointing out the 74
91 air temperature raise in the area covered in natural materials. The concrete bases seem to have lower air temperatures than those in the vegetated area. Air temperatures at old tobacco warehouses at 15:00 As in the case of the City Hall Square the state of the area at 15:00 is the same as the state of the area at noon with some minor changes (Figure 19). The odd distribution is present at this hour too. As explained above, it could be due to the lateral boundary conditions that were used. However the air temperatures do have small differences. The lowest temperature at this hour is 35.3 C unlike the air temperature of 33.8 C at noon. On the other hand though the highest temperature at this hour is lower than that at noon and is equal to 41.8 C. The step size of the temperatures in the map is Air temperatures at old tobacco warehouses at 18:00 Air temperatures start to decrease at his time as well as the range of the temperatures (Figure 20). The minimum temperature noticed at this time is 32 C and the maximum is equal to 35 C and the step size is only 0.3. It is worth pointing out that the air temperatures of the concrete paved bases and the asphalt court are the same at this time of the day and are the highest in the area. However lower air temperatures are still observed at the gravel laid field. The lowest temperatures are noticed at the top right corner of the map, were the surface material is sand and a number of trees are present. Air temperatures at old tobacco warehouses at 21:00 At 21:00 all areas paved with artificial materials have higher air temperatures than those with natural materials (Figure 21). Even the gravel laid field has the same temperature as the concrete bases and the asphalt court. Nevertheless the temperature differences are small. The air temperatures range from 28.9 C to 31 C and the step size of the map is But it must not be ignored that air temperatures at a height of 1.60 meters are being analysed and even a difference of 0.2 C is noteworthy. Observations The same pattern regarding the step sizes is observed here as in the case of the City Hall Square. The air temperature differences between the highest and lowest temperature at a specific time reduces as the day passes. The highest 75
92 value is noticed at noon, followed by the difference noticed at 15:00. The step size at noon is equal to 0.89 and 0.65 at 15:00. After that it reduces down to 0.21 at 21:00. During the hottest hours of the day, namely noon and 15:00, the difference in air temperatures between the hottest and the coolest areas of the site are between 6.5 C and 8.1 C, significantly high values considering that air temperatures are compared at a 1.60 meter height. The results presented for the two hours, noon and 15:00, seem to be odd. The bottom part of the map, were the surface material is sand, seems to be warmer than the rest of the area which is not realistic. These unexplained results however could be a problem caused by some setting in the program. It could be an outcome of the lateral boundary conditions that are used. 76


93 Figure 17: Air temperature at 1.60 meters at Old Tobacco Warehouses at 09:00 Figure 18: Air temperature at 1.60 meters at Old Tobacco Warehouses at 12:00 77


94 Figure 19: Air temperature at 1.60 meters at Old Tobacco Warehouses at 15:00 Figure 20: Air temperature at 1.60 meters at Old Tobacco Warehouses at 18:00 78

95 Figure 21: Air temperature at 1.60 meters at Old Tobacco Warehouses at 21:00 79
96 6.2 Thermal comfort simulation It was selected to evaluate the thermal comfort of both areas at 19:00 since the questionnaires were conducted in that time frame. For the evaluation the ENVImet simulation model will be used and thus the PMV model. The PMV as mentioned in chapter 2 was defined by Fanger in This index evaluates thermal comfort on a nine point thermal scale. The model used in ENVI-met however is adapted to outdoor conditions, a model made by Jendritzky. In this model a different scale is used. In [57] the scale is presented along with the calibration of the scale and sensation. The figures are presented in the following table (Table 11). Table 11: Jendritzky outdoor PMV model PMV Sensation Calibration > 2.5 Very hot > 3,3 1.5 ~ 2.5 Hot 1,3 ~ 3,3 0.5 ~ 1.5 Warm 0,6 ~ 1,3-0.5 ~ 0.5 Comfortable -0,9 ~ 0,6-1.5 ~ -0.5 Cool -1,5 ~ -0,9-2.5 ~ -1.5 Cold -3,5 ~ -1,5 < -2.5 Very cold <-3, City Hall Square Notes The first five and last five grids on both the x and y axis should not be taken into account since they are not part of the model area as mentioned before. The PMV values range from 0.46 to According to table 11 (Table 11), these values correspond to a sensation ranging from comfortable to hot even when taking the calibrated values into account. However most of the area has PMV values are between 1.57 and 2.13 with the majority of the square having poor comfort conditions. The thermal sensation in the area could be characterized as 80

97 hot. The lowest values are observed in front of the City Hall, specifically on the stairs and green patches that exist there. After this value the coolest values are noticed at the water feature and the green area surrounding it followed by the second green area of the site. Unfortunately though the areas that offer thermal comfort to the urban dwellers are very limited and could be characterized as nonexistent. These details can be seen in the following map (Figure 22). Figure 22: PMV values at 1.60 meters at City Hall Square at 19:00 on the 21/07/ Old Tobacco Warehouses Notes The bottom left corner grids in the map with no vegetations or trees should not be taken into account since it is not part of the model area. The PMV value range for the second site on the second day is 0.97 to According to table 11 (Table 11), these values correspond to the sensation of 81

98 warm to hot. When taking the calibrated values into account they correspond to the same sensation. The best thermal comfort sensation is noticed in the areas with natural surface materials. The asphalt court had the worst thermal comfort of the whole area followed by the other artificial surface materials in the area. The differences however are significant since there is a difference in the sensation. The best thermal comfort area is the top right area of the map. These details can be seen in the following map (Figure 23). Figure 23: PMV values at 1.60 meters at Old Tobacco Warehouses at 19:00 on the 21/07/
99 7 Discussion In this chapter the sensitivity analysis that has been conducted for the City Hall Square will be presented. This analysis is divided into two parts. In the first part the influence of the surface materials on the microclimate and thermal comfort conditions are examined. The materials of the area will be changed in the simulation model and the simulation will be analysed again in order to see what influence these changes have. In the second part the green areas will be increased in order to evaluate the influence it will have on the surrounding area. Finally improvement measures of the prevailing conditions will be proposed. 7.1 Sensitivity Analysis of parameters influencing comfort conditions Scenario 1 Cool coating With the use of the ENVI-met microclimatic model the materials of the City Hall Square were analysed regarding the impact they have on the surface temperature and the thermal comfort conditions. A simulation model was analysed after the surface material, namely the concrete tiles, was altered. It was assumed that the concrete paved area would be coated by a cool coating. It was assumed that this coating would be of the same colour as the tiles, light grey. The albedo value of a cool coating of that colour is equal to 0.74 and the emissivity is equal to 0.85 according to [58]. The data used in the configuration file of this simulation model was the same as in the study of the prevailing conditions. The area after the improvement measure is compared to the prevailing conditions at the two warmest hours of the day, 12:00 and 15:00. The temperatures in the centre of the square at these hours with the prevailing conditions and the temperatures at the same spot after the implementation of the improvement measure are compared. The figures are presented in table 12 (Table 12) and the result maps can be seen in figures 24 and 25 (Figure 24, Figure 25). 83
100 Table 12: Comparative analysis of air temperatures Scenario 1 Time Average temperature prevailing conditions Average temperature after cool coating Difference in average temperature 12: C C 1.13 C 15: C C 0.80 C From the maps it is observed that the distribution of the temperatures in the area is the same as in the prevailing conditions. From the figures in the table 12 (Table 12) it is noticed that at noon there is a decrease in the temperature equal to 3% and at 15:00 a 2.1% reduction in the temperature of the specific spot. Taking into account that this measure is implemented at the surface level, since there is a change in the surface material properties, and the temperatures studied are at a height of 1.60 meters these reductions are significant. 84


101 Figure 24: Air temperature at 1.60 meters at City Hall Square at 12:00 - Scenario 1 Figure 25: Air temperature at 1.60 meters at City Hall Square at 15:00 - Scenario 1 85
102 7.1.2 Scenario 2 - Urban green It is evident that the old tobacco warehouses site, which had vegetation as a surface material had better thermal comfort conditions than the City Hall Square. Thus in the second scenario we assume that half of the City Hall Square is covered in grass. The grass was not put in one area but was distributed in front of the City Hall in 100 square meter blocks (10x10). The rest of the data used in the configuration file of this simulation model was the same as in the prevailing conditions study. The area after the improvement measure is compared to the prevailing conditions at the two warmest hours of the day, 12:00 and 15:00. The temperatures in the centre of the square with the prevailing conditions and the temperatures at the same spot after the implementation of the improvement measure are compared. The figures are presented in table 13 (Table 13) and the result maps can be seen in figures 26 and 27 (Figure 26, Figure 27). Table 13: Comparative analysis of air temperatures Scenario 2 Time Average temperature prevailing conditions Average temperature with increased green Difference in average temperature 12: C C 0.86 C 15: C C 0.09 C It is observed that at 15:00 the differences between the temperatures are very small. However at noon the temperature difference at the same spot of the square is significant. It must be noted that the temperatures studied are at a height of 1.60 meters and the implementation of this measure takes place at the surface level since the properties of the surface materials are altered. Thus the difference of 2.3 % is noteworthy. It is also worth noticing that the distribution of the temperatures in the area is not different than in the prevailing conditions although it is expected to be. The grass should have an impact on the temperature distribution in the area, at least in the close surrounding areas such as the passages between the grass blocks. Yet such an influence is not noticed. This scenario is less promising than scenario 1. 86

103 Figure 26: Air temperature at 1.60 meters at City Hall Square at 12:00 - Scenario 2 Figure 27: Air temperature at 1.60 meters at City Hall Square at 15:00 - Scenario 2 87
104 7.1.3 Scenario 3 Cool coating and urban green Even though scenario 1 is promising on its own, it would be interesting to study a combination of the two above scenario. In scenario 3 it is assumed that half of the City Hall Square is covered in grass. The grass was not put in one area but was distributed in front of the City Hall in 100 square meter blocks (10x10) just as in scenario 2. The rest of the area is coated with a grey cool coating with an albedo value of 0.74 and the emissivity value equal to 0.85 according to [58], as in scenario 1. The rest of the data in the configuration file is the same as in the prevailing conditions study. The area after the improvement measures is compared to the prevailing conditions at the two warmest hours of the day, 12:00 and 15:00. The temperatures in the centre of the square with the prevailing conditions and the temperatures at the same spot after the implementation of the improvement measures are compared. The figures are presented in table 14 (Table 14) and the result maps can be seen in figures 28 and 29 (Figure 28, Figure 29). Table 14: Comparative analysis of air temperatures Scenario 3 Time Average temperature prevailing conditions Average temperature with increased green Difference in average temperature 12: C C 1.92 C 15: C C 0.11 C Once again the temperatures are lower. In this scenario a maximum reduction in the temperature equal to 5.1% is observed at 12:00. This indeed is a satisfying reduction. However, the distribution of the temperatures in the area is unclear. Once again it is expected that the grass would impact the distribution of the temperatures in the area. Yet once again this difference is not present. 88

105 Figure 28: Air temperature at 1.60 meters at City Hall Square at 12:00 - Scenario 3 Figure 29: Air temperature at 1.60 meters at City Hall Square at 15:00 - Scenario 3 89
Thermal comfort conditions in outdoor spaces
 International Conference Passive and Low Energy Cooling 761 Thermal comfort conditions in outdoor spaces N. Gaitani and M. Santamouris University of Athens, Department of Physics, Division of Applied Physics,
The influence of the surrounding environment on the building s energy performance
 The influence of the surrounding environment on the building s energy performance Koukia Dimitra - Noel SID: 3302110022 SCHOOL OF SCIENCE & TECHNOLOGY A thesis submitted for the degree of Master of Science
Assessment of outdoor thermal comfort and its relation to urban geometry
 Sustainable Development and Planning VI 3 Assessment of outdoor thermal comfort and its relation to urban geometry R. Cocci Grifoni 1, G. Passerini 2 & M. Pierantozzi 2 1 School of Architecture and Design,
Behaviour of People in Open Spaces in Dependence of Thermal Comfort Conditions
 Behaviour of People in Open Spaces in Dependence of Thermal Comfort Conditions Lutz Katzschner University Kassel, Environmental Meteorological Institute, Planning Department, Kassel, Germany ABSTRACT:
Cooling The Cities. High Solar Reflective Building Materials. Authors: Mr. Francesco Favaro Watergy International Group Mr Prokopis Perdikis Abolin Co
 Cooling The Cities High Solar Reflective Building Materials Authors: Mr. Francesco Favaro Watergy International Group Mr Prokopis Perdikis Abolin Co Introduction The microclimate in the cities is created
Urban greenery: increasing resilience to climate change through green roofs and urban forestry
 Urban greenery: increasing resilience to climate change through green roofs and urban forestry Author: Saiz Alcazar, Susana; Arup, Madrid, Spain Abstract: This study evaluates the impact of green roofs
URBAN HEAT ISLAND MITIGATION: LOOKING BEYOND POLICIES TO LOWER AIR TEMPERATURE
 Cities and Climate Change Conference March 5 7, 2018 Edmonton, Alberta, Canada URBAN HEAT ISLAND MITIGATION: LOOKING BEYOND POLICIES TO LOWER AIR TEMPERATURE Evyatar Erell Ben Gurion University of the
Assessment of thermal comfort near a glazed exterior wall
 Assessment of thermal comfort near a glazed exterior wall Timothy Anderson 1, Mark Luther 2 and Tim Brain 3 1 School of Engineering, Auckland University of Technology, Auckland 1142, New Zealand 2 School
GREEN AND COOL ROOFS URBAN HEAT ISLAND MITIGATION POTENTIAL IN EUROPEAN CLIMATES FOR OFFICE BUILDINGS UNDER FREE FLOATING CONDITIONS
 GREEN AND COOL ROOFS URBAN HEAT ISLAND MITIGATION POTENTIAL IN EUROPEAN CLIMATES FOR OFFICE BUILDINGS UNDER FREE FLOATING CONDITIONS Dionysia Kolokotsa 1, Mattheos Santamouris 2 1 University of Athens,
Green Space Influence on Thermal Comfort Contrasting approaches in the assessment of conditions in Bragança (Portugal)
") Green Space Influence on Thermal Comfort Contrasting approaches in the assessment of conditions in Bragança (Portugal) ARTUR GONÇALVES 1, ANTÓNIO RIBEIRO 1, LUIS NUNES 1, FILIPE MAIA 1 E MANUEL FELICIANO
Green Space Influence on Thermal Comfort Contrasting approaches in the assessment of conditions in Bragança (Portugal) ARTUR GONÇALVES 1, ANTÓNIO RIBEIRO 1, LUIS NUNES 1, FILIPE MAIA 1 E MANUEL FELICIANO
FACING HEAT WAVES IN THE URBAN MICROCLIMATE
 The case study of Psyrri area FACING HEAT WAVES IN THE URBAN MICROCLIMATE Introduction Modification by urban areas: Cooling Load : 26 C Irradiative Thermal Moisture Aerodynamic characteristics 9.64 6.58
Information paper 17. Prepared by: David Clark. book:
 Information paper 17 Thermal comfort standards Prepared by: David Clark A paper referenced in the book: Cundall Johnston & Partners LLP. 2013 Issue 1.0: 29 July 2013 This information paper is one of a
Designing for thermal comfort near a glazed exterior wall. * School of Engineering, Auckland University of Technology, Auckland, New Zealand
 Designing for thermal comfort near a glazed exterior wall T.N. Anderson ǂ *, M.B. Luther ** * School of Engineering, Auckland University of Technology, Auckland, New Zealand ** School of Architecture and
Designing outdoor spaces with COMFORT-EX
 International Workshop on Energy Performance and Environmental 1 Designing outdoor spaces with COMFORT-EX J. Ochoa and I. Marincic Department of Architecture, University of Sonora, Mexico H. Villa Department
Watts in a comfort index:
 Watts in a comfort index: Evaluating pedestrian energy exchange and thermal stress in urban environments David Pearlmutter Desert Architecture & Urban Planning Bona Terra Department of Man in the Desert
Assessing the representativeness of thermal comfort in outdoor spaces
 The Sustainable City VII, Vol. 2 835 Assessing the representativeness of thermal comfort in outdoor spaces R. Cocci Grifoni 1, M. Pierantozzi 2, S. Tascini 1 & G. Passerini 2 1 School of Architecture and
THERMAL COMFORT OF A COURTYARD IN GUANGZHOU IN SUMMER
 THERMAL COMFORT OF A COURTYARD IN GUANGZHOU IN SUMMER L Jin 1,*, QL Meng 1 and LH Zhao 1 1 Building Environment Energy Laboratory, South China University of Technology, Guangzhou 510640, China Engineering
THE USE OF THE CORRECTED EFFECTIVE TEMPERATURE INDEX
 AN ASSIGNMENT ON THE USE OF THE CORRECTED EFFECTIVE TEMPERATURE INDEX BY OMOBUDE IGHODALO FELIX. ARC/05/5640. COURSE CODE: ARC. 810. COURSE TITLE: BUILDING CLIMATOLOGY. COURSE LECTURER: PROF. O. OGUNSOTE.
Work environment. Microclimate - definition. Main microclimate elements. Core temperature. Microclimate
 Microclimate - definition Work environment Microclimate A local atmospheric zone where the climate differs from the surrounding area A small-scale site of special conditions within a larger climate Can
Workshop: Architecture-Tradition and Modernization. Climate Responsive Urban Design
 Workshop: Architecture-Tradition and Modernization Climate Responsive Urban Design Trends of none sustainable planning Planners of the twentieth Century seem to have assumed that urban settlements were
Microclimate improvement through redesign of open urban areas with bioclimatic criteria in a city centre
 Microclimate improvement through redesign of open urban areas with bioclimatic criteria in a city centre Dimoudi A. 1, *, Zoras St. 1, Tamiolaki A-M. 2 Dimoudi S. 2, Liveris P. 3, Pallas Chr. 4, Stathis
Research on the Urban Heat Island (UHI) Effect: Current Status and Future Development
 Effect: Current Status and Future Development") Technical Report Research on the Urban Heat Island (UHI) Effect: Current Status and Future Development Hideki Takebayashi Architecture Department, Graduate School of Engineering, Kobe University Abstract
Technical Report Research on the Urban Heat Island (UHI) Effect: Current Status and Future Development Hideki Takebayashi Architecture Department, Graduate School of Engineering, Kobe University Abstract
Using passive solutions to improve thermal summer comfort in timber framed houses in South-west France
 Using passive solutions to improve thermal summer comfort in timber framed houses in South-west France Sylvain Boulet 1, Stéphanie Armand-Decker 2, FCBA Technological Institute I2M-TREFLE laboratory -
Greening the desert city: The challenge of microclimatic moderation in arid urban areas
 Greening the desert city: The challenge of microclimatic moderation in arid urban areas David Pearlmutter Blaustein Institutes for Desert Research Ben-Gurion University of the Negev, Israel Green Infrastructures
SOLAR PASSIVE DESIGN: PRINCIPLES AND PRACTICE
 SOLAR PASSIVE DESIGN: PRINCIPLES AND PRACTICE Understanding Climate and Atmosphere Human impact on global weather Energy outlook in India Energy needs in buildings Comfort zone Solar passive design- Case
Climate regulating ecosystem services: Introduction to urban microclimates
 Climate regulating ecosystem services: Introduction to urban microclimates Dr Gina Cavan April 2012 gina.cavan@manchester.ac.uk Outline Climate regulating ecosystem services Fundamentals of urban climatology
Assessing The Microclimate of Green and Less-Green Tropical Landscape Environment
 Assessing The Microclimate of Green and Less-Green Tropical Landscape Environment Aniza Abu Bakar and Nurhayati Abdul Malek Department of Landscape Architecture, KAED International Islamic University Malaysia
Designing Air-Distribution Systems To Maximize Comfort
 Designing Air-Distribution Systems To Maximize Comfort By David A. John, P.E., Member ASHRAE An air-distribution system that provides occupant thermal comfort can be a complicated system to predict and
Hui Li, Ph.D., P.E. Yuan He, Ph.D. John Harvey, Ph.D., P.E.
 TRB 95 th Annual Meeting. Jan 10 th 14 th, 2016 Lectern Session 756: Research Progress on Cool Pavement Strategies Hui Li, Ph.D., P.E. Yuan He, Ph.D. John Harvey, Ph.D., P.E. UC Pavement Research Center
URBAN HEAT ISLANDS. GEOG/ENST 3331 Lecture 17 Ahrens: Chapter 18; A&B: Chapter 14
 URBAN HEAT ISLANDS GEOG/ENST 3331 Lecture 17 Ahrens: Chapter 18; A&B: Chapter 14 Assignment 7 Describe three environmental hazards are presented by Arctic Haze. Global (1.1 C)and regional warming (2 to
Urban Changes & Climate
 Urban Changes & Climate 18-1 Urbanization Effects Mitigation Strategies Science Concepts Surface Types Surface Energy Budget - Cities Ozone - Temperature Relationship 18-2 How has urban growth changed
Green Façades for Urban Comfort Improvement Implementation in a extreme Continental Mediterranean climate
 Green Façades for Urban Comfort Improvement Implementation in a extreme Continental Mediterranean climate F. OLIVIERI 1, P.VIDAL 1, R. GUERRA 1, M.CHANAMPA 1, J. GARCÍA, C. BEDOYA 1 DCTA. Technical University
Activity report Simulation survey (Villaggio Artigiano)
") Activity report Simulation survey (Villaggio Artigiano) Component: 5 - Pilot testing of the methodology, evaluation and capitalization Corresponding phase: 5.3 Computer simulations and analysis of questionnaires
Activity report Simulation survey (Villaggio Artigiano) Component: 5 - Pilot testing of the methodology, evaluation and capitalization Corresponding phase: 5.3 Computer simulations and analysis of questionnaires
The Impact of Urban Texture in Outdoor Thermal Comfort
 The Impact of Urban Texture in Outdoor Thermal Comfort Ani Tola Panariti 1*, Andrea Maliqari 2, Parashqevi Tashi 3 1 Faculty of Architecture and Urban Design, Polytechnic University of Tirana, Rruga Muhamet
Thermal Comfort in Architecture
 Thermal Comfort in Architecture Ommid Saberi [1], Parisa Saneei [2] Amir Javanbakht [3] 1. Ph.D. Student (Architecture & Energy) in Shahid Beheshti Uni. Tehran Iran e: omid_saberi@yahoo.com 2. Architect
Renewable and Sustainable Energy Reviews
 Renewable and Sustainable Energy Reviews 26 (2013) 224 240 Contents lists available at SciVerse ScienceDirect Renewable and Sustainable Energy Reviews journal homepage: www.elsevier.com/locate/rser Using
REAL-TIME CONTROL OF OCCUPANTS THERMAL COMFORT IN BUILDINGS. Galway, Ireland
 REAL-TIME CONTROL OF OCCUPANTS THERMAL COMFORT IN BUILDINGS Magdalena Hajdukiewicz 1,2,3, Padraig O Connor 1, Colin O Neill 1, Daniel Coakley 1,2,3, Marcus M. Keane 1,2,3, Eoghan Clifford 1,2,3 1 Department
Chapter 4: The Global Energy System
 Discovering Physical Geography Third Edition by Alan Arbogast Chapter 4: The Global Energy System The Electromagnetic Spectrum and Solar Energy Solar Energy as Radiation Electromagnetic energy transmitted
THE SUCCESS of an urban open
 Human Thermal Comfort in Urban Outdoor Spaces by LEE P. HERRINGTON and J. S. VITTUM, professor of meteorology and graduate research assistant, State University of New York College of Environmental Science
The urban heat island in Melbourne: drivers, spatial and temporal variability, and the vital role of stormwater
 The urban heat island in Melbourne: drivers, spatial and temporal variability, and the vital role of stormwater A. M. Coutts 1, J. Beringer 2, S. Jimi 2 and N. J. Tapper 2 1 Sustainable Water, Recycling
Optimizing Indoor Environments for Occupant Satisfaction. Presented by: Kelli Goldstone April 2016
 Optimizing Indoor Environments for Occupant Satisfaction Presented by: Kelli Goldstone April 2016 Outline Function of HVAC Thermal Comfort Air Distribution Radiant Heating / Cooling Case Study Function
Thermal comfort under transient seasonal conditions of a bioclimatic building in Greece
 54 2nd PALENC Conference and 28th AIVC Conference on Building Low Energy Cooling and Thermal comfort under transient seasonal conditions of a bioclimatic building in Greece A. Androutsopoulos Centre for
A Field Study of Thermal Comfort in Open-plan Office Buildings during Transition Seasons in Harbin. Yunsong Han 1, 2, Huixuan Sun 1, 2, Cheng Sun 1, 2
 A Field Study of Thermal Comfort in Open-plan Office Buildings during Transition Seasons in Harbin Yunsong Han 1, 2, Huixuan Sun 1, 2, Cheng Sun 1, 2 1 School of Architecture, Harbin Institute of Technology,
OUTDOOR DESIGN CRITERIA: For the Central Phoenix/East Valley Light Rail Transit System
 OUTDOOR DESIGN CRITERIA: For the Central Phoenix/East Valley Light Rail Transit System Harvey Bryan, Ph.D. School of Architecture Arizona State University P.O. Box 871605 Tempe, AZ. 85287-1605 harvey.bryan@asu.edu
For Quiz 3 and Final Exam
 For Quiz 3 and Final Exam Final Exam Times: Section 001(10:10am) Monday May 8 th 10:15am 12:15pm Section 002 (11:15am) Wednesday May 10 th 10:15am 12:15pm Urban Heat Islands (UHI) An Urban Heat Island
Simultaneous integration of urban heat island mitigation technologies in the existing urban fabric in Athens, Greece
 See discussions, stats, and author profiles for this publication at: https://www.researchgate.net/publication/258093327 Simultaneous integration of urban heat island mitigation technologies in the existing
Evaluation methods for indoor environmental quality assessment according to EN15251
 Summary of this article was published in the REHVA European HVAC Journal Vol 49, Issue 4 (August), 2012, pages 14-19, available at http://www.rehva.eu/en/rehva-european-hvac-journal. Evaluation methods
Urban Environmental Risks
 Urban Environmental Risks Increasing Energy Use Urban Energy Consumption varies by Economic Sector In the global economy, economic activities are separated into four distinct categories: Primary Sector:
The Use of Reflective and Permeable Pavements as a Potential Practice for Heat Island Mitigation and Stormwater Management
 The Use of Reflective and Permeable Pavements as a Potential Practice for Heat Island Mitigation and Stormwater Management H. Li 1*, J. T. Harvey 2, T. J. Holland 3 and M. Kayhanian 4 1, 2 University of
Available online at ScienceDirect. Procedia Engineering 169 (2016 )
") Available online at www.sciencedirect.com ScienceDirect Procedia Engineering 169 (2016 ) 158 165 4th International Conference on Countermeasures to Urban Heat Island (UHI) 2016 Indoor Thermal Comfort Assessment
Available online at www.sciencedirect.com ScienceDirect Procedia Engineering 169 (2016 ) 158 165 4th International Conference on Countermeasures to Urban Heat Island (UHI) 2016 Indoor Thermal Comfort Assessment
What is Sustainable Design?
 What is Sustainable Design? Part Three: The Basic Principles of Passive Design Terri Meyer Boake BES, BArch, MArch, LEED AP Associate Director School of Architecture University of Waterloo Past President
Validation of ENVI-met PMV values by in-situ measurements
 Validation of ENVI-met values by in-situ measurements Dain Jeong 1, Kyunghun Park 2*, Bonggeun Song 3, Gyeongah Kim 4, Chulhyun Choi 5, Byunghyun Moon 6 Dain, Jeong 1 Department of Environmental Engineering
681: Environmentally Responsive Architecture; Passive Design for School in Southern India
 681: Environmentally Responsive Architecture; Passive Design for School in Southern India Varun Kohli* Architectural Association School of Architecture, London, UK * varun.kohli@som.com Abstract This paper
THE EFFECTS OF INDOOR ENVIRONMENT IN SUPERMARKET ON CLIENTS' AND OPERATORS' SATISFACTION
 THE EFFECTS OF INDOOR ENVIRONMENT IN SUPERMARKET ON CLIENTS' AND OPERATORS' SATISFACTION Wei l. Gu 1,2, Han Q. Wang 3, and Guang X. Kou 3 1 School of energy and power engineering, Central South University,
Effects of tall building envelope technologies and design strategies on the urban microclimate in hot arid regions
 Effects of tall building envelope technologies and design strategies on the urban microclimate in hot arid regions Sameh Monna¹ T2 Mitigation Strategies and Techniques ABSTRACT The effects of tall building
The Effect of Photosynthesis on Heat Island Production (A Case Study of Orji, Imo State Nigeria)
") The Effect of Photosynthesis on Heat Island Production (A Case Study of Orji, Imo State Nigeria) Ngozi B. Ewurum 1 & Ikechukwu E. Nwosu 2 1 Ngozi B. Ewurum & 2 Ikechukwu E. Nwosu 1,2 Department of Physics,
The Effect of Photosynthesis on Heat Island Production (A Case Study of Orji, Imo State Nigeria) Ngozi B. Ewurum 1 & Ikechukwu E. Nwosu 2 1 Ngozi B. Ewurum & 2 Ikechukwu E. Nwosu 1,2 Department of Physics,
Assessment possibilities of thermal comfort by micro scale models
 COMECAP 2014 e-book of proceedings vol. 2 Page 203 Assessment possibilities of thermal comfort by micro scale models Matzarakis A. The quantification of thermal bioclimate assessment is based on the human
Suitable for grades 3-5. atmospheric composition. solar radiation. climate variability and change. volcanoes. clouds. carbon cycle.
 Color and Understand the Global Climate System atmospheric composition solar radiation climate variability and change H 2 0, CO 2, CH 4, N 2 O, O 3, etc. aerosols volcanoes clouds atmosphere-ice interaction
Urban Climate. Prof. Dr. Lutz Katzschner Environmental Meteorology Department Faculty of Architecture and Planning University Kassel / Germany
 Urban Climate Prof. Dr. Lutz Katzschner Environmental Meteorology Department Faculty of Architecture and Planning University Kassel / Germany Urban Climatology and Global Climate Change - air pollution
Factors affecting evaporation 3/16/2010. GG22A: GEOSPHERE & HYDROSPHERE Hydrology. Several factors affect the rate of evaporation from surfaces:
 GG22A: GEOSPHERE & HYDROSPHERE Hydrology Some definitions Evaporation conversion of a liquid to a vapour Transpiration that part of evaporation which enters the atmosphere through plants Total Evaporation
Thermal Comfort Zone for Thai People
 Engineering, 013, 5, 55-59 http://dx.doi.org/10.436/eng.013.5506 Published Online May 013 (http://www.scirp.org/journal/eng) Thermal Comfort Zone for Thai People Juntakan Taweekun *, Ar-U-Wat Tantiwichien
Thermal Environment evaluation in commercial kitchens
 Downloaded from orbit.dtu.dk on: Nov 11, 2018 Thermal Environment evaluation in commercial kitchens Simone, Angela; Olesen, Bjarne W. Publication date: 2013 Link back to DTU Orbit Citation (APA): Simone,
The Greenhouse Effect
 Name: Date: The Greenhouse Effect This document provides an overview of the earth's atmospheric "greenhouse effect" by briefly exploring the atmospheres of nearby planets and discussing our atmosphere's
Thermal environment and thermal comfort in a passive residential building in the severe cold area of China
 Thermal environment and thermal comfort in a passive residential Yuchen Ji Ph D. Candidate Harbin Institute of Technology China 15B927029@hit.edu.cn Professor, Zhaojun Wang, Harbin Institute of Technology,
Prediction of outdoor human thermal states in non-uniform thermal loads
 http://www.***.net ICUC9@Toulouse BPH5 Human perception and new indicator, 23rd July Prediction of outdoor human thermal states in non-uniform thermal loads Yasuhiro SHIMAZAKI a,atsumasa YOSHIDA b, Takanori
Inadvertent climate changes encouraged by urbanization, are characterized by the concept of"urban heat island" (UHI).
.") Conclusion With the globalization, Architects lost their relationship with the environment, and the resulting built environment which was non responsive to the environment needed. This was resulting High
Conclusion With the globalization, Architects lost their relationship with the environment, and the resulting built environment which was non responsive to the environment needed. This was resulting High
Training on Energy Efficiency in Buildings of stakeholders in urban planning, construction and building
 Training on Energy Efficiency in Buildings of stakeholders in urban planning, construction and building Organised by ECREEE PRAIA, CABO VERDE, 9th-10th June 2014 SUSANNE GEISSLER _ CÉSAR FREITAS Elements
Lesson 29 Inside And Outside Design Conditions. Version 1 ME, IIT Kharagpur 1
 Lesson 29 Inside And Outside Design Conditions Version 1 ME, IIT Kharagpur 1 The specific objectives of this lecture are to: 1. Describe a typical air conditioning system and discuss the need for fixing
Invisible Structures Products vs. Heat Island Impacts
 Invisible Structures Products vs. Heat Island Impacts Invisible White Paper The following paragraphs (dark red color type) originate at the Web address: http://eande.lbl.gov/heatisland/, and offer a quick
Causes of Urban Heat Island in Singapore: An investigation using computational fluid dynamics (CFD)
") Causes of Urban Heat Island in Singapore: An investigation using computational fluid dynamics (CFD) RAJAGOPALAN PRIYADARSINI 1, WONG NYUK HIEN 2 1 School of Architecture & Building, Deakin University,
Causes of Urban Heat Island in Singapore: An investigation using computational fluid dynamics (CFD) RAJAGOPALAN PRIYADARSINI 1, WONG NYUK HIEN 2 1 School of Architecture & Building, Deakin University,
Findings of Field Survey for Thermal Comfort and Ventilation in US Office Buildings
 Findings of Field Survey for Thermal Comfort and Ventilation in US Office Buildings Liangcai Tan 1, Samir Moujaes, HDR Inc. University of Nevada Las Vegas SUMMARY This paper presents the measured data
COPYRIGHTED MATERIAL. Contents Overview WHAT'S IN THE SWL PRINTED WHAT'S IN THE SWL ELECTRONIC I NAVIGATION 20 VIII DETAILED DESIGN STRATEGIES E.
 WHAT'S IN THE SWL PRINTED I NAVIGATION 20 SWL Printed Contents SWL Electronic Contents Additional Navigation Methods II USING SUN, WIND & LIGHT 50 Buildings and Energy Use Design Decision Chart for Net-Zero
An Assessment of Thermal Comfort in Hot and Dry Season (A Case Study of 4 Theaters at Bayero University Kano)
") International Journal of Multidisciplinary and Current Research Research Article ISSN: - Available at: http://ijmcr.com An Assessment of Thermal Comfort in Hot and Dry Season (A Case Study of Theaters
International Journal of Multidisciplinary and Current Research Research Article ISSN: - Available at: http://ijmcr.com An Assessment of Thermal Comfort in Hot and Dry Season (A Case Study of Theaters
10 tips from your Architect
 10 tips from your Architect Within the context of the national week of Energy Efficiency, in collaboration with the Energy Efficiency Management Office, the Mauritius Association of Architects offers you
Heat mitigation through landscape and urban design
 Heat mitigation through landscape and urban design Using observations and microclimate modeling to find the best strategy SCN Green Infrastructure (GI) Workgroup Meeting April 1, 2014 Ariane Middel, PhD
Course Specification. Level Foundation Intermediate Advanced Pre-requisites. Corleto. Approval Date June 2017 Review Date March 2019
 Course Specification Course Title Thermal Environment Code W502 Level Foundation Intermediate Advanced Pre-requisites None Course Material Coordinating Editor Course manual available from OH learning.com
SKYLIGHT DESIGN PERFORMANCE EVALUATION METHOD DEVELOPMENT WITH THERMAL AND DAYLIGHT SIMULATION
 SKYLIGHT DESIGN PERFORMANCE EVALUATION METHOD DEVELOPMENT WITH THERMAL AND DAYLIGHT SIMULATION Xianou Li, Frederick Wong, and Yihan Li Arup International Consultants (Shanghai) Co Ltd ABSTRACT This paper
Cool spots in hot climates: a means to achieve pedestrian comfort in hot climates
 Cool spots in hot climates: a means to achieve pedestrian comfort in hot climates Priji Balakrishnan, MArch Architectural Association School of Architecture, London prijibalakrishnan@gmail.com ABSTRACT
Adaptive Thermal Comfort in Warm Dry Climate: Economical dwellings in Mexico
 Adaptive Thermal Comfort in Warm Dry Climate: Economical dwellings in Mexico MARINCIC, I. 1 ; OCHOA, J. M. 1 ; ALPUCHE, M.G. 1 AND GÓMEZ-AZPEITIA, G. 2 1 Dpt. Architecture, University of Sonora, Hermosillo,
A Solar Wall System Utilized in Rural Houses of Northeast China
 A Solar Wall System Utilized in Rural Houses of Northeast China Tiantian Zhang and Yufei Tan in rural buildings, for instance, only 16.4% of the investigated houses employ solar energy to produce hot water
Macro and Micro Climate Climate
 The following text is taken from University of Strathclyde's Energy Systems Research Unit ESRU's web site (file type '16-Climate.pdf') Macro and Micro Climate Climate The climate of the earth consists
A Method for Driving the Solar Control Mechanism Selection
 A Method for Driving the Solar Control Mechanism Selection Christopher Nilsson & Vitaliya Mokhava Master thesis in Energy-efficient and Environmental Buildings Faculty of Engineering Lund University Lund
Numerical Investigation on Ventilation Strategy for Laboratories: A Novel Approach to Control Thermal Comfort Using Cooling Panels
 Numerical Investigation on Ventilation Strategy for Laboratories: A Novel Approach to Control Thermal Comfort Using Cooling Panels Farhad Memarzadeh 1, Andy Manning 2 and Zheng Jiang 2 1 National Institutes
Analysis of Night Ventilation Potential for Residential Buildings in Hot-Humid Climate of Malaysia
 PLEA2009 - th Conference on Passive and Low Energy Architecture, Quebec City, Canada, 22- June 2009 Analysis of Ventilation Potential for Residential Buildings in Hot-Humid Climate of Malaysia DORIS TOE
CLIMATE CONTROL: INTENT/CRITERIA
 CLIMATE CONTROL: INTENT/CRITERIA This lecture is a review/restatement of information from ARCH 273. Thermal comfort and indoor air quality (coming up) are critical foundations for HVAC system design. Ball
FULL YEAR PERFORMANCE SIMULATION OF A DIRECT-COOLED THERMAL STORAGE ROOF (DCTSR) IN THE MIDWEST
 IN THE MIDWEST") FULL YEAR PERFORMANCE SIMULATION OF A DIRECT-COOLED THERMAL STORAGE ROOF (DCTSR) IN THE MIDWEST Richard C. Bourne Davis Energy Group, Inc. 123 C Street Davis, CA 95616 and Dr. Bing Chen Passive Solar Research
FULL YEAR PERFORMANCE SIMULATION OF A DIRECT-COOLED THERMAL STORAGE ROOF (DCTSR) IN THE MIDWEST Richard C. Bourne Davis Energy Group, Inc. 123 C Street Davis, CA 95616 and Dr. Bing Chen Passive Solar Research
Short-term acclimatization effects in an outdoor comfort study
 Short-term acclimatization effects in an outdoor comfort study EL Krüger, CA Tamura, M Schweiker, A Wagner, P Bröde Universidade Tecnológica Federal do Paraná, Curitiba, Brazil, ekruger@utfpr.edu.br Karlsruhe
NUMERICAL SIMULATION OF CAR COCKPIT HEATING DURING WINTER 1
 UNIVERSITY OF PITESTI SCIENTIFIC BULLETIN FACULTY OF MECHANICS AND TECHNOLOGY AUTOMOTIVE series, year XVI, no.20 ( 1 ) NUMERICAL SIMULATION OF CAR COCKPIT HEATING DURING WINTER 1 Cătălin NEACŞU 1, Mariana
An Employee Thermal Comfort Model for Semiconductor Manufacturing
 An Employee Thermal Comfort Model for Semiconductor Manufacturing Author Information Robbie Walls Corporate Ergonomist Intel Corporation MS CH10-22 5000 W. Chandler Blvd. Chandler, AZ 85226 Phone: (480)
Mitigating and adapting thermal stress with urban green - Quantification with measurements and micro scale models. Andreas Matzarakis
 Mitigating and adapting thermal stress with urban green - Quantification with measurements and micro scale models Andreas Matzarakis Outline Assessment of climate and climate Change: air temperature, Thermal
THE EFFECTS OF URBAN HEAT ISLAND MITIGATION STRATEGIES ON THE OUTDOOR THERMAL ENVIRONMENT IN CENTRAL TOKYO A NUMERICAL SIMULATION
 The Seventh Asia-Pacific Conference on Wind Engineering, November 8-12, 2009, Taipei, Taiwan THE EFFECTS OF URBAN HEAT ISLAND MITIGATION STRATEGIES ON THE OUTDOOR THERMAL ENVIRONMENT IN CENTRAL TOKYO A
Thermal comfort evaluation of natural ventilation mode: case study of a high-rise residential building
 J. Zuo, L. Daniel, V. Soebarto (eds.), Fifty years later: Revisiting the role of architectural science in design and practice: 50 th International Conference of the Architectural Science Association 2016,
Climate Change and the Campus. Contents. Welcome. iii. Introduction: A Word about Scientific Knowledge. Section 1: What Is Climate Change?
 Climate Change and the Campus Contents iii v 1 5 17 29 Welcome Introduction: A Word about Scientific Knowledge Section 1: What Is Climate Change? Section 2: The Consequences of Climate Change Section 3:
Outdoor Thermal Comfort in the Hot Arid Climate The effect of socio-economic background and cultural differences
 Outdoor Thermal Comfort in the Hot Arid Climate The effect of socio-economic background and cultural differences FAISAL ALJAWABRA 1, MARIALENA NIKOLOPOULOU 1 Research Unit for the Engineering and Design
L 18 Thermodynamics [3] Thermodynamics- review. electromagnetic spectrum. radiation. What produces thermal radiation?
![L 18 Thermodynamics [3] Thermodynamics- review. electromagnetic spectrum. radiation. What produces thermal radiation?](/thumbs/87/96937790.jpg "L 18 Thermodynamics [3] Thermodynamics- review. electromagnetic spectrum. radiation. What produces thermal radiation?") L 18 Thermodynamics [3] Heat transfer processes convection conduction Physics of the atmosphere the ozone layer Greenhouse effect climate change Thermodynamics- review Thermodynamics is the science dealing
L 18 Thermodynamics [3] Heat transfer processes convection conduction Physics of the atmosphere the ozone layer Greenhouse effect climate change Thermodynamics- review Thermodynamics is the science dealing
CLIMATE CONTROL: OPR
 CLIMATE CONTROL: OPR A review/restatement of information from ARCH 273. Thermal comfort and indoor air quality (coming up) are critical foundations for active climate control (HVAC system) design. OPR
Outdoor Comfort: the ENVI-BUG tool to evaluate PMV values point by point
 Outdoor Comfort: the ENVI-BUG tool to evaluate PMV values point by point Kristian Fabbri Department of Architecture University of Bologna (Italy) Antonello Di Nunzio School of Architecture University of
Modelling the thermal bioclimate in urban areas with the RayMan Model
 Modelling the thermal bioclimate in urban areas with the RayMan Model Andreas Matzarakis 1, Frank Rutz 2 and Helmut Mayer 1 1 Meteorological Institute, University of Freiburg, 79085 Freiburg, Germany 2
Effect of High-albedo Materials on Pedestrian Thermal Sensation in Urban Street Canyons in Hot Climates
 Effect of High-albedo Materials on Pedestrian Thermal Sensation in Urban Street Canyons in Hot Climates EVYATAR ERELL, Ben-Gurion University of the Negev, Sde Boqer Campus, Israel, erell@bgu.ac.il DANIEL
Local Climate Change and Urban Mitigation Techniques to Counterbalance it. Mat Santamouris
 1 Local Climate Change and Urban Mitigation Techniques to Counterbalance it Mat Santamouris THE EVIDENCE OF GLOBAL AND LOCAL CLIMATE CHANGE 2 Ambient Temperatures have increased The frequency of heat waves