Runoff and soil loss. (Quantification and modeling of watershed discharge and sediment yield) Kassa Tadele (Dr.Ing) Arba Minch University
|
|
|
- Iris Dean
- 6 years ago
- Views:
Transcription
 Kassa Tadele (Dr.")
1 Runoff and soil loss (Quantification and modeling of watershed discharge and sediment yield) Kassa Tadele (Dr.Ing) Arba Minch University
2 Part I. Runoff Contents 1. Fundamental Concepts 2. Generation of runoff 3. Factors Affecting runoff 4. Methods predicting watershed runoff 5. Hydrological Models Part 2: Soil loss 6. Soil erosion process 7. Impacts of soil erosion/ downstream sedimentation 8. (Revised) Universal Soil Loss Equation
3 Learning outcomes Students are expected Understand response mechanisms and components of watershed runoff Capable of computing runoff from watersheds using an appropriate methods Equipped with the skill of using hydrologic models to predict watershed runoff Understand erosion processes and compute soil loss from watersheds
4 Questions For process research, the following questions has to be clear: How can we isolate different runoff response mechanisms? What are the key state variables controlling runoff generation? What do we want to know? Volumes of storm runoff Entire storm hydrographs Deterministic prediction of peak rates of runoff from small watersheds Probabilistic prediction of peak flows (from any size of watershed) Continuous simulation of streamflow (storm and dryweather flow)
5 1. Fundamental concepts DRIVER area topography soils vegetation land use etc. SYSTEM REPRESENTATION RESPONSE Q
6 2. Formation process of surface runoff 3 generally acknowledge methods of generation of runoff Hortonian overland flow (surface runoff) Shallow subsurface runoff Saturated overland flow (return flow) The processes whereby rainfall becomes runoff continue to be difficult to quantify and conceptualize
7 Cont d Ground water i > f Hortonian Overland Flow PCP intensity is higher than infiltration rate, soil cannot take up rain as fast as it is falling Ground water Saturated overland flow Shallow subsurface flow Ground water water infiltrates but a layer of lower infiltration rate exists
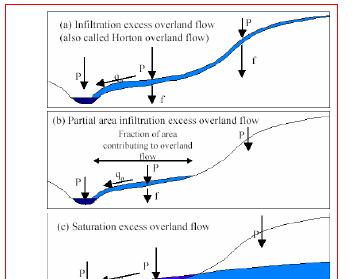
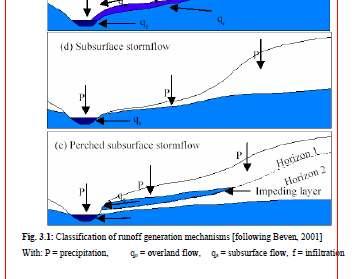
8 Classification of runoff mechanism
9 definitions Surface runoff includes all overland flow as well as all precipitation falling directly onto stream channels. Surface runoff is the main contributor to the peak discharge. Interflow is the portion of the streamflow contributed by infiltrated water that moves laterally in the subsurface until it reaches a channel. Interflow is a slower process than surface runoff. Components of interflow are quick interflow, which contributes to direct runoff, and delayed interflow, which contributes to baseflow. Ground water flow is the flow component contributed to the channel by groundwater. This process is extremely slow as compared to surface runoff.

10 Cont d Thus, total streamflow hydrographs are usually conceptualized as being composed of: Direct Runoff, which is composed of contributions from surface runoff and quick interflow. Unit hydrograph analysis refers only to direct runoff. Baseflow, which is composed of contributions from delayed interflow and groundwater flow.
11 3. Factors affecting runoff The main factors affecting runoff: o Drainage characteristics: basin area, basin shape (form and compactness), basin slope, soil type and land use, drainage density, and drainage network topology. Most changes in land use tend to increase the amount of runoff for a given storm. o Rainfall characteristics: rainfall intensity, duration, and their spatial and temporal distribution; and storm motion, as storms moving in the general downstream direction tend to produce larger peak flows than storms moving upstream.
12 Watershed Factors that Affect Runoff (cont d) Size- area of watershed Topography slope of watershed Shape of watershed Aspect of watershed Geology Soil Land cover
13 Factors affecting Runoff (cont d) Effect of watershed area 1mm of rain on 1km 2 of watershed represents an input of 1,000 m 3 of water or about 250,000 gallons of water. If a watershed, of 10 km 2 receives an annual precipitation of 300 mm, it is inputting about billion m 3.
14 Factors affecting Runoff (cont d) Size- area of watershed Topography slope of watershed May include drainage density effects Shape of watershed Aspect of watershed Geology Soil Land cover

15 Factors affecting Runoff (cont d) Topography and drainage density Slope affects stream velocity Drainage density affects travel time of precipitation to channel
16 Factors affecting Runoff (cont d) Size- area of watershed Topography slope of watershed May include drainage density effects Shape of watershed Aspect of watershed Geology Soil Land cover


17 Factors affecting Runoff (cont d) Catchments with the same area but different shapes volume of water that passes through the outlets of both the catchments is same (as areas and effective rainfall have been assumed same for both)
18 Factors affecting Runoff (cont d) Also need to consider the storm duration and time of concentration.
19 4 Method of determining Runoff Infiltration capacity curve Nonlinear loss-rate function Consider time-varying infiltration rates Index approach Uses average rate of infiltration for storm NRCS method Uses time-averaged parameters
20 4.1) Infiltration Index Approach Simplest procedure Objective is to divide hyetograph into direct runoff and infiltration φ index is the average rate such that the volume in the hyetograph above the index is equal to direct runoff Need hyetograph and estimate of direct runoff to determine φ index
21 φ index Method
22 4.2) NR-SCS Method
23 NR-SCS Method (Cont d) Q = (P I (P I a a ) 2 + S) where Q = surface runoff [L] P = precipitation [L] Ia = initial abstraction S = potential maximum soil retention [L] Note that Q represents cumulative runoff corresponding to cumulative P

24 NR-SCS Method (Cont d) The curve number (CN) is defined as where CN = curve number S = potential maximum soil retention Rearranging, see that S= 1000 CN 10
, land use and condition. Range between 0 and 100.")
25 SCS Method -Curve Number (Cont d) Curve number related to: Hydrologic soil group Land cover, treatment and condition Antecedent moisture conditions Based on the Hydrologic Soil Group (HSG), land use and condition. Range between 0 and 100. The greater the curve number, the greater the potential for RO.
26 SCS Method -Curve Number (Cont d) Hydrologic Soil Groups oscs classified more than 4000 soils into four general HSG (A, B, C, and D)
27 SCS Method -Curve Number (Cont d) Land Use and Condition Curve numbers for various land uses ranging from cultivated land to industrial and residential districts.
28 SCS Method -Curve Number (Cont d)
29 SCS Method -Curve Number (Cont d) Antecedent Moisture Conditions Runoff potential is dependent on antecedent moisture conditions so CN is dependent on that. The CN in the table are for antecedent moisture condition II which is average soil moisture conditions CN(II). CN(I) is used when there has been very little rainfall preceeding the rainfall in question (dry soil) CN(III) is used when there has been considerable rainfall before the rainfall in question (wet soil)


30 SCS Method -Curve Number (Cont d)
31 Important! 1. Method entrenched in runoff prediction practice and is acceptable to regulatory agencies and professional bodies. 2. Attractively simple to use. 3. Method packaged in handbooks and computer programs 4. Appears to give reasonable results --- big storms yield a lot of runoff, fine-grained, wet soils, with thin vegetation covers yield more storm runoff in small watersheds than do sandy soils under forests, etc. 5. No easily available competitor that does any better. The method is already used in various larger computer models, such as SWAT, HEC-HMS).
32 4.3) Unit Hydrograph Method t s 1 cm direct runoff 1cm direct runoff Definition: A tr-unit Hydrograph is the DR hydrograph produced by a storm of 1 unit effective rainfall and effective rainfall duration tr. Φ Method for simulating the time distribution of a known volume of stormflow Limited to basins < 5,000 square km Unit hydrographs are specified for a known duration of effective rainfall (t s ) t b
33 Derivation: To derive a Unit Hydrograph (i) Separate the base flow from the streamflow hydrograph. (ii) Compute the Direct Runoff steamflow volume (area under Direct Runoff hydrograph) and divide it by the catchment s area to determine the effective rainfall depth d. (iii) Define the effective rainfall duration by separating an area equal to d from the top of the hyetograph.

34 Moisture Accounting rainfall-runoff models handle antecedent conditions by tracking moisture through time Applied moisture is distributed in a physically realistic manner within the various zones and energy states in soil Rational percolation characteristics are maintained Streamflow is simulated effectively
35 Typica Soil Moisture Accounting Model
36 Soil Moisture Accounting and Routing /SMAR/
37 4.4 Runoff Measurement Generally any hydrologic processes is measured as 1. Point Sample -Measurements made through time at a fixed location in space. -The resulting data forms a Time Series. 2. Distributed Samples -Measurement made over a line or area in space at a specific point in time. -The resulting data forms a Space Series.
38 Measurement Sequence Hydrologic phenomenon Sensing Recording Transmission Translation Editing Storage Retrieval Transform the intensity of the phenomenon into an observable signal Make an electronic or paper record of the signal Move the record to a central processing site Convert the record into a computerized data sequence Check the data and eliminate errors and redundant info Archive the data on a computer tape or disk Recover the data in the form required User of data
39 Measuring runoff The measurement of runoff may be required to assess the relative contribution of different hillslope runoff processes; i.e. throughflow, overland flow,etc. There are no standard methods for the measurement of runoff processes; Overland flow Overlandflow can be measured using collection troughs at the bottom of hillslopes or runoff plots. A runoff plot is an area of hillslope with definite upslope and side boundaries so that you can be sure all the overland flow is generated from within each plot. The upslope and side boundaries can be constructed by driving metal plates into the soil and leaving them protruding above the surface.
40 Cont d Several runoff plots are used to characterize overland flow on a slope as it varies considerably in time and space. This spatial and temporal variation may be overcome with the use of a rainfall simulator. Throughflow/lateralflow The only way to measure it is with lateral flow troughs dug into the soil at the appropriate height. The problem with this is that in digging, the soil profile is disturbed and consequently the flow characteristics change. It is usual to insert troughs into a soil face that has been excavated and then refill the hole.
41 Runoff and sediment collecting point
42 5) Hydrological Models Hydrological modelling is a mathematical representation of natural processes that influence primarily the energy and water balances of a watershed. simplified, conceptual representations of a part of the hydrologic cycle
43 Tasks of hydrological models (cont d) Modelling existing catchments for which input-output data exist, e.g. Extension of data series for flood design of water resource evaluation, operational flood forecasting, or water resource management Runoff estimation on ungauged basins Prediction of effects of catchment change e.g. Land use change, climate change Coupled hydrology and geochemistry e.g. Nutrients, Acid rain Coupled hydrology and meteorology e.g. Global Climate Models Page 43
44 hydrological models-components (cont d)
45 Classification according to process description (cont d) Empirical - Black Box (empirical) Hydrological model Conceptual Physically based Equations: No relation to theoretical process descriptions Parameters: Can not be related to field data Conceptual- Equations: Some reflection of physical concepts in theoretical process descriptions Parameters: Can some times be related to field data, but can usually not be assessed directly from field data Physically based Equations : theoretical process equations Parameters: Can in principle be assessed from field data
46 6) Soil erosion process Erosion is a process of detachment and transport of soil particles by erosive agents. Ellison, 1944 It is the process of moving soil (by wind or water) from place of origin to another location. EROSION IS A CONCERN Degrades soil resource Reduces soil productivity Reduces soil organic matter Removes plant nutrients Causes downstream sedimentation Produces sediment which is a pollutant Produces sediment that carries pollutants

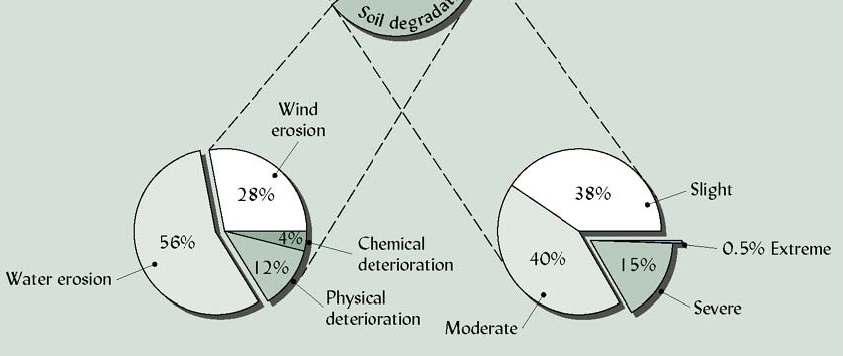
47 Global land and soil degradation
48 Soil erosion process (cont d) 1. Detachment 2. Transport 3. Deposition Soil erosion by water is the result of rain detaching and transporting vulnerable soil, either directly by means of rain splash or indirectly by rill and gully erosion
49 Factors controlling soil erosion process
50 T value = Tolerable erosion Maximum soil erosion loss that is offset by the theoretical maximum rate of soil development, which will maintain an equilibrium between soil gains and losses. The maximum average annual soil loss that will allow continuous cropping and maintain soil productivity without requiring additional management inputs. T ranges from: 2 11 t/ha/yr (1-5 t/ac/yr) < 25 cm = 2.2 t/ha/yr > 152 cm = 11.2 t/ha/yr
51 7) Impacts of soil erosion/ downstream sedimentation soil erosion has a range of environmental impacts, including loss of organic matter and soil nutrients, reduction of crop productivity and degradation of downstream. there is a need to improve the understanding of erosion and deposition processes at field, catchment and larger regional scales from the quantitative perspective, in order to be able to analyse their on-site impact on soil productivity as well as their off-site impact on streams (e.g., sedimentation and water quality)
52 On and off-site effects of soil erosion

53 Rainfall VS Sediment yield
54 SEDIMENT CHARACTERISTICS Particle Classes Primary clay, primary silt, small aggregate, large aggregate, primary sand At Detachment Distribution of classes function of texture Diameter of small and large aggregates function of texture After Deposition Sediment enriched in fines
55 Deposition VS transport capacity and sediment load Transport capacity Sediment load Hillslope Transport capacity = sediment load Sediment production less Deposition than transport capacity Deposition because sediment production exceeds transport capacity
56 8) Erosion modeling Erosion modelling is based on an understanding of the physical laws and landscape processes such as runoff and soil formation occurring in the natural environment. Modelling translates these components into mathematical relationships, describing the fundamental water erosion processes of detachment, transport and deposition (Jetten et al., 2003).


57 8.1) Erosion and sediment transport models (adapted from Merrit et al. 2003)


58 Erosion and sediment transport models
59 8.2) Universal Soil Loss Equation To guide methodical decision making in conservation planning on a site basis To predict longtime average soil losses and runoff from specific areas in specified cropping and management systems. To enable planners to project limited erosion data to many locations and conditions not directly represented by research For estimating average annual soil loss from sheet and rill erosion only.
60 USLE- Background Combines empirical field data-process based equations (natural runoff and rainfall simulator plots) Zingg s equation (1940) Smith and Whit s equation (1947) AH-282 (1965) Undisturbed land (1975) AH-537 (1978) Disturbed forestland (1980) RUSLE1 (1992) AH703 (1997) OSM Manual (mined, reclaimed land, construction sites) (1998) RUSLE2 (2001)
61 USLE- EROSION PREDICTION AS A TOOL Guide management decisions Evaluate impact of erosion Inventory soil erosion Conservation planning Concept: Estimate erosion rate Evaluate by ranking Evaluate against quality criteria Tool: RUSLE2 Quality Criteria: Soil loss tolerance
62 USLE- PLANNING VARIABLES Soil loss on eroding portions of hillslope Detachment (sediment production) on hillslope Conservation planning soil loss for hillslope Ratio of segment soil loss to soil tolerance adjusted for segment position Sediment yield from hillslope/terraces
63 OVERVIEW OF RUSLE2 Where RUSLE2 applies Major factors affecting erosion RUSLE2 factors RUSLE2 background
64 Overland flow Interrill Rill Ephemeral Gully (Concentrated flow) Landscape RUSLE2 Area Erosion Types
65 RULSE A = R x K x (LS) x C x P A = Predicted Average Annual Soil Loss (tons/ac/yr) R = Rainfall Factor K = Soil Erodibility Factor LS = Slope Length and Steepness Factor C = Cover and Management Factor P = Support Practice Factor
66 RUSLE FACTORS (Sediment Production) Climate r Soil Topography k ls Land Use and lscp Management A = f (erodibility, erosivity) Erosivity rklscp Erodibility - klc
67 RUSLE2 Factors (Keep in mind that factors are on a daily basis) r- erosivity factor k- erodibility factor l- slope length factor s- slope steepness factor c- cover-management factor p- supporting practices factor
68 Rainfall Factor (R) Measure of rainfall energy and intensity rather than just rainfall amount. R factors values in Missouri are specific by county. Use RUSLE Rainfall-Factor Map to determine R Factor
69 Soil Erodibility Factor (K) Measure of the relative resistance of a soil to detachment and transport by water. Use Kf factor representing the fine-earth fraction of the soil. The fine-earth fraction represents the soil subject to sheet and rill erosion. Adjust the Kf factor using the Average Annual K Factor Table K = RUSLE Adjusted K Value
70 Soil Erosion (tons ha - 1 yr - 1 ) Soil Erosion class Erosion Map Index 0-5 Slight Moderate High Very High 4 > 80 Severe 5
71 Slope Length and Steepness Factor (LS) Ratio of soil loss from a given field slope to that from a slope that has a length of 72.6 feet and a steepness of 9 percent. Slope Length (L) is the point water starts to flow to the point where deposition occurs or runoff is concentrated. Slope steepness (S) is the horizontal fall (ft) given in 100 feet. Use Table 1: Values for LS for Rangeland, Pastureland, Long Term No-Till Cropland Use Table 2: Values for LS for Row-Cropped Agricultural
72 Cover and Management Factor (C) Ratio of soil loss from land cropped under specific conditions to corresponding loss from clean-tilled, continuous fallow. One factor a landowner can impact the amount of soil loss. Figure Climatic Zone for the specific county Use corresponding C-Factor Table Figure C factor based on rotation
73 Support Practice Factor (P) Ratio of soil loss with a specific support practice to the corresponding soil loss with up and down the hill tillage. Support practices include contouring, stripcropping, and terracing.
74 USLE Equation Terms Term High Value Low Value High/Lo w Ratio R K LS C P /29/99 74

75 Uses of RUSLE2: Erosion Computations

76 Uses of RUSLE2: Educational Tool
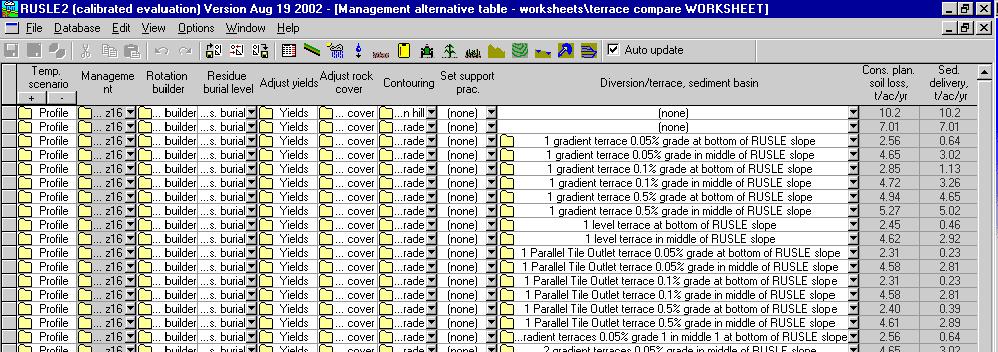
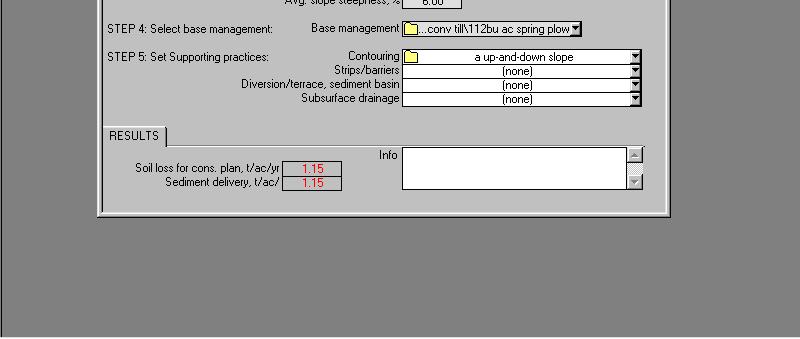
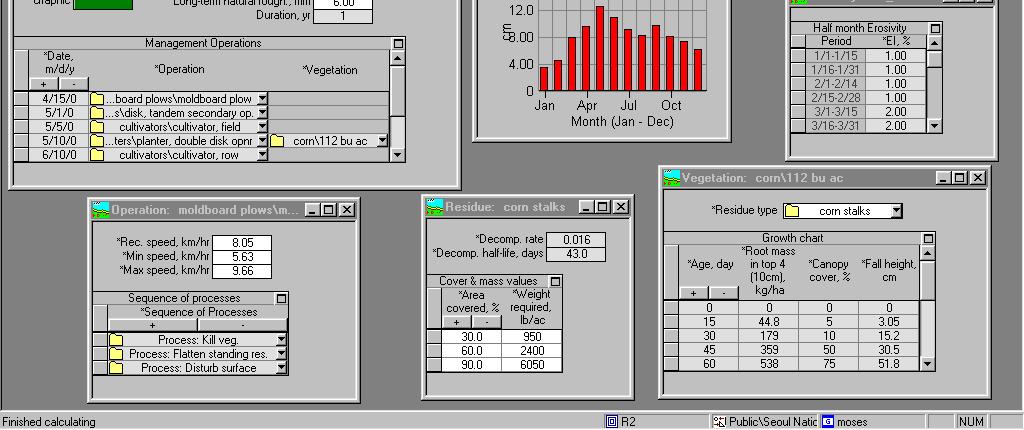
77 Uses of RUSLE2:Management Comparisons


78 Uses of RUSLE2: Road Grading

79 Uses of RUSLE2: General Modeling
80 APPLICABLE PROCESSES Yes: Interrill and rill erosion Yes: Sediment yield from overland flow slope length Yes: Sediment yield from terrace channels and simple sediment control basins No: Ephemeral or permanent incised gully erosion No: Stream channel erosion No: Mass wasting
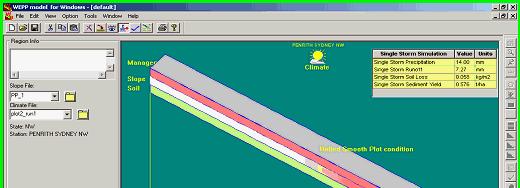
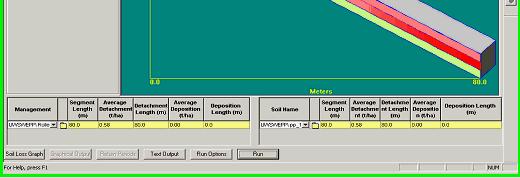
81 Water Erosion Prediction Project (WEPP) Developed in 1987 Physically based model that simulates the entire erosion process Can predict spatial and temporal distributions of net soil loss and deposition

82 WEPP Applications Hillslope A direct replacement of USLE Can predict soil loss and deposition on a slope Watershed Sediment detachment, transport, and deposition in channel systems, in addition to hillslope
83
84 GeoWEPP ESRI ArcView extension that uses DEM data to derive topography inputs
85 RUSLE2 vs. WEPP RUSLE2 An advanced empirical model that predicts longterm, average-annual soil erosion by water Runs on a Windows program Relies on climate, soil, vegetation, and cropping management databases Land use independent Used for erosion estimates on cropland and pastureland WEPP Process-oriented, simulated soil erosion prediction model Runs on a Windows program Relies on climate, soil, vegetation, and cropping management databases Applicable to small watersheds (640 acres) Can simulate small profiles up to large fields
86
OVERVIEW OF RUSLE 2 DICK WOLKOWSKI DEPT. OF SOIL SCIENCE UW-MADISON
 OVERVIEW OF RUSLE 2 DICK WOLKOWSKI DEPT. OF SOIL SCIENCE UW-MADISON WHAT IS RUSLE 2 GREAT GRANDSON OF USLE MODEL TO PREDICT SOIL LOSS WHERE OVERLAND FLOW OCCURS COMPUTES ANNUAL SHEET/RILL EROSION COMPUTES
What is runoff? Runoff. Runoff is often defined as the portion of rainfall, that runs over and under the soil surface toward the stream
 What is runoff? Runoff Runoff is often defined as the portion of rainfall, that runs over and under the soil surface toward the stream 1 COMPONENTS OF Runoff or STREAM FLOW 2 Cont. The types of runoff
What is a Watershed? Understanding Surface Runoff. Controlling Erosion and Sediment.
 What is a Watershed? Understanding Surface Runoff. Controlling Erosion and Sediment. Aleksey Sheshukov Assistant Professor and Water-Quality Specialist Biological & Agricultural Engineering ashesh@ksu.edu,
Soil Properties that influence detachment and runoff
 Soil Properties that influence detachment and runoff Texture Structure Aggregation Density/compaction Wettability Antecedent soil moisture Organic Matter Sandy soils Sands are easily detacted However,
Thanks to Bill Elliot, Research Leader U.S. Department of Agriculture Forest Service
 Thanks to Bill Elliot, Research Leader U.S. Department of Agriculture Forest Service To present an overview Forest Soil Erosion Processes 2 Precipitation or melting snow Evapotranspiration Infiltration
Runoff Processes. Daene C. McKinney
 CE 374 K Hydrology Runoff Processes Daene C. McKinney Watershed Watershed Area draining to a stream Streamflow generated by water entering surface channels Affected by Physical, vegetative, and climatic
AnnAGNPS. Annualized AGricultural Non-Point Source Pollurant Loading Model. Annualized Agricultural Non-Point Source Pollutant Loading Model
 AnnAGNPS Annualized AGricultural Non-Point Source Pollurant Loading Model 1 Erosion Erosion can be expresed as: E=f(C, S, T, SS, M) E = erosion C = climate S = soil properties T = topography SS = soil
FAST WATER / SLOW WATER AN EVALUATION OF ESTIMATING TIME FOR STORMWATER RUNOFF
 FAST WATER / SLOW WATER AN EVALUATION OF ESTIMATING TIME FOR STORMWATER RUNOFF Factors Affecting Stormwater Runoff: Rainfall intensity % Impervious surfaces Watershed size Slope Soil type, soil compaction
The Texas A&M University and U.S. Bureau of Reclamation Hydrologic Modeling Inventory (HMI) Questionnaire
 Questionnaire") The Texas A&M University and U.S. Bureau of Reclamation Hydrologic Modeling Inventory (HMI) Questionnaire May 4, 2010 Name of Model, Date, Version Number Dynamic Watershed Simulation Model (DWSM) 2002
The Texas A&M University and U.S. Bureau of Reclamation Hydrologic Modeling Inventory (HMI) Questionnaire May 4, 2010 Name of Model, Date, Version Number Dynamic Watershed Simulation Model (DWSM) 2002
RUNOFF CALCULATIONS RATIONAL METHOD. To estimate the magnitude of a flood peak the following alternative methods are available:
 RUNOFF CALCULATIONS To estimate the magnitude of a flood peak the following alternative methods are available: 1. Unit-hydrograph technique 2. Empirical method 3. Semi-Empirical method (such rational method).
DRAFT USER S REFERENCE GUIDE
 DRAFT USER S REFERENCE GUIDE Revised Universal Soil Loss Equation Version 2 (RUSLE2) George R. Foster, Research Hydraulic Engineer (retired) National Sedimentation Laboratory USDA-Agricultural Research
Hydrologic Engineering Center Hydrologic Modeling System (HEC-HMS) Sunil KUMAR Director, National Water Academy
 Sunil KUMAR Director, National Water Academy") Hydrologic Engineering Center Hydrologic Modeling System (HEC-HMS) Sunil KUMAR Director, National Water Academy 22 April 2015 NWA, Pune Exercise Objective: To determine hydrological Response of the given
Hydrologic Engineering Center Hydrologic Modeling System (HEC-HMS) Sunil KUMAR Director, National Water Academy 22 April 2015 NWA, Pune Exercise Objective: To determine hydrological Response of the given
DRAFT USER S REFERENCE GUIDE
 DRAFT USER S REFERENCE GUIDE Revised Universal Soil Loss Equation Version 2 (RUSLE2) Prepared for USDA-Agricultural Research Service Washington, D.C. May 15, 2008 2 Acknowledgements RUSLE2 was developed
Water Budget IV: Soil Water Processes P = Q + ET + G + ΔS
 Water Budget IV: Soil Water Processes P = Q + ET + G + ΔS Infiltration Infiltration capacity: The maximum rate at which water can enter soil. Infiltration capacity curve: A graph showing the time-variation
LAKE COUNTY HYDROLOGY DESIGN STANDARDS
 LAKE COUNTY HYDROLOGY DESIGN STANDARDS Lake County Department of Public Works Water Resources Division 255 N. Forbes Street Lakeport, CA 95453 (707)263-2341 Adopted June 22, 1999 These Standards provide
Assessing the Current Condition of Damaged Ecosystem - Case Study for Umm Negga Site in the State of Kuwait
 Assessing the Current Condition of Damaged Ecosystem - Case Study for Umm Negga Site in the State of Kuwait Meshal Abdullah Rusty Feagin Steven Whisenant Layla Al Musawi Background Located in Asia continent
History of Model Development at Temple, Texas. J. R. Williams and J. G. Arnold
 History of Model Development at Temple, Texas J. R. Williams and J. G. Arnold INTRODUCTION Then Model development at Temple A long history (1937-present) Many scientists participating in: Data collection
Ponds. Pond A water impoundment made by excavating a pit, or constructing a dam or an embankment.
 POND SITE SELECTION AND CONSTRUCTION Uses, Planning, & Design David Krietemeyer Area Engineer USDA-NRCS June 20, 2008 Uses Considerations for Location of Commonly Used Terms Pond A water impoundment made
River Channel Characteristics
 River Channel Characteristics Storages and Transfers in Drainage Basins Precipitation Evapotranspiration SURFACE STORAGE INTERCEPTION STORAGE CHANNEL STORAGE Soil Moisture Storage Aeration Zone Storage
Precipitation Surface Cover Topography Soil Properties
 Precipitation Surface Cover Topography Soil Properties Intrinsic capacity of rainfall to cause erosion Influenced by Amount, intensity, terminal velocity, drop size and drop size distribution of rain.
Going with the Flow: Soil Erosion. Bill Bland UWEX and UW-Madison, Soil Science
 Going with the Flow: Soil Erosion Bill Bland UWEX and UW-Madison, Soil Science Outline Why more of you will become involved Basic idea Terminology--some of which is useful Scales--part of why this is hard
Definitions 3/16/2010. GG22A: GEOSPHERE & HYDROSPHERE Hydrology
 GG22A: GEOSPHERE & HYDROSPHERE Hydrology Definitions Streamflow volume of water in a river passing a defined point over a specific time period = VxA discharge m 3 s -1 Runoff excess precipitation - precipitation
APPENDIX IV. APPROVED METHODS FOR QUANTIFYING HYDROLOGIC CONDITIONS OF CONCERN (NORTH ORANGE COUNTY)
") APPENDIX IV. APPROVED METHODS FOR QUANTIFYING HYDROLOGIC CONDITIONS OF CONCERN (NORTH ORANGE COUNTY) Hydromodification design criteria for the North Orange County permit area are based on the 2- yr, 24-hr
APPENDIX IV. APPROVED METHODS FOR QUANTIFYING HYDROLOGIC CONDITIONS OF CONCERN (NORTH ORANGE COUNTY) Hydromodification design criteria for the North Orange County permit area are based on the 2- yr, 24-hr
Degradation of the resource Fertility loss Organic matter Tilth degradation. Water quality Sediment Nutrients
 Near Blue River ca. 1980 Degradation of the resource Fertility loss Organic matter Tilth degradation Water quality Sediment Nutrients Program cost Cheaper to prevent Still expensive Long-term productivity
Names: ESS 315. Lab #6, Floods and Runoff Part I Flood frequency
 Names: ESS 315 Lab #6, Floods and Runoff Part I Flood frequency A flood is any relatively high flow of water over land that is not normally under water. Floods occur at streams and rivers but can also
Soil Erosion in Mauritius
 Soil Erosion in Mauritius & its mitigation by sugar cane cultivation By Suman Seeruttun & Daniel Ah Koon 5 December 2006 - Introduction - Soil erosion - processes & Universal Soil Loss Equation - Project
Module 3: Rainfall and Hydrology for Construction Site Erosion Control
 Module 3: Rainfall and Hydrology for Construction Site Erosion Control Robert Pitt Department of Civil, Construction, and Environmental Engineering University of Alabama Tuscaloosa, AL Rainfall and Hydrology
Soil Erosion and Sediment Yield of a Sanitary Landfill Site A Case Study
 Soil Erosion and Sediment Yield of a Sanitary Landfill Site A Case Study Oon, Y.W. 1, Chin, N.J. 2 and Law, P.L. 3 Abstract - This research presents the results of a study on soil erosion rates and sediment
EFFECTS OF WATERSHED TOPOGRAPHY, SOILS, LAND USE, AND CLIMATE ON BASEFLOW HYDROLOGY IN HUMID REGIONS: A REVIEW
 PROGRESS IN PHYSICAL GEOGRAPHY EFFECTS OF WATERSHED TOPOGRAPHY, SOILS, LAND USE, AND CLIMATE ON BASEFLOW HYDROLOGY IN HUMID REGIONS: A REVIEW KATIE PRICE 2011 Presented by: Jordan Martin Article Overview
URBAN FLOODING: HEC-HMS
 1.0 Introduction URBAN FLOODING: HEC-HMS -Sunil Kumar, Director, NWA All major ancient civilisations were developed in the river valleys because river served as source of water, food, transportation and
Climate Simulation Irrigation Winter Processes Surface Hydrology Water Balance & Percolation Subsurface Hydrology Soil Component Plant Growth Residue
 Climate Simulation Irrigation Winter Processes Surface Hydrology Water Balance & Percolation Subsurface Hydrology Soil Component Plant Growth Residue Decomposition and Management Overland Flow Hydraulics
Learning objectives. Upon successful completion of this lecture, the participants will be able to describe:
 Solomon Seyoum Learning objectives Upon successful completion of this lecture, the participants will be able to describe: The different approaches for estimating peak runoff for urban drainage network
Computation of excess stormflow at the basin scale. Prof. Pierluigi Claps. Dept. DIATI, Politecnico di Torino
 Computation of excess stormflow at the basin scale Prof. Pierluigi Claps Dept. DIATI, Politecnico di Torino Pierluigi.claps@polito.it losses include: interception, evapotranspiration, storage infiltration,
Effect of Land Surface on Runoff Generation
 Effect of Land Surface on Runoff Generation Context: Hydrologic Cycle Runoff vs Infiltration Infiltration: Process by which water on the ground surface enters the soil Runoff: Water (from rain, snowmelt,
Soil and Water Conservation and Management as a Potential Strategy for Climate Change Adaptation
 Soil and Water Conservation and Management as a Potential Strategy for Climate Change Adaptation by Victor B. Ella, Ph.D. Professor Land and Water Resources Division, Institute of Agricultural Engineering
Ponds Planning, Design, Construction
 United States Department of Agriculture Natural Resources Conservation Service Ponds Planning, Design, Construction Agriculture Handbook Number 590 Estimating storm runoff The amount of precipitation,
1.2 REGULATORY REQUIREMENTS
 Table 1.1. Soil textural classes and general terminology used in soil descriptions (Source: US Environmental Protection Agency 1977). Name Texture Basic soil textural common class names Sandy soils Coarse
Soil and Water Conservation Research under Intensive Potato Production Systems in New Brunswick
 Agri-Food Soil and Water Conservation Research under Intensive Potato Production Systems in New Brunswick T. L. Chow 1, H.W. Rees 1, and J.-L, Daigle 2 Quebec New Brunswick Technical Exchange Workshop
Chapter 6. The Empirical version of the Rational Method
 Chapter 6 The Empirical version of the Rational Method The Empirical version is named because the parameters it uses (apart from rainfall data) are arbitrary and are generally based on experience or observation
1. Stream Network. The most common approach to quantitatively describing stream networks was postulated by Strahler (1952).
.") 1. Stream Network The most common approach to quantitatively describing stream networks was postulated by Strahler (1952). First Order Streams streams with no tributaries. Second Order Streams begin at
1. Stream Network The most common approach to quantitatively describing stream networks was postulated by Strahler (1952). First Order Streams streams with no tributaries. Second Order Streams begin at
WMS Tools For Computing Hydrologic Modeling Parameters
 WMS Tools For Computing Hydrologic Modeling Parameters Lesson 9 9-1 Objectives Use the drainage coverage as a basis for geometric parameters as well as overlaying coverages to compute important hydrologic
Introduction. Keywords: Oil Palm, hydrology, HEC-HMS, HEC-RAS. a * b*
 The Effect of Land Changes Towards in Sg. Pandan Perwira Bin Khusairi Rahman 1,a* and Kamarul Azlan bin Mohd Nasir 1,b 1 Faculty of Civil Engineering, Universiti Teknologi Malaysia, Malaysia a * wirakhusairirahman@gmail.com,
Models Overview: Purposes and Limitations
 Models Overview: Purposes and Limitations Pollutant load originates from: Point-source discharges (NPDES facilities) Info is available on the discharges (DMRs, etc.) Some are steady-flow, others are precip-driven
Tropical Agro-Ecosystem Function
 Tropical Agro-Ecosystem Function Soil erosion by water and wind Dr. Ronald F. Kühne; rkuehne@gwdg.de Georg-August-University Göttingen Department for Crop Sciences Tropical Agronomy Grisebachstr. 6, 37077
Hydrologic Study Report for Single Lot Detention Basin Analysis
 Hydrologic Study Report for Single Lot Detention Basin Analysis Prepared for: City of Vista, California August 18, 2006 Tory R. Walker, R.C.E. 45005 President W.O. 116-01 01/23/2007 Table of Contents Page
SURFACE RUNOFF ESTIMATION BY SCS CURVE NUMBER METHOD USING GIS FOR RUPEN-KHAN WATERSHED, MEHSANA DISTRICT, GUJARAT
 J. Indian Water Resour. Soc., Vol. 36, No. 4, Oct., 2016 SURFACE RUNOFF ESTIMATION BY SCS CURVE NUMBER METHOD USING GIS FOR RUPEN-KHAN WATERSHED, MEHSANA DISTRICT, GUJARAT Dhvani Tailor 1 and Narendra
Appendix D. Erosion Management Sub- Plan
 Appendix D Erosion Management Sub- Plan DRENNAN SOLAR ENERGY FACILITY EROSION MANAGEMENT PLAN PRODUCED FOR ERM ON BEHALF OF SOLAIREDIRECT BY Simon.Todd@3foxes.co.za JUNE 2013 PURPOSE The purpose of the
Module 3 and Module 4 Watershed Analysis and RUSLE Calculation. Noboru Togawa. Presented to: Dr. Pitt Construction Site Erosion Control
 Module 3 and Module 4 Watershed Analysis and RUSLE Calculation by Presented to: Dr. Pitt Construction Site Erosion Control Department of Civil, Construction, and Environmental Engineering The University
EROSION HAZARD MAPPING FOR MICRO-WATERSHED PRIORITIZATION USING REMOTE SENSING AND GIS TECHNIQUES
 EROSION HAZARD MAPPING FOR MICRO-WATERSHED PRIORITIZATION USING REMOTE SENSING AND GIS TECHNIQUES Dilip G. Durbude*, B. Venkatesh Hard Rock Regional Centre, National Institute of Hydrology, Hanuman Nagar,
Model Development and Applications at the USDA-ARS National Soil Erosion Research Laboratory. Dennis C. Flanagan
 Model Development and Applications at the USDA-ARS National Soil Erosion Research Laboratory Dennis C. Flanagan Research Agricultural Engineer USDA-Agricultural Research Service Adjunct Professor Purdue
Typical Local Erosion Control Requirements (Storm Water Management Authority, Inc.)
") Module 2: Selection of Controls and Site Planning for Construction Site Erosion Prevention Robert Pitt Department of Civil, Construction, and Environmental Engineering University of Alabama Tuscaloosa,
Module 2: Selection of Controls and Site Planning for Construction Site Erosion Prevention Robert Pitt Department of Civil, Construction, and Environmental Engineering University of Alabama Tuscaloosa,
Stream Hydrology. Watershed 8/29/13. Area that contributes water to a point on a stream Scale is user-defined Other names: Catchment Drainage basin
 Stream Hydrology Watershed Area that contributes water to a point on a stream Scale is user-defined Other names: Catchment Drainage basin http://warnercnr.colostate.edu/geo/front_range/poudre.php# 1 Basics
Design of Stormwater Wetlands
 Hydraulic & Hydrologic Stormwater Engineering Design of Stormwater Wetlands Jon Hathaway, EI Extension Associate NCSU Bio. And Ag. Engineering 6 Step Process 1. Watershed Analysis (Runoff Volume and Peak
Water Budget III: Stream Flow P = Q + ET + G + ΔS
 Water Budget III: Stream Flow P = Q + ET + G + ΔS Why Measure Streamflow? Water supply planning How much water can we take out (without harming ecosystems we want to protect) Flood protection How much
Water Budget III: Stream Flow P = Q + ET + G + ΔS
 Water Budget III: Stream Flow P = Q + ET + G + ΔS Why Measure Streamflow? Water supply planning How much water can we take out (without harming ecosystems we want to protect) Flood protection How much
Water Budget III: Stream Flow P = Q + ET + G + ΔS
 Water Budget III: Stream Flow P = Q + ET + G + ΔS Why Measure Streamflow? Water supply planning How much water can we take out (without harming ecosystems we want to protect) Flood protection How much
Understanding Hydrologic Process for Better Stormwater Management
 Understanding Hydrologic Process for Better Stormwater Management Scott A. Brown, P.E. Larry A.J. Fennessey, Ph.D., P.E. Gary W. Peterson, Ph.D., P.E. Civil and Environmental Engineering GOAL to project
INFLOW DESIGN FLOOD CONTROL SYSTEM PLAN PLANT GREENE COUNTY ASH POND ALABMA POWER COMPANY
 INFLOW DESIGN FLOOD CONTROL SYSTEM PLAN PLANT GREENE COUNTY ASH POND ALABMA POWER COMPANY Section 257.82 of EPA s regulations requires the owner or operator of an existing or new CCR surface impoundment
Water Budget III: Stream Flow P = Q + ET + G + ΔS
 Water Budget III: Stream Flow P = Q + ET + G + ΔS Why Measure Streamflow? Water supply planning How much water can we take out (without harming ecosystems we want to protect) Flood protection How much
APPENDIX E APPENDIX E ESTIMATING RUNOFF FOR SMALL WATERSHEDS
 APPENDIX E ESTIMATING RUNOFF FOR SMALL WATERSHEDS March 18, 2003 This page left blank intentionally. March 18, 2003 TABLES Table E.1 Table E.2 Return Frequencies for Roadway Drainage Design Rational Method
BAEN 673 / February 18, 2016 Hydrologic Processes
 BAEN 673 / February 18, 2016 Hydrologic Processes Assignment: HW#7 Next class lecture in AEPM 104 Today s topics SWAT exercise #2 The SWAT model review paper Hydrologic processes The Hydrologic Processes
APPENDIX E ESTIMATING RUNOFF FROM SMALL WATERSHEDS
 ESTIMATING RUNOFF FROM SMALL WATERSHEDS June 2011 THIS PAGE LEFT BLANK INTENTIONALLY. June 2011 TABLES Table E.1 Table E.2 Return Frequencies for Roadway Drainage Design Rational Method Values June 2011
Application of Hydrologic Scaling:
 Purdue University Agricultural & Biological Engineering Application of Hydrologic Scaling: Effect of Spatiotemporal Variability on Hydrologic Response Rabi H. Mohtar 1, Majdi R. Abou Najm 1, Keith Cherkauer
UNIT HYDROGRAPH AND EFFECTIVE RAINFALL S INFLUENCE OVER THE STORM RUNOFF HYDROGRAPH
 UNIT HYDROGRAPH AND EFFECTIVE RAINFALL S INFLUENCE OVER THE STORM RUNOFF HYDROGRAPH INTRODUCTION Water is a common chemical substance essential for the existence of life and exhibits many notable and unique
HYDROLOGY WORKSHEET 1 PRECIPITATION
 HYDROLOGY WORKSHEET 1 PRECIPITATION A watershed is an area of land that captures rainfall and other precipitation and funnels it to a lake or stream or wetland. The area within the watershed where the
Chapter Introduction. 5.2 Computational Standard Methods HYDROLOGY
 Chapter 5. HYDROLOGY 5.1 Introduction The definition of hydrology is the scientific study of water and its properties, distribution, and effects on the earth s surface, in the soil and the atmosphere.
CHAPTER ONE : INTRODUCTION
 CHAPTER ONE : INTRODUCTION WHAT IS THE HYDROLOGY? The Hydrology means the science of water. It is the science that deals with the occurrence, circulation and distribution of water of the earth and earth
CHAPTER 2 EROSION CONTROL
 CHAPTER 2 EROSION CONTROL 2.1 EROSION AND EROSION CONTROL Understanding Erosion Erosion occurs when soil particles are detached from the land surface and carried downslope by moving water. Figure 2.1-1
1 n. Flow direction Raster DEM. Spatial analyst slope DEM (%) slope DEM / 100 (actual slope) Flow accumulation
 slope DEM / 100 (actual slope) Flow accumulation") 1 v= R S n 2/3 1/2 DEM Flow direction Raster Spatial analyst slope DEM (%) Flow accumulation slope DEM / 100 (actual slope) 0 = no cell contributing 215 = 215 cell contributing towards that cell sqrt (actual
1 v= R S n 2/3 1/2 DEM Flow direction Raster Spatial analyst slope DEM (%) Flow accumulation slope DEM / 100 (actual slope) 0 = no cell contributing 215 = 215 cell contributing towards that cell sqrt (actual
Runoff Hydrographs. The Unit Hydrograph Approach
 Runoff Hydrographs The Unit Hydrograph Approach Announcements HW#6 assigned Storm Water Hydrographs Graphically represent runoff rates vs. time Peak runoff rates Volume of runoff Measured hydrographs are
Physically-based Distributed Hydrologic Modeling
 Physically-based Distributed Hydrologic Modeling Goal of Phys.-based Distrib. Hydrologic Modeling To date we have learned about: Key forcings at land surface (precipitation/net radiation) Physical processes
Study Questions Exam 5
 Study Questions Exam 5 1. List three best management practices intended to reduce the loss of nutrients from agroecosystems. No problem. 2. Explain how buffer strips work. Runoff enters at higher velocity,
Objectives of the Study
 Integration of AGNPS, GIS, and Remote Sensing for Estimating Nonpoint Source Pollution in the Saginaw Bay, Michigan Chansheng He Department of Geograophy Western Michigan University Kalamazoo, MI 49008
Hydrology and Water Management. Dr. Mujahid Khan, UET Peshawar
 Hydrology and Water Management Dr. Mujahid Khan, UET Peshawar Course Outline Hydrologic Cycle and its Processes Water Balance Approach Estimation and Analysis of Precipitation Data Infiltration and Runoff
Erosion, Erosion, Everywhere
 Erosion, Erosion, Everywhere Main Objectives 1.Capable of describing the magnitude of accelerated soil erosion in the past and at the present. 2.Comprehend the mechanics and the factors influencing water
The soil is a very. The soil can. The manure. Soil Characteristics. effective manure treatment system if manures are applied at the proper rate.
 The soil is a very effective manure treatment system if manures are applied at the proper rate. The soil can filter pollutants and prevent them from reaching groundwater. The manure application rate should
Basic Hydrology Runoff Curve Numbers
 Basic Hydrology Runoff Curve Numbers By: Paul Schiariti, P.E., CPESC Mercer County Soil Conservation District The SCS Runoff Curve Number The RCN (Runoff Curve Number) method was originally established
IJSER. within the watershed during a specific period. It is constructed
 International Journal of Scientific & Engineering Research, Volume 5, Issue 7, July-014 ISSN 9-5518 306 within the watershed during a specific period. It is constructed I. INTRODUCTION In many instances,
Hydrology for Drainage Design. Design Considerations Use appropriate design tools for the job at hand:
 Hydrology for Drainage Design Robert Pitt Department of Civil and Environmental Engineering University of Alabama Tuscaloosa, AL Objectives for Urban Drainage Systems are Varied Ensure personal safety
6.0 Runoff. 6.1 Introduction. 6.2 Flood Control Design Runoff
 October 2003, Revised February 2005 Chapter 6.0, Runoff Page 1 6.1 Introduction 6.0 Runoff The timing, peak rates of discharge, and volume of stormwater runoff are the primary considerations in the design
Event and Continuous Hydrological Modeling with HEC- HMS: A Review Study
 Event and Continuous Hydrological Modeling with HEC- HMS: A Review Study Sonu Duhan *, Mohit Kumar # * M.E (Water Resources Engineering) Civil Engineering Student, PEC University Of Technology, Chandigarh,
Modeling catchment scale infiltration
 Modeling catchment scale infiltration Serena Ceola, DICAM, University of Bologna Advanced Hydrology & Water Resources Management INTRODUCTION OBJECTIVE: Understanding the processes and the methods for
College of Soil Physics. 22 October - 9 November, Factors affecting the water erosion process.
 1867-68 College of Soil Physics 22 October - 9 November, 2007 Factors affecting the water erosion process. Donald Gabriels Dept. Soil Management Ghent University Belgium COLLEGE ON SOIL PHYSICS Water erosion:
Predicting Soil Erosion. Conservation Planning With the Revised Universal Soil Loss Equation (RUSLE) by Water: A Guide to USDA
 by Water: A Guide to USDA") USDA United States Department of Agriculture Agricultural Research Service Ag ri cu I tu re Handbook Number 703 Predicting Soil Erosion by Water: A Guide to Conservation Planning With the Revised Universal
USDA United States Department of Agriculture Agricultural Research Service Ag ri cu I tu re Handbook Number 703 Predicting Soil Erosion by Water: A Guide to Conservation Planning With the Revised Universal
SOUTHEAST TEXAS CONTINUING EDUCATION
 EXAM No. 118 FLOOD - RUNOFF ANALYSIS 1. Information gained from flood - runoff analysis includes which one: A. Stage, discharge, volume. B. Measure depth, volume. C. Velocity, depth, storm occurrence.
EXECUTIVE SUMMARY. The major results and conclusions from the study are given below in three sections which focus in turn on:
 EXECUTIVE SUMMARY 1. BACKGROUND AND OBJECTIVES The current area under sugarcane production in South Africa is some 400 000 ha. There is increased need to quantify the impact of sugarcane production on
International Journal of Scientific & Engineering Research, Volume 5, Issue 7, July-2014 ISSN Sruthy Nattuvetty Manoharan
 ISSN 2229-5518 210 Sruthy Nattuvetty Manoharan Department of Civil Engineering Government Engineering College, Thrissur Thrissur, 680009 sruthy.n.m@gmail.com a spatially distributed excess rainfall. It
Shelbyville, Kentucky Stormwater Best Management Practices (BMPs) Stormwater Pollution Treatment Practices (Structural) DRAFT
 Stormwater Pollution Treatment Practices (Structural) DRAFT") Shelbyville, Kentucky Stormwater Best Management Practices (BMPs) Stormwater Pollution Treatment Practices (Structural) Activity: Infiltration Systems PLANNING CONSIDERATIONS: Design Life: Short IS Acreage
Shelbyville, Kentucky Stormwater Best Management Practices (BMPs) Stormwater Pollution Treatment Practices (Structural) Activity: Infiltration Systems PLANNING CONSIDERATIONS: Design Life: Short IS Acreage
Prioritizing Water-Quality Improvement Efforts on Agricultural Lands Using LiDAR Elevation Data
 Prioritizing Water-Quality Improvement Efforts on Agricultural Lands Using LiDAR Elevation Data Aaron Ruesch and Theresa Nelson Wisconsin Department of Natural Resources WLWCA March 11, 2014 Outline WLWCA
Estimating Field-Scale Runoff and Sediment Delivery. Seth M. Dabney, USDA-ARS Dalmo A. N. Vieira, USDA-ARS Daniel C. Yoder, Univ.
 Estimating Field-Scale Runoff and Sediment Delivery Seth M. Dabney, USDA-ARS Dalmo A. N. Vieira, USDA-ARS Daniel C. Yoder, Univ. of Tennessee Organization Buffers for concentrated flow control Distributed
56 JOURNAL OF THE ALABAMA ACADEMY OF SCIENCE
 Reprinted from the Journal of the Alabama. Academy of Science, Volume 29. October 1, 1957. SECTION IV EFFECTS OF LAND USE ON STREAMFLOW By DONALD E. WHELAN Coweeta Hydrologic Laboratory, Dillard, Georgia
Calculating Soil Loss
 Lesson C7 3 Calculating Soil Loss Unit C. Plant and Soil Science Problem Area 7. Soil Erosion and Land Management Lesson 3. Calculating Soil Loss New Mexico Content Standard: Pathway Strand: Problem Solving
Preliminary assessment of soil erodibility can be investigated with soil plasticity properties (Section 4.4.3).
.") 6.0 SITE EROSION POTENTIAL 6.1 General The foremost challenge facing the designer is to correctly assess the erosion potential resulting from the construction activities. The site erosion potential is
6.0 SITE EROSION POTENTIAL 6.1 General The foremost challenge facing the designer is to correctly assess the erosion potential resulting from the construction activities. The site erosion potential is
1 Introduction 1.1 HYDROLOGIC MODELS
 1 Introduction Adequate scientific evidence (e.g., IPCC, 2007) exists now to show that the global climate is changing. The three prominent signals of climate change, namely, increase in global average
NREM 407/507 WATERSHED MANAGEMENT Day 2
 NREM 407/507 WATERSHED MANAGEMENT 1-15-09 - Day 2 1. Review Hydrologic Cycle Terminology/Model 2. Summarize Differences Cropfield vs Perennial Watershed 3. Tues Lab Develop International River PPT bring
SECTION IV WATERSHED TECHNICAL ANALYSIS
 A. Watershed Modeling SECTION IV WATERSHED TECHNICAL ANALYSIS An initial step in the preparation of this stormwater management plan was the selection of a stormwater simulation model to be utilized. It
APPENDIX 4 ARROYO MODELING
 APPENDIX 4 ARROYO MODELING The existing HEC-HMS model can serve as a baseline for further development and analysis of major arroyos in the city. The model would need to be updated and expanded to consider
Chapter 3 Physical Factors Affecting Runoff
 Chapter 3 Physical Factors Affecting Runoff Copyright 2003 David G Tarboton, Utah State University CHAPTER 3: PHYSICAL FACTORS AFFECTING RUNOFF The general climatic regime controls the total volume of
Ponds: planning, design, and construction
 Ponds: planning, design, and construction Ponds for many purposes: Fish Production Recreation Water Supply Esthetics Wildlife Habitat Natural ponds: Formed in natural depressions in the landscape Not man-made
Design Guide for Vegetative Filter Strips Using VFSMOD
 Paper No. 99-2147 An ASAE Meeting Presentation Design Guide for Vegetative Filter Strips Using VFSMOD By Librianto Suwandono John E. Parsons Rafael Muñoz-Carpena Graduate Student Associate Professor Researcher