Electricity Production Overview
|
|
|
- Shavonne White
- 6 years ago
- Views:
Transcription
1 Electricity Production Overview
2 Simplified US Electrical Generation Nuclear Hydro Coal Natural Gas

3 Source: egrid, 2010

4 Generation by Fuel, 2010
5
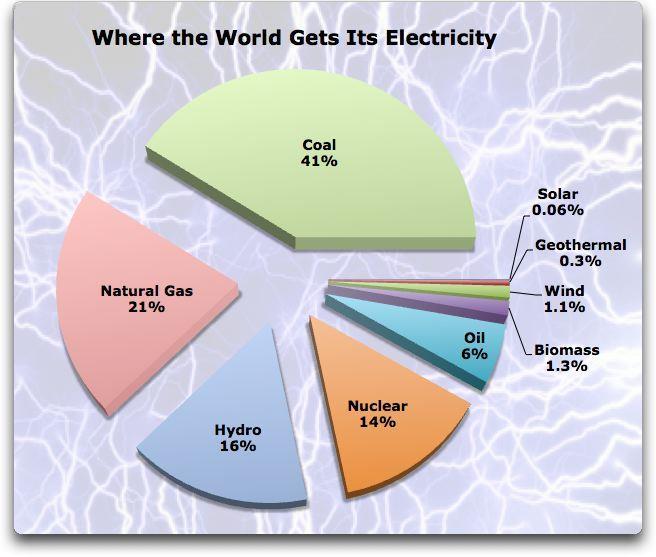
6 17.2 Electricity production from coal % of total by country (2012). 41% of Total Production SOURCES: World Development Indicators database, worldcoal.org
7 Electricity production from hydro % of total by country (2009) % of Total Production
8 Electricity production from nuclear % of total by country (2011). 13.5% of World Production

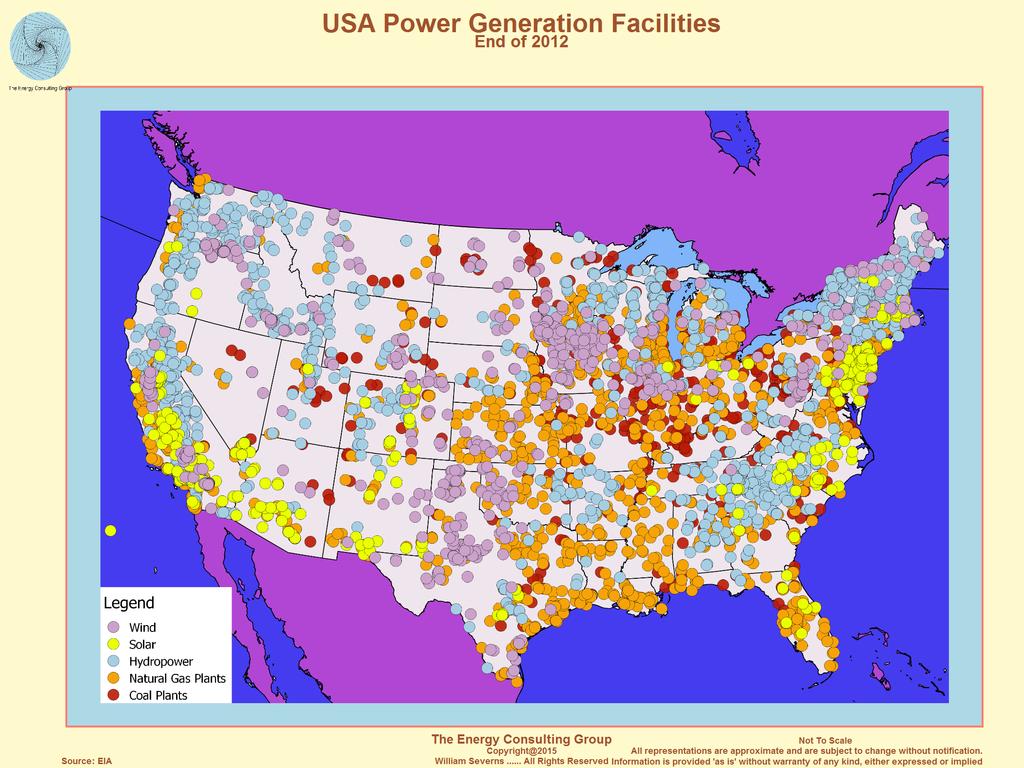
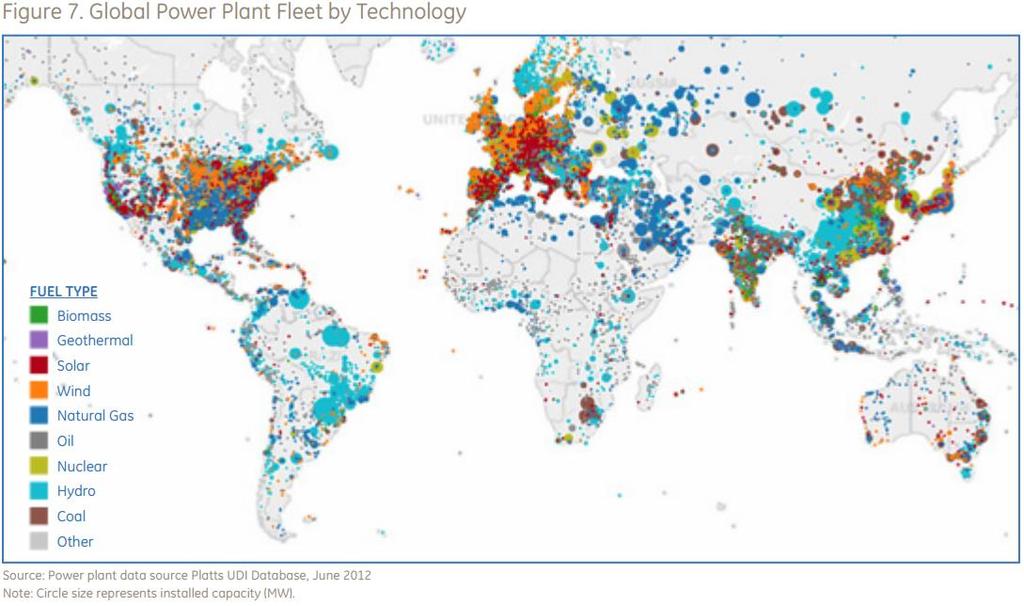
9 Coal-Fired Power Plants (412)
10

11 Source: EIA, 2014

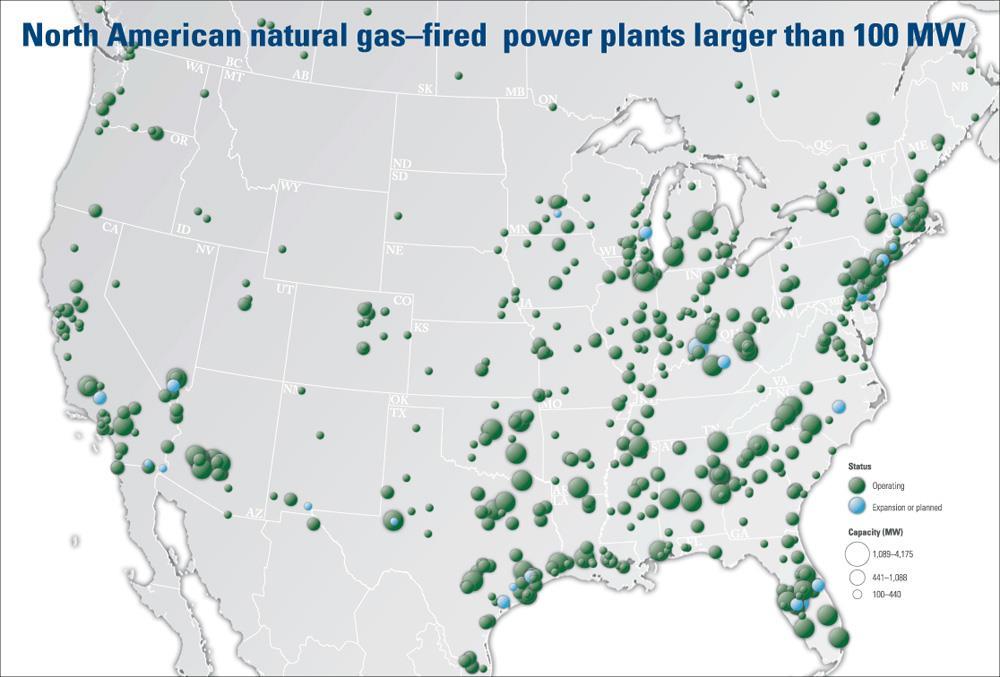
12 Natural Gas-Fired Power Plants (1714)
13 46.2

14 Electrical Production from Natural Gas Total Electric Power Industry (% of Total for 2014) VT: 0 NH: 22.5 MA: 59.4 CT: 43.6 RI: 94.9 NJ: 46.2 MD: 6.6 DE: 81.7 DC: US: Source: EIA, Nov 2015

15 Nuclear Power Plants (62)
16
17 World Electricity Prices, Kuwait Myanmar Bhutan Uzbekistan Korea India Paraguay Sweden Iceland Vietnam Perú China Ukraine Indonesia Moldova Canada Nepal United States Thailand Bulgaria Russia Lithuania Pakistan Norway South Africa Israel Brazil Nigeria Taiwan Croatia Colombia Latvia Romania Turkey Argentina New Zealand Mexico France United Kingdom Finland Spain Palau Chile Hungary Japan Switzerland Portugal Singapore Uruguay Guyana Ireland Italy Netherlands Belgium Australia Germany Tahiti Philippines Tuvalu Papua New Guinea Denmark Marshall Islands Jamaica Tonga Turks and Caicos Islands Solomon Islands US cents/kwhr Source: IEA
18
19 Million kwhrs Annual Electricity Sales by Sector 1,600,000 1,400,000 1,200,000 1,000, , , ,000 Residential Commercial 200,000 Industrial 0 Source: EIA

20 How Do We Use Electricity? Buildings Energy Data Book

21 Uses Are Changing
22 Typical Wattages of Various Appliances Formula for Estimating Energy Consumption: (Wattage Hours Used Per Day 1000 = Daily Kilowatt-hour (kwh) consumption Examples: Ceiling fan: (150 Watts 4 hours/day 120 days/year) 1000 = 72 kwh 10 cents/kwh = $7.20/year Hair Dryer: (1500 Watts 0.25 hours/day 365 days/year) 1000 = 138 kwh 10 cents/kwh = $13.80/year Refrigerator: (725 Watts 8 hours/day 365 days/year) 1000 = 2117 kwh 10 cents/kwh = $211.70/year Computer (50 Watts 12 hours/day 365 days/year) 1000 = 219 kwh 10 cents/kwh = $21.90/year Aquarium = Watts Clock radio = 10 Coffee maker = Clothes washer = Clothes dryer = Dishwasher = (using the drying feature greatly increases energy consumption) Dehumidifier = 785 Electric blanket- Single/Double = 60 / 100 Fans Ceiling = Window = Furnace = 750 Whole house = Hair dryer = Heater (portable) = Clothes iron = Microwave oven = Personal computer CPU - awake / asleep = 120 / 30 or less Monitor - awake / asleep = 150 / 30 or less Laptop = 50 Radio (stereo) = Refrigerator (frost-free, 16 cubic feet) = 725 Televisions (color) 19" = " = " = "-61" Projection = 170 Flat screen = 120 Toaster = Toaster oven = 1225 VCR/DVD = / Vacuum cleaner = Water heater (40 gallon) = Source: US Dept of Energy, Energy Efficiency and Renewable Energy

23 US Electricity Generation Projections
24 MWhr xe6 US Renewable Generation Total Electric Power Industry 1,400 1,200 1, Geothermal Pumped Storage Hydroelectric Conventional Other Gases Other Solar Thermal and Photovoltaic Other Biomass Wind Wood and Wood Derived Fuels Source: EIA, 2015
25 Generating Capacity, GW Renewable Electricity Generation by Source Conventional Hydropower Geothermal Municipal Waste Wood and Other Biomass Solar Thermal Solar Photovoltaic Wind Offshore Wind 0 Source: EIA, 2013
26

27 World Divided Into 7 Regions, Each with a Population of 1 Billion

28 Map of Time Zones in Antarctica

29 Per Capita GDP, 2013
30 GDP vs Electricity Consumption, Source: World Resources Institute
31
 North Korea: $1,800 est.")
32 North and South Korea at Night Per capita GDP (2014) North Korea: $1,800 est. South Korea: $35,277


33 Human Development Index (HDI): Life expectancy at birth Education, adult literacy rate and gross enrollment ratio Standard of living, gross domestic product per capita at purchasing power parity.


 Source: Human Development Index 2010")

34 Human Development Index Human Development Index vs Electricity Consumption 4,000 kwh per person per year is the dividing line between developed and developing countries. Annual Per Capita Electricity Consumption (kwh) Source: Human Development Index 2010 data United Nations; Annual Per Capita Electricity Consumption (kwh) data World Bank Updated: 4/11
35 Access to Electricity, 2010 Malawi Mozambique Madagascar Haiti Togo Cambodia Zimbabwe Yemen, Rep. Botswana Myanmar Cote d'ivoire Lao PDR Indonesia Nepal Guatemala Peru Panama Ecuador Cuba Colombia Iraq Brazil Trinidad and Tobago Algeria Jordan Venezuela, RB Israel Libya United Arab Emirates Canada Access to Electricity, % of Population World: 80.5%

36 Access to Electricity Source: World Resources Institute

37 Electrical Outages (days/year)

38 Billion kwhr World Electricity Forecast 30,000 OECD non-oecd 25,000 20,000 15,000 10,000 5, U.S. Energy Information Administration International Energy Outlook 2014
39 World Electricity Consumption, 2009 Norway Canada Luxembourg Sweden United Arab Emirates New Zealand Switzerland Austria Japan Saudi Arabia Germany Denmark Czech Republic Ireland Estonia Oman Trinidad and Tobago Italy Portugal South Africa Malta Serbia Hungary Malaysia Macedonia, FYR Chile Venezuela, RB Latvia Uruguay Turkmenistan Romania Brazil Thailand Mexico Costa Rica Panama Georgia Syrian Arab Republic Mongolia Dominican Republic Tunisia Ecuador Paraguay Zimbabwe Algeria Vietnam Korea, Dem. Rep. Zambia Indonesia Guatemala Mozambique Sri Lanka Ghana Yemen, Rep. Angola Kenya Cambodia Sudan Myanmar Nepal Tanzania Ethiopia 0 10,000 20,000 30,000 40,000 50,000 60,000 Electricity Consumption, KWh per capita
40 GWhr World Electricity Production, ,000,000 6,000,000 5,000,000 4,000,000 3,000,000 2,000,000 1,000,000 0 China United States European Union India Russia Japan Canada Germany Brazil France South Korea United Kingdom
41 GWhr Per Capita Electricity Consumption, Iceland Norway Canada United States Finland Kuwait Australia Sweden Qatar Denmark Germany Hong Kong
42 Electricity Imports
43 Electricity Exports
44 World Electricity Production ,101 GWhr M GWhr Coal & Peat Oil Natural Gas Nuclear Hydro Other Source: IEA
45

46

47 2035 Projections IEA World Energy Outlook


 China www.industcards.")
48 World s Largest Power Plants #1 Three Gorges 22,500 MW Yangtze River China #2 Itaipu 14,000 MW Paraná River Brazil/Paraguay #3 Xiluodu 13,860 MW Jinsha River (Upper Yangtze) China


49 World s Largest Power Plants NUCLEAR: Kashiwazaki-Kariwa 7,965 MW Japan COAL Taichung 5,500 MW Taiwan NATURAL GAS: Surgut-2 5,600 MW Russia


50 World s Largest Renewable Power Plants WIND: Gansu 5160 MW 20,000 MW Planned China SOLAR: Photo Voltaic Solar Star 579 MW Rosamond, CA GEOTHERMAL: The Geysers 750 MW (22 separate plants) Northern CA OFFSHORE WIND London Array 630 MW Kent, England


51 World s Largest Renewable Power Plants TIDE: Sihwa Lake South Korea 254 MW BIOFUEL: Tilbury B Essex, England 750 MW Wood Pellets WAVE: Aguçadoura Portugal 2.25 MW

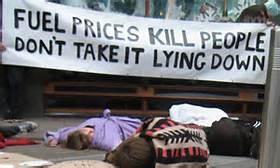

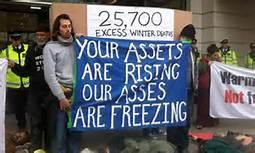
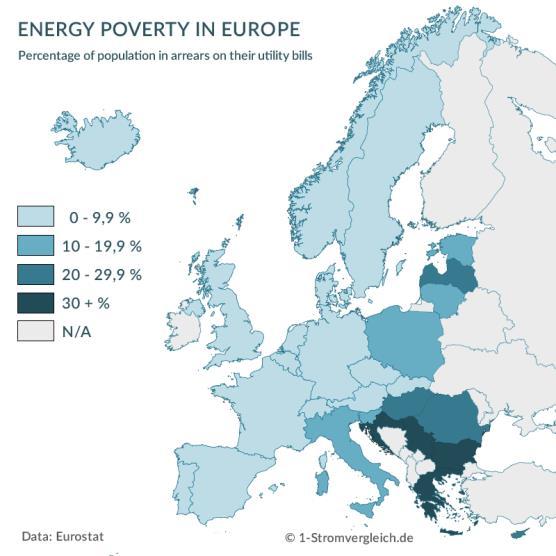
52 Energy Poverty
UNIVERSITY OF KANSAS Office of Institutional Research and Planning
 10/13 TABLE 4-170 FALL - TOTAL 1,624 1,740 1,926 2,135 2,134 2,138 2,246 Male 927 968 1,076 1,191 1,188 1,179 1,262 Female 697 772 850 944 946 959 984 Undergraduate 685 791 974 1,181 1,189 1,217 1,281
FSC Facts & Figures. June 1, 2018
 FSC Facts & Figures June 1, 2018 Global FSC-certified forest area North America 34.6% of total FSC-certified area ( 69,460,004 ha ) 242 certificates Europe 49.4% of total FSC-certified area ( 99,068,686
FSC Facts & Figures. January 6, FSC F FSC A.C. All rights reserved
 FSC Facts & Figures January 6, 2017 FSC F000100 0 FSC A.C. All rights reserved Global FSC-certified forest area North America 35.3% of total FSC-certified area ( 69,212,841 ha ) 248 certificates Europe
FSC Facts & Figures. February 1, FSC F FSC A.C. All rights reserved
 FSC Facts & Figures February 1, 2017 FSC F000100 0 FSC A.C. All rights reserved Global FSC-certified forest area North America 35.8% of total FSC-certified area ( 69,590,919 ha ) 249 certificates Europe
FSC Facts & Figures. August 1, 2018
 FSC Facts & Figures August 1, 2018 Global FSC-certified forest area North America 34.6% of total FSC-certified area ( 69,481,877 ha ) 253 certificates Europe 49.4% of total FSC-certified area ( 99,104,573
FSC Facts & Figures. September 6, 2018
 FSC Facts & Figures September 6, 2018 Global FSC-certified forest area North America 34.5% of total FSC-certified area ( 69,584,479 ha ) 253 certificates Europe 49.4% of total FSC-certified area ( 99,747,108
FSC Facts & Figures. March 13, FSC F FSC A.C. All rights reserved
 FSC Facts & Figures March 13, 2017 FSC F000100 0 FSC A.C. All rights reserved Global FSC-certified forest area North America 35.6% of total FSC-certified area ( 69,049,912 ha ) 248 certificates Europe
FSC Facts & Figures. December 1, FSC F FSC A.C. All rights reserved
 FSC Facts & Figures December 1, 2017 FSC F0001000 FSC A.C. All rights reserved Global FSC-certified forest area North America 35.7% of total FSC-certified area ( 69,695,913 ha ) 248 certificates Europe
FSC Facts & Figures. September 1, FSC F FSC A.C. All rights reserved
 FSC Facts & Figures September 1, 2017 FSC F0001000 FSC A.C. All rights reserved Global FSC-certified forest area North America 34.9% of total FSC-certified area ( 69,014,953 ha ) 246 certificates Europe
FSC Facts & Figures. October 4, FSC F FSC A.C. All rights reserved
 FSC Facts & Figures October 4, 2017 FSC F0001000 FSC A.C. All rights reserved Global FSC-certified forest area North America 35.2% of total FSC-certified area ( 68,947,375 ha ) 246 certificates Europe
FSC Facts & Figures. January 3, FSC F FSC A.C. All rights reserved
 FSC Facts & Figures January 3, 2018 FSC F0001000 FSC A.C. All rights reserved Global FSC-certified forest area North America 34.7% of total FSC-certified area ( 69,082,443 ha ) 245 certificates Europe
FSC Facts & Figures. February 9, FSC F FSC A.C. All rights reserved
 FSC Facts & Figures February 9, 2018 FSC F0001000 FSC A.C. All rights reserved Global FSC-certified forest area North America 34.5% of total FSC-certified area ( 68,976,317 ha ) 243 certificates Europe
FSC Facts & Figures. April 3, FSC F FSC A.C. All rights reserved
 FSC Facts & Figures April 3, 2018 FSC F0001000 FSC A.C. All rights reserved Global FSC-certified forest area North America 34.7% of total FSC-certified area ( 69,167,742 ha ) 242 certificates Europe 49.3%
FSC Facts & Figures. August 4, FSC F FSC A.C. All rights reserved
 FSC Facts & Figures August 4, 2016 FSC F0001000 FSC A.C. All rights reserved Global FSC-certified forest area North America 35.9% of total FSC-certified area ( 68,725,419 ha ) 249 certificates Europe 47.7%
FSC Facts & Figures. September 12, FSC F FSC A.C. All rights reserved
 FSC Facts & Figures September 12, 2016 FSC F0001000 FSC A.C. All rights reserved Global FSC-certified forest area North America 35.8% of total FSC-certified area ( 68,217,276 ha ) 243 certificates Europe
FSC Facts & Figures. November 2, 2018
 FSC Facts & Figures November 2, 2018 Global FSC-certified forest area North America 34.6% of total FSC-certified area ( 69,322,145 ha ) 256 certificates Europe 49.9% of total FSC-certified area ( 100,198,871
FSC Facts & Figures. December 3, 2018
 FSC Facts & Figures December 3, 2018 Global FSC-certified forest area North America 34.5% of total FSC-certified area ( 69,285,190 ha ) 253 certificates Europe 50% of total FSC-certified area ( 100,482,414
Population Distribution by Income Tiers, 2001 and 2011
 1 Updated August 13, 2015: This new edition includes corrected estimates for Iceland, Luxembourg, Netherlands and Taiwan, and some related aggregated data. TABLE A1 Distribution by Income Tiers, 2001 and
Summary for Policymakers
 Summary for Policymakers Yale Center for Environmental Law and Policy, Yale University Center for International Earth Science Information Network, Columbia University In collaboration with World Economic
Analysis of Load Factors at Nuclear Power Plants
 Clemson University From the SelectedWorks of Michael T. Maloney June, 2003 Analysis of Load Factors at Nuclear Power Plants Michael T. Maloney, Clemson University Available at: https://works.bepress.com/michael_t_maloney/10/
Cotton: World Markets and Trade
 United States Department of Agriculture Foreign Agricultural Service Circular Series FOP - December Cotton: World Markets and Trade Unprecedented Daily Price Volatility Rules the Market Now Daily NY Nearby
Forest Stewardship Council
 Global FSC certified area*: by region Africa CAMEROON CONGO, THE REPUBLIC OF GABON GHANA MOZAMBIQUE NAMIBIA SOUTH AFRICA SWAZILAND TANZANIA, UNITED UGANDA Asia CAMBODIA CHINA INDIA INDONESIA JAPAN KOREA,
Forest Stewardship Council
 Global FSC Certified Businesses: by country PUERTO RICO 4 FINLAND 83 BAHRAIN GUATEMALA 29 MACEDONIA 3 VIETNAM 004 CONGO, THE REPUBLIC OF 5 NEW ZEALAND 287 KOREA, REPUBLIC OF 243 UGANDA 3 MONACO 4 EGYPT
FSC Facts & Figures. December 1, FSC F FSC A.C. All rights reserved
 FSC Facts & Figures December, 0 FSC F00000 FSC A.C. All rights reserved Global FSC certified forest area North America.9v of total FSC certified area m 67::08 ha I 47 certificates Europe 47.v of total
FSC Facts & Figures. November 15. FSC F FSC A.C. All rights reserved
 FSC Facts & Figures November FSC F00000 FSC A.C. All rights reserved Global FSC certified forest area North America.u of total FSC certified area / 6.8.89 ha D 6 certificates Europe 8u of total FSC certified
Appendix F. Electricity Emission Factors
 Appendix F. Electricity Emission Factors F.1 Domestic Electricity Emission Factors, 1999-2002 Region / MWh) Methane Nitrous Oxide (1) New York, Connecticut, Rhode Island, Massachusetts, Vermont, New Hampshire
RENEWABLES IN GLOBAL ENERGY SUPPLY. An IEA Fact Sheet
 I N T E R N AT I O N A L E N E R G Y A G E N C Y RENEWABLES IN GLOBAL ENERGY SUPPLY An IEA Fact Sheet November 2002 INTERNATIONAL ENERGY AGENCY 9 rue de la Fédération 75739 Paris Cedex 15 - France Tel:
Country CAPEXIL Description HS Codes Value Qty AFGHANISTAN TIS Asbestos cement pipes
 Country-wise and Item-wise Exports of Cement, Clinkers and Asbestos Cement Products Value Rs. Lakh Quantity in '000 Unit: Kgs Source: MoC Export Import Data Bank Country CAPEXIL Description HS Codes Value
Prehospital providers
 Table A3: Post-crash response by country/area Provider training and certification Country/Area Universal access telephone number Trauma registry National assessment of emergency care system Prehospital
Cotton: World Markets and Trade
 United States Department of Agriculture Foreign Agricultural Service Cotton: World Markets and Trade May Global Consumption Rises Above Production, Fall USDA s initial forecast for / shows world consumption
WORLD TRADE REPORT 2004
 APPENDIX Appendix Table 1 Final MFN bound tariff profiles of WTO Members (Percentage) Share of duty-free HS subheadings Share of non ad valorem duties Maximum ad valorem duty Share of national peak duties
TABLE OF COUNTRIES WHOSE CITIZENS, HOLDERS OF DIPLOMATIC AND SERVICE PASSPORTS, REQUIRE/DO NOT REQUIRE VISAS TO ENTER BULGARIA
 TABLE OF COUNTRIES WHOSE CITIZENS, HOLDERS OF DIPLOMATIC AND SERVICE PASSPORTS, REQUIRE/DO NOT REQUIRE VISAS TO ENTER BULGARIA Last update: 26.06.2017 State Diplomatic passport Service passport 1 Afghanistan
2017 Energy Trilemma Index
 2017 Energy Trilemma Index Benchmarking the Sustainability of National Energy Systems Name of presenter date and name of event Navigating the Energy Trilemma 2 2017 Trilemma Index Rankings - Overall Top
enhance your automation thinking
 enhance your automation thinking PLCnext Technology The platform for limitless automation PLCnext Technology Designed by PHOENIX CONTACT In a rapidly changing world, in which more things are now networked
1 Controlling for non-linearities
 1 Controlling for non-linearities Since previous studies have found significant evidence for deaths from natural catastrophes to be non-linearly related to different measures of development (Brooks et
Countries of the World Part Ii
 By Addison Publisher - Addison Publisher Release Date : 2013-05-25 Genre : Politics & Current Affairs FIle Size : 274.85 MB is Politics & Current Affairs This ebook Covers Facts of all Countries * Introduction
Dentsu Inc. Investor Day Developing our global footprint
 Dentsu Inc. Investor Day Developing our global footprint September 4, 2015 Tim Andree EVP, Member of the Board, Dentsu Inc. Executive Chairman Dentsu Aegis Network Innovating The Way Brands Are Built Dentsu
CSM-PD. pre-heating, degassing and storage system for clean steam generators
 CSM-PD pre-heating, degassing and storage system for clean steam generators Clean steam generator feedwater treatment system To enable clean steam generators to provide the highest quality clean steam
2017 Energy Trilemma Index
 2017 Energy Trilemma Index Benchmarking the Sustainability of National Energy Systems Name of presenter date and name of event Navigating the Energy Trilemma 2 2017 Trilemma Index Rankings - Overall Top
Overview of FSC-certified forests January Maps of extend of FSC-certified forest globally and country specific
 Overview of FSCcertified forests Maps of extend of FSCcertified forest globally and country specific Global certified forest area: 120.052.350 ha ( = 4,3%) + 1% Hectare FSCcertified forest 10.000.000 and
Payroll Across Borders
 Payroll Across Borders 2 Question: Are you planning to expand your Does Global Payroll truly exist? business into new global markets? Question: Based on your experience, do you believe that there is a
CONVENTION FOR THE UNIFICATION OF CERTAIN RULES FOR INTERNATIONAL CARRIAGE BY AIR DONE AT MONTREAL ON 28 MAY 1999
 State CONVENTION FOR THE UNIFICATION OF CERTAIN RULES FOR INTERNATIONAL CARRIAGE BY AIR DONE AT MONTREAL ON 28 MAY 1999 Entry into force: The Convention entered into force on 4 November 2003. Status: 91
A d i l N a j a m Pardee Center for the study of the Longer-Term Future B o s t o n U n i v e r s i t y
 A d i l N a j a m The Fredrick S. Pardee Chair for Global Public Policy Pardee Center for the study of the Longer-Term Future B o s t o n U n i v e r s i t y How can ECOSOC and AMR foster integration of
ATT Status of ratifications and accessions
 Total number of UN Member States 194 Total Number of Signatories 130 Total ratifications 83 Total accessions 3 Total number of States Parties 82 * * Cyprus, Georgia, Monaco and Zambia have deposited their
Global Gas Deregulation Ed
 Global Gas Deregulation Ed 1 2012 What s in this report and analysis? Overview of the state of the gas sector World Survey of Gas Privatisation and Deregulation Coverage of Gas privatisation and deregulation
Spirax Sarco. Clean steam overview
 Spirax Sarco Clean steam overview Spirax Sarco - investing in solutions for clean systems Clean steam has been an important part of Spirax Sarco s business since pioneering the development of the BT6,
Oil and Petrochemical overview. solutions for your steam and condensate system
 o i l a n d p e t r o c h e m i c a l o v e r v i e w Oil and Petrochemical overview solutions for your steam and condensate system Understanding your steam and condensate system At Spirax Sarco we understand
Grow your business with Microsoft. Understanding the go-to-market opportunities for Independent Software Vendors
 Grow your business with Microsoft Understanding the go-to-market opportunities for Independent Software Vendors We re Investing in ISVs The cloud has given us the opportunity to add more value to our customers.
Spirax SafeBloc TM. double block and bleed bellows sealed stop valve
 Spirax SafeBloc TM double block and bleed bellows sealed stop Spirax SafeBloc TM a single solution for safe double isolation The Spirax SafeBloc TM is a safe isolation solution, with a unique space-saving
EAPI 2017 in Numbers. 127 countries energy systems assessed $10.75 $6.79. Advanced economies
 EAPI 2017 in Numbers Selected indicators 127 countries energy systems assessed 18 0 indicators Top 20 used across performers 3 dimensions EAPI average of the energy triangle score 0.74 0.61 1 Economic
SWISS PRESTIGE COSMETIC BRANDS International Country Brokerage Rights
 SWISS PRESTIGE COSMETIC BRANDS International Country Brokerage Rights Asia Bangladesh POSSIBLE POSSIBLE POSSIBLE POSSIBLE POSSIBLE POSSIBLE Bhutan POSSIBLE POSSIBLE POSSIBLE POSSIBLE POSSIBLE POSSIBLE
Findings from FAOSTAT user questionnaire surveys
 Joint FAO/UNECE Working party On Forest Economics and Statistics 28 th session, Geneva, 2-4 May 2006 Agenda Item 6 Dissemination of outputs During the last decade FAO has carried out two FAO forest product
CONTRIBUTIONS
 CONTRIBUTIONS 2006-2016 DONOR DONOR TYPE RECEIVED AMOUNT United Kingdom Member State 891,296,240 Sweden Member State 665,864,678 Norway Member State 617,301,857 Netherlands Member State 613,527,000 Canada
SOC 60. Quantitative Analysis I. Creating Pictures
 SOC 60 Quantitative Analysis I Creating Pictures Introducing Statistics Descriptive vs. inferential statistics Preparing Data for Analysis Gather data Enter data Data matrix Clean data Lie Factor Lie
Global Food Security Index
 Global Food Security Index Sponsored by 26 September 2012 Agenda Overview Methodology Overall results Results for India Website 2 Overview The Economist Intelligence Unit was commissioned by DuPont to
MERCER TRS TOTAL REMUNERATION SURVEY THE KEY TO DESIGNING COMPETITIVE PAY PACKAGES WORLDWIDE
 MERCER TRS THE KEY TO DESIGNING COMPETITIVE PAY PACKAGES WORLDWIDE MERCER TRS THE KEY TO DESIGNING COMPETITIVE PAY PACKAGES WORLDWIDE CONSIDER THESE QUESTIONS... Do you have an easy-to-use source for comparing
CHAPTER FIVE RENEWABLE ENERGY RENEWABLE ENERGY 68
 CHAPTER FIVE 68 5. KEY MESSAGES: Since 2010 there has been significant progress in developing enabling policy frameworks for renewable energy, with the global average score almost doubling from 29 in 2010
MAXIMUM MONTHLY STIPEND RATES FOR FELLOWS AND SCHOLARS Jul 2018 COUNTRY USD DSA MAX RES RATE MAX TRV RATE Effective % date Afghanistan $162 $1,701
 Afghanistan $162 $1,701 $2,552 01-Aug-07 Albania $147 $2,315 $3,473 01-Jan-05 * Algeria $258 $2,709 $4,064 01-Aug-07 * Angola $230 $2,415 $3,623 01-Aug-07 Antigua and Barbuda (1 Apr. - 30 $337 $3,539 $5,308
MAXIMUM MONTHLY STIPEND RATES FOR FELLOWS AND SCHOLARS Jul 2017 COUNTRY USD DSA MAX RES RATE MAX TRV RATE Effective % date Afghanistan $162 $1,701
 Afghanistan $162 $1,701 $2,552 01-Aug-07 * Albania $147 $2,315 $3,473 01-Jan-05 * Algeria $223 $2,342 $3,512 01-Aug-07 Angola $400 $4,200 $6,300 01-Aug-07 Antigua and Barbuda (1 Apr. - 30 $337 $3,539 $5,308
MAXIMUM MONTHLY STIPEND RATES FOR FELLOWS AND SCHOLARS Aug 2017 COUNTRY USD DSA MAX RES RATE MAX TRV RATE Effective % date Afghanistan $162 $1,701
 Afghanistan $162 $1,701 $2,552 01-Aug-07 Albania $147 $2,315 $3,473 01-Jan-05 * Algeria $222 $2,331 $3,497 01-Aug-07 Angola $400 $4,200 $6,300 01-Aug-07 Antigua and Barbuda (1 Apr. - 30 $337 $3,539 $5,308
MAXIMUM MONTHLY STIPEND RATES FOR FELLOWS AND SCHOLARS Jan 2019 COUNTRY USD DSA MAX RES RATE MAX TRV RATE Effective % date Afghanistan $162 $1,701
 Afghanistan $162 $1,701 $2,552 01-Aug-07 Albania $151 $2,378 $3,567 01-Jan-05 * Algeria $257 $2,699 $4,048 01-Aug-07 Angola $230 $2,415 $3,623 01-Aug-07 #N/A Antigua and Barbuda (1 Apr. - 30 #N/A #N/A
MAXIMUM MONTHLY STIPEND RATES FOR FELLOWS AND SCHOLARS Jan 2018 COUNTRY USD DSA MAX RES RATE MAX TRV RATE Effective % date Afghanistan $162 $1,701
 Afghanistan $162 $1,701 $2,552 1-Aug-07 Albania $147 $2,315 $3,473 1-Jan-05 Algeria $210 $2,205 $3,308 1-Aug-07 Angola $400 $4,200 $6,300 1-Aug-07 Antigua and Barbuda (1 Apr. - 30 $337 $3,539 $5,308 1-Aug-07
Table A10. Separate vulnerable road users On existing roads. Promote investment in public transportation. Conducted by an independent assessor
 Table A10 SAFER MOBILITY BY COUNTRY / AREA Country/area Vehicles There are policies that Road audits Number of registered vehicles walking and cycling investment in public transportation Separate vulnerable
IMPROVING SALES EFFECTIVENESS. John Kieffer Business Transformation Director
 IMPROVING SALES EFFECTIVENESS John Kieffer Business Transformation Director Working from a Position of Leadership and Growth Global Sales: $26.6 Billion (65% International) Net Income: $4.0 Billion R&D
CONVERSION FACTORS. Standard conversion factors for liquid fuels are determined on the basis of the net calorific value for each product.
 CONVERSION FACTORS The data which have been supplied by the countries in original units are converted to the common unit, terajoules (TJ), by using standard conversion factors or, in the case of solids,
Cambridge International Examinations Cambridge International Advanced Subsidiary and Advanced Level
 Cambridge International Examinations Cambridge International Advanced Subsidiary and Advanced Level *2029778719-I* GEOGRAPHY 9696/32 Paper 3 Advanced Human Options October/November 2015 INSERT 1 hour 30
International management system: ISO on environmental management
 International management system: ISO 14000 on environmental management Introduction In response to the growing interest from businesses in environmental standards, the International Standardization Institute,
I N T E R N A T I O N A L E N E R G Y A G E N C Y KEY WORLD ENERGY STATISTICS
 I N T E R N A T I O N A L E N E R G Y A G E N C Y KEY WORLD ENERGY STATISTICS 2008 INTERNATIONAL ENERGY AGENCY 9, rue de la Fédération 75739 Paris Cedex 15 www.iea.org S T KEY WORLD ENERGY STATISTICS A
Supply and Demand Data Methodology
 Copyright 2018 Reed Business Information Ltd. ICIS is a part of the RELX Group. Supply and Demand Data Methodology 27 July 2018 GLOSSARY & METHODOLOGY Regions North America: Canada, Mexico, USA. South
Gilflo ILVA Flowmeters
 control & instrumentation solutions Gilflo ILVA Flowmeters for steam, liquids and gases E X P E R T I S E S O L U T I O N S S U S T A I N A B I L I T Y G i l f l o I L V A Gilflo ILVA Flowmeters for steam,
Worksheet for world asbestos consumption calculations
 Worksheet for world asbestos consumption calculations Apparent consumption calculation made using production data available on 6-8-2015 from the USGS and trade data available on 6-5-2015 from the United
CONVERSION FACTORS. Standard conversion factors for liquid fuels are determined on the basis of the net calorific value for each product.
 CONVERSION FACTORS The data which have been supplied by the countries in original units are converted to the common unit, terajoules (TJ), by using standard conversion factors or, in the case of solids,
New requirements for Wood Packaging Material
 New requirements for Wood Packaging Material November, 2004 Content Background Basis for Regulating Objective Countries that have singed the agreement Wood packaging types Regulated wood packaging material
Global Food Security Index 2014:
 Global Food Security Index 2014: Project results Sponsored by 12 June 2014 Overview Methodology Results Feeding Asia-Pacific: Australia s role in regional food security Overview In 2012 the Economist Intelligence
MERCER TRS TOTAL REMUNERATION SURVEY THE KEY TO DESIGNING COMPETITIVE PAY PACKAGES WORLDWIDE
 MERCER TRS TOTAL REMUNERATION SURVEY THE KEY TO DESIGNING COMPETITIVE PAY PACKAGES WORLDWIDE MERCER TRS TOTAL REMUNERATION SURVEY THE KEY TO DESIGNING COMPETITIVE PAY PACKAGES WORLDWIDE CONSIDER THESE
Global Electrical Sustainability
 Quest: A Journal of Undergraduate Student Research Page 167 Global Electrical Sustainability Paper 12 By Sarah Budney and Alex Shepherd Paper 12 Quest: A Journal of Undergraduate Student Research Page
Puerto Rico 2019 SERVICES AND RATES
 SERVICES AND RATES FedEx International Solutions for your business Whether you are shipping documents to meet a deadline, saving money on a regular shipment or moving freight, FedEx offers a suite of transportation
WORKFORCE TURNOVER AROUND THE WORLD
 2017 WORKFORCE TURNOVER AROUND THE WORLD WORKFORCE TURNOVER AROUND THE WORLD AT A GLANCE GEOGRAPHY 92 COUNTRIES COVERED 4 REGIONS 103 MARKETS Americas Asia Pacific Europe Middle East and Africa DATA INCLUDED
International Solutions
 International Solutions Navigating better, faster, smarter all around the world. This is the Supply Change. The opportunity: What we do: We know that exporting goods to international markets can be complicated.
Global Food Security Index
 Global Food Security Index Project overview for the IFAMA workshop Sponsored by 18 June 2014 Overview Project goal: To establish an evaluative framework for national food systems to understand the drivers
SPOTLIGHT ON GLOBAL HR
 Oracle Release 11 SPOTLIGHT ON GLOBAL HR Copyright 2014 Oracle and/or its affiliates. All rights reserved. Talent Management Cloud Release Themes Industry Global Local Configure Global Management Operational
Per Capita Consumption 2013
 Issue 1, October 2013 Per Capita Consumption 2013 Country-Specific Analysis 2005-2012 Including Trade, Natural and Manmade Fiber Output, Spunbonds, Cotton Inventory Changes and Worn Clothing Trade Andreas
Puerto Rico 2014 SERVICES AND RATES
 SERVICES AND RATES FedEx International Solutions for your business Whether you are shipping documents to meet a deadline, saving money on a regular shipment or moving freight, FedEx offers a suite of transportation
An international heritage of excellence A world premiere accounting & consulting organisation
 An international heritage of excellence A world premiere accounting & consulting organisation Local perspective, global focus. Making a difference for the future. 380 PRACTICES; 119 COUNTRIES; Over 13,500
CONVENTION FOR THE UNIFICATION OF CERTAIN RULES FOR INTERNATIONAL CARRIAGE BY AIR DONE AT MONTREAL ON 28 MAY 1999
 State CONVENTION FOR THE UNIFICATION OF CERTAIN RULES FOR INTERNATIONAL CARRIAGE BY AIR DONE AT MONTREAL ON 28 MAY 1999 Entry into force: The Convention entered into force on 4 November 2003*. Status:
100% 80% 60% 40% 20% Spain Finland China Chile Tunisia. Mali. Egypt. Benin
 Diets Food consumption is now more centred on a narrow base of staple grains and on increased consumption of meat and dairy products. Starchy staples such as roots and tubers are relatively less important
Supplement of Mitigation of agricultural emissions in the tropics: comparing forest landsparing options at the national level
 Supplement of Biogeosciences, 12, 4809 4825, 2015 http://www.biogeosciences.net/12/4809/2015/ doi:10.5194/bg-12-4809-2015-supplement Author(s) 2015. CC Attribution 3.0 License. Supplement of Mitigation
Note verbale dated 20 July 2005 from the Permanent Mission of Costa Rica to the United Nations addressed to the Secretary-General
 United Nations Distr.: 26 July 2005 Original: English Fifty-ninth session Agenda items 53 and 55 Question of equitable representation on and increase in the membership of the Security Council and related
Global Guide to Natural Gas Utilities Report Edition 1, 2012
 Global Guide to Natural Gas Utilities Report Edition 1, 2012 Market Intelligence Carbon reduction commitments and low gas prices relative to other fossil fuels have made natural gas more attractive for
Schedule of Accreditation issued by United Kingdom Accreditation Service 2 Pine Trees, Chertsey Lane, Staines-upon-Thames, TW18 3HR, UK
 2 Pine Trees, Chertsey Lane, Staines-upon-Thames, TW18 3HR, UK Accredited to ISO/IEC 17021:-1: 2015 to provide food safety 5th Floor 66 Prescot Street London E1 8HG United Kingdom Contact: Mr Flavio Gomes
3.0 The response of the United Nations system
 The response of the United Nations system 3.0 The response of the United Nations system 3.1 The need to set targets and to monitor progress towards achieving those targets There is a well recognized need
Reference Code: GDAE6521IDB. Publication Date: March 2015
 Hydro Power in France, Market Outlook to 2025, Update 2015 Capacity, Generation, Levelized Cost of Energy (LCOE), Investment Trends, Regulations and Company Profiles Reference Code: GDAE6521IDB Publication
2015 MERCER LIFE SCIENCES REMUNERATION SURVEY
 2015 MERCER LIFE SCIENCES REMUNERATION SURVEY MAKE SMART COMPENSATION DECISIONS BY JOINING THE 2015 MERCER TOTAL REMUNERATION SURVEY FOR THE LIFE SCIENCES SECTOR THE LIFE SCIENCES REMUNERATION SURVEY PROVIDES
SAMPLE. Reference Code: GDAE6535IDB. Publication Date: May 2015
 Hydropower in Austria, Market Outlook to 2025, Update 2015 Capacity, Generation, Levelized Cost of Energy (LCOE), Investment Trends, Regulations and Company Profiles Reference Code: GDAE6535IDB Publication
SAMPLE. Reference Code: GDAE6529IDB. Publication Date: April 2015
 Hydropower in Indonesia, Market Outlook to 2025, Update 2015 Capacity, Generation, Levelized Cost of Energy (LCOE), Investment Trends, Regulations and Company Profiles Reference Code: GDAE6529IDB Publication
Sustainable Forest Management (SFM)
") 11 Sustainable Forest Management (SFM) 27/10/2012 Exercise XXX LEARNING OBJECTIVES 2 At the end of this session participants will be able to: explain the Sustainable Forest Management and its factors,
11 Sustainable Forest Management (SFM) 27/10/2012 Exercise XXX LEARNING OBJECTIVES 2 At the end of this session participants will be able to: explain the Sustainable Forest Management and its factors,
Directory, Database NRIs (Non Resident Indians) NRIs (Non Resident Indians) Directory/Database (5th Edition)
 NRIs (Non Resident Indians) Directory/Database (5th Edition)") Directory, Database NRIs (Non Resident Indians) NRIs (Non Resident Indians) Directory/Database (5th Edition) NIIR Project Consultancy Services (NPCS) 1/5 Format: CD-Rom Book Code: NID9 Price: Rs. 8,850.00
Directory, Database NRIs (Non Resident Indians) NRIs (Non Resident Indians) Directory/Database (5th Edition) NIIR Project Consultancy Services (NPCS) 1/5 Format: CD-Rom Book Code: NID9 Price: Rs. 8,850.00
Supply and Demand Data Methodology
 Copyright 2014 Reed Business Information Ltd. ICIS is a part of the Reed Elsevier plc group Supply and Demand Data Methodology 1 July 2014 GLOSSARY & METHODOLOGY Regions Africa: Algeria, Angola, Cameroon,
Forest Stewardship Council
 Absolute Terminations 02/02/205 Page of Global FSC certified companies: by country PUERTO RICO 4 FINLAND 84 BAHRAIN GUATEMALA 28 MACEDONIA 3 VIETNAM 003 CONGO, THE REPUBLIC OF 4 NEW ZEALAND 284 KOREA,