A HYDROLOGY MODEL FOR MIMICKING PRE AND POST DEVELOPMENT RUNOFF VOLUMES
|
|
|
- Angelina Barrett
- 6 years ago
- Views:
Transcription
1 A HYDROLOGY MODEL FOR MIMICKING PRE AND POST DEVELOPMENT RUNOFF VOLUMES Mr. Randel Lemoine AUTHOR: Fort Benning, DPW Engineering Division, Meloy Dr. Bldg 6, RM 320-T, Fort Benning, Georgia, 315. REFERENCE: Proceedings of the 2011 Georgia Water Resources Conference, held April 11-13, 2011, at the University of Georgia. Abstract. The Energy Independence and Security Act, passed by Congress in 2007, included a section commonly referred to as EISA 438. This section of the Act requires any new development or redevelopment of federal facilities, involving more than 5,000 square feet, to retain on-site a sufficient volume of rainfall to mimic the pre-development hydrology. The retained rainfall must be dissipated by means of infiltration into the ground, evapo-transpiration, or reuse. It cannot be directly discharged into a storm drain or surface water. Therefore, detention basins are not an appropriated best management practice (BMP) for complying with this regulation, since they have direct discharges. The Federal Environmental Protection Agency (EPA) published a guidance document for complying with the regulation entitled, Technical Guidance on Implementing the Stormwater Runoff Requirements for Federal Projects under Section 438 of the Energy Independence and Security Act. This guidance document presents two options for estimating the retention capacity for designing best management practices to comply with this regulation. Option one is based on a statistical analysis that requires 95% of the average annual rainfall be retained and dissipated. The problem with this option is that it fails to consider soil infiltration or changes in ground cover, which are the primary factor influencing the runoff volume. This option is appropriate for site planning estimates, but not BMP design. Option two puts forward the concept of modeling the pre-development and post-development hydrology to estimate the appropriate storage capacity. Although Option two suggests a continuous simulation model, the method presented in Appendix A of this guidance document is an analysis for a single 24-hour rainfall event. The single event analysis has the problem that it fails to consider the dissipation rate, and subsequently it fails to consider the actual storage volume available for the next rainfall. Described in the following paragraphs is the Retention Volume Simulation Model (RVSM). The RVSM is a continuous simulation, volume based hydrology RVSM, appropriate for estimating the retention capacity for BMPs to comply with new EISA 438 regulation. INTRODUCTION Most hydrology models available today were created to estimate runoff and flow rates from a single 24-hour rainfall event. These models do not directly estimate volume, nor do the models account for the dissipation of capture rain water between rainfall events. Usually it takes a couple of days for the water held on the ground to evaporate or infiltrate. Yet often there can be rainfall events that occur within a day or two. Therefore, it is essential that the model be a continuous simulation volume-based [1] hydrology model over a sufficient period of time to predict pre-development and post-development performance. The curve number hydrology model, known as Technical Report 55 [2] (TR-55) from the National Resources Conservation Services provides volume estimates for a single 24-hour event. Since water remaining on the surface or saturating the soil from a previous rainfall has the effect as if it were part of the subsequent rainfall, the TR-55 model can be transformed into a continuous simulation by: adding the retained water from the previous day (minus any dissipated water) to the rainfall for the next day. RVSM SETUP The RVSM is setup on an Excel spreadsheet using about fifty years of continuous local rainfall data to minimize variability in the simulation results. The estimate retained moisture volume (Rn) from the previous day is added to the rainfall data to calculate the adjusted precipitation (Pa). The adjusted precipitation and the S value associated with the pre-development CN number are used in TR-55 s runoff equation to calculate the runoff volume, on a continuous base. The ground moisture volume is the difference between the adjusted precipitation volume and the calculated runoff volume, minus the volume of water dissipated by infiltration and evapo-transpiration (Q d ). The RVSM assumes that the daily dissipated water volume equals the maximum precipitation volume before runoff would begin, which corresponds to TR-55 s initial abstraction (Ia). P a = P + R n R n = Pa Qn - Q d Q d I a... (Model Assumption) I a = S...(eq. 2-2, TR-55) S = (1000/CN) 10...(eq. 2-4, TR-55) Q n = (P a S) 2 / (P a + S)... (eq. 2-3, TR-55) P = 24-Hour Precipitation P a = Precipitation adjusted for retained moisture R n = Retained moisture Q d = Dissipation volume from infiltration and evapo-transpiration I a = Initial abstraction S = Potential maximum retention after runoff begins Qn = Pre-Development Runoff NOTE: All volumes are unit volumes of inches over the catchment area.)

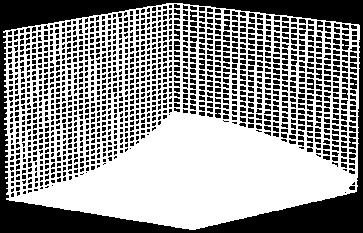
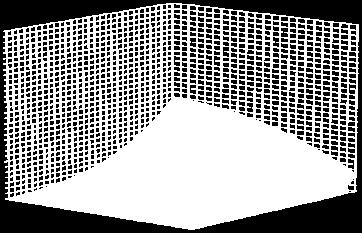
2 RVSM SET UP The post-development RVSM is set up to simulate the performance of a best management practice (BMP) intended to retain a given volume of runoff and dissipate that water through infiltration into the ground, evaporation and plant transpiration into the air, or the reuse of the water for such things as irrigation or gray-water for flushing toilets. The RVSM follows the conservation of mass principle, where the retained volume equals the sum of the water coming into the BMP minus the sum of the water leaving (illustrated below in FIGURE 1). The water coming into the BMP (Q 1 ) is calculated using the TR-55 runoff equation for the post construction surface conditions. The water contained in the BMP (V (n) ) is either dissipated by whatever means intended for the BMP; evapo-transpiration (Q ET ), infiltration (Q INF ), or reuse (Q R ) or any combination, and if the retention capacity is exceeded there is an overflow discharge (Q 2 ). standard tables found in TR-55 which are based on the hydrologic soil type and ground cover for the catchment area. The values for both the maximum retention volume and daily dissipation volume are initially assumed in the set up of the RVSM. A comparison is made between the predevelopment runoff (Qn) and the post-development BMP discharges (Q 2 ). The maximum retention volume or the daily dissipation volume is varied in an iterative process until the pattern of post-development discharges comes closest to mimicking the pre-development runoff. The standard Rainfall-Runoff Chart used in TR-55 can be used to compare the patterns of post-development discharges with the pre-development runoff generated by the RVSM (FIGURE 2). The resulting chart shows that the runoff and discharge patterns are not identical, nor will any changes to the four variables bring those patterns to precisely coincide. This difference in the two patterns can be explained by the fact that the post-development BMP has a single point discharge, whereas the discharge from a pre-development condition normally as multiple discharges from numerous small depressions. Q 1 Q ET Q 2 V (n) V (r) Q INF Q R FIGURE 1. Continuity Diagram for Volume Control BMPs Q 1 = (P S) 2 / (P + S)... (eq. 2-3, TR-55) Q D = Q ET + Q INF + Q R Q 1 = Q D + Q 2 V (n) = Q 1 + V (n-1) - Q D if V (n) > V R then Q 2 = V (n) V (r) else Q 2 = 0 Q 1 = Post-Development Runoff Volume into the BMP Q D = Daily Dissipation Volume which is the sum of the daily evapo-transpiration, infiltration, and reuse volumes P = 24-Hour Precipitation S = Potential maximum retention after runoff begins V (n) = Volume of water retained by the BMP V (n-1) = Volume of water retained by the BMP the previous day V (r) = Maximum Retention Capacity of the BMP Q 2 = Overflow discharge from the BMP into a drain pipe or surface water (NOTE: All volumes are unit volumes of inches over the catchment area.) COMPARING PRE AND POST VOLUMES The RVSM consists of four variables; the pre-development and post-development curve numbers (CN n and CN d respectively), the BMP s maximum retention volume (Vr), and the daily dissipation volume (QD). The curve numbers are determined by using FIGURE 2. Typical Pre & Post Runoff Volume Comparison If the patterns don t coincide, What constitutes a mimicking of the pre-development runoff volume? A comparison of volumes or of frequencies can be used as a basis for answering that question. Since the goal of the regulation is to mimic the pre-development volume, it would intuitively seem appropriate to compare a summation of the post-development discharge volumes with the pre-development runoff volumes. However, since the rainfall data and resulting volumes include the more extreme, infrequent rainfalls, the resulting BMP retention volume or daily dissipation volume will be skewed higher than

3 necessary to meet the stream bank protection objective of the regulation. It is generally accepted that stream bank erosion occurs whenever rainfalls exceed approximately the two-year return frequency. Therefore, matching the frequency of discharges that exceed the two-year runoff volume is a better indicator for assessing whether a BMP mimics the pre-development hydrology. The RVSM makes this comparison by doing a conditional count of the runoff volumes and discharge volumes that exceed the pre-development runoff volume for a two-year rainfall. Once the RVSM is set up, the BMP s retention volume or dissipation rate is then adjusted through an iterative process until the frequencies equal. The modeler will discover that there is actually a range of retention volumes or daily dissipation volumes that satisfy this equality of frequencies. This situation is caused by the fact that the volumes are real numbers whereas the frequencies are integer numbers. Therefore, it is recommended that the average between the lowest and highest values satisfying the equality of frequencies be the solution value used. RELATING DISSIPATION TO The daily dissipation volume can be related to a BMP s retention volume in terms of how many days it would take to empty the BMP after it was filled, which is referred to as the Retention Recovery Time (RRT). The RRT is calculated by dividing the BMP s retention volume by the daily dissipation rate. The RRT affects the size of a BMP s design retention volume, and the serviceability of reuse type BMPs. A shorter RRT will result in a smaller required retention volume. While a longer RRT means that the captured runoff will more likely meet the reuse demand and be less likely to require a supplemental source of water. and RRTs. The macro places these results in a table of predevelopment CN numbers verses post-development CN numbers for a given RRT. Tables for RRTs of 1, 2, 3, 4, 5, 6, 7, 10, 14, 21, and 28 days are recommended. Once the tables are created they can be used to provide a consistent design and evaluation of any proposed volume control BMP within the local area. DEVELOPING A BMP EQUATION A best fit equation for computing a BMP s required retention volume can be developed using the data from the table associated with the highest retention recovery time (28 Days). The resulting equation will calculate the required retention volume as a function of the pre and post development CN numbers, and the retention recovery time. The process of creating this equation begins by plotting a three-dimensional chart (FIGURE 3) of retention volumes verses CN numbers from the modeling data table with the shortest retention recovery time (3 days). This chart will be used to compare the calculated retention values with the RVSM results to confirm that the equation results are a close fit with the modeling results. CREATING A TABLE OF VOLUMES The RVSM consists for four primary variables; pre and post CN numbers, BMP retention volume, and RRT. Although, the setup for the RVSM is not complicated, the results could vary between different modelers. These variations may be caused by using different sets of local rainfall data, or deviations in the spreadsheet setup. A local reviewing agency can avoid this problem by using the RVSM to pre-determine the BMP retention volumes required for various combinations of pre-development and post-development CN numbers, and RRTs. The results from modeling each combination of variables can be placed in a table and published as the design standard. The process previously described can be automated using a macro to evaluate all the combinations of pre and post CN numbers FIGURE 3. Retention Volume Chart for 28-Day RRT Next, two two-dimensional charts (FIGURE 3) are plotted. One chart is of the retention volumes for the highest post-development CN (CN d =). The other is of the retention volumes for the lowest pre-development CN (CN n =33). A best-fit equation is derived from the charted data. EQUATION 1: V 1 = f(cn d ) EQUATION 2: V 2 = f((cn n )
 of the retention volumes for the 28-Day RRT is derived by adding Equations 1")
 = f(cn d ) + f(cn n ) Vr (35,,28) Equation 3 is used in creating a table of calculated retention volumes, given")
, provides an indication or measure of how close the equation matches the retention volumes")
4 28 DAY RRT, CNd = Vr = y Vr = y CNn = X y = -015x x CNd = X y = 7E-09x 6 FIGURE 4. Best Fit Equations Charts A best fit equation approximating the three-dimensional surface created by the chart (FIGURE 3) of the retention volumes for the 28-Day RRT is derived by adding Equations 1 and 2 and subtracting value for the retention volume with a pre and post development curve number of 35 and respectively (Vr (35,) ). The general form of the combined equations is: EQUATION 3: V r = f(cn d, CN n, RRT 28 ) = f(cn d ) + f(cn n ) Vr (35,,28) Equation 3 is used in creating a table of calculated retention volumes, given an RRT of 28 days. A statistical evaluation, similar to standard deviation, called the Standard Error of Estimate [3] (StdEE), provides an indication or measure of how close the equation matches the retention volumes derived by the RVSM. A visual comparison can also be made by creating a three-dimensional chart of the RCSM retention volumes and placing it next to an identical 3-D chart of calculated values derived from Equation 3 (FIGURE 5). ADDING RECOVERY TIME TO THE EQUATION Equation 3 is derived from the RVSM results for a given Retention Recovery Time of 28 days. Separate equations for the different retention recovery times could be developed by repeating the previous steps for each table created with different assumed retention recovery times. However, a more useful alternative is to expand Equation 3 previously developed for the 28-Day RRT to include the retention recovery time as a function variable. The result is a single equation to calculate the retention volume as function of the other three primary variables CN n, CN d, and RRT (Equation 5). An observation of the three-dimensional charts for each table having different RRTs will note that the volumes are zero when the pre-development CN is greater than or equal to the post-development CN, regardless of the retention 28 DAY RRT, CNn = VOLUMES vs PRE & POST CURVE NUMBERS VOLUMES vs PRE & POST CURVE NUMBERS VOLUME V r 28 DAY RRT FIGURE 5. 3D Surface Charts comparing Simulation Results with Equation Results for the 28-Day RRT (StdEE = 0) VOLUME RATIO ( Vr/Vr (28) ) recovery time. Also, the primary difference between the various chart surfaces is the slope, which decreases as the retention recovery times become shorter. Therefore, in general terms, the retention recovery time variable can be incorporated into the function by multiplying the function just developed for the 28-Day RRT by a function for RRT (Equation 4). 28 DAY RRT VOLUME RATIO vs RECOVERY TIME "RRT" Vr / Vr(28) = (RRT) FIGURE 6. Best Fit Equation Chart for various RRTs RECOVERY TIME "RRT" (Days) Equation Ratio Vr/Vr(28) Model Ratio Vr/Vr(28)
5 EQUATION 4: f((rrt) = f(vr (35,, RRT) / Vr (35,, 28) ) EQUATION 5: f(cn d, CN n, RRT) = f(cn d, CN n, Vr (35,, 28) ) G f((rrt) The function for the retention recovery time f((rrt) is a ratio derived by taking the value of the retention volume from each of the tables for the various RRTs where CN n equals 33 and CN d equals, and dividing them by the retention volume from the table having a 28-Day RRT, which is placed in a chart of the retention volume ratio verse retention recovery time (FIGURE 6). A regression equation is derived from these plotted points, which forms the function, f((rrt). A statistical evaluation is performed to compare the values derived from the equation with the value generated by the RVSM to determine the standard error of estimate. The value determined by standard error of estimate is a measure of the range of deviation for % of the calculated values relative to the RVSM values. Figure 7 shows the development of the equations and the associated standard error of estimate that was created using rainfall data from the airport in Columbus, Georgia. A visual comparison can also be made by creating 3-D charts of the retention volumes generated from by RCSM for each given RRT and placing it alongside 3-D charts of the values derived using Equation 4 (FIGURES 8a, 8b, 9a & 9b). VOLUME EQUATION DEVELOPED FOR THE COLUMBUS, GA AREA EQUATION 1 f(cn d, RRT 28 ) = Vr = 7E-09CNd 6 EQUATION 2 f(cn n, RRT 28 ) = Vr = - 015(CNn) (CNn) Vr (35,,28) = 51 COMBINING THE ABOVE EQUATIONS EQUATION 3 f(cn d, CN n, RRT 28 ) = 7E-09CN d 6-015(CN n ) (CN n ) EQUATION FOR THE RECOVERY TIME RATIO EQUATION 4 f((rrt) = Vr (35,,RRT) / Vr (35,,28) = (RRT) EQUATION 5 FINAL EQUATION Design Retention Volume Vr = f(cn d, CN n, RRT ) = f(cn d, CN n, RRT 28 ) X f((rrt) = [7E-09(CN d ) 6-015(CN n ) (CN n ) ] X (RRT) STATISTICAL EVALUATION StdEE = ±0 inches FIGURE 7. The Retention Volume Equation for the Columbus, Georgia area CONCLUSION The result is a single equation for estimating the required retention volume as a function of the pre and post development curve numbers and an estimated daily dissipation volume (i.e. the retention recovery time, RRT). This equation can be used for designing or evaluating any BMP intended to reduce the post-development discharge volume to match the pre-development runoff volume that will be located with the region where the rainfall data was collected. This can be applied to any BMP that has a retention and dissipation function such as bio-swales, rain gardens, terraces, porous pavements, and vegetative roofs. The RVSM and the equation developed from the modeling results are a more precise estimate of a BMP s performance then the one size fits all statistical design parameter presented in Option 1 of the EPA s guidance manual. CONTINUING DISCUSSION OF BMP VOLUME CONTROL DESIGN The dissipation of the retained runoff is a key element in the design of BMPs intended to reduce the discharge volume sufficiently to mimic pre-development runoff volumes. The primary means for dissipating this water is through infiltration and evaporation. The dissipation rate for both is a function of area. The larger the area that can be used for infiltration, or the larger the surface area for plants and exposure to the atmosphere, the faster the water will be dissipated and subsequently reduce the required storage volume. Therefore, BMPs intended for runoff volume control require that the captured runoff be spread over as large an area as possible, which requires a paradigm shift in our perspectives about the function and design of our drainage systems. The current flow control paradigm is to collect, transport, detain, and then discharge the rainwater. The new volume control paradigm will be to collect, distribute, retain and dissipate the rainwater. Rather than collecting the rainwater into small, remote areas such as detention or retention ponds, the drainage systems should be designed to distribute the runoff as close to the collection area as possible and spread it over the largest possible surface or subsurface area. The new paradigm can present a problem with conflicts with land use, because it may require an increased use of land resources. Mitigating this conflict will require creative drainage system designs that blend with the surrounding landscape and possibly become an enhancement that adds value to the property and the community. Porous pavements become attractive because they serve dual purposes; plus they can enhance safety and reduce the nuisance caused by flowing water or puddles of water on the paved surface. Vegetated roofs not only
6 reduce the runoff volume but reduce a building s HVAC energy costs and can increase the longevity of the roof. Also, it makes sense to find ways to reuse the rainwater. Since the expenditure of financial resources is already required for the capture and clean-up of the runoff, we must begin to see this as a valuable resource rather than a filthy nuisance. This new paradigm, along with better design tools such as the one presented here, can guide us in creating better, more sustainable communities in closer harmony with the natural environment. LITERATURE CITED [1] Andrew J. Reese, Stormwater Journal, Volume-Based Hydrology, (September 2009), 10-6, pp -67 [2] U.S. Department of Agriculture, Natural Resources Conservation Service, Urban Hydrology for Small Watersheds, Technical Release 55, (June 16), pp 2-1 [3] David M. Levine, Ph.D. and David F. Stephan, Even You Can Learn Statistics, Pearson Prentice Hall, (2005), pp 1 GLOSSARY OF TERMS catchment area is the upstream area that collects the rainfall and gathers the runoff into a place of interest such as a discharge point or BMP. detention is the temporary storage of runoff to limit the discharge flow rate. evapo-transpiration is the combined processes of changing water into vapor through evaporation and plant transpiration. gray-water is water that has not been treated to meet drinking water standards. macro is a subroutine program written within a computer application such as Microsoft Excel for performing repetitious operations or calculation solutions to complex functions. retention although commonly confused with retention, it is the storage of water, but without any discharge standard error of estimate is a statistical indicator of the deviation between a given data set and a set of calculated values, and is a measure of the range within which 67% of the given data is from the calculated values.


7 VOLUMES vs PRE & POST CURVE NUMBERS FIGURE 8a. Charts of RVSM Results 1 5 Day RRTs 1 DAY RRT VOLUMES vs PRE & POST CURVE NUMBERS DAY RRT VOLUMES vs PRE & POST CURVE NUMBERS DAY RRT VOLUMES vs PRE & POST CURVE NUMBERS DAY RRT VOLUMES vs PRE & POST CURVE NUMBERS - 5 DAY RRT VOLUMES vs PRE & POST CURVE NUMBERS FIGURE 8a. Charts of Equation Results 1 5 Day RRTs 1 DAY RRT VOLUMES vs PRE & POST CURVE NUMBERS DAY RRT VOLUMES vs PRE & POST CURVE NUMBERS DAY RRT VOLUMES vs PRE & POST CURVE NUMBERS DAY RRT VOLUMES vs PRE & POST CURVE NUMBERS - 5 DAY RRT


8 VOLUMES vs PRE & POST CURVE NUMBERS DAY RRT VOLUMES vs PRE & POST CURVE NUMBERS DAY RRT VOLUMES vs PRE & POST CURVE NUMBERS DAY RRT VOLUMES vs PRE & POST CURVE NUMBERS - 21 DAY RRT VOLUMES vs PRE & POST CURVE NUMBERS VOLUMES vs PRE & POST CURVE NUMBERS - VOLUMES vs PRE & POST CURVE NUMBERS - VOLUMES vs PRE & POST CURVE NUMBERS - 7 DAY RRT 10 DAY RRT 14 DAY RRT 21 DAY RRT FIGURE 9a. Charts of RVSM Results 7 29 Day RRTs VOLUMES vs PRE & POST CURVE NUMBERS FIGURE 9b. Charts of Equation Results 7 28 Day RRts 28 DAY RRT
Appendix A. Compliance Calculator Guidance
 Compliance Calculator Guidance Appendix A Appendix A. Compliance Calculator Guidance A.1 Introduction The Center for Watershed Protection created the compliance calculator spreadsheet to allow a designer
Water Balance Methodology
 Water Balance Methodology Integrating the Site with the Watershed and the Stream March 2012 An initiative under the umbrella of the Water Sustainability Action Plan for British Columbia Water Balance Methodology
n4.1 Site Assessment for Runoff Reduction Requirements
 Chapter 4 Smart Design for Stormwater Management 4.1 Site Assessment for Runoff Reduction Requirements 4.2 Site Water Balance 4.3 Runoff Reduction Volume 4.4 Runoff Treatment Volume 4.5 Flood Control and
Hydrologic Study Report for Single Lot Detention Basin Analysis
 Hydrologic Study Report for Single Lot Detention Basin Analysis Prepared for: City of Vista, California August 18, 2006 Tory R. Walker, R.C.E. 45005 President W.O. 116-01 01/23/2007 Table of Contents Page
Pennsylvania Stormwater Best Management Practices Manual. Chapter 3. Stormwater Management Principles and Recommended Control Guidelines
 Pennsylvania Stormwater Best Management Practices Manual Chapter 3 Stormwater Management Principles and Recommended Control Guidelines 363-0300-002 / December 30, 2006 Chapter 3 Stormwater Management Principles
Chapter 6. Hydrology. 6.0 Introduction. 6.1 Design Rainfall
 6.0 Introduction This chapter summarizes methodology for determining rainfall and runoff information for the design of stormwater management facilities in the City. The methodology is based on the procedures
Hydrology for Drainage Design. Design Considerations Use appropriate design tools for the job at hand:
 Hydrology for Drainage Design Robert Pitt Department of Civil and Environmental Engineering University of Alabama Tuscaloosa, AL Objectives for Urban Drainage Systems are Varied Ensure personal safety
Water Resources Management Plan
 B u r n s v i l l e M i n n e s o t a Water Resources Management Plan - Volume Control / Infiltration Worksheet This Appendix contains a worksheet and related information that can be used for evaluating
August Chapter 1: Introduction to the Manual
 Chapter 1: Introduction to the Manual Section 1.1 Purpose of the Manual The purpose of this manual is threefold: 1. To protect the waters of the State of New York from the adverse impacts of urban stormwater
Impact of Increased Stormwater Runoff on Urban Drainage Systems
 Impact of Increased Stormwater William E. Spearman, III, PE APWA Stormwater Summit San Antonio, TX September 12, 2007 Contact Information: William E. Spearman, III, PE Member, APWA National Water Resources
LID PLANTER BOX MODELING
 LID PLANTER BOX MODELING Clear Creek Solutions, Inc., 2010 Low Impact Development (LID) planter boxes are small, urban stormwater mitigation facilities. They are rain gardens in a box. WWHM4 provides the
Section 1 - Introduction
 VERSION 1.0 Stormwater Solutions for Residential Sites Section 1 - Introduction Prepared for EcoWater Solutions A Department of Waitakere City Council 113 Central Park Drive Henderson WAITAKERE CITY November
TMDL and Stormwater Regulations & Policy: Recent Developments and their Implications for MS4 Permit Holders
 14 th Annual EPA Region 6 Stormwater Conference 26 June 2012 TMDL and Stormwater Regulations & Policy: Recent Developments and their Implications for MS4 Permit Holders Michael F. Bloom, PE, CFM, BCEE
Review of State and Federal Stormwater Regulations November 2007
 Review of State and Federal Stormwater Regulations November 2007 By: James T. Spaulding, PE, CPESC Joseph M. Ducharme, Jr., PE TTG ENVIRONMENTAL CONSULTANTS, LLC 27 LOCKE ROAD, CONCORD, NH 03301-5301 TELEPHONE:
Decatur, Georgia Stormwater Management Policy Guidelines. DRAFT November 5, 2014
 Decatur, Georgia Stormwater Management Policy Guidelines Stormwater Management Policy Guidelines Decatur, Georgia STORMWATER MANAGEMENT POLICY GUIDELINES 1.0 Introduction... 3 2.0 Determining Predevelopment
A Case for the Design and Modeling of BMP Infiltration and LID Techniques. By: Bob Murdock
 A Case for the Design and Modeling of BMP Infiltration and LID Techniques 2009 IAFSM Annual Conference 2009 IAFSM Annual Conference By: Bob Murdock Presentation Outline 1. Runoff Reduction (RR) and Low
WSUD On-site Detention in xprafts 2013
 WSUD On-site Detention in xprafts 2013 Content 1. Introduction of ODS 2. General a. Impervious Area b. Pervious Area Capture c. Average Allotment Density d. Developed Area/Total Area 3. On-site Detention
Comox. Valley A. Rainwater Benefits. Six
 Comox Valley Local Governments Showcase A Regional Response to Infrastructure Liability Rainwater Management in a Watershed Context: Do More With Less & Achieve Stream Health Benefits Six in a series published
Design Handbook. Low Impact Development Best Management Practices
 Design Handbook for Low Impact Development Best Management Practices Prepared by: 9/2011 Riverside County Flood Control and Water Conservation District 1995 Market Street Riverside, CA 92501 TABLE OF CONTENTS
SWMM5 LID Control for Green Infrastructure Modeling
 SWMM5 LID Control for Green Infrastructure Modeling Ohio Water Environment Association Collection Systems Workshop Matt McCutcheon, E.I. Water Resources Engineer CDM Smith May 9, 2013 11:15 AM 11:45 AM
The MASMA and Sustainable Drainage Systems
 RLD 512 LANDSCAPE HYDROLOGY The MASMA and Sustainable Drainage Systems Dr Naser Ghani PhD, P.Eng, MIEM, MASCE, MACEM anaser@usm.my www.hbp.usm.my/naser ROOM 104 E49 MASMA The main focus of Urban Storm
Appendix F. Flow Duration Basin Design Guidance
 Appendix F Flow Duration Basin Design Guidance Appendix F FINAL REPORT F:\SC46\SC46.31\HMP Mar 05\Appendices\Appendix F FLY_HMP.doc MARCH 2005 Appendix F Flow Duration Basin Design Guidance Prepared by
VOLUME CONTROL using Inter-Event Dry Periods. Stormwater Management Academy UNIVERSITY OF CENTRAL FLORIDA
 VOLUME CONTROL using Inter-Event Dry Periods Stormwater Management Academy UNIVERSITY OF CENTRAL FLORIDA O u t l i n e Why? Basic Principles Specifications and Regulations Watershed Abstractions The VIV
Planning Considerations for Stormwater Management in Alberta. R. D. (Rick) Carnduff, M. Eng., P. Eng. February 20, 2013.
 Carnduff, M. Eng., P. Eng. February 20, 2013.") Planning Considerations for Stormwater Management in Alberta R. D. (Rick) Carnduff, M. Eng., P. Eng. February 20, 2013 Photo Optional Purpose The purpose of urban stormwater management is to provide solutions
Planning Considerations for Stormwater Management in Alberta R. D. (Rick) Carnduff, M. Eng., P. Eng. February 20, 2013 Photo Optional Purpose The purpose of urban stormwater management is to provide solutions
CENTRAL COAST POST-CONSTRUCTION REQUIREMENTS IMPLEMENTATION GUIDANCE SERIES 1
 CENTRAL COAST POST-CONSTRUCTION REQUIREMENTS IMPLEMENTATION GUIDANCE SERIES 1 SERIES ISSUE #2: DECENTRALIZED STORMWATER MANAGEMENT TO COMPLY WITH RUNOFF RETENTION POST-CONSTRUCTION STORMWATER CONTROL REQUIREMENTS
Implementing Stormwater Management through Split-Flow Drainage Design
 Implementing Stormwater Management through Split-Flow Drainage Design Stuart Patton Echols PhD, ASLA, RLA Assistant Professor - Department of Landscape Architecture 210 Engineering Unit D Center for Watershed
Adjusting NRCS Curve Number for Rainfall Durations Less Than 24 Hours
 Journal of South Carolina Water Resources Volume 3, Issue 1, Pages 43-47, 2016 Adjusting NRCS Curve Number for Rainfall Durations Less Than 24 Hours Michael E. Meadows AUTHOR: Associate Professor, Department
Center for Watershed Protection Howard County Planning & Zoning Stormwater Maintenance, LLC
 Environmental Site Design (ESD) and Innovative Technology Introduction In October 2011, the Maryland Department of the Environment (MDE) convened a panel (see Table 1 below) to determine how to evaluate
Low Impact Development in Western WA Municipal Stormwater Permits
 Low Impact Development in Western WA Municipal Stormwater Permits USGS Tacoma Office September 19, 2012 E-mail: eobr461@ecy.wa.gov ttp://www.ecy.wa.gov/programs/wq/stormwater/municipal/index.html Municipal
Nose Creek Watershed Partnership NOSE CREEK INTERNAL DRAINAGE AREAS STUDY FINAL REPORT MAY, 2013
 NOSE CREEK INTERNAL DRAINAGE AREAS STUDY FINAL REPORT MAY, 2013 NOSE CREEK WATERSHED PARTNERSHIP NOSE CREEK INTERNAL DRAINAGE AREAS STUDY Final Report (29123 001 00) May, 2013 Suite 260, East Atrium, 2635
Porous Pavement Flow Paths
 POROUS PAVEMENT MODELING Clear Creek Solutions, Inc., 2010 Porous pavement includes porous asphalt or concrete and grid/lattice systems (nonconcrete) and paving blocks. The use of any of these types of
Effect of Land Surface on Runoff Generation
 Effect of Land Surface on Runoff Generation Context: Hydrologic Cycle Runoff vs Infiltration Infiltration: Process by which water on the ground surface enters the soil Runoff: Water (from rain, snowmelt,
Incorporating Green Infrastructure for Stormwater Management at Airports
 Airport Cooperative Research Program Project Panel 02-62: Incorporating Green Infrastructure for Stormwater Management at Airports Eduardo N. Tovar, PE TX Manager Systems Performance DFW International
Detention Pond Design Considering Varying Design Storms. Receiving Water Effects of Water Pollutant Discharges
 Detention Pond Design Considering Varying Design Storms Land Development Results in Increased Peak Flow Rates and Runoff Volumes Developed area Robert Pitt Department of Civil, Construction and Environmental
Sustainable Water Resource Practices
 Sustainable Water Resource Practices This section is related to and shoudl be read in conjunction with the Land Use Element, and Conservation Element. Implementing sustainable water resource practices
Design Example Residential Subdivision
 Design Example Residential Subdivision Rhode Island Stormwater Design and Installation Standards Manual December 2010 Public Training March 22, 2010 Richard Claytor, P.E. 508-833-6600 Appendix D: Site
Using AGWA and the KINEROS2 Model to Assess Green Infrastructure Designs
 Using AGWA and the KINEROS2 Model to Assess Green Infrastructure Designs D. Phillip Guertin 1, Yoganand Korgaonkar 1, I. Shea Burns 1, Carl Unkrich 2, David C. Goodrich 2, and William Kepner 3 1 University
Chapter 12. VIRGINIA RUNOFF REDUCTION METHOD Compliance Spreadsheet User s Guide & Documentation (Version 2.7, April 2013) Table of Contents
 Table of Contents") Virginia Stormwater Management Handbook, Chapter 11 July 2013 Chapter 12 VIRGINIA RUNOFF REDUCTION METHOD Compliance Spreadsheet User s Guide & Documentation (Version 2.7, April 2013) Table of Contents
Virginia Stormwater Management Handbook, Chapter 11 July 2013 Chapter 12 VIRGINIA RUNOFF REDUCTION METHOD Compliance Spreadsheet User s Guide & Documentation (Version 2.7, April 2013) Table of Contents
Paraprofessional Training Session 1
 Paraprofessional Training Session 1 Part 2: Stormwater Basics November 26, 2012 Rutgers University, Cook Campus Christopher C. Obropta, Ph.D., P.E. Extension Specialist in Water Resources Associate Professor
L-THIA Online and LID in a watershed investigation
 L-THIA Online and LID in a watershed investigation Larry Theller Agricultural and Biological Engineering, Purdue University Great Lakes Sedimentation Workshop Ann Arbor Mi. L-THIA On-line watershed delineation
Stormwater Volume and Treatment Methods Simplifying the Numbers. IAFSM March 10, Presented by: Tom Powers P.E., CFM, LEED AP, CPESC
 Stormwater Volume and Treatment Methods Simplifying the Numbers IAFSM March 10, 2011 Presented by: Tom Powers P.E., CFM, LEED AP, CPESC Introduction GOALS: Improve understanding of Rate and Volume (Quantity)
Infiltration Trench Factsheet
 Infiltration Trench Factsheet Infiltration Trench is a practice that provides temporary storage of runoff using the void spaces within the soil/sand/gravel mixture that is used to backfill the trench for
1. Stream Network. The most common approach to quantitatively describing stream networks was postulated by Strahler (1952).
.") 1. Stream Network The most common approach to quantitatively describing stream networks was postulated by Strahler (1952). First Order Streams streams with no tributaries. Second Order Streams begin at
1. Stream Network The most common approach to quantitatively describing stream networks was postulated by Strahler (1952). First Order Streams streams with no tributaries. Second Order Streams begin at
The Effect Of Flood Reduction And Water Conservation Of Decentralized Rainwater Management System
 City University of New York (CUNY) CUNY Academic Works International Conference on Hydroinformatics 8-1-2014 The Effect Of Flood Reduction And Water Conservation Of Decentralized Rainwater Management System
Krista Reininga, PE Hydromodification and What it Means for the Design of Stormwater Facilities
 Krista Reininga, PE Hydromodification and What it Means for the Design of Stormwater Facilities Agenda 1. Evolution of Water Quality Facilities 2. Regulatory Response/MS4 Permit Requirements 3. Change
Module 10b: Gutter and Inlet Designs and Multiple Design Objectives
 Module 10b: Gutter and Inlet Designs and Multiple Design Objectives Bob Pitt University of Alabama and Shirley Clark Penn State Harrisburg Evening traffic plows through high water at the intersection of
Environment, Energy, Security & Sustainability (E2S2)
") Environment, Energy, Security & Sustainability (E2S2) Modeling Your Way Through EISA Patrick N. Deliman, PhD Environmental Laboratory US Army Engineer Research and Development Center US Army Corps of Engineers
Environment, Energy, Security & Sustainability (E2S2) Modeling Your Way Through EISA Patrick N. Deliman, PhD Environmental Laboratory US Army Engineer Research and Development Center US Army Corps of Engineers
DoD Storm Water Policy
 DoD Storm Water Policy Environment, Energy and Sustainability Symposium & Exhibition Denver, CO Mr. Ed Miller Office of Deputy Under Secretary of Defense (Installations and Environment) June 17, 2010 Outline
the 2001 season. Allison brought high winds and street flooding to Houston, after
 Module 10b: Gutter and Inlet Designs and Multiple Design Objectives Bob Pitt University of Alabama and Shirley Clark Penn State Harrisburg Evening traffic plows through high water at the intersection of
15A NCAC 02H.1005 STORMWATER REQUIREMENTS: COASTAL COUNTIES
 1 1 1 1 1 1 1 1 0 1 0 1 1A NCAC 0H.0 STORMWATER REQUIREMENTS: COASTAL COUNTIES (a) The following definitions are applicable to this rule: (1) Built upon area as defined in Session Law 00- means that portion
UNIFIED FACILITIES CRITERIA (UFC) LOW IMPACT DEVELOPMENT
 LOW IMPACT DEVELOPMENT") UNIFIED FACILITIES CRITERIA (UFC) LOW IMPACT DEVELOPMENT APPROVED FOR PUBLIC RELEASE; DISTRIBUTION UNLIMITED Any copyrighted material included in this UFC is identified at its point of use. Use of the
UNIFIED FACILITIES CRITERIA (UFC) LOW IMPACT DEVELOPMENT APPROVED FOR PUBLIC RELEASE; DISTRIBUTION UNLIMITED Any copyrighted material included in this UFC is identified at its point of use. Use of the
Pre-Treatment Bioretention Cells Bioswales IOWA STORMWATER MANAGEMENT MANUAL DECEMBER 16, 2015
 Pre-Treatment Bioretention Cells Bioswales IOWA STORMWATER MANAGEMENT MANUAL DECEMBER 16, 2015 Urban Runoff Background How we got here What Problem?? Provenance of the Problem Unified Sizing Criteria What
Analyzing the Changes to the Hydrologic Cycle. with the Implementation of LID Techniques in Korea
 Analyzing the Changes to the Hydrologic Cycle with the Implementation of LID Techniques in Korea Jung Min Lee Contents 1 Introduction 2 Change of New City Paradigm on Korea 3 Case Study 4 The Effects of
PRELIMINARY DRAINAGE STUDY
 PRELIMINARY DRAINAGE STUDY For 34 th & J Residences 3402 J St. San Diego, CA 92102 A.P.N 545-250-08 Prepared By: Kenneth J. Discenza, P.E. Site Design Associates, Inc. 1016 Broadway, Suite A El Cajon,
APPENDIX E APPENDIX E ESTIMATING RUNOFF FOR SMALL WATERSHEDS
 APPENDIX E ESTIMATING RUNOFF FOR SMALL WATERSHEDS March 18, 2003 This page left blank intentionally. March 18, 2003 TABLES Table E.1 Table E.2 Return Frequencies for Roadway Drainage Design Rational Method
Western Washington Hydrology Model (WWHM) Software Introduction. Doug Beyerlein, P.E., P.H., D.WRE Clear Creek Solutions, Inc. Mill Creek, Washington
 Software Introduction. Doug Beyerlein, P.E., P.H., D.WRE Clear Creek Solutions, Inc. Mill Creek, Washington") Western Washington Hydrology Model (WWHM) Software Introduction Doug Beyerlein, P.E., P.H., D.WRE Clear Creek Solutions, Inc. Mill Creek, Washington Clear Creek Solutions Hydrology Expertise Clear Creek
Western Washington Hydrology Model (WWHM) Software Introduction Doug Beyerlein, P.E., P.H., D.WRE Clear Creek Solutions, Inc. Mill Creek, Washington Clear Creek Solutions Hydrology Expertise Clear Creek
Cochise Hall Water Harvesting / Storm water Management - Class Project
 1 The modern water harvesting movement is part of a broader change, or paradigm shift, in how water is treated on sites. And that is the shift from viewing water as a problem to seeing it as a resource.
Shirley E. Clark, Ph.D., P.E. October 5, /30/2012
 Shirley E. Clark, Ph.D., P.E. October 5, 2012 Prior development decisions have led to directly connected impervious areas and pervious areas with heavily-compacted soils. Prince Georges Cty, MD photo 1
Class V Well Definition
 UIC and Green Infrastructure What is Green Infrastructure (GI)? GI is the interconnected network of open spaces and natural areas, such as greenways, wetlands, parks, forest preserves and native plant
Will Your Green Infrastructure Program Help You Comply with Your Consent Order?
 Will Your Green Infrastructure Program Help You Comply with Your Consent Order? 2017 OWEA Technical Conference Presenters: Andrew M. Birmingham, PE Keisha Isaac-Ricketts June 29, 2017 Presentation Agenda
Water Resources Management Plan Appendix B
 B u r n s v i l l e M i n n e s o t a Water Resources Management Plan Appendix B Appendix B Page B-1 Burnsville, Minnesota STORM WATER LOW-IMPACT DEVELOPMENT GUIDE MANUAL SHORT ELLIOTT HENDRICKSON INC.
Site Design Checklist and LID Calculations Worksheet. Draft Revision December 2004
 Site Design Checklist and LID Calculations Worksheet Draft Revision December 2004 Introduction Conventional stormwater management seeks to attenuate flood peaks and treat for stormwater pollutants such
PREDEVELOPMENT VERSUS POSTDEVELOPMENT VOLUME ANALYSIS: An Application of Continuous Simulation Modeling using PONDS Version 3 Software
 PREDEVELOPMENT VERSUS POSTDEVELOPMENT VOLUME ANALYSIS: An Application of Continuous Simulation Modeling using PONDS Version 3 Software PRESENTATION TO: SOUTH FLORIDA WATER MANAGEMENT DISTRICT RFP No. C-8501
Issue paper: Aquifer Water Balance
 Issue paper: Aquifer Water Balance 1. Introduction And Background 1.1. Purpose and Scope The population in Kitsap County has grown rapidly in recent years and is expected to increase substantially in the
Stormwater and LEED. Vancouver LEED User s Group May 27, Craig Kipkie, M.Sc., P.Eng, LEED AP
 Stormwater and LEED Vancouver LEED User s Group May 27, 2005 Craig Kipkie, M.Sc., P.Eng, LEED AP Outline Sustainable Sites 2 Stormwater credits SSc6.1 SSc6.2 Synergies with other Credits Case Study How
SUSTAINABILITY: Principles, Techniques, Design, and Regulations
 SUSTAINABILITY: Principles, Techniques, Design, and Regulations Ann Audrey City of Tucson Office of Conservation and Sustainable Development January 2009 6 Steps to creating a sustainable site 1. Describe
Preliminary Drainage Analysis
 Preliminary Drainage Analysis Tanimura and Antle Employee Housing Town of Spreckels County of Monterey, California LIB150205 May 29, 2015 Prepared For: Tanimura and Antle Produce Prepared By: 9699 Blue
Pennsylvania Stormwater Best Management Practices Manual
 Pennsylvania Stormwater Best Management Practices Manual Presented by the Pennsylvania Department of Environmental Protection Bureau of Watershed Protection In cooperation with: Cahill Associates Environmental
10/16/2013. The Big Picture of LID and Green Infrastructure. Learning Objectives
 Low impact development (LID) the basic idea behind LID is to manage stormwater in a way that imitates the natural hydrology of a site. Details Matter Selection, Design, and Implementation of Low Impact
Revisiting the BMP Removal Rate Adjustor Curves. Mike Hickman PA DEP
 Revisiting the BMP Removal Rate Adjustor Curves Mike Hickman PA DEP johickman@pa.gov BMP Enhancements Recommendations of the Expert Panel to Define Removal Rates for Urban Stormwater Retrofit Projects
ZONING ORDINANCE FOR THE ZONED UNINCORPORATED AREAS ARTICLE 1500 OF PUTNAM COUNTY, WEST VIRGINIA Page 149 ARTICLE 1500 DRAINAGE AND STORM SEWERS
 OF PUTNAM COUNTY, WEST VIRGINIA Page 149 ARTICLE 1500 DRAINAGE AND STORM SEWERS 1500.01 GENERAL REQUIREMENTS 1500.02 NATURE OF STORM WATER FACILITIES 1500.03 DRAINAGE EASEMENTS 1500.04 STORM WATER MANAGEMENT
LEED Credits. How FieldTurf Can Contribute To Obtaining
 How FieldTurf Can Contribute To Obtaining LEED Credits AlternaScapes, Inc. 2231 Whitfield Park Ave Sarasota, FL 34243 Phone: 941-753-3312 Toll Free: 800-445-2944 Fax: 941-753-3314 Email: info@justlikegrass.com
FORT COLLINS STORMWATER CRITERIA MANUAL Hydrology Standards (Ch. 5) 1.0 Overview
 1.0 Overview") Chapter 5: Hydrology Standards Contents 1.0 Overview... 1 1.1 Storm Runoff Determination... 1 1.2 Design Storm Frequencies... 1 1.3 Water Quality Storm Provisions... 2 1.4 Design Storm Return Periods...
Chapter 5: Hydrology Standards Contents 1.0 Overview... 1 1.1 Storm Runoff Determination... 1 1.2 Design Storm Frequencies... 1 1.3 Water Quality Storm Provisions... 2 1.4 Design Storm Return Periods...
Modeling Green Infrastructure Compared with Large-Scale Monitoring at Kansas City, MO
 X Modeling Green Infrastructure Compared with Large-Scale Monitoring at Kansas City, MO Robert Pitt and Leila Talebi The US EPA s Green Infrastructure Demonstration project in Kansas City, MO, is likely
CHELTENHAM TOWNSHIP Chapter 290: WATERSHED STORMWATER MANAGEMENT Article IV: Stormwater Management
 CHELTENHAM TOWNSHIP Chapter 290: WATERSHED STORMWATER MANAGEMENT Article IV: Stormwater Management Online ECode Available on Cheltenham Township Website at: http://ecode360.com/14477578 For all regulated
APPENDIX F RATIONAL METHOD
 7-F-1 APPENDIX F RATIONAL METHOD 1.0 Introduction One of the most commonly used procedures for calculating peak flows from small drainages less than 200 acres is the Rational Method. This method is most
Simple Method for Estimating Phosphorus Export
 Appendix L Simple Method for Estimating Phosphorus Export 1. The Simple Method The Simple Method is a technique used for estimating storm pollutant export delivered from urban development sites. The method
Stormwater Review Part 2. Rainfall and Runoff. Tom Seybert, PE and Andy Bennett, PE. Pennsylvania Surveyors Conference 2019
 Stormwater Review Part 2 Rainfall and Runoff Tom Seybert, PE and Andy Bennett, PE Pennsylvania Surveyors Conference 2019 1 Topics Covered 1. Rainfall characteristics and sources 2. Watershed characteristics
Matt Lundsted Principal Comprehensive Environmental Inc.
 Matt Lundsted Principal Comprehensive Environmental Inc. Traditional Development vs. LID Application of LID to New and Redeveloped Sites Standard Engineering Practice Q = CIA Minimum velocity of 3 ft/sec.
Pinellas County Stormwater Management Manual Training Workshop SMALL COMMERCIAL AREA CASE STUDY
 Pinellas County Stormwater Management Manual Training Workshop SMALL COMMERCIAL AREA CASE STUDY PRE POST (ACTUAL) WHICH IS THE APPROPRIATE PERFORMANCE STANDARD? Post = 90% of Pre vs. 55% N and 80% P reduction
Clean Water Services Design and Construction Standards Update: Base Strategy and Methodology to Address Hydromodification Impacts
 Clean Water Services Design and Construction Standards Update: Base Strategy and Methodology to Address Hydromodification Impacts 1.0 INTRODUCTION The proposed hydromodification base strategy (Base Strategy)
The SuDS Manual Frequently asked questions
 The SuDS Manual Frequently asked questions 1. Is source control still a requirement of the new SuDS Manual? Yes. Source control components are fundamental elements of a SuDS scheme. The benefits of source
Results shown on 'Detailed Summary' tab
 Fill in site's Pre Development parameters on 'Pre' tab (Site Area, Drainage Area, Impervious Area, CNpre, tc) Prior to using BSD or BMP practices, fill in site's Post Development parameters on 'Post' tab
Urbanizing Watersheds: Green Infrastructure and Hydrologic Function. Jay Dorsey, PE, PhD ODNR-DSWR October 30, 2014
 Urbanizing Watersheds: Green Infrastructure and Hydrologic Function Jay Dorsey, PE, PhD ODNR-DSWR October 30, 2014 Green Infrastructure Objectives Intentional about maintaining/replacing ecosystem functions
Chapter H. Introduction to Surface Water Hydrology and Drainage for Engineering Purposes
 Chapter H. Introduction to Surface Water Hydrology and Drainage for Engineering Purposes As seen in Figure H.1, hydrology is a complex science that deals with the movement of water between various stages
THE STUDY ON INTEGRATED URBAN DRAINAGE IMPROVEMENT FOR MELAKA AND SUNGAI PETANI IN MALAYSIA FINAL REPORT
 THE GOVERNMENT OF MALAYSIA PRIME MINISTER S DEPARTMENT ECONOMIC PLANNING UNIT THE STUDY ON INTEGRATED URBAN DRAINAGE IMPROVEMENT FOR MELAKA AND SUNGAI PETANI IN MALAYSIA FINAL REPORT VOL. 5: TECHNICAL
Unit 2: Geomorphologic and Hydrologic Characteristics of Watersheds. ENVS 435: Watershed Management INSTR.: Dr. R.M. Bajracharya
 Unit 2: Geomorphologic and Hydrologic Characteristics of Watersheds ENVS 435: Watershed Management INSTR.: Dr. R.M. Bajracharya Watersheds are hydro-geologic units Water flow and cycling are basic and
6.0 Runoff. 6.1 Introduction. 6.2 Flood Control Design Runoff
 October 2003, Revised February 2005 Chapter 6.0, Runoff Page 1 6.1 Introduction 6.0 Runoff The timing, peak rates of discharge, and volume of stormwater runoff are the primary considerations in the design
INFILTRATION FACILITY MODELING
 INFILTRATION FACILITY MODELING Clear Creek Solutions, Inc., 2010 Infiltration is good. Infiltration returns the runoff to the ground, allowing it to slowly recharge the aquifer and the nearest stream.
June 27, 2012 Holly Galavotti U.S. EPA
 June 27, 2012 Holly Galavotti U.S. EPA Urban stormwater is a leading source of water quality impairment Urban stormwater identified as source of impairment (2004 WQ Report) 22,559 miles of impaired rivers
ORDINANCE # 854. Stormwater Management / Operation and Maintenance Requirements
 ORDINANCE # 854 Stormwater Management / Operation and Maintenance Requirements Section 1. Purpose and Authority In accordance with the provisions of Chapters 98, 124, 126, 440, 444, and 446h of the General
RETENTION BASIN EXAMPLE
 -7 Given: Total Tributary Area = 7.5 ac o Tributary Area within Existing R/W = 5.8 ac o Tributary Area, Impervious, Outside of R/W = 0.0 ac o Tributary Area, Pervious, Outside of R/W = 1.7 ac o Tributary
BMPTRAINS MODEL: A TRAINING WORKSHOP B Y : M AR T Y W AN I E L I S T A, H AR V E Y H AR P E R AN D M I K E H AR D I N.
 BMPTRAINS MODEL: A TRAINING WORKSHOP B Y : M AR T Y W AN I E L I S T A, H AR V E Y H AR P E R AN D M I K E H AR D I N. PURPOSE OF TRAINING IS TO: Understand the theory essential for estimating annual nutrient
Low Impact Development (LID) Hydrology Considerations
 Hydrology Considerations") Low Impact Development (LID) Hydrology Considerations What is Bioretention? Filtering stormwater runoff through a terrestrial aerobic (upland) plant / soil / microbe complex to remove pollutants through
Low Impact Development (LID) Hydrology Considerations What is Bioretention? Filtering stormwater runoff through a terrestrial aerobic (upland) plant / soil / microbe complex to remove pollutants through
The role of domestic rainwater harvesting systems in storm water runoff mitigation
 European Water 58: 497-53, 217. 217 E.W. Publications The role of domestic rainwater harvesting systems in storm water runoff mitigation I. Gnecco *, A. Palla and P. La Barbera Department of Civil, Chemical
MEMORANDUM. Date: August 4, 2011 To: From: cc:
 MEMORANDUM City of Kitchener City Hall, 200 King St. West P.O. Box 1118 Kitchener, ON N2G 4G7 Date: August 4, 2011 To: From: cc: Steering Committee Members Nick Gollan and Nancy Corbett Project Team Members
CASE STUDIES: CENTRAL OFFICE COMPLEX
 CASE STUDIES: CENTRAL OFFICE COMPLEX B Y : M A R T Y W A N I E L I S T A A N D E R I C L I V I N G S T O N August, 2016 Escambia County ACKNOWLEDGEMENTS The Low Impact Design BMP workshops were presented
Design of Stormwater Wetlands
 Hydraulic & Hydrologic Stormwater Engineering Design of Stormwater Wetlands Jon Hathaway, EI Extension Associate NCSU Bio. And Ag. Engineering 6 Step Process 1. Watershed Analysis (Runoff Volume and Peak
Characterization of the Hydraulic Behavior of Porous Pavements
 Characterization of the Hydraulic Behavior of Porous Pavements William D. Martin III 1, Nigel B. Kaye 2 AUTHORS: 1 Lecturer, General Engineering Department, Clemson University, 104 Holtzendorff Hall, Clemson,