Arizona Solar Energy and Economics Outlook By George Frisvold, William P. Patton, and Stan Reynolds
|
|
|
- Steven Hunt
- 6 years ago
- Views:
Transcription
1 Arizona Solar Energy and Economics Outlook By George Frisvold, William P. Patton, and Stan Reynolds Prepared for Arizona Solar Energy and Economics Summit January 09,
2 TABLE OF CONTENTS EXECUTIVE SUMMARY INTRODUCTION PURPOSE OF THE STUDY STATE OF SOLAR ENERGY DEVELOPMENT IN ARIZONA PHYSICAL POTENTIAL FOR AZ TO BE A KEY PRODUCER OF SOLAR ENERGY POTENTIAL FOR SOLAR ENERGY DEPLOYMENT IN ARIZONA RENEWABLE ELECTRICITY DEMAND FORECAST FOR ARIZONA ECONOMICS OF SOLAR POWER IN ARIZONA ECONOMIC IMPACT ON ARIZONA OF INCREASED SOLAR ENERGY PRODUCTION IMPACT OF LARGE SCALE SOLAR ENERGY DEVELOPMENT ON SUSTAINABLE DEVELOPMENT IN ARIZONA SUMMARY AND CONCLUSIONS SOURCES APPENDICES Appendix 1 - Financial assumptions used in SAM model economic analysis of solar technologies Appendix 2 - Arizona Potential for Solar Energy Manufacturing TABLES Table 1 AZ Renewable Electric Power Net Summer Energy Capacity (MW) by Source Table 2 - AZ Renewable Electric Power Net Generation (Thousand MWh) by Source Table 3 - Solar Power Levelized Cost of Energy (LCOE) by City
3 Table 4 - Arizona Renewable Energy Standard Requirements Table 5- Arizona Renewable Energy Demand Forecast (Cumulative GWh) Table 6 Residential Solar Photovoltaic Characteristics Table 7 Commercial Solar Photovoltaic Characteristics Table 8 Utility Solar Photovoltaic Characteristics Table 9 Utility Concentrated Solar Photovoltaic Characteristics Table 10 Utility Solar Parabolic Trough Characteristics Table 11 Utility Solar Parabolic Dish Characteristics Table 12 Utility Solar Tower Characteristics Table 13 The Effect of Subsidies on LCOE by Solar Technology Table 14 - Range of LCOE Estimates by Generation Technology (cents/kwh) Table 15 LCOE Projections for Selected Years by Solar Technology Table 16 Grid Connected Solar Technology Shares 2010 & 2030 Table 17 - Arizona Solar Power Generation Table 18 - Arizona Solar Power Capacity Table 19 - Arizona Solar Power Capital Investment Table 20 - Arizona Solar Power Construction Employment Table 21 - Arizona Solar Power Construction Wages Table 22 - Arizona Solar Power Construction Value Added Table 23 - Arizona Solar Power Direct O&M Employment Table 24 - Arizona Solar Power O&M Wages Table 25 - Arizona Solar Power Total O&M Value Added Table 26 - Comparison of Water Consumption Intensity of Different Power Generation Technologies
4 Table 27 - Projected Water Demand for Arizona Solar Energy Production Table 28 - Projected Water Demand for Solar Energy Generation in Relation to Irrigation Use Table 29 Water Consumption by Solar Technology Table 30 - Arizona Solar Power Land Use Table 31 - Life-Cycle Greenhouse Gas Emission Estimates for Selected Energy Power Plants Table A1.1 - Residential and Commercial Financial Assumptions Table A1.2 - Utility Financial Assumptions FIGURES Figure 1 - United States Solar Resources by State (Watt-hr./inch 2 per day) PHOTOS Photo 1 Residential Silicon PV Application Photo 2 Thin Film PV Integrated into Roof Shingles Photo 3 Commercial Silicon PV Rooftop Application Photo 4 Utility Large Scale PV Generation System Photo 5 Experimental Concentrating Solar Photovoltaic Unit Photo 6 Utility Scale Solar Parabolic Trough System Photo 7 Solar Parabolic Dish Sterling Test System Photo 8 Solar Power Tower Test Facility All photos are courtesy of National Renewable Energy Laboratory Photographic Information Exchange
5 EXECUTIVE SUMMARY This report examined the potential to develop solar power generation in Arizona and the economic and sustainability implications of its deployment. Arizona Solar Potential The report found that there is a huge potential for solar power development in Arizona due to its vast land availability, its intense solar radiation resources and the State s goal of accelerating renewable energy development through incentives and ACC mandated Renewable Energy Standards (RES). The levelized cost of solar energy in Arizona is much lower than it is in most other parts of the U.S. due to the abundant solar radiation and sunny climate. The land and water resources in Arizona are sufficient to support the amount of solar generation that would be required to meet the RES requirements for the next twenty years. Cost Competitiveness of Solar Power Units The levelized cost of energy was calculated for several solar reference units including: residential and commercial photovoltaic (PV) systems, and large scale PV and concentrating PV systems. It was also calculated for large scale solar thermal units including: solar parabolic troughs, solar parabolic dishes and central solar towers. The report concluded that subsidies are still required to make solar power cost competitive with conventional generation systems. However, future reductions in solar equipment manufacturing costs and increases in solar system efficiencies will continue to make solar power even more cost competitive in the future. The competiveness of solar electricity could be greatly improved by future spikes in the prices of fossil fuels used in generation since solar power has no fuels costs. In addition, coal generation could be negatively affected by restrictions on greenhouse gas emissions or taxes on emissions. This would make solar power even more competitive since it does not emit significant levels of greenhouse gases. Solar electricity production revenue could potentially be enhanced by selling carbon credit to other companies. Economic Impact of Solar Power Development The economic impact of solar power development in Arizona was estimated for both the construction phase and the operation and maintenance phase of the solar generation life cycle. The economic impact of the solar power industry is driven by construction capital investment and by O&M expenditures. These, in turn, are determined by the rate at which solar capacity is added to the market and by the cumulative amount of operating solar generation capacity.
6 Solar Power Generation Capacity Annual solar power generation will steadily increase from 32,300 MWh in 2010 to 9,544,100 MWh in This amount of production will require the construction of 4,340 MW of cumulative solar generation capacity by From 2025 to 2030, all of the incremental renewable energy requirements will be filled by solar power. Capital Investment Starting in 2010, the annual amount of capital investment will rise dramatically from $84 million in 2010 to a peak of $2.5 billion in By 2030 the annual rate of capital investment drops to about $1.1 billion. In total, the construction of solar power plants to meet the ACC RES requirements will cost around $22 billion in cumulative capital expenditures by Economic Impact of Construction The massive level of solar power plant construction over the next 20 years generates the lion s share of solar power s economic benefits in terms of employment, wages and value added. The O&M phase of the solar generation process adds very little economic impact in Arizona. The annual amount of direct labor used on solar construction and installation projects will increase from 565 jobs in 2010 to a peak 16,530 jobs in The total amount of jobs created (including direct, indirect and induced jobs) increases from 1,068 to a maximum of 32,082 over the same period. The cumulative impact of direct construction employment amounts to 142,368 man-years of direct employment by The cumulative total construction employment amounts to 277,759 man-years by Since these construction jobs only last a year and are not permanent, the cumulative employment represents man-hours of effort over the twenty year period, not total construction jobs at the end of the period. The amount of wages generated by solar power construction and installation will be significant. The total annual wages (direct, indirect and induced) will rise from $51 million in 2010 to a peak of $1,560 million in The cumulative value of wages over the period 2010 to 2030 amounts to $13.5 billion. The value added created by solar power construction and installation will also be significant. The total annual value added (direct, indirect and induced) increases from $74 million in 2010 to a peak of $2,240 million in The cumulative amount of wages from 2010 to 2030 amounts to $19.4 billion. Economic Impact of O&M Activities
7 The amount of permanent jobs created from solar power O&M activities is insignificant compared to those created in the construction process. The O&M direct jobs added each year, rises from 2.5 in 2010 to a peak of 50 in Total employment (direct, indirect and induced) added each year increases from 3 in 2010 to a peak of 87 in Cumulative O&M employment will result in a total of 809 direct permanent jobs by The total number of cumulative permanent jobs will be 1,198 in The total (direct, indirect, and induced) incremental annual wages generated by ongoing solar O&M activity increases from $200,000 in 2010 to a peak of $8 million in The cumulative wages from 2010 to 2030 amount to $65 million. The total (direct, indirect, and induced) incremental value added generated by ongoing solar O&M activity increases from $400,000 in 2010 to a peak of $6.6 million in The cumulative wages from 2010 to 2030 amount to $128 million. Sustainability of Solar Power The amount of water used for solar power production is insignificant. Compared to irrigation use, solar demand is less than 0.25 percent of agricultural applications, by It is only after 2015 that statewide solar water demand exceeds that of one average water-using farm. By 2030, solar demand is projected to be equivalent to about 6 average water-using farms.. The amount of land needed by the solar power industry is readily available in Arizona. In 2030, the solar power industry would require 13,137 acres or 20.5 square miles of land to produce the amount of electricity required to support the ACC RES. Solar power production emits virtually zero greenhouse gases. Substitution of solar electricity for fossil fuel generated electricity would beneficially lower the amount of greenhouse gases released into the Arizona environment. Conclusion The expansion of solar electric production in the State of Arizona will create economic and environmental benefits for the State of Arizona. The potential for expanded solar power production is massive. The solar resource quantity and quality in Arizona is higher than in most other regions in the U.S., makes it less expensive to produce electricity than it is in other states. In addition, the land and water resources needed to support solar electricity production are available in sufficient qualities. Large tracts of contiguous level land are available from the Bureau of Land Management, Arizona State Land Trust and Native American Reservations. Even though solar power is not a relatively large water user, water is available in many of the prime areas for solar power production. The construction of solar power plants will have a significant impact on the state s economy over the next twenty years in terms of employment wages and value added.
8 However, the operation of those generating plants once they are online will have very little economic impact. The expansion of solar power production will have a significant benefit on Arizona sustainability. Increased solar production in Arizona will have a positive environmental impact. It will lower the level greenhouse gas emissions. This will result in improved air quality and help to mitigate the potential for climate change. It will have minimal impact on water use and many of the preferred sites occur in areas of the state that have sufficient water supplies. Although It requires a large amount of land use, but there is enough land available to easily accommodate solar power land needs. Development of Arizona s solar energy resources will have a positive social impact, as well. It will reduce impact of disruptions to the supply of conventional energy sources and reduce the impact of significant increases in the cost of conventional fuels In conclusion, development of solar energy resources will support the growth of the Arizona population and economy on a more sustainable basis.
9 INTRODUCTION In the wake of dramatic increases and volatility in the prices of fossil fuels and the environmental necessity of reducing greenhouse gas emissions to slow the rate of global climate change, there has been increasing interest in the role of renewable energy technologies. Expanded production of energy from renewable sources has become a public policy goal as a means of protecting the U.S. from unreliable and expensive foreign energy sources and protecting the environment. Based on these considerations, the federal government and states like Arizona are actively promoting the expansion of renewable energy production through the use of subsidies and renewable energy standards to push these technologies into the market. In the case of solar energy, the combination of incentives, declining manufacturing costs and increasing efficiencies over time is gradually making it more competitive with other conventional and renewable energy systems. PURPOSE OF THE STUDY The purpose of this study is to analyze the potential for solar electric generation to penetrate the energy market in Arizona over the next twenty years, and to examine the economic and environmental impacts of increased use of solar power. The study attempts to determine the size of investment needed to achieve the ACC Renewable Energy Standard goals by 2025, as well as analyze the economic impact of solar development on employment, wages and value added. The study also attempts to determine the economic consequences of increased solar power production in terms of land use, water use and the emission of greenhouse gases. The overall goal of this study is to provide information about the solar energy market in Arizona that can be used by policy makers to promote the development of a viable solar energy industry.
10 STATE OF SOLAR ENERGY DEVELOPMENT IN ARIZONA At the present time, the solar energy production industry is in its infant stage in the State of Arizona. Despite the fact that Arizona and other southwestern U.S. states have abundant solar energy resources, there has been little penetration of solar power into the Arizona electric power generation market. Several forces have encouraged the development of solar power in recent years. The federal government retained the 30% ITC for solar energy projects, but removed the maximum payment cap, encouraging the development of larger solar projects which had previously had their tax credit limited by the payment cap. The Arizona Corporation Commission s Renewable Energy Standard goal of producing 15% of Arizona s electricity production using renewable energy by 2025 has put pressure on Arizona s regulated electric utilities to increase their utilization of electricity from renewable sources, including solar. The instability of global energy supplies and prices have placed growing emphasis on using renewable domestic energy sources as a way to mitigate the effects of higher energy prices and reduce America s dependence on unreliable foreign energy sources. Current Solar Market Penetration The electric generation capacity for Arizona renewable energy sources is shown in Table 1 for the period As of 2006, the most significant renewable energy source was hydroelectric power with a capacity of 2,720 MW or 10% of Arizona s generation capacity. Arizona has made use of its rivers and dams to tap its hydroelectric generation resources. However, most of the high potential hydro power resources have been tapped, so there is limited room for its further growth in the state. Solar electric generation has the second largest capacity of the renewable energy resources in Arizona. The state s solar electric capacity has grown from 1 MW in 2002 to 9 MW in However it still trails hydro electric power by a significant amount and constitutes less than 1% of the state s total electric capacity. The only other renewable energy sources that have penetrated into the Arizona electric generation market are wood and wood waste, and municipal solid wastes and landfill gas. These energy sources, combined, have less generation capacity than solar. Wind energy has made virtually no entrance into the Arizona electric generation market. According to a recent report by Black and Vetch, the wind resource in Arizona is relatively limited and will probably be exhausted quickly once it enters the market.
11 Table 1 - Arizona Renewable Electric Power Net Summer Energy Capacity (MW) by Source, Energy Source Total Net Summer Electricity Capacity 19,442 23,510 24,303 24,904 26,608 Total Net Summer Renewable Capacity 2,707 2,718 2,722 2,736 2,736 Geothermal Hydro 2,703 2,706 2,710 2,720 2,720 Solar Wind Wood/Wood Waste MSW/Landfill Gas Other Biomass Source: EIA. State Renewable Energy Profiles 2006, May Renewable energy sources account for 6,846 GWh or 6.6% of the 104,303 GWh generated by the Arizona electric generation industry. Hydroelectric generation represents 99.2% of the renewable energy electric production. With the exception of solar power with 13 GWh in 2006, the other renewable resources each produce less than 500 MWh. Table 2 - Arizona Renewable Electric Power Net Generation (Thousand MWh) by Source, Source Total Net Electricity Generation 94,132 94, , , ,393 Total Net Renewable Generation 7,481 7,120 7,021 6,484 6,846 Geothermal Hydro 7,427 7,705 6,973 6,410 6,793 Solar s s Wind Wood/Wood Waste MSW/Landfill Gas Other Biomass s indicates less than.5 thousand MWh Source: EIA. State Renewable Energy Profiles 2006, May Physical Potential for Arizona to be a Key Producer of Solar Energy
12 While solar electric capacity and production have made limited entry into the Arizona electric market to date, the solar resource potential in the state is enormous. Arizona is blessed with two critical resources that are essential to solar power production. These are a high level of solar radiation per square inch and large amounts of contiguous, relatively flat, undeveloped land. The amount of daily solar radiation in various regions of the United States is shown in Figure 1. The intensity of solar radiation is indicated by the by the colors on the map. Purple and bluish colors denote regions with low levels of daily solar radiation. Green and yellowish colors depict regions with relatively moderate levels of daily solar radiation. The regions with the most intense levels of solar radiation are colored in orange to reddish colors. It is apparent from the map that the southwestern states have the highest levels of solar radiation. The most intense solar radiation in the United States is located in southeastern California and southern Nevada which average 7,000 to 7,500 W-hr/in. 2 per day of solar radiation. The remaining southwestern states have significant levels of daily solar radiation. This includes portions of west Texas, the southern portions of Utah and Colorado, and the majority of land area of New Mexico, and Arizona.
 for selected U.S.")

13 Figure 1 - United States Solar Resources by State (Watt-hr./inch 2 per day) The amount of solar radiation in a region is an important determinant of the cost of solar electric energy economics. In general, cities with higher levels of solar radiation tend to have lower levelized costs of energy. To illustrate this point, Table 3 shows the levelized energy costs (LCOE) for selected U.S. cities that have different levels of solar radiation. The LCOEs for the nine cities were estimated for a residential photovoltaic system and a large utility scale parametric solar trough system. To minimize the effects of state and local incentives on the cost of solar energy production, the LCOEs for each city were estimated using the federal, state, local and utility incentives and electric rates faced by customers in the Phoenix area served by Arizona Public Service. The only factor that was varied was the level of solar radiation and weather experienced in each city. The results in Table 3 are dramatic. The subsidized LCOE for a residential PV system ranges from a low of 17.1 ( /kwh) in Albuquerque to a high of 33 ( /kwh) in Fairbanks, Alaska (see Table notes). The levelized cost of energy for a residential PV system in Fairbanks is roughly double that in Albuquerque.
14 The results for a solar thermal system like a parabolic solar trough are even more pronounced. The subsidized levelized energy cost for a solar trough range from a low of 14.3 ( /kwh) in Las Vegas to a high of 64.0 ( /kwh) in Fairbanks. Table 3 - Solar Power Levelized Cost of Energy (LCOE) by City *** Location Residential Photovoltaic LCOE ( /kwh)* Utility Solar Trough LCOE ( /kwh)** Albuquerque, NM Las Vegas, NV Phoenix, AZ Fort Worth, TX Miami, FL Minneapolis, MN New York, NY Seattle, WA Fairbanks, AK * The residential PV system is a 3.8 kw unit with a $9,000 per kw installed cost and a $50/kW annual O&M cost. The PV unit receives a 30% federal ITC and a 25% state ITC with a $1,000 maximum payment. It also receives a $3/Watt utility incentive. ** The utility solar trough system is a 100 MW unit with a $5,500 per kw installed cost and a $50/kW annual O&M cost. The PV unit receives a 30% federal ITC and a 10% state ITC with a $25,000 maximum payment. It also receives a $1.5/Watt utility incentive. *** The solar unit size, costs and subsidies in all locations are assumed to be identical to those in the APS service are in Phoenix. Only the solar radiation is different for each of the cities, The implication of this is that the southwest states, such as Arizona, have the best potential to promote and develop solar electric power generation without having to resort to extremely high subsidies. Since the economics of solar electricity production are much better in Arizona and surrounding states than in other regions of the country, it is likely that solar power production will develop here first, and then spread to other regions. If solar power can t make it in Arizona, Nevada, California and New Mexico, it won t make in other regions without heavy subsidies. This means that the decisions made by the Arizona Corporation Commission and other state and local government entities make over the next two decades, along with private sector investment in renewable energy resource development will have profound implications for the future of solar energy throughout the nation. If Arizona and other southwestern states can develop a set of subsidies, land use policies, transmission access, etc. that promote investment in solar energy technologies, it could result in economies of scale in the production of solar energy equipment that reduce the cost of solar generation and encourage its adoption in other regions of the country.
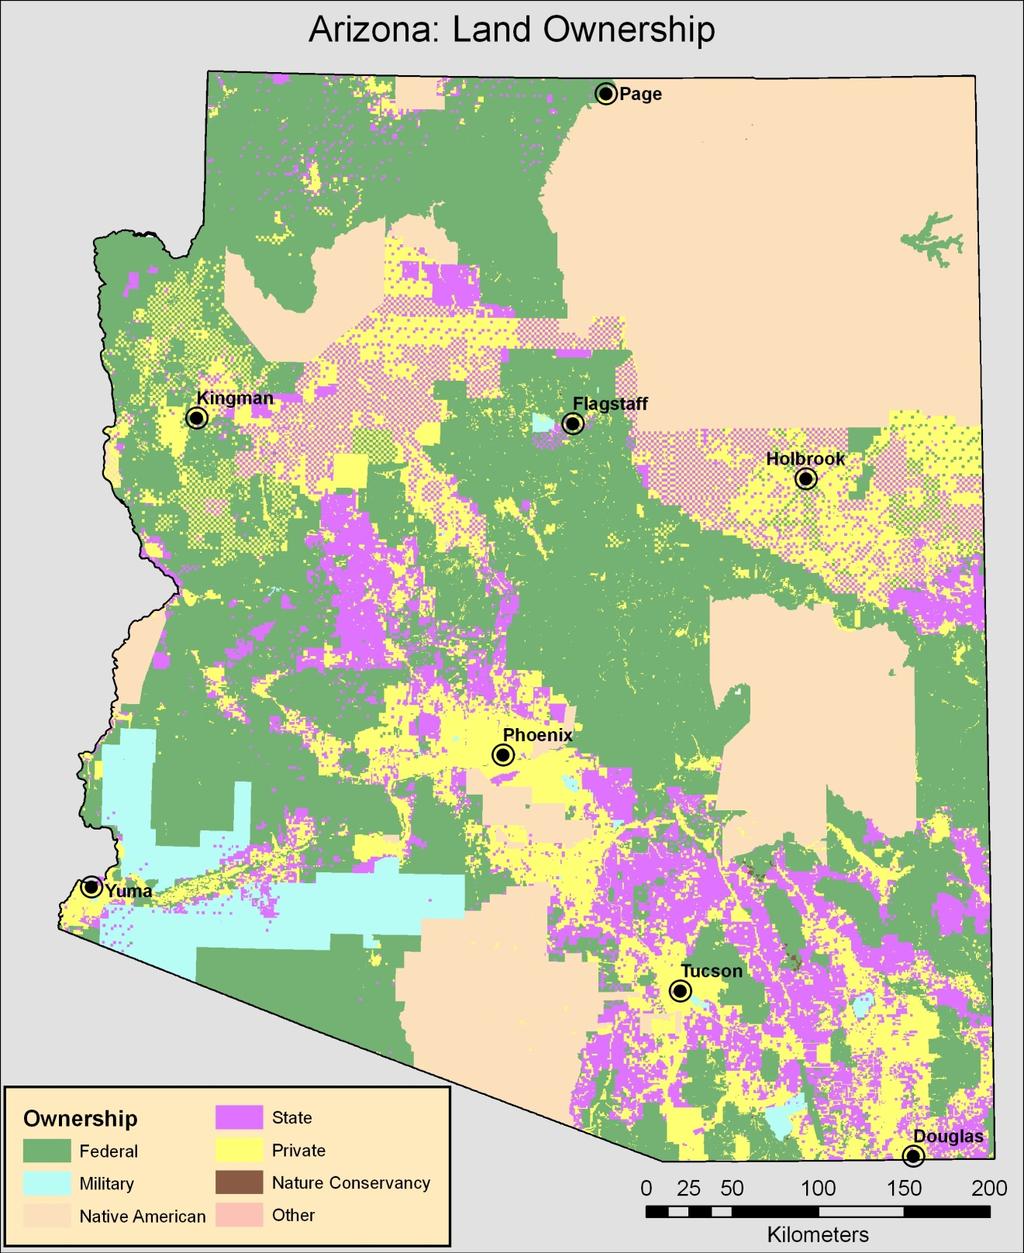
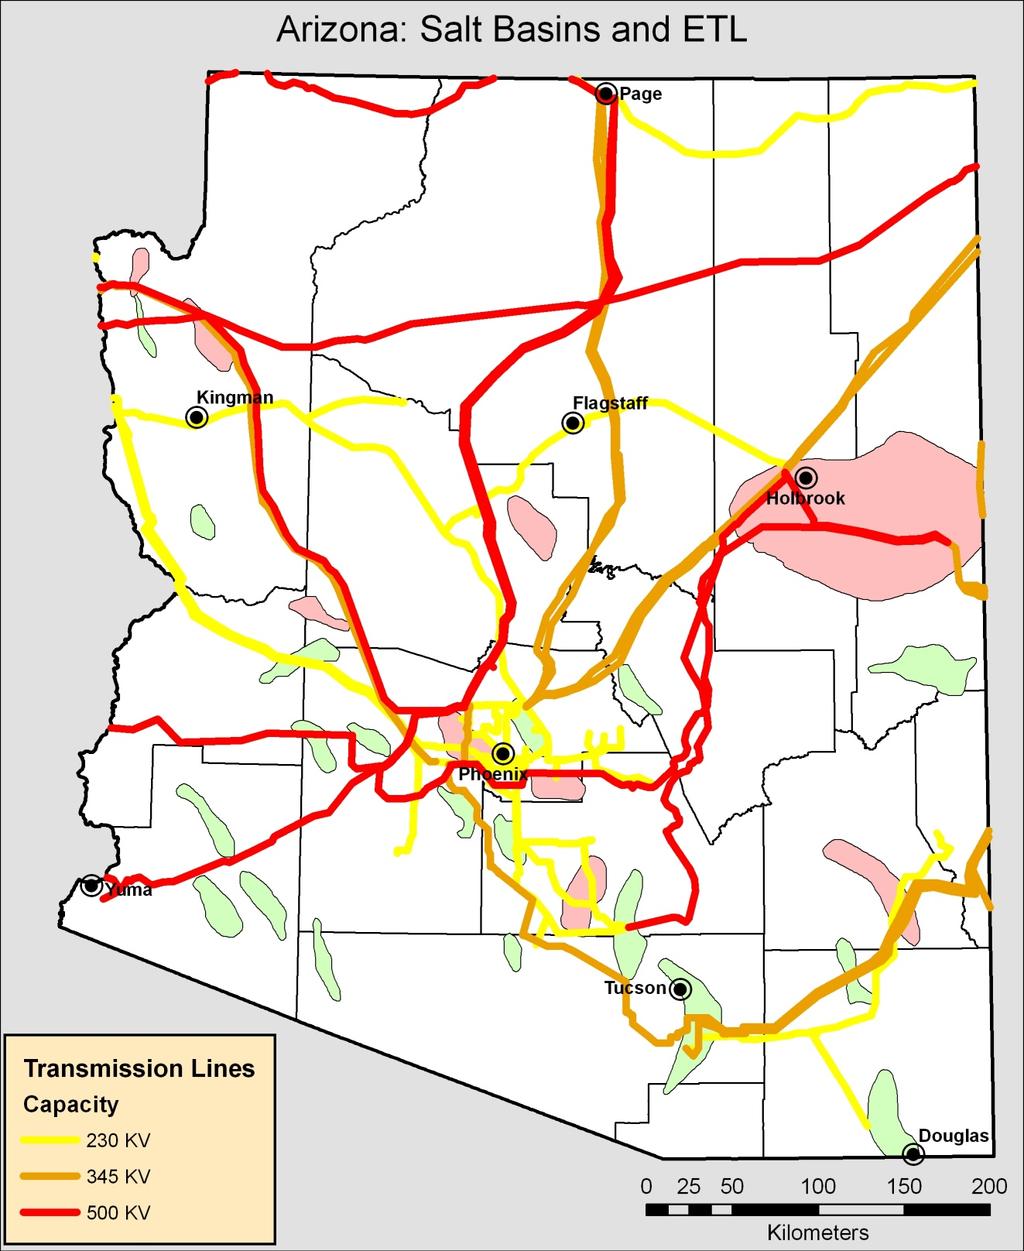
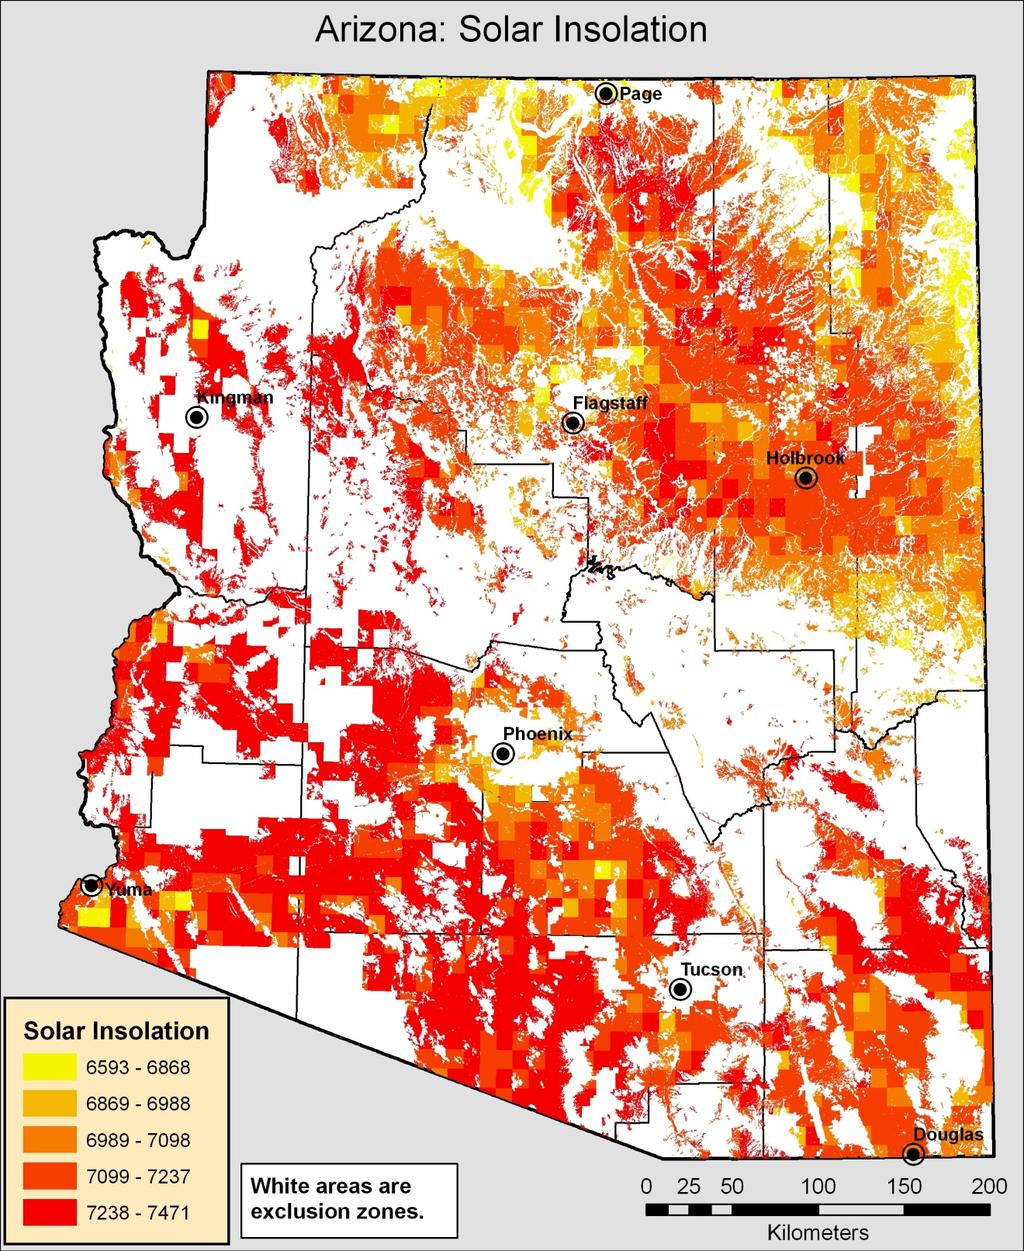
15 Solar electricity production requires large amounts of land in order to gather sufficient solar radiation to generate enough power to supply a significant amount of energy into the electric transmission grid. Large utility scale solar power plants can require as much as 5 acres per MW of peak capacity. The large land requirements of solar power generation make it difficult for many areas of the country to support a significant solar power generation industry. In order to site large scale solar electric generation units, it is necessary to have large, contiguous parcels of undeveloped land. Many of the large scale power plants also require level land. The cost or rental of the land must be reasonable, so the land must not have high valued competing uses. These land requirements are difficult to satisfy on a widespread basis in many parts of the country. However, in Arizona, there are large contiguous parcels of land available from federal, state and tribal lands (see Arizona Land Ownership map). Large contiguous parcels of U.S. Bureau of Land Management and State Land Trust lands are available in many parts of the state. Some of these parcels are relatively level and suitable for solar power production. Much of the land lies in remote desert areas with low land prices and few competing uses. The amount of suitable land is more than sufficient to supply Arizona s electricity demand for decades to come. Solar energy will likely shoulder an increasing share of the state s renewable energy production over time due to the state s limited wind and biomass potential (Black &Veatch). Water use and availability should not be a major constraint for solar power production. Photovoltaic and parabolic dish systems require virtually no water. Solar troughs and towers require water to cool the equipment, but the water requirements are low relative to conventional generating plants or agricultural uses. A more important constraint to solar power development in Arizona is access to transmission grid. Many of the prime areas for solar power generation are in remote areas of the state that may not be close to existing electric transmission lines. As the industry matures, this will become less of a problem, particularly if solar production facilities cluster in certain parts of the state. Transmission capacity will grow to meet the load. The map titled Arizona: Salt Basins and ETL shows the location of large electric transmission lines and major salt basins around the state. The ability of to deliver electric power from its source to the electric grid is critical for the solar industry. Fortunately, major power lines pass near or through many of the areas with the highest solar radiation potential (see Arizona Solar Insolation map) The salt basins shown in the Arizona: Salt Basin and ETL map are important because they can be used for energy storage. This allows the energy from solar power system to be used at a different time than when it is created. This allows solar generation units to smooth their production profile or use the energy at a time when it is more valuable. This ability to store energy is appealing to utilities that purchase solar electricity since it make
16 electric power load more dispatchable.
17
18
19
20 POTENTIAL FOR SOLAR ENERGY DEPLOYMENT IN ARIZONA Solar electricity production is in its infant stage in Arizona at the present time. Although residential and commercial installed photovoltaic capacity is on the rise, it still remains a small share of the State s total electric generation resource. Similarly, the State s electric utilities are seeking ways to add capacity or purchase renewable energy sources to meet their obligations under the ACC renewable portfolio standard. Nevertheless, there are few existing large utility scale solar power generation units operating in the State. Independent power producers have expressed an interest in building solar power plants in Arizona and selling the electricity to regulated utilities to help them meet their mandated renewable energy requirements (SRP and utility cooperatives are voluntarily cooperating with renewable programs similar to the renewable portfolio standard even though they are not regulated by the ACC). The plans for building solar power plants in Arizona have been subject to revision as market conditions change. Construction plans are extremely sensitive to the existence and magnitude of federal, state and local subsidies for solar power production. The recent dramatic plunge in the price of oil and the tightening of the credit markets is causing some projects to be delayed or canceled. Arizona Benefits of Expanded Solar Energy Production The deployment of solar electric generating capacity will have a number of positive benefits for Arizona. Some of the benefits of increased solar generating deployment in Arizona are listed below. It would enhance national security by decreasing U.S. dependence on risky and unreliable foreign oil supply sources It would help to mitigate adverse climate change by reducing greenhouse gas emissions It could hedge against future price increases in oil, natural gas and nuclear generation It could hedge against the potential loss or limitation of coal-fired generation due to CO 2 emission limitations or the expense of additional emissions remediation equipment It can help state utilities meet their ACC renewable energy portfolio standard requirements It allows utilities to add generating capacity incrementally as it is needed, rather than in large units like nuclear and coal base load generating stations Solar generation and manufacturing would add jobs and increase wages in the state. Solar generation and manufacturing would contribute higher tax revenues to Arizona governments at all levels
21 Obstacles to Solar Power Penetration in the Arizona Electricity Market There are a number of obstacles to the penetration of solar electric generation into the Arizona market. In the absence of financial incentives, solar power has a high cost relative to conventional power sources. At the present time, it is difficult for solar power to penetrate the State s electric power market without significant subsidies. It has intermittent power availability because, for the most part, solar power is available only when the sun is shining. The electricity provided by solar power plants would be more valuable to electric utilities if it could be dispatched into the transmission grid when needed rather than when it is available. In addition, large solar thermal and photovoltaic generation units require large amounts of land the capture enough sunlight to power the plant. One of the problems in promoting large scale solar power plants is that they require a massive amount of affordable, contiguous, and relatively level land. In general, the water usage by solar generating units is small relative to the amount used by conventional power plants. However, large solar thermal plants require substantial amounts of water to cool the equipment. In recent years, the availability of solar photovoltaic equipment has sporadically been affected by a shortage of silicon. This shortage resulted in higher prices for the silicon crystals used to manufacture PV cells and limited the level of production. Overcoming Obstacles to Solar Energy Market Penetration in Arizona There are several technical and market trends that will contribute to overcoming the obstacles to solar power penetration into the Arizona electric market. First, costs are declining over time over time due to the following factors: Improvements in solar technology are leading to higher efficiencies, which reduce the per unit cost of electricity from solar power units. The average cost of electricity from large scale photovoltaic units could be reduced by cogenerating process heat, along with electricity (a side benefit of using the waste heat is an improvement in photovoltaic conversion efficiency). Average costs for solar generating equipment will decline as the solar power market expands and as the scale of production increases (manufacturing economies of scale). Standardization of small solar PV modules, mounting brackets and electrical connections designed into new homes and commercial structures will lower the installation costs of residential and small commercial solar energy applications.
22 The cost of owning and operating small scale residential and commercial solar power units can be offset by net metering which allows residential home owners to sell excess electricity directly to the utility. The problem of intermittent solar power availability can be remedied by using storage capacity to store solar energy for use at a higher valued time. Storage options include: Battery or chemical storage Compressed air energy storage (CAES) or pumped hydro storage Thermal storage The availability of solar thermal and PV equipment will improve as these energy sources penetrate the global market. Manufacturing capacity will grow to meet the demand for solar power.
23 RENEWABLE ELECTRICITY DEMAND FORECAST FOR ARIZONA Impact of Renewable Energy Portfolio on Energy Market in Arizona Given the relatively high cost of solar and other renewable power, and the ambitious renewable energy targets of the Arizona environmental portfolio standard, we predict that the demand for renewable power will be driven almost entirely by the renewable energy standard (RES) requirements over the next 20 years. These requirements are listed in Table 4 below. The RES total requirement gradually increases until it reaches 15 percent in By 2012, 30 percent of the renewable power is required to be from distributed generation. Table 4 - Arizona Renewable Energy Standard Requirements RES Total Distributed Share Distributed Share Non-Distributed Year Requirement of RES of Total Share of Total % 20.00% 0.50% 2.00% % 25.00% 0.80% 2.30% % 30.00% 1.10% 2.50% % 30.00% 1.20% 2.80% % 30.00% 1.40% 3.20% % 30.00% 1.50% 3.50% % 30.00% 1.80% 4.20% % 30.00% 2.10% 4.90% % 30.00% 2.40% 5.60% % 30.00% 2.70% 6.30% % 30.00% 3.00% 7.00% % 30.00% 3.30% 7.70% % 30.00% 3.60% 8.40% % 30.00% 3.90% 9.10% % 30.00% 4.20% 9.80% % 30.00% 4.50% 10.50% % 30.00% 4.50% 10.50% % 30.00% 4.50% 10.50% % 30.00% 4.50% 10.50% % 30.00% 4.50% 10.50% % 30.00% 4.50% 10.50%
24 RES requirements apply to investor-owned utilities in Arizona; principally APS, TEP and cooperatives. SRP and some other power producers are not subject to RES requirements. However, SRP and other utilities have established their own renewable power goals, and we expect some demand for renewable energy to come from SRP and these other utilities that are not subject to the ACC RES requirements. The Table 5 below is based on primarily on demand for renewable power in Arizona, as projected in the study by Black & Veatch. The column labeled Total Renewable Demand is the projected demand for nondistributed renewable power over the next 20 years. There are opportunities for new investment in renewable energy other than solar power (wind, bio-mass, etc.), particularly in the near term. But solar power appears to be the most likely source for meeting much of this renewable demand. Table 5- Arizona Renewable Energy Demand Forecast (Cumulative GWh)* Total Renewable Existing and Planned Net New Development Projected Load Year Demand Projects Required Subject to RES , , , , , , , ,302 75, , ,650 77, , ,019 81, , ,707 84, , ,440 87, , ,220 90, , ,049 93, , ,930 96, , ,866 99, , , , , , , , , , , , , , , , , , , , , , , , , , , ,120 Table 5 extends Table 7-4 in Black and Veatch to the years We assume 3.5 % annual growth in load subject to RES, and hence 3.5 % growth in total renewable demand (since the RES minimum percentages remains constant after 2025).
25 ECONOMICS OF SOLAR POWER IN ARIZONA This section of the report discusses the methodology used to estimate and project the Levelized Cost of Energy (LCOE) for several different solar electric generation technologies that are either currently available or will be available in the market over the next 30 years. The LCOE for each of the different solar technologies is driven by their initial investment costs, annual O&M costs, capacity of the generating units, annual electric production rates, efficiencies, solar radiation and climatic conditions, and subsidies from federal, state and local governments, as well as local electric utilities. These factors, along with a consistent set of financial and economic assumptions, are input into several financial spreadsheets to estimate the LCOE for various representative solar technologies and model the effects of changes in economic and technical conditions over time. There have been a number of studies in recent years that have examined the economics of solar and renewable energy systems on the energy market in Arizona and other U.S. western states. These studies include: Arizona Solar Electric Roadmap Study (Prepared by Navigant, 2007) Arizona Renewable Energy Assessment (Prepared by Black & Veatch, 2007) Powering Arizona (Prepared by Arizona State University, 2008) Clean and Diversified Energy Initiative (Western Governor s Association, 2006) It is often difficult for solar energy researchers to compare the economic results from different studies on a consistent basis. These difficulties result from a variety of causes. First, studies often present monetary information from different base years and use different inflation assumptions in the forecast. Second, researchers use different economic, financial and technical assumptions to generate their economic results. Finally, they use different types of financial models to analyze complex and detailed technical and financial relationships. The process of analyzing the economics of solar energy could be simplified by following a consistent methodology. First, define a set of reference solar generating units that will be available in the market of the forecast period. These solar technologies should be characterized on the basis of their costs and production profiles. Second, a consistent set of economic and financial assumptions, including subsidies and tax treatment, should be developed for use in the economic analysis. Third, an economic/financial model should be used to evaluate the economic results for the solar power units. Finally, the model can be run using different financial and technical assumptions to determine their effects on LCOE and other economic metrics.
26 Solar Reference Units for Economic Analysis The first stage of the economic analysis is to define a set of solar reference units that are likely to penetrate the electricity market in Arizona over the forecast horizon. Solar generating technologies tend to fall into two major categories, solar photovoltaic modules and solar thermal electric generating plants. Solar photovoltaic units convert energy from the sun directly into electric current. Solar thermal generating plants focus heat from the sun to produce steam to drive a generator or directly heat a motor (Sterling cycle) that rotates a generator. These technologies range in size from small residential roof top solar photovoltaic units to large utility scale solar thermal generating plants. The solar reference units fall into groups based on their intended application, size, and user group. Residential and commercial applications typically are used on-site and tend to be much smaller than industrial and utility applications. For the purposes of this study the user categories are residential, commercial and utility. The solar reference units for each class are listed below: Solar Reference Units Residential Flat plate crystalline silicon photovoltaic Commercial Flat plate crystalline silicon photovoltaic Utility Photovoltaic Flat plate crystalline silicon photovoltaic Thin film photovoltaic Concentrated photovoltaic Utility Solar Thermal Solar Parabolic Trough Solar Parabolic Dish Solar Tower Residential Photovoltaic Reference Units Residential users typically will install small rooftop photovoltaic (PV) equipment on-site. They either use the power directly or sell excess power back to the utility via a net metering arrangement. The PV equipment is usually installed on roof tops or other locations on the existing property so no additional land is necessary. Currently, a high proportion of the PV units are installed as retrofits on existing homes. The cost of installation will probably decrease in the future as PV units are increasingly designed into new home construction.
.")

27 The most common type of photovoltaic equipment in use today is flat plate crystalline silicon. It consists of an array of silicon PV cells mounted in a rigid frame. This equipment is attached to the home to convert sunlight into electricity (see Photo 1). Photo 1 Residential Silicon PV Application Thin film photovoltaics uses chemical deposits on a flexible thin film substrate to create an electric current. Thin film PV can be used in most applications that can be performed with traditional silicon PV cells. Thin film PV has some advantages over silicon PV cells. First, it is flexible and can be molded around surfaces that are not flat and it can be built into building materials. Second, it is deposited on a thin film substrate rather than printed into silicon wafers. This makes it possible to gain cost savings in the manufacturing process (see Photo 2). Photo 2 Thin Film PV Integrated into Roof Shingles
28 The technical and cost assumptions for a residential solar PV reference unit are shown in Table 6. The financial assumptions for the residential PV system are reported in Appendix 1. Based on these assumptions the Levelized Cost of Energy for the residential PV unit is 17.6 cents per kwh. Table 6 Residential Solar Photovoltaic Characteristics System Capacity (KW) 3.8 Annual Energy Output (KWh) 6,658 Capacity Factor (%) 20.0% System Life (years) 30 System Degradation (%/yr) 1% System Costs Capital Investment ($ per KW) $9,000 Annual O&M Cost ($ per KW) $50 O&M Escalation Rate 0 Economic Results Real LCOE (cents/kwh) 17.6 Commercial Photovoltaic Reference Units Commercial PV users also tend to install equipment on buildings and property on-site. They can also use the power directly or sell excess power back to the utility via a net metering arrangement. Since the PV equipment is typically installed on the existing property, no additional land is necessary. Commercial users can use silicon PV or thin film PV to produce electricity. However, commercial applications are larger than residential ones (see Photo 3).

29 Photo 3 Commercial Silicon PV Rooftop Application The technical and cost assumptions for a commercial solar PV reference unit are shown in Table 7. The financial assumptions for the commercial PV system are reported in Appendix 1. Based on these assumptions the Levelized Cost of Energy for the commercial PV unit is 14.9 cents per kwh. Table 7 Commercial Solar Photovoltaic Characteristics System 2010 Capacity (KW) 200 Annual Energy Output (kwh) 332,88 Capacity Factor (%) 19.0% System Life (years) 30 System Degradation (%/yr) 0.01 System Costs Capital Investment ($ per KW) $7,000 Annual O&M Cost ($ per KW) $25 O&M Escalation Rate 0 Economic Results Real LCOE (cents/kwh) 14.9

30 Utility Photovoltaic Reference Units Utility photovoltaic generation units tend to be much larger than residential and commercial units. These units are usually large enough to supply electricity for sell into the electric transmission grid. They are built as self standing generation plants and the electricity they produce is used off-site. These large solar PV plants can require large capital investments and use significant amounts of land to capture the large quantity of sunlight necessary to power the plant. Utility PV plants can be operated by electric utility companies or by independent power producers (IPP) that operate the plant and sell the power to utilities under an purchase power agreement at contract electric rates. Utility PV generating plants currently tend to use silicon photovoltaic modules to produce electricity, but on a much larger scale than residential and commercial users (see Photo 4). Photo 4 Utility Large Scale PV Generation System The technical and cost assumptions for a utility solar PV reference unit are shown in Table 8. The financial assumptions for the utility PV system are reported in Appendix. Based on these assumptions the Levelized Cost of Energy for the utility PV unit is 21 cents per kwh.
 $6,000,000 Annual O&M Cost ($ per MW) $25,000 O&M Escalation Rate Economic Results Real LCOE (cents/kwh) 21.")
31 Table 8 Utility Solar Photovoltaic Characteristics System 2010 Capacity (MW) 5 Annual Energy Output (MWh) 10,074 Capacity Factor (%) 23.0% System Life (years) 30 System Degradation (%/yr) 0.01 System Costs Capital Investment ($ per MW) $6,000,000 Annual O&M Cost ($ per MW) $25,000 O&M Escalation Rate Economic Results Real LCOE (cents/kwh) 21.0 Concentrated photovoltaic (CPV) is another technology that could have promising potential for generating electricity from the sun. EPRI explains that CPV uses lenses and mirrors to focus more sunlight per unit of cell surface to produce more power. This technology is useful in areas where land availability is limited, or where land prices and rents are expensive(see Photo 5). Photo 5 Experimental Concentrating Solar Photovoltaic Unit
32 The technical and cost assumptions for a utility solar concentrated photovoltaic (CPV) reference unit are shown in Table 9. The financial assumptions for the utility CPV system are reported in Appendix 1. Based on these assumptions the Levelized Cost of Energy for the utility CPV unit is 19.1 cents per kwh. Table 9 Utility Concentrated Solar Photovoltaic Characteristics System 2010 Capacity (MW) 15 Annual Energy Output (MWh) 30,222 Capacity Factor (%) 23.0% System Life (years) 30 System Degradation (%/yr) 0.01 System Costs Capital Investment ($ per MW) $5,000,000 Annual O&M Cost ($ per MW) $50,000 O&M Escalation Rate Economic Results Real LCOE (Cents/kWh) 19.1

33 Utility Solar Thermal Reference Units Solar thermal power plants concentrate solar energy to produce high temperatures. In solar parabolic trough and solar towers, this heat is then used to produce steam that spins turbines that power electric generators and produce electricity. In solar parabolic dish systems, the heat is focused on a small motor, such as a Sterling engine, that drives an engine that turns a generator to produce electricity. One advantage of a large solar thermal unit is that it is possible to store energy for use at a different time when it is needed. The cost of thermal storage is lower than the cost of battery storage for photovoltaic units. The most common solar thermal system designs are the solar parabolic trough, the solar parabolic dish, and the central solar tower. Each of these designs has its own set of advantages and disadvantages that will be discussed in the paragraphs that follow. Solar Parabolic Trough The solar parabolic trough focuses sunlight on a long tube that contains a heat transfer fluid that transfers heat into a heat exchanger. The heat from the heat exchanger is used to produce steam to power and electric generator to produce electricity. Parabolic troughs have been used by the electric power industry for decades. They can be designed to move and track the sun to gain higher efficiencies. They can also be designed to store thermal energy for a limited amount of time so that plant output can be more stable and electric production can be better timed to meet the needs of the market (see Photo 6). Photo 6 Utility Scale Solar Parabolic Trough System
34 The technical and cost assumptions for a utility solar parabolic trough reference unit are shown in Table 10. The financial assumptions for the parabolic trough system are reported in Appendix 1. Based on these assumptions the Levelized Cost of Energy for the utility solar parabolic trough unit is 13.2 cents per kwh. Table 10 Utility Solar Parabolic Trough Characteristics System 2010 Capacity (MW) 100 Annual Energy Output (kwh) 333,403 Capacity Factor (%) 38.1% System Life (years) 30 System Degradation (%/yr) 1% Storage (hr.) System Costs Capital Investment ($ per kw) $5,500,000 Annual O&M Cost ($ per kw) $50,000 O&M Escalation Rate Economic Results Real LCOE (cents/kwh) 13.2 Solar Parabolic Dish A solar parabolic dish system focuses sunlight onto an engine, such as a Sterling cycle engine. The heat from the sunlight expands gases in the engine which active pistons that are used to turn a generator to make electricity. The parabolic dish system is very flexible with regard to sizing. Each dish is a self contained unit. Dish units can be added as needed as electric demand grows. Dish units can also be designed to track the path of the sun and achieve optimal efficiency during the day (see Photo 7).

35 Photo 7 Solar Parabolic Dish Sterling Test System The technical and cost assumptions for a utility solar parabolic dish reference unit are shown in Table 11. The financial assumptions for the parabolic dish system are reported in Appendix 1. Based on these assumptions the Levelized Cost of Energy for the utility parabolic dish unit is 19.6 cents per kwh. Table 11 Utility Solar Parabolic Dish Characteristics System 2010 Capacity (MW) 15 Annual Energy Output (MWh) 31,536 Capacity Factor (%) 24.0% System Life (years) 30 System Degradation (%/yr) 0.01 System Costs Capital Investment ($ per MW) $6,000,000 Annual O&M Cost ($ per MW) $15,000 O&M Escalation Rate Economic Results

36 Real LCOE (cents/kwh) 19.6 Solar Tower A central solar tower system uses heliostats (mirrors) to focus sunlight on the tip of a tower. The sunlight heats a heat transfer fluid and the heat is used to create steam to power a generator and make electricity. The heliostats are programmed to track the sun and increase performance efficiency. This technology is not currently in widespread commercial use, but it will likely get a foothold in the market over time (see Photo 8). Photo 8 Solar Power Tower Test Facility The technical and cost assumptions for a utility solar parabolic tower reference unit are shown in Table 12. The financial assumptions for the parabolic tower system are reported in Appendix 1. Based on these assumptions the Levelized Cost of Energy for the utility parabolic tower unit is 12.6 cents per kwh.
37 Table 12 Utility Solar Tower Characteristics System 2010 Capacity (MW) 100 Annual Energy Output (MWh) 315,360 Capacity Factor (%) 36% System Life (years) 30 System Degradation (%/yr) 0.01 Storage (hr.) 0 System Costs Capital Investment ($ per kw) 5,500,000 Annual O&M Cost ($ per kw) $70,000 O&M Escalation Rate Economic Results Real LCOE (cents/kwh) 12.6
38 SAM Solar Advisor Model The economic and financial results for each solar reference technology were calculated using financial spreadsheets developed by Sandia National Laboratory and the National Renewable Energy Laboratory (NREL) for use in the Solar Advisor Model (SAM Version 2.0. This model is described in the Solar Advisor User Guide for Version 2.0. The user guide and the SAM model are available at no cost on the NREL website. The model and financial spreadsheets are available to the public. The technical component of SAM models the energy production for each solar technology. The energy production for a photovoltaic unit is based on the efficiency of the PV module and the inverter. Similarly, the energy production for solar thermal units is based on the efficiency of the solar equipment, heat transfer equipment and the generator. Energy production in a particular location is affected by the amount of solar radiation, local weather patterns and climate factors. The climatic conditions in many U.S. cities are contained in a library within the model that can be accessed through a dropdown menu. The Arizona cities included in SAM are Phoenix, Tucson, Prescott and Flagstaff. Climate factors for cities not contained in SAM can be uploaded into the model from other sources. The amount of annual electricity production is related to the size of the solar generating unit by the capacity factor. The capacity factor is the ratio of the annual amount of energy produced to the amount of energy that could potentially be produced if the solar plant was run at full capacity every hour of the year (8760 hours X peak kw capacity). The capacity factor for a solar generation unit is affected by the amount of solar radiation, the number hours of sunlight and the efficiency of the solar unit. The higher the level of solar radiation and unit efficiency, the higher the capacity factor for a solar generator. SAM uses the technical characteristics of each solar technology, along with local climatic conditions, to estimate annual, monthly, and hourly energy production profiles. SAM contains a set of prepackaged standard solar configurations for residential and commercial small scale solar photovoltaic systems, and larger utility scale photovoltaics, concentrated photovoltaics and parabolic solar troughs. SAM Financial Spreadsheets SAM uses a set of financial spreadsheets to perform economic and financial analysis on various solar energy production units. These spreadsheets were used in this study to calculate the Levelized Cost of Energy (LCOE) for each of the solar reference units. The SAM spreadsheets use financial inputs such as initial capital costs of the solar unit, annual O&M costs, life of the equipment, inflation rate, annual energy production,
39 interest rates and terms on loans, depreciation schedules, tax rates, real and nominal discount rates, etc. Based on these financial and assumptions, the SAM financial spreadsheets calculate the annual cash flow for the solar generation technologies. It also calculates summary statistics for important economic measures. These measures include: Capital costs Levelized cost of energy (LCOE) Internal rate of return (IRR) Payback Net present value (NPV) The LCOE is a measure of cost per kwh necessary to pay for the amount of investment in the solar unit plus the annual operating and maintenance cost. The LCOE is often used as a basis to compare the cost of solar generation projects to that of conventional electric generation projects. It is also used to assess the impact of federal, state and local government subsidies, as well as subsidies offered by local utilities. Economic and Financial Results The economic and financial analysis was performed on each of the solar power reference units discussed in a previous section of the report. The analysis was conducted using the SAM financial spreadsheets. There is climate information available for Phoenix, Tucson, Flagstaff, and Prescott. However, the analysis in this study is done using a Phoenix location. Phoenix is chosen on the basis of several criteria: 1. Phoenix is the largest metropolitan area in Arizona 2. Phoenix is the home of the two largest electric utilities in the State 3. Climate and solar radiation in the other cities varies slightly from that in Phoenix, but not enough justify the additional time, effort and detail involved. LCOE Results by Solar Technology The levelized cost of energy (LCOE) for each of the solar referenece units is displayed in Table 13. It shows the progressive effect on LCOE of adding additional incentives from Federal and state governments and local utility sources. The first column of the Table shows the LCOE for each solar technology without any subsidies. The LCOEs range from a low of 17.4 /kwh for a solar tower to a high of 36.3 /kwh for a residential PV system. Without any subsidies, the cost of solar power would be much higher than power from conventional generation sources.
40 Table 13 The Effect of Subsidies on Levelized Cost of Energy (LCOE) by Solar Technology* Technology Without Incentives With 30% Federal ITC (No Max) Plus AZ State ITC (With Max) Plus APS Utility CBI Residential PV LCOE (cents per kwh) Payback Period (years) >30 >30 >30 23 Commercial PV LCOE (cents per kwh) Payback Period (years) >30 >30 > Utility Large Scale CPV LCOE (cents per kwh) Utility Solar Trough LCOE (cents per kwh) Utility Solar Dish LCOE (cents per kwh) Utility Solar Tower LCOE (cents per kwh) * The technical and cost assumptions for each solar technology are reported in Tables 6 to 12. The financial assumptions are reported in Appendix 1. A federal investment tax credit (ITC) is available to individuals or organizations that invest in solar power systems. The federal ITC offers a tax credit of 30% of the cost of purchasing and installing a solar power system. This year, the federal government removed the maximum credit levels required in previous years. This has had a significant impact on the LCOE for solar power systems, particularly large power systems that previously had their subsidy limited by the maximum constraint. The second column of Table 13 shows the impact of the 30% federal ITC on the LCOE of the different solar units. With no limit on the maximum ITC payment, the 30% federal ITC results in a roughly 30% reduction in LCOEs for each of the solar technologies. The third column of Table 13 shows the effect of adding the Arizona state ITC on LCOE. The state ITC offers a 25% ITC to homeowners installing a solar PV unit on-site. The amount of the ITC is limited to a maximum of $1,000. As a result of quickly hitting the
41 maximum ITC, a 25% state ITC lowers residential ITC by less than 3%. While the maximum limit on the state ITC protects the state from an unlimited exposure to solar tax credits, it severely erodes the effectiveness of the subsidy in reducing solar LCOE and encouraging expanded residential investment in solar power systems. The impact of the state ITC on businesses and utilities is very insignificant due to the low maximum payment level. The state ITC for businesses and utility companies is equal to 10% of the cost of purchasing and installing solar generation equipment. However, the maximum payment is limited to $25,000. This 10% ITC translates to less than a 3% reduction in LCOE for commercial businesses, due to the payment limit. However, the payment limit is so low relative to the cost of a large solar power unit, there is virtually no impact on the cost of power from a large scale solar plant from the state ITC as it is now structured (see Table 13). Residential and commercial customers have an additional incentive for purchasing and installing solar power units from their local utilities. All of the state s major utilities and electric cooperatives offer incentives for the purchase and installation of solar power systems. Unlike the federal and state investment tax credits which are based on a percentage of the total cost of the solar system, these utility capacity based incentives (CBI) offer a fixed amount of incentive per installed kw capacity of solar units. SRP, TEP, Unisource Electric and the electric cooperatives also have similar programs, but APS is used as an example to avoid excessive duplication of the example. Since APS is being used in this study as a proxy for the state-wide economics of solar power systems its CBI of $3 per kw for residential and $1.5 per kw for commercial solar applications, these incentive levels were used in Table 13 to derive the impact of adding local utility CBI on the LCOE for residential and commercial solar units. The utility incentive is not shown for utilities because it is not available to utilities. The utility CBIs turn out to be important for residential and commercial customers because, at current system cost and efficiencies, they lower the payback period from over thirty years to less than thirty years, which now makes the time required to payback solar system capital cost from electric cost savings less than the system life (see Table 13). Conventional and Renewable Generation LCOE The subsidized LCOE for solar power units is finally beginning to be cost competitive with some conventional generation technologies. The range of LCOE for selected conventional and renewable generation systems is shown in Table 14. These estimates were derived from a recent study by Lazard titled, Levelized Cost of Energy Analysis.
42 Table 14 - Range of LCOE Estimates by Generation Technology (cents/kwh) Technology Low LCOE High LCOE Renewable Generation Biomass Direct Landfill Gas Wind Geothermal Conventional Generation Gas Peaking IGCC Nuclear Coal Gas Combined Cycle Source: Lazard Future Cost Trends for Solar Electric Generation Technologies The economics of solar power are expected to improve over time due to three factors. First, the efficiency of solar power systems has been improving over a long period of time. This trend of increasing efficiency is expected to continue for the foreseeable future and result in lower levelized costs for solar energy. Second, there is a learning curve for solar equipment manufacturing. As production increases, manufacturing processes become more efficient and the cost of equipment declines. For example, the Solar Energy Industry Association claims, For every doubling in solar power sales volume, costs decline by 10%. A recent study by Black &Veatch calculated the costs of different types of solar power equipment, over time, based on increasing solar PV and solar thermal production levels. Increased experience manufacturing solar power equipment leads to lower costs over time relative to conventional generating capacity. This study used the Black and Veatch real capital cost reduction profile over the next twenty years to model the impact of declining real capital costs for each of the solar reference units on their respective LCOEs. Table 15 shows the real LCOEs for each solar technology with and without subsidies. Over time, solar power systems will become more competitive with conventional generation technologies. In addition, solar power generation does not have any fuel costs, unlike conventional generation technologies which can be subject to large, unpredictable fuel price spikes. Finally, solar power production does not create any significant volumes of greenhouse gases. In the future, fossil fuel generation units may be subject to reduced
43 emissions levels and forced to buy credits from renewable sources or pay taxes or fines. Solar generation, on the other hand could raise addition revenue by selling carbon credits. Reduced equipment costs will improve solar competiveness over time. Nevertheless, subsidies are important in the short term to encourage increased solar power generation and to lower manufacturing costs by increasing manufacturing experience.
44 Table 15 LCOE Projections for Selected Years by Solar Technology Solar Technology Residential PV LCOE No Incentives LCOE Real 2008 Level Commercial PV LCOE No Incentives LCOE Real 2008 Level Utility Large Scale CPV LCOE No Incentives LCOE Real 2008 Level Utility Solar Trough LCOE No Incentives LCOE Real 2008 Level Utility Solar Dish LCOE No Incentives LCOE Real 2008 Level Utility Solar Tower LCOE No Incentives LCOE Real 2008 Level
45 ECONOMIC IMPACT ON ARIZONA OF INCREASED SOLAR ENERGY PRODUCTION This section of the report discusses the economic impact of the deployment of distributed and grid-connected solar generation systems. The central theme of this analysis is to model the amount of solar generation that would have to come on-line over time in order to meet the ACC Renewable Energy Standard (RES). Solar Energy Demand Calculations In order to determine the amount of solar power that would be needed over to time fulfill the ACC RPS, it was necessary to determine the total amount of renewable energy that would be needed over the next twenty years, then determine the likely solar share of the total renewable requirement. Fortunately, Black and Veatch recently conducted a study for several Arizona electric utility companies in which they projected the amount of renewable electricity generation that would be needed to satisfy the RES over time. This information is included in Table 5 above. The demand for renewable electric generation was determined by deducting the amount of existing or planned renewable electric generation from the total renewable energy demand each year of the forecast period. The demand for solar electric power was then estimated based on the assumed solar share of the renewable generation market. The share of solar generation is expected to initially be a small share of the total renewable generation market but it is expected to contribute almost of all of the incremental renewable electricity demand towards the end of the forecast period. Solar power s share of the total renewable electricity market is assumed to increase from roughly 6% to 71% between 2010 and The ACC Renewable Energy Standard distinguishes between distributed and grid-connected generation sources. The relative share of distributed and grid-connected renewable electric demand is shown in Table 4 above. Distributed generation includes solar systems, such as roof top units and other applications, that are located on-site and are not intended to produce electricity for resale (although excess electric production may be sold back to the local utility, if permitted through a net metering arrangement). In this study, residential and commercial photovoltaic systems are considered to be distributed generating systems. As such, they are assumed to have no additional land requirements.
46 Grid-connected units tend to be large scale generating units that sell power into the grid to be used off-site. These types of units would include such technologies as large scale PV, solar parabolic troughs, solar parabolic dishes, and solar towers. Once the solar electric demand has been split into distributed and grid connected components, it is then allocated among the various solar technologies, based on assumptions about their relative market shares. For example, the distributed solar electric demand is divided 50:50 between residential and commercial photovoltaic systems. The grid connected market shares assumed to change over time as different technologies gain and lose share over time. Initially, solar trough systems have the largest share of the market, but other technologies will gain share as they gain more market experience and acceptance. Table 16 shows how the market shares of grid connected solar technologies change between 2010 and Table 16 Grid Connected Solar Technology Shares 2010 & 2030 Solar Technology Solar PV (all types) 12.5% 15% Solar Parabolic Trough 50% 35% Solar Parabolic Dish 25% 38% Solar Tower 12.5% 12% Once the solar electric demand has been allocated to each of the solar reference units, the annual incremental is calculated to determine the amount of capacity each solar system would have to bring online annually to meet the ACC requirements. Then, the capacity factors for the various technologies are used to estimate the amount of solar generation capacity that would have to be added each year. The capital investment per MW for each system is used, along with the incremental capacity to estimate the capital investment required to build the required level of solar generation capacity. The annual capital investment is then input into the IMPLAN model to estimate construction expenditures and labor requirementa, as well as wage and value added from solar plant constructions expenditures (see IMPLAN discussion below). Similarly, the amount of O&M expenditures is estimated annually. These expenditures are input into IMPLAN to determine permanent employment levels, wages and value added for annual O&M activity.
47 IMPLAN Economic Analysis The economic analysis in this study was performed using the IMPLAN Model. IMPLAN is an input-output model that is used to examine relationships in an economy between businesses and final consumers. It tracks the effects of a change in investment or final demand on economic activities within an entire region. An input-output model mathematically describes the purchases an industry makes from other industries during the construction or production process. For example, if a new solar power plant is constructed, IMPLAN would track the direct expenditures for the project and how those expenditures would be allocated to other industries that supply equipment, components, materials, transportation, fuel, etc. Thus the direct expenditure for the project creates indirect demand for the products and services of other industries. To the extent that purchases from these industries are made within the region (Arizona), those revenues are spent again by these industries, resulting in additional demand and jobs within the region. The original investment results in a multiple impact on spending and jobs within the region. The size of the multiplier is reduced as more money is spent outside the region, resulting in economic leakage from the region. The IMPLAN Model also tracks the payments made by each industry to workers, taxes, profits, interest and other income. These payments represent the value-added by the increase in investment or spending by an industry. From these relationships, IMPLAN can impute the impact of a change in investment on employment and income. The IMPLAN Model computes the direct, indirect and induced impact of changes in investment or demand within a region. Direct impacts include the direct effect of the new investment or spending on economic variables such as employment, value-added, wages, etc. The indirect impact comes from the expenditures made by the initial industry to purchase goods and services from its suppliers. The induced impact occurs as employees spend their incomes to purchase final goods and services. The strength of the multiplier depends on how much of the spending at each round of the process remains in the region. The more spending that leaks out of the region, the lower the economic multipier. Economic Analysis Assumptions The economic analysis conducted in this study represents the maximum amount of economic impact that could be achieved if all of the projected solar generation comes on line on schedule. This implies that all construction and installation and O&M employment is provided from instate labor. All equipment, materials, supplies, etc. are purchased in-state to the extent they are available in Arizona in the IMPLAN input-output tables. Since there is no leakage of spending to out of state sources, this represents the maximum economic multiplier.
48 Although it is unrealistic to expect that all of the expenditures from the Arizona solar generation industry will go to in-state labor and suppliers, it at least gives an upper bound to the economic impact from future solar generation activity. Besides, it is extremely difficult to project the amount of solar equipment manufacturing that will eventually take place in Arizona or the likelihood, given the large amount of solar construction, that Arizona will develop a specialized indigenous workforce to do construction and installation. IMPLAN requires that the industries in which investments or expenditures occur be specified so that their economic impact can be calculated. For the purposes of this analysis, economic impacts for each solar technology have been divided into two phases, construction or installation, and O&M.
49 ECONOMIC ANALYSIS RESULTS This section of the report shows the results of the economic analysis. The tables show economic snapshots for 5 year intervals from 2010 to The information in each of the tables that follow, show the annual incremental impact of increased solar generation, then the cumulative impact over time. The results are reported for distributed solar systems (commercial and residential PV combined) and grid connected systems (large scale PV, trough, dish and tower systems combined). The economic impact numbers generated from the IMPLAN model include direct, indirect and induced employment, wages and value added. The direct impacts are associated with investment, spending, and employment directly related to solar power construction and on-going operations and maintenance activities. Indirect impacts relate to economic activity that occurs as investment and O&M expenses are used to purchase materials, equipment and services from outside industries. This generates additional employment and income. Induced impacts occur as employees spend their income on final good and services, creating additional jobs and income. For the purpose of this report, all of the numbers reported represent the total impacts of the solar power industry including direct, indirect and induced economic impacts. The total amount of economic impact is much larger than the economic impact associated with employment and wages directly involved in the solar power industry. This additional impact is known as the economic multiplier which occurs due to the fact that initial investment and expenditures for solar projects is re-spent, generating additional incomes and jobs in the region. In this case of construction employment, the direct employment numbers have been split out to give an idea of how much annual construction labor would be direct used to construct the solar power production facilities. These construction project jobs are assumed to last for one year and are not considered permanent. Similarly, the direct O&M employment numbers have been split out to give an idea of how many permanent jobs will be directly associated with operating solar power plants. Solar Generation and Capacity Requirements The amount generation and capacity necessary to fulfill the requirements of the ACC Renewable Energy Standard was estimated based on the Black & Veatch renewable energy demand projections mentioned earlier in the report. These projections were then allocated to determine the total demand for solar electricity and then split into distributed generation and grid connected generation and capacity requirements. Distributed generation consists of residential and commercial PV applications. Grid connected generation consists of large scale solar PV (all types), solar parabolic troughs, solar parabolic dish and solar towers.
50 Electric generation and capacity are further estimated for each of the solar technologies examined in the study. However, due to space considerations, the technology specific detail is not presented in this report. Solar Electric Generation The results for solar generation are reported in Table 17. In 2010, solar is expected to have about a 6% share of the renewable energy market. That year, 32 thousand MWh will be required from solar production. As solar power s share of the renewable energy market increases, the annual amount of incremental generation from solar will increase to a peak of 1.2 million kwh in 2025, driven by increasing ACC requirements for renewable generation and an increasing share of solar in the generation mix. The incremental demand for solar electric generation drops to 483 thousand MWh by 2030 due to the fact that the required share of renewable energy stops increasing in From 2025 to 2030 all of the incremental generation requirements will be supplied by solar power. The annual amount of power generation from solar will steadily increase from 32,300 MWh in 2010 to 9,544,100 MWh in Solar Electric Capacity The amount of solar generating capacity needed to support the generation requirements was estimated based on the amount of electric demand that would be supplied by each of the solar reference units given their respective capacity factors (capacity factors relates the annual amount of power production relative to the size of the plant). The amount of solar electric capacity required to support the solar generation requirements is going to necessitate a massive amount of solar plant construction. Table 18 shows the amount of capacity needed by year. The amount of solar electric capacity is expected to increase from 13.4 MW in 2010 to 4,340 MW in To accomplish this, it will be necessary to add capacity at an annual rate that increases from 13.4 MW in 2010 to a peak of 529 MW in After 2025 the incremental amount of capacity eases to MW per year after the renewable share stops growing in 2025.
51 Table 17 - Arizona Solar Power Generation Solar Power Incremental Electricity Generation (MWh) Distributed Annual Incremental Generation 6,466 47, , , ,998 Grid-Connected Annual Incremental Generation 25, , , , ,328 Total Annual Incremental Generation 32, , ,024 1,163, ,325 Solar Power Annual Electricity Generation (MWh) Distributed Annual Generation 6, , ,887 2,185,950 2,863,235 Grid-Connected Annual Generation 25, ,805 1,880,403 5,100,550 6,680,882 Solar Power Annual Generation 32, ,864 2,686,290 7,286,500 9,544,117
52 Table 18 - Arizona Solar Power Capacity Solar Power Capacity Additions (MW) Distributed Incremental Capacity Grid-Connected Incremental Capacity Solar Power Incremental Capacity Solar Power Generation Capacity (MW) Distributed Generation Capacity , ,677.3 Grid-Connected Generation Capacity , ,660.5 Solar Generation Capacity , , ,337.8
53 Solar Capital Investment The amount of solar capital investment is calculated based on the required solar capacity for each of the solar reference units times the investment per MW to construct or install each solar unit. These capital costs are stated in real 2010 dollars. The solar capital investment is used in the IMPLAN model to determine the economic impact of solar power plant construction on employment, wages and value added. The amount of capital investment in solar generation is shown in Table 19. Starting in 2010, the annual amount of annual capital investment will rise dramatically from $84 million in 2010 to a peak of $2.5 billion in By 2030 the annual rate of capital investment drops to about $1.1 billion. In total, the construction of solar power plants to meet the ACC RPS requirements will cost around $22 billion in cumulative capital expenditures by 2030.
54 Table 19 - Arizona Solar Power Capital Investment Solar Power Annual Capital Investment ($ Million) Distributed Annual Investments , Grid-Connected Annual Investments , Solar Annual Investments ,411 2,528 1,076 Solar Power Cumulative Capital Investment ($ Million) Distributed Cumulative Investments ,126 7,711 9,854 Grid-Connected Cumulative Investments ,478 9,185 12,050 Solar Cumulative Investments 84 1,363 6,604 16,896 21,904
55 Solar Construction Economic Impact The construction and installation of solar generation units and facilities will have significant economic impact on employment, wages, and value added in the State of Arizona. These economic tables are stated in constant 2010 dollars It is important to note that the economic impact numbers in the table represent the maximum level of expected impact, since the numbers were not adjusted for leakages of spending to regions outside Arizona which would dampen the economic multiplier.. Solar Construction Employment (Direct and Total) The large and prolonged amount of construction activity required to build solar Arizona s solar power capacity will have a profound impact on construction employment. Table 20 shows the amount of construction labor that results from capital spending for solar generation construction. The annual amount of direct labor used on solar construction and installation projects will increase from 565 jobs in 2010 to a peak of 16,530 jobs in The total amount of jobs created (including direct, indirect and induced jobs) increases from 1,068 in 2010 to a maximum of 32,082 in The cumulative impact of direct construction employment amounts to 142,368 man-years of employment by The cumulative total construction employment amounts to 277,759 manyears by Since these construction jobs only last a year and are not permanent, the cumulative employment represents man-hours of effort over the twenty year period, not total construction jobs at the end of the period. Solar Construction Wages The amount of wages generated by solar power construction and installation will be significant (see Table 21). The total annual wages (direct, indirect and induced) will rise from $51 million in 2010 to a peak of $1,560 million in The cumulative amount of wages from 2010 to 2030 amounts to $13.5 billion. Solar Construction Value Added The value added created by solar power construction and installation will also be significant (see Table 22). The total annual value added (direct, indirect and induced) increases from $74 million in 2010 to a peak of $2,240 million in The cumulative amount of wages from 2010 to 2030 amounts to $19.4 billion.
56 Table 20 - Arizona Solar Power Construction Employment Construction Annual Direct Employment Distributed Direct Employment , , ,255.9 Grid-Connected Direct Employment , , , ,800.9 Solar Direct Employment Total , , , ,056.8 Construction Annual Total Employment (Includes Direct, Indirect and Induced Employment) Distributed Total Employment 367 2,392 7,877 13,408 5,570 Grid-Connected Total Employment 702 2,712 10,004 18,674 8,101 Total Employment 1,068 5,105 17,881 32,082 13,671
57 Table 20 - Arizona Solar Power Construction Employment (cont.) Cumulative Direct Construction Employment (man-years) Distributed Cumulative Direct Employment , , , ,450.4 Grid-Connected Cumulative Direct Employment , , , ,917.8 Solar Cumulative Direct Employment , , , ,368.2 Cumulative Total Construction Employment (Includes Direct, Indirect and Induced Employment) Distributed Cumulative Total Employment 367 8,078 37,952 93, ,634 Grid-Connected Solar Cumulative Employment 702 9,150 45, , ,125 Solar Cumulative Total Employment 1,068 17,228 83, , ,759
58 Table 21 - Arizona Solar Power Construction Wages Solar Power Total Construction Wages ($ Million) (Includes Direct, Indirect and Induced Wages) Distributed Annual Construction Wages Grid-Connected Annual Construction Wages Annual Solar Construction Wages , Solar Power Cumulative Total Construction Wages ($ Million) (Includes Direct, Indirect and Induced Wages) Distributed Cumulative Construction Wages , , ,265.4 Grid-Connected Cumulative Construction Wages , , ,235.7 Solar Cumulative Construction Wages , , ,501.0
59 Table 22 - Arizona Solar Power Construction Value Added Solar Power Construction Total Value Added ($ Million) (Includes Direct, Indirect and Induced Value Added) Distributed Total Value Added Grid-Connected Total Value Added , Solar Total Value Added , , Solar Power Cumulative Value Added ($ Million) (Includes Direct, Indirect and Induced Value Added) Distributed Cumulative Total Value Added , , ,892.4 Grid-Connected Cum. Total Value Added , , ,525.1 Solar Cumulative Total Value Added , , , ,417.5
60 Solar Operations &Maintenance Economic Impact The expenditures on the operation and maintenance of the solar power generation units drives the amount of permanent employment, wages and value added from ongoing solar generation activities. Solar O&M Employment (Direct & Total) The amount of permanent jobs created from solar power O&M activities is insignificant compared to those created in the construction process. The O&M direct jobs added each year, rises from 2.5 in 2010 to a peak of 50in Total employment (direct, indirect and induced) added each year increases from 3 in 2010 to a peak of 87 in Cumulative employment will result in a total of 809 direct permanent jobs by The number of cumulative total permanent jobs will be 1,198 in Solar O&M Wages The total (direct, indirect, and induced) incremental annual wages generated by ongoing solar O&M activity increases from $200,000 in 2010 to a peak of $8 million in 225. The cumulative wages from 2010 to 2030 amount to $65 million. Solar O&M Value Added The total (direct, indirect, and induced) incremental value added generated by ongoing solar O&M activity increases from $400,000 in 2010 to a peak of $6.6 million in 225. The cumulative wages from 2010 to 2030 amount to $128 million.
61 Table 23 - Arizona Solar Power Direct O&M Employment Solar Power Incremental Direct O&M Employment Distributed Incremental Direct Employment Grid-Connected Incremental Direct Employment Solar Incremental Direct Employment Total Solar Power Total O&M Employment (Includes Direct, Indirect and Induced Employment) Distributed Incremental Total Employment Grid-Connected Incremental Total Employment Solar Incremental Total Employment
62 Table 23 - Arizona Solar Power Direct O&M Employment (Cont.) Solar Power Cumulative Direct O&M Employment Distributed Cumulative Direct Employment Grid-Connected Cumulative Direct Employment Solar Cumulative Direct Employment Solar Power Cumulative Total O&M Employment (Includes Direct, Indirect and Induced Employment) Distributed Cumulative Total Employment Grid-Connected Cumulative Total Employment Solar Cumulative Total Employment ,198
63 Table 24 - Arizona Solar Power O&M Wages Solar Power Incremental Annual O&M Wage ($ Million) (Includes Direct, Indirect and Induced Wages) Distributed Incremental O&M Wages Grid-Connected Incremental O&M Wages Solar Incremental O&M Wages Solar Power O&M Wage ($ Million) (Includes Direct, Indirect and Induced Wages) Distributed Solar O&M Wages Grid-Connected Solar O&M Wages Solar O&M Wages
64 Table 25 - Arizona Solar Power Total O&M Value Added Solar Power Incremental O&M Total Value Added ($ Million) (Includes Direct, Indirect and Induced Wages) Distributed Incremental Value Added Grid-Connected Incremental O&M Value Added Solar Incremental O&M Value Added Solar Power O&M Total Value Added ($ Million) (Includes Direct, Indirect and Induced Wages) Distributed Total Value Added Cumulative Grid-Connected Solar O&M Value Added Cumulative Solar O&M Value Added
65 Impact of Large Scale Solar Energy Development on Sustainable Development in Arizona Increased solar production in Arizona will have a positive environmental impact. It will lower the level greenhouse gas emissions. This will result in improved air quality and help to mitigate the potential for climate change. It will have minimal impact on water use and many of the preferred sites occur in areas of the state that have sufficient water supplies. Although it requires a large amount of land use, but there is enough land available to easily accommodate solar power land needs. Development of Arizona s solar energy resources will have a positive social impact, as well. It will reduce impact of disruptions to the supply of conventional energy sources and reduce the impact of significant increases in the cost of conventional fuels In conclusion, development of solar energy resources will support the growth of the Arizona population and economy on a more sustainable basis.
66 Water Demand for Solar Energy Generation Some concerns have been raised about the quantity of water to supply future demands for solar energy generation (e.g. Gelt). This concern stems from the amount of water used by parabolic trough and solar towers to generate a MWh e, compared to other power generating technologies (Table 26). Photovoltaic systems use semiconducter materials in solar panels to convert sunlight to energy. These systems require minimal amounts of water to periodically wash panels. Solar troughs and towers, on the other hand concentrate heat to generate steam for energy generation. Table 26. Comparison of Water Consumption Intensity of Different Power Generation Technologies Water Consumption Plant Type / Process Intensity (gal / MWh e ) Coal Power Generation Open Loop Cooling Closed Loop Cooling Integrated Gasification Combined Cycle (IGCC) 200 Coal Supply Mining 5-74 Slurry Nuclear Power Generation Open Loop Cooling 400 Closed Loop Cooling, Tower Closed Loop, Pond 720 Nuclear Mining / Processing Natural Gas Power Generation Open Loop Cooling, Tower 100 Closed Loop Cooling Tower 180 Natural Gas Supply 11 Hydroelectric (evaporation) 4500 Solar Power Generation Trough Tower 750
67 These latter, concentrated solar power systems consume more water per MWh e, generated than some other technologies (Table 27).For example, natural gas generation consumes gallons of water per MWh e, compared to concentrated systems, which consume MWh e. We distinguish here between water consumption the part of water that is evaporated otherwise removed from the immediate water environment and water withdrawals. Power generation systems may withdraw large amounts of water, yet return much of it to the environment for further supply or use. Consumption, thus measures how much water is used up in power generation. While solar trough and tower systems use water more intensively to generate a MWh e, compared to other technologies, does this pose a significant constraint on deployment of solar energy in Arizona? No. First, consider that much of the projected growth in solar energy is expected to come from PV distributed systems, utility PV systems and solar dish technologies, which require negligible amounts of water. Our forecasts predict that solar trough and tower systems will account for about one-third of annual solar energy generation. So, the water consumption intensity estimates for solar energy on the whole would be about one-third of those listed in Table 26. More importantly, the projected water requirements for annual generation of electricity via trough and tower systems are small in absolute terms. First, consider projected annual energy generation from solar troughs and towers (Table 26). Based on estimates reported in Table 1, we assume that tower systems use 750 gallons of water / MWh e. Estimates of water consumption intensity for trough systems range from a low of 760 gallons MWh e to a high of 760 gallons MWh e. These are included as upper and lower bound estimates. The middle scenario of 760 gallons MWh e is just the midpoint of the upper and lower bounds. These water consumption intensity estimates are combined with the energy generation projections to create projections of total annual water consumption for solar energy generation in millions of gallons for tower systems and the three scenarios for trough systems (Table 27). Next, millions of gallons are converted to acre-feet. An acre-foot of water is the amount of water needed to cover one acre of land one foot deep in water. Acre feet are a common unit of measure for large-scale water use such as total state use or irrigation use. Finally, the last rows project total water consumption for solar energy generation in Arizona under different assumptions about trough water consumption intensity. These projections suggest that solar energy production in Arizona will, by 2030, consume somewhere between 7,300 and 8,500 acre feet of water annually.
68 Table 27. Projected Water Demand for Arizona Solar Energy Production SolarPower Annual Electricity Generation (MWh) Trough 12, , ,171 1,976,463 2,338,309 Tower 3,233 44, , , ,706 Water Consumption Intensity (gal / MWhe) Trough (low) Trough (middle) Trough (high) Tower Water Consumption, Million Gallons Trough (low) ,502 1,777 Trough Mg (middle) ,660 1,964 Trough Mg (high) ,818 2,151 Tower Mg Water Consumption, Acre Feet Trough (low) ,864 4,610 5,454 Trough (middle) ,060 5,095 6,028 Trough (high) ,256 5,580 6,602 Tower ,423 1,845 Total Water Consumption (trough + tower), Acre Feet Total (low) ,394 6,033 7,299 Total (middle) ,590 6,519 7,873 Total (high) ,787 7,004 8,447 Does this quantity of water demand constitute a significant burden to the state s water resources. No. This water demand is quite small compared to overall water use in the state. Consider the following numbers from the USDA s 2003 Farm and Ranch Irrigation Survey (the most survey): 3,751,834 Acre feet of water applied for irrigation in Arizona 2,777 Total number of irrigated farms 1,351 Average acre feet of water applied per farm To place projected solar energy water requirements in context, Table 28 reports projected solar requirements as a percentage of 2003 state irrigation applications. Table 3 also reports solar water requirements in terms of average farm equivalents. In other words, it reports how many
69 farms (applying the 1,351 AF average amount) that solar requirements equal. Table 3 shows that compared to irrigation use, solar demand is mere rounding error, equally less than one-quarter of one percent of agricultural applications, even by It is only after 2015 that statewide solar water demand exceeds that of one average water-using farm. By 2030, solar demand is projected to be equivalent to about 6 average water-using farms. Table 28. Projected Water Demand for Solar Energy Generation in Relation to Irrigation Use Total Water Consumption (trough + tower), Acre Feet Total (low) ,394 6,033 7,299 Total (middle) ,590 6,519 7,873 Total (high) ,787 7,004 8,447 Total Water Consumption (trough + tower) as a % of 2003 Arizona irrigation applications Total (low) 0.00% 0.01% 0.06% 0.16% 0.19% Total (middle) 0.00% 0.01% 0.07% 0.17% 0.21% Total (high) 0.00% 0.02% 0.07% 0.19% 0.23% Total Water Consumption (trough + tower) equivalent to number of average arizona irrigated farms Total (low) Total (middle) Total (high)
70 Table 29 Water Consumption by Solar Technology SolarPower Annual Electricity Generation (MWh) Trough 12, , ,171 1,976,463 2,338,309 Tower 3,233 44, , , ,706 Water Consumption Intensity (gal / MWhe) Trough (low) Trough (middle) Trough (high) Tower Water Consumption, Million Gallons Trough (low) ,502 1,777 Trough Mg (middle) ,660 1,964 Trough Mg (high) ,818 2,151 Tower Mg Water Consumption, Acre Feet Trough (low) ,864 4,610 5,454 Trough (middle) ,060 5,095 6,028 Trough (high) ,256 5,580 6,602 Tower ,423 1,845 Total Water Consumption (trough + tower), Acre Feet Total (low) ,394 6,033 7,299 Total (middle) ,590 6,519 7,873 Total (high) ,787 7,004 8,447 While solar energy-demand for water will remain a miniscule part of state water use, it could in principle place more burdens on local water resources. This would be especially true in areas relying solely on groundwater or in highly urbanized areas without a buffer of agricultural water use. Along with access to transmission grids, access to renewable sources of surface water may be important to prevent pressure on local water resources.
71 Solar Land Use The land use for large grid connected solar power units is large relative to that for other generating technologies due to the fact that a large area of land is needed to collect sufficient solar radiation to power the plants. In general large solar thermal and photovoltaic plants use about 5 acres of land per MW of peak capacity. Concentrating solar photovoltaic units use focused sunlight and thus use less land per unit of capacity, only 4 acres per MW. Distributed solar generation is used on site and does not require any additional land. Table 30 shows the amount of land needed to support the solar generating requirement over time. The solar power industry would require 13,137 acres or 20.5 square miles of land to produce the amount of electricity required to support the ACC RES.
72 Table 30 - Arizona Solar Power Land Use Solar Power Incremental Land Use Distributed Incremental Land Use Grid-Connected Incremental Land Use , Solar Incremental Land Use , Solar Power Total Land Use Distributed Total Land Use Grid-Connected Total Land Use , , ,136.7 Solar Total Land Use , , ,136.7
73 Greenhouse Gas Emissions Two recent studies survey estimates of life-cycle greenhouse gas (GHG) emissions different energy sources (Weisser, Evans et al.) (Table 31). Emissions are reported as grams of CO2 per kwh e. These life-cycle estimates include not only direct GHG emissions from energy production, but also cumulative emissions. Cumulative emissions included direct emissions, upstream emissions from fuel exploration, extraction, and transportation, and downstream emissions from waste management, plant decommissioning, and waste disposal (Weisser). If one considers only emissions during energy production (direct emissions), this understates the true contribution of different energy sources. Solar, wind, and nuclear energy generate negligible direct GHG emissions during energy production. There are, however, GHG emissions associated with production of capital equipment and downstream emissions. Note, however, that for solar power the difference between direct and cumulative emissions is less than the difference for fossil fuel sources (coal, oil, natural gas) (Table 1). This implies that accounting for cumulative emissions increases estimates of GHG reductions from a switch from fossil fuel sources to solar energy. Table 31. Life-Cycle Greenhouse Gas Emission Estimates for Selected Energy Power Plants Source Energy Source (Power Plant) Direct Emissions (gco 2 /kwh e ) Cumulative Emissions (gco 2 /kwh e ) DW Coal (current) 800 1, ,250 DW Coal (future / advanced) ESE Coal 1004 DW Oil-fired power plant < ,200 DW Natural gas (current) DW Natural gas (future / advanced) 350 <400 ESE Natural Gas 543 ESE Geothermal 170 DW Biomass DW Photovoltaic DW Photovoltaic (mono-crystalline) ESE Photovoltaic 90 DW Wind 8 30 ESE Wind 25 DW Hydro 1 35 ESE Hydro 41 DW Nuclear (LWR) < DW: Weisser, D. A guide to life-cyle greenhouse gas (GHG) emissions from electric supply technologies, Energy 37 (2007) ESE: Evans, A., V. Stresov, T.J. Evans. Assessment of sustainability indicators for renewable energy technologies, Renewable and Sustainable Energy Reviews (2008).
74 SUMMARY AND CONCLUSIONS The expansion of solar electric production in the State of Arizona will create economic and environmental benefits for the State of Arizona. The potential for expanded solar power production is massive. The solar resource quantity and quality in Arizona is higher than in most other regions in the U.S., makes it less expensive to produce electricity than it is in other states. In addition, the land and water resources needed to support solar electricity production are available in sufficient qualities. Large tracts of contiguous level land are available from the Bureau of Land Management, Arizona State Land Trust and Native American Reservations. Even though solar power is not a relatively large water user, water is available in many of the prime areas for solar power production. The construction of solar power plants will have a significant impact on the state s economy over the next twenty years in terms of employment wages and value added. However, the operation of those generating plants once they are online will have very little economic impact. The expansion of solar power production will have a significant benefit on Arizona sustainability. Increased solar production in Arizona will have a positive environmental impact. It will lower the level greenhouse gas emissions. This will result in improved air quality and help to mitigate the potential for climate change. It will have minimal impact on water use and many of the preferred sites occur in areas of the state that have sufficient water supplies. Although It requires a large amount of land use, but there is enough land available to easily accommodate solar power land needs. Development of Arizona s solar energy resources will have a positive social impact, as well. It will reduce impact of disruptions to the supply of conventional energy sources and reduce the impact of significant increases in the cost of conventional fuels In conclusion, development of solar energy resources will support the growth of the Arizona population and economy on a more sustainable basis.
75 SOURCES Arizona Department of Commerce. Arizona Solar Electric Roadmap Study: Full Report. Prepared by Navigant Consulting, January Arizona Department of Commerce, Energy Office. Solar. Renewable Energy Profiles. (accessed October 28, 2008). Bezdek, Roger. Renewable Energy and Energy Efficiency: Economic Drivers of the 21 st Century. American Solar Society, California Energy Commission. Comparative Costs of California Central Station Electricity Generation Technologies. Draft Staff Report, CEC SD, June Cohen, Ronnie. The Water-Energy Nexus. in Southwest Hydrology, September/October, Black and Veatch. Arizona Renewable Energy Assessment. Prepared for APS, SRP and TEP, Final Report B&V Project Number , September Bradford, Travis. Solar Revolution: The Economics of the Global Energy Industry. Cambridge, MA MIT Presss, Considine, Timothy, and Dawn McLaren. Powering Arizona: Choices and Trade-offs for Electricity Policy: A Study Assessing Arizona s Energy Future. Conducted by ASU W.P. Carey School of Business and the Communications Institute, funded by The Thomas R. Brown Foundations (Federal, state, local and utility renewable energy incentive databases) EPRI. Solar Photovoltaics: Expanding Electric Generation Options. December Greater Phoenix Economic Council (GPEC). Arizona Solar Industry Tax Credit Program (Draft). April Greater Phoenix Economic Council (GPEC). Economic Development Program Recommendations (Draft). May Lazard. Levelized Cost of Energy Analysis Version 2.0. June National Renewable Energy Laboratory (NREL). A Manual for the Economic Evaluatiopn of Energy Efficiency and Renewable Energy Technologies. Honolulu, HI. University Press of the Pacific
76 National Renewable Energy Laboratory (NREL). Economic, Energy, and Environmental Benefits of Concentrating Solar Power in California. NREL /SR , April National Renewable Energy Laboratory (NREL). The Regional Per-Capita Solar Electric Footprint for the United States. Technical Report NREL/TP , December U.S. DOE, Solar Energy Technologies Program. Solar Energy Forecast: Perspectives on U.S. Solar Market Trajectory. May 27, National Renewable Energy Laboratory (NREL), Energy Analysis Office. Renewable Energy Cost Trends.. National Renewable Energy Laboratory (NREL), Energy Analysis Office. Solar Advisor Model. Technical Report NREL/TP/ August Nonhebel, S. Land-use changes induced by increased use of renewable energy sources. in Global Environmental Change and Land Use, Minnesota IMPLAN Group, Inc. IMPLAN Professional: User s Guide, Analysis Guide and Data Guide. MIG, Inc, Pasqualetti, Maritin, et al. The Water Costs of Electricity in Arizona: a White Paper. Arizona Water Institute, Project Fact Sheet, Solar Industries Association (SEIA). U.S. Solar Industry in Review Solar Electric Power Association (SEPA). Utility Solar Business Models: Emerging Utility Strategies & Innovation. SEPA Report # 03-08, May Solar Energy Research and Education Foundation (SEREF). Economic Impacts of Extending Federal Solar Tax Credits. Final Report Prepared by Navigant Consulting, September 15, Southern Arizona Regional Solar Partnership. Greater Tucson Solar Development Plan: A Roadmap for Achieving Sustainable Growth in New Solar Power. Draft Report, October 6, United States Conference of Mayors. U.S. Metro Economies: Current and Potential Green Jobs in the U.S. Economy. Prepared by Global Insight, October U.S. DOE. How much land will PV need to supply our electricity? DOE/GO ,
77 U.S. DOE, Energy Efficiency & Renewable Energy. Arizona PV Price Survey. (accessed October 28, 2008). U.S. DOE, Energy Efficiency & Renewable Energy. Arizona Solar Data as of April 3, (accessed October 28, 2008). U.S. DOE, Energy Efficiency and Renewable Energy. Assessing the Potential for Renewable Energy on Public Lands. February U.S. DOE, Energy Efficiency & Renewable Energy. Electric Power and Renewable Energy in Arizona. (accessed October 28, 2008). U.S. DOE, Energy Efficiency & Renewable Energy. Renewable Energy Data Book. September U.S. DOE, Energy Efficiency & Renewable Energy. Solar Energy Industry Forecast: Perspectives on U.S. Solar Market Trajectory. May 27, U.S. DOE, Energy Efficiency & Renewable Energy. Solar Energy Technologies Program. May 27, U.S. EIA. Annual Energy Outlook U.S. EIA. Solar Thermal and Photovolaic Collector Manufacturing Activities October U.S. EIA. Renewable Energy Consumption and Electricity Preliminary May U.S. EIA. Solar Thermal and Photovoltaic Manufacturing Activities October U.S. EIA. State Energy Data May U.S. EIA. State Electricity Profiles U.S. EIA. State Renewable Electricity Profiles May U.S. EIA. Updated State-Level Greenhouse Gas Emission Factors for Electricity Generation May Western Governors Association. Clean and Diversified Energy Initiative. Solar Task Force Report, January Western Resource Associates. A Clean Electric Strategy for Arizona
78 Appendix 1: Financial assumptions used in SAM model economic analysis of solar technologies Table A1 - Residential and Commercial Financial Assumptions Variable Residential Commercial Analysis Period 30 years 30 years Inflation Rate 2.5% 2.5% Real Discount Rate 5.5% 5.5% Federal Tax Rate 28% 35% State Tax Rate 7% 8% Loan (Debt) % 100% 50% Loan Term 20 year 20 year Loan Rate 6% 6% Electric Rate $ $ Federal ITC 30% no max. 30% no max. State ITC 25%, $1,000 max. 10%, $25,000 max. Utility CBI $3/kW $1.5/kW Table A2 - Utility Financial Assumptions Variable Utility Scale Analysis Period 30 years Inflation Rate 2.5% Real Discount Rate 6% Required IRR 15% Federal Tax Rate 35% State Tax Rate 8% Insurance %.05% Loan (Deb) % 50% Loan Term 20 year Loan Rate 6% Depreciation Method MACRS (Mid-Quarter) Federal ITC 30%, no max. State ITC 10%, $25,000 max. Utility CBI None
79 Appendix 2 - Arizona Potential for Solar Energy Manufacturing Market strategies for renewable energies transform barriers to achieve a permanent shift in the market. Evidence of these market shifts are seen in greater availability and a larger share of renewable technologies. Establishing renewable energies as the norm in the market is the ultimate objective of these strategies and they are achieved through coordinated policy activities (Geller, 2003). Where manufacturing is concerned, market transformation is integrated with technological learning and experience curves and shows that as experience increases, the cost of technological production decreases (IEA 2000e, McDonald and Schrattenholzer 2001). Research, development and demonstration play a critical role in expanding knowledge and establishing a pipeline of new renewable energy technologies. Many companies do not invest fully in research, development and demonstration because of the risk of cost recovery and the focus on short-term profits (Geller 2003, PCAST 1997). While research, development and demonstration can reduce the cost of solar energy technologies, improve performance, and increase the time-to-market for important innovations, other incentives and regulations are necessary for adoption and use. Collaborations between industry and research institutions that support a wide-range of technological developments have the best chance of success for creating an environment where Arizona can lead in innovation. Arizona currently has a number of advantages for solar energy business expansion; low electricity costs, potential to develop a skilled workforce and major research universities engaged in solar energy research. However, to stimulate innovation and growth in Arizona, effective research, development and demonstration and competitive economic incentives need to come into play. Two immediate opportunities exist to develop the research, development and demonstration push and economic incentives pull strategies to attract quality solar energy manufacturing. 1) The creation of a metrology and module testing facility in Arizona can attract Photovoltaic companies to relocate or place research and development facilities in the state. An $80 million investment in the center is estimated to generate over $280 million in revenue by 2016 and over 8,000 new solar energy and other jobs. 1 2) Currently, at least 12 solar-energy companies representing 4,835 jobs and $4.4 billion in investments are looking at Arizona, and other states, as a potential location for new manufacturing. Offering companies making new investments in renewable energy manufacturing and/or headquarter operations in Arizona eligibility for tax credits will significantly improve Arizona s competitiveness. 2 1 Madocks, John, M. George, C. Ngoc. December General Plasma, Inc. Center for Solar Energy Metrology & Analysis (CSEMA), Feasibility Study, December, Huber, Lon, Greater Phoenix Economic Council (GPEC). Arizona s Renewable Energy Industry Opportunity, an analysis of the Quality Jobs through Renewable Industries Program, December, 2008.


80 Research, Development and Demonstration The Center for Solar Energy Metrology & Analysis (CSEMA) idea was developed by General Plasma, Inc. of Tucson, Arizona, a manufacturer of thin-film procession solutions. CSMEA will provide a complete set of state-of-the art metrology, analysis tool and testing services for the solar energy industry and full access to companies located in Arizona. The center will provide easy access to $7 million of equipment in one location, a reduction in new product delivery to market and an estimated $9 million annual savings for manufacturers. To consistently achieve milestones in research and development, access to the center for scientists, and university faculty and students is on-going; this in turn creates a feedback loop for workforce development as people are trained on jobs necessary for industry development. Economic sectors of Arizona in real estate, service, and state government will benefit through job growth from manufacturing expansion catalyzed through the placement of this instrumentation center in the state.
Parabolic Trough Solar Technology for Utility Power Markets in the Southwestern United States
 Parabolic Trough Solar Technology for Utility Power Markets in the Southwestern United States Henry Price National Renewable Energy Laboratory Golden, Colorado Slide 1 Talk Overview US Southwest Power
ABENGOA SOLAR Solar Power for a Sustainable World
 Project Scale: A CSP Developer s Perspective Presented To: GovEnergy 06 August, 2008 Phoenix, AZ Index 1 A little about Abengoa Solar 2 3 A little about CSP CSP is big 4 Optimizing project scale 5 6 Optimizing
L A Z A R D ' S L E V E L I Z E D C O S T O F E N E R G Y A N A L Y S I S V E R S I O N 7. 0
 C O N F I D E N T I A L A U G U S T 2 0 1 3 L A Z A R D ' S L E V E L I Z E D C O S T O F E N E R G Y A N A L Y S I S V E R S I O N 7. 0 Introduction Lazard s Levelized Cost of Energy Analysis ( LCOE )
Los Angeles Department of Water and Power. Green Energy and Good Jobs Initiative Presentation for City Council
 Los Angeles Department of Water and Power Green Energy and Good Jobs Initiative Presentation for City Council November 4, 2008 Introduction This presentation is in response to the Council Motion introduced
Utility Scale Solar Development Scenarios for Arizona Amanda Ormond, Principal, Ormond Group LLC for use by the Sonoran Institute February 2010
 Utility Scale Solar Development Scenarios for Arizona Amanda Ormond, Principal, Ormond Group LLC for use by the Sonoran Institute February 2010 Introduction As national and state energy priorities change,
Increasing Renewable Energy Generation in Kansas
 Increasing Renewable Energy Generation in Kansas The Feasibility and Economic Impacts of Achieving 50% Renewable Energy Generation June 2016 Executive Summary Increasing wind and solar development would
The Promises and Challenges Facing Renewable Electric Power Generation
 NAE Convocation of the Professional Engineering Societies The Promises and Challenges Facing Renewable Electric Power Generation April 20, 2009 Larry Papay America s Energy Future Changing Focus of Energy
Concentrated Solar Thermal Power: A Ray of Hope for Energy Security
 Concentrated Solar Thermal Power: A Ray of Hope for Energy Security Alan Taber Lockheed Martin MS2 May 7, 2009 Alan.taber@lmco.com Agenda Introduction: Solar Thermal Power Market Entry: Enabled by Thermal
SUN DAY CAMPAIGN 6930 Carroll Avenue, Suite #340 Takoma Park, MD , ext.23
 SUN DAY CAMPAIGN 6930 Carroll Avenue, Suite #340 Takoma Park, MD 20912 301-270-6477, ext.23 sun-day-campaign@hotmail.com SUSTAINABLE ENERGY STUDY #27 Black & Veatch Study Identifies 5,000 MW of Renewable
Community Choice and Renewable Energy
 Community Choice and Renewable Energy Gerry Braun Renewable Energy Team Lead California Energy Commission August 23, 2007 Outline Introduction Renewable Energy Options and Costs CCA Opportunities Conclusions
TREASURE COAST REGIONAL PLANNING COUNCIL M E M O R A N D U M. To: Council Members AGENDA ITEM 8
 TREASURE COAST REGIONAL PLANNING COUNCIL M E M O R A N D U M To: Council Members AGENDA ITEM 8 From: Date: Subject: Staff February 20, 2009 Council Meeting Report on Florida Renewable Energy Potential
ABENGOA SOLAR Solar Power for a Sustainable World
 Farming the Sun: the Solana Generating Station Project Presented to: The American Society of Farm Managers and Rural Appraisers 27 February 2009 Tempe, AZ Index 1 A Little About Abengoa Solar 2 3 The Time
ABENGOA SOLAR Solar Power for a Sustainable World
 Status and Role of Concentrating Solar Power in Rural America USDA Outlook Conference February 19, 2010 Arlington, VA Outline The solar resource what, where and how large The technology Concentrating Solar
Solar Grand Plan. Ken Zweibel PrimeStar Solar February 2008
 Solar Grand Plan Ken Zweibel PrimeStar Solar February 2008 1 The Solar Century? A Proper Skepticism, but 120,000 terawatts of power The only big number out there (Lewis and Smalley) Solution to CO 2 build
Electric Power Systems An Overview. Y. Baghzouz Professor of Electrical Engineering University of Nevada, Las Vegas
 Electric Power Systems An Overview Y. Baghzouz Professor of Electrical Engineering University of Nevada, Las Vegas Overview Power Generation Conventional and renewable power generation Power transmission
OVERVIEW OF SOLAR THERMAL TECHNOLOGIES
 Introduction There are three solar thermal power systems currently being developed by U.S. industry: parabolic troughs, power towers, and dish/engine systems. Because these technologies involve a thermal
California Grid Operations: Current Conditions and Future Needs
 California Grid Operations: Current Conditions and Future Needs Jim Detmers Vice President, Operations Global Climate & Energy Project November 1, 2007 STANFORD UNIVERSITY Our objective today is identify
Solar Pathways to Lower Cost
 Solar Pathways to Lower Cost June, 2006 Herb Hayden Pinnacle West Capital Corporation Parent company to Arizona Public Service 1 Carol Spring Mountain Telecom Remote Solar Electric Service Home APS Experience
Electric Power Systems An Overview. Y. Baghzouz Professor of Electrical Engineering University of Nevada, Las Vegas
 Electric Power Systems An Overview Y. Baghzouz Professor of Electrical Engineering University of Nevada, Las Vegas Overview Power Generation Conventional and renewable power generation Power transmission
Section 2: Sources of Energy
 Section 2: Sources of Energy Types of Energy¹ All the things we use every day to meet our needs and wants are provided through the use of natural resources.natural resources are either renewable or nonrenewable.
Renewable Resources. David Jacobs Manager, Resource Planning and Procurement
 Renewable Resources David Jacobs Manager, Resource Planning and Procurement October 22, 2009 Demand (MW) 4,000 Tucson Electric Power Capacity Requirements with 15% Energy Efficiency Target by 2020 and
Facility produces at least as much energy on-site as it uses in a year
 Marc Claas, Research Intern Doug Reindl, Director Industrial Refrigeration Consortium University of Wisconsin-Madison What is Net-Zero? Net-Zero Site Energy Facility produces at least as much energy on-site
PREPARED FOR: ARIZONA PUBLIC SERVICE Updated Solar PV Value Report
 PREPARED FOR: ARIZONA PUBLIC SERVICE 2013 Updated Solar PV Value Report MAY 2013 2013 Updated Solar PV Value Report Arizona Public Service May 10, 2013 This report has been prepared for the use of the
Concentrating Solar Power
 Concentrating Solar Power Mark Mehos, Chuck Kutscher National Renewable Energy Laboratory www.nrel.gov/csp September 19, 2007 CSP Technologies and Market Sectors Dispatchable Generation Parabolic trough
Levelized Cost of New Generation Resources in the Annual Energy Outlook 2012
 July 2012 Levelized Cost of New Generation Resources in the Annual Energy Outlook 2012 This paper presents average levelized costs for generating technologies that are brought on line in 2017 1 as represented
APS Renewable Energy Plans. Brad Albert Spring AG Forum February 26, 2010
 APS Renewable Energy Plans Brad Albert Spring AG Forum February 26, 2010 Preview Current projects Renewable Energy Targets Solar Technologies Conclusion APS Renewable Generation Current Portfolio High
Competition for water use in utility-scale solar power
 Competition for water use in utility-scale solar power Ground Water Protection Council 2011 Annual Form Atlanta, GA September 24-28, 2011 Jordan Macknick Craig Turchi Michael Wagner Mark Lausten jordan.macknick@nrel.gov
Acreage Needed in 2050 for Renewable Generation to Meet California s GHG Emission Reduction Goals California Energy Commission May 9, 2011
 Acreage Needed in 2050 for Renewable Generation to Meet California s GHG Emission Reduction Goals California Energy Commission May 9, 2011 The Energy Commission has developed a calculator to assist the
SCE Solar Programs Overview SOUTHERN CALIFORNIA EDISON
 SCE Solar Programs Overview Southern California Edison Overview An Edison International company, SCE is one of the nation s largest investor-owned electric utilities, with more than 120 years of service.
The surface receives about 47% of the total solar energy that reaches the Earth. Only this amount is usable.
 Solar Energy: The Ultimate Renewable Resource Bhavik Shah What is Solar Energy? Originates with the thermonuclear fusion reactions occurring in the sun. Represents the entire electromagnetic radiation
An Exploration of the Present and Future State of Concentrated Solar Power in the U.S. Southwest. Reber, Joseph E. 12/11/2012
 An Exploration of the Present and Future State of Concentrated Solar Power in the U.S. Southwest Reber, Joseph E. 12/11/2012 Table of Contents Abstract...1 Introduction...1 CSP Technology...2 Parabolic
Leading Insights into Solar
 Leading Insights into Solar Fong Wan Senior Vice President, Energy Procurement Pacific Gas and Electric Company CalSEIA - SolarTech Summit May 7, 2009 Agenda California s Clean Energy History Renewable
Outline. Introduction to Wisconsin. Barriers to Generating Electricity from. Incentives and Regulations Intended to
 Experience of the United States in the Application of Incentives and Regulations for the Supply of Renewable Energy Chairperson Eric J. Callisto Public Service Commission of Wisconsin 20 May 2010 Outline
DC Surface (non-submersible) pumps are most economical. Reduce pumping energy by half
 pumps are most economical. Reduce pumping energy by half") Solar Electric Energy for Irrigation February 19, 2008 Erik Bakke You know Solar is good for the Earth Increase Profits - Reduce operating costs Decrease Risks - Hedge against rising prices Increase Cash
Solar Electric Energy for Irrigation February 19, 2008 Erik Bakke You know Solar is good for the Earth Increase Profits - Reduce operating costs Decrease Risks - Hedge against rising prices Increase Cash
Client Name/Presentation Title
 Client Name/Presentation Title MARCH 2 Introduction This presentation will address the following topics: Comparative levelized cost of energy for various technologies on a $/MWh basis, including sensitivities,
A Sustainable Energy Future: Research and Technology Needs
 A Sustainable Energy Future: Research and Technology Needs National Academy of Sciences Japan-U.S. Workshop on Sustainable Energy Futures June 26, 2012 Bobi Garrett Deputy Laboratory Director NREL is a
Solar and Wind Energy
 Jerry Hudgins Solar and Wind Energy Department of Electrical Engineering 1 Average Irradiation Data (Annual) from Solarex. The units on the map are in kwh/m 2 /day and represent the minimum case values
The Future of CSP: Dispatchable Solar Power
 The Future of CSP: Dispatchable Solar Power Hank Price, P.E. Managing Director Solar Dynamics LLC Slide 1 1/23/2018. U.S. Direct Normal Resource Map & Transmission Interconnections Slide 2 1/23/2018. Decarbonizing
ABENGOA SOLAR Solar Power for a Sustainable World
 SOLAR Why Does It Take So Long to Build a Concentrating Solar Power (CSP) Plant? Dr. Fred Morse Senior Advisor, US Operations Abengoa Solar Why CSP and why now? Necessity the utilities other options (coal,
Risks And Opportunities For PacifiCorp State Level Findings:
 Risks And Opportunities For PacifiCorp State Level Findings: Oregon Author: Ezra D. Hausman, Ph.D. A Risks and Opportunities for PacifiCorp, State Level Findings: Oregon Power Generation at Bonneville
Grid-Connected Renewable Energy
 Grid-Connected Renewable Energy Pam Baldinger Energy Team Office of Infrastructure and Engineering U.S. Agency for International Development Infrastructure Training Course December 2009 1a Why Should We
Renewable Energy in an All-Of-The-Above World
 Renewable Energy in an All-Of-The-Above World RENEW Wisconsin Policy Summit January 10, 2014 Dr. Dan E. Arvizu Laboratory Director NREL is a national laboratory of the U.S. Department of Energy, Office
Solana. A 3 square mile site with 3,200 collectors. More than 2,000 people involved in the construction.
 Solana Solana will prevent 475,000 tco 2 emissions per year. A 3 square mile site with 3,200 collectors. More than 2,000 people involved in the construction. Six hours of thermal storage allows electricity
Solar - Program 187. Program Overview
 Program Program Overview The U.S. Department of Energy estimates that solar power will represent approximately 1% of worldwide electric generation capacity in less than five years, and trends suggest that
Radiant energy from the sun has powered life on Earth for many millions of years.
 Solar Where Solar is Found >> Solar Photovoltaic >> Solar Thermal Power Plants >) Solar Thermal Collectors )~ Solar Energy & the Environment Solar Basics Energy from the Sun The sun has produced energy
The Solar Revolution Its Scale, the Benefit and Challenges
 The Future of Energy: Latin America s Path to Sustainability Santiago, Chile The Solar Revolution Its Scale, the Benefit and Challenges Dr. Francis O Sullivan August 18 th, 2015 1 The scale and distribution
The Role of Solar in the Long- Term Outlook of Electric Power Generation in the U.S.
 The Role of Solar in the Long- Term Outlook of Electric Power Generation in the U.S. Robert Margolis (NREL) and Frances Wood (OnLocation) Presentation at 24 th USAEE/IAEE North American Conference Washington,
The Optimal Approach to Firming Windpower
 5735 Hollister Avenue, Suite B Goleta, California 93117 T 805.683.9659 F 805.683.9671 www.gravitypower.net The Optimal Approach to Firming Windpower Summary As many regions of the world are staging massive
Electric Power Systems An Overview
 Electric Power Systems An Overview Y. Baghzouz Professor of Electrical Engineering University of Nevada, Las Vegas Overview Power Generation Conventional and renewable power generation Power transmission
Beyond LCOE: The Value of CSP with Thermal Energy Storage
 CSP Beyond LCOE: The Value of CSP with Thermal Energy Storage energy.gov/sunshot Mark S. Mehos, Program Manager, CSP NREL Discussion SunShot and LCOE Understanding the Value of CSP with Thermal Energy
Observations on US Renewable Energy Trends
 Observations on US Renewable Energy Trends Ryan Pletka 32 nd IAEE Conference June 22 2009 Copyright 2009 Black & Veatch Holding Company Agenda Where are we at? Where are we going? Challenges to getting
Distributed Generation
 Distributed Generation November 2014 November 6, 2014 1 Forward-Looking Statements Leading the Way in Electricity SM Statements contained in this presentation about future performance, including, without
Breaking the Climate Deadlock the future of clean power generation. Vinod Khosla Khosla Ventures Nov 2008
 Breaking the Climate Deadlock the future of clean power generation Vinod Khosla Khosla Ventures Nov 2008 1 Where Does Electricity Come From? China and India together account for 79 percent of the projected
The Southwest Intertie Project: Assessment of Potential Benefits
 The Southwest Intertie Project: Assessment of Potential Benefits November 2008 THE SOUTHWEST INTERTIE PROJECT ASSESSMENT OF POTENTIAL BENEFITS TABLE OF CONTENTS 1 Executive Summary... 2 2 Introduction...
Renewable Energy: Strengthening Our Nation s Economy
 Renewable Energy: Strengthening Our Nation s Economy Alternative Energy Technology Innovations: The Coming Economic Boom May 12-13, 2005 Savannah, Georgia Dr. Dan E. Arvizu Director, National Renewable
Will Solar-Generated Electricity Fulfill Its Promise?
 Will Solar-Generated Electricity Fulfill Its Promise? Mort Cohen, MBA RevGen Group Mort.Cohen@RevGenGroup.com Technology Overview Solar Market Crystalline Silicon Thin Film Concentrating PV and Concentrating
Innovative Technology Solutions for Sustainability ABENGOA. CSP: A Time for Solid Players. Analyst & Investor Day. Santiago Seage
 Innovative Technology Solutions for Sustainability ABENGOA CSP: A Time for Solid Players Santiago Seage Analyst & Investor Day May 2012 Forward-looking statements This presentation contains forward-looking
Global and National JULY 8, 2010
 Global and National Solar Market Outlook JULY 8, 2010 Solar Energy Uses & Solar Technologies Solar Energy Uses Thermal energy Passive Solar Heat water for use in homes, buildings, or swimming i pools Heat
Renewable Energy Sources
 Renewable Energy Sources Municipality of Grey Highlands Submitted by The Jones Consulting Group Ltd. Submitted to Wind Power Committee 24 th November 2004 Table of Contents 1.0 INTRODUCTION:...1 2.0 ENERGY
A Bad Bet: Owning the Four Corners Coal Plant is a Risky Gamble for the Navajo Nation and the Plant s Other Owners
 A Bad Bet: Owning the Four Corners Coal Plant is a Risky Gamble for the Navajo Nation and the Plant s Other Owners December 2018 David Schlissel, Director of Resource Planning Analysis Executive Summary
Solar Energy II. Solar Electricity. Original slides provided by Dr. Daniel Holland
 Solar Energy II Solar Electricity Original slides provided by Dr. Daniel Holland Would you be willing to pay more for electricity generated with solar power? Yes 2.No 1. Audio Link 50% 1 50% 2 How much
CRESCENT DUNES PROJECT OVERVIEW
 CRESCENT DUNES PROJECT OVERVIEW Andrew Wang Director of Development April 24, 2014 EXHIBIT I - LANDS Document consists of 14 pages. Entire exhibit provided. Meeting Date: 04-24-14 SOLARRESERVE OVERVIEW
CRESCENT DUNES PROJECT OVERVIEW
 CRESCENT DUNES PROJECT OVERVIEW Andrew Wang Director of Development April 24, 2014 SOLARRESERVE OVERVIEW Leading global developer of large-scale solar power projects and advanced solar thermal technology
Renewable Energy Feasibility Study for Ione Band of Miwok Indians
 Renewable Energy Feasibility Study for Ione Band of Miwok Indians By: Community Assessment of Renewable Energy and Sustainability & The Renewable and Appropriate Energy Laboratory Contents i. About CARES
SRP RESOURCES AND STEWARDSHIP FOR A SUSTAINABLE FUTURE FISCAL YEAR 2010
 SRP RESOURCES AND STEWARDSHIP FOR A SUSTAINABLE FUTURE FISCAL YEAR 2010 WHO WE ARE Serving central Arizona since 1903, SRP (Salt River Project) was created through provisions of the National Reclamation
Low Cost Solar. New Ultra Lite Technology Testing optics in SHEC Energy s LASER lab
 SHEC ENERGY CORPORATION! MAY 2012 Low Cost Solar New Ultra Lite Technology Testing optics in SHEC Energy s LASER lab Breakthrough Technology Imagine producing solar power for similar or less cost than
Siemens Solar Energy. Buenos Aires, November 2011 By Rolf Schumacher R2 Siemens AG All rights reserved
 Siemens Solar Energy Buenos Aires, November 2011 By Rolf Schumacher 2010-03-04-R2 Siemens has the answers to your burning questions 1 Why Solar / Renewable Energy? 2 What are the different technologies?
Wild Horse Solar Photovoltaic Project
 Wild Horse Solar Photovoltaic Project Steven J. St.Clair Manager Renewable Assets Phone: 425-462-3057 Email: steven.stclair@pse.com November 19, 2009 Agenda Introduction PSE Renewable Energy Facilities
100% Fossil Free Electricity. June 27, 2018
 100% Fossil Free Electricity June 27, 2018 Current Washington Emissions Levels 100 90 +7% 80 70 60 50-82% 40 30 20 10 0 1990 2013 2050 (goal) 2016 2017 2018 2019 2020 2021 2022 2023 2024 2025 2026 2027
Grand Opening KaXu Solar One
 Grand Opening KaXu Solar One Abengoa Abengoa (MCE: ABG.B/P SM /NASDAQ: ABGB) applies innovative technology solutions for sustainability in the energy and environment sectors, generating electricity from
Session 6. Solar Power Plant
 Session 6 Solar Power Plant What is Solar Energy? Originates with the thermonuclear fusion reactions occurring in the sun. Represents the entire electromagnetic radiation (visible light, infrared, ultraviolet,
Revised Overview of PV Inputs, Data Sources, and Potential Study Results
 Date: September 28, 2012 To: From: Re: PacifiCorp Revised Overview of PV Inputs, Data Sources, and Potential Study Results Introduction, under contract to PacifiCorp, has calculated the predicted technical
APS Renewable Energy. Overall Commitment and Distributive Energy Program. Arvin Trujillo 4CPP-Government Relations
 APS Renewable Energy Overall Commitment and Distributive Energy Program DOE Tribal Energy Summit December 20, 2011 Arvin Trujillo 4CPP-Government Relations About Arizona Public Service Co. APS APS has
CONCENTRATING SOLAR POWER, THE PANACEA TO NIGERIA S POWER SUPPLY
 CONCENTRATING SOLAR POWER, THE PANACEA TO NIGERIA S POWER SUPPLY Idongesit Archibong, MIEEE MNSE Vice Chair, GOLD Institute of Electrical Electronics Engineers. Nigeria Concentrating Solar Power Concentrating
Dispatchable Solar: The Impact of PV + Storage on the Grid
 Dispatchable Solar: The Impact of PV + Storage on the Grid FMEA ENERGY CONNECTIONS CONFERENCE & TRADE SHOW October 24-25, 2018 8minutenergy Renewables: In just eight minutes, energy from the Sun reaches
Solar Energy-An overview
 Solar Energy-An overview Solar is a GIANT source compared to what world uses Potential 69k Terawatts Use=16 TW Solar energy atlas of the world Solar Heat: Archimedes burning Roman Fleet in Syracuse harbor:
SOLAR ENERGY INTRODUCTION:
 INTRODUCTION: SOLAR ENERGY Solar energy is energy that comes from the sun. Every day the sun radiates an enormous amount of energy. The sun radiates more energy in one second than people have used since
LAZARD'S LEVELIZED COST OF ENERGY ANALYSIS VERSION 10.0 DECEMBER 2016
 LAZARD'S LEVELIZED COST OF ENERGY ANALYSIS VERSION 10.0 DECEMBER 2016 Introduction Lazard s Levelized Cost of Energy Analysis ( LCOE ) addresses the following topics: Comparative levelized cost of energy
FOUR TOUGH QUESTIONS ABOUT RENEWABLE ENERGY AND THE ANSWERS THE NEXT GOVERNOR OF NEW YORK SHOULD KNOW
 ISSUE BRIEF : SEPTEMBER 2018 FOUR TOUGH QUESTIONS ABOUT RENEWABLE ENERGY AND THE ANSWERS THE NEXT GOVERNOR OF NEW YORK SHOULD KNOW EXECUTIVE SUMMARY Over the past eight years, Business Forward has organized
Solar Power Realities
 Solar Power Realities Supply-Demand Characteristics, Storage and Capital Costs by Peter Lang Abstract This paper provides a simple analysis of the capital cost of solar power and energy storage sufficient
Our Solar Energy Business
 Our Solar Energy Business Our Business Operations Based in Juno Beach, Florida, NextEra Energy Resources, LLC, is the competitive energy subsidiary of NextEra Energy, Inc., a Fortune 200 company and a
Karl Gawell, Executive Director, Geothermal Energy Association
 Karl Gawell, Executive Director, Geothermal Energy Association www.geo-energy.org 202-454-5261 States generating geothermal energy and existing capacity (2006) Total installed capacity: 2830.65 Megawatts
Renewable energy (RE) is any energy source that naturally replenishes and cannot be exhausted. Renewable energies include:
 is any energy source that naturally replenishes and cannot be exhausted. Renewable energies include:") What is Renewable Energy? With greenhouse gas (ghg) emissions as the the primary contributor to human-caused climate change, one countermeasure that can be taken to limit our impact on the climate is by
What is Renewable Energy? With greenhouse gas (ghg) emissions as the the primary contributor to human-caused climate change, one countermeasure that can be taken to limit our impact on the climate is by
ABENGOA SOLAR Solar Power for a Sustainable World
 Concentrating Solar Power (CSP) as Concentrating Solar Power (CSP) as an option to replace coal an option to replace coal Dr. Fred Morse Dr. Fred Morse Senior Advisor, US Operations, Abengoa Senior Advisor,
LCOEs and Renewables Victor Niemeyer Program Manager, Energy and Environmental Policy Analysis and Company Strategy Program
 LCOEs and Renewables Victor Niemeyer Program Manager, Energy and Environmental Policy Analysis and Company Strategy Program EIA LCOE/LACE Workshop July 25, 2013 EPRI Generation Options Report Provides
ELG4126 Solar Energy The Ultimate Renewable Resource. Based Partially on Renewable and Efficient Electric Power System, Gilbert M.
 ELG4126 Solar Energy The Ultimate Renewable Resource Based Partially on Renewable and Efficient Electric Power System, Gilbert M. Masters, Wiely What is Solar Energy? 1.4 million kilometer diameter, thermonuclear
The Impacts of the Green Communities Act on the Massachusetts Economy:
 The Impacts of the Green Communities Act on the Massachusetts Economy: A Review of the First Six Years of the Act s Implementation Paul J. Hibbard Susan F. Tierney Pavel G. Darling Analysis Group, Inc.
Renewable Energy Plan 2011 Biennial Review Lansing Board of Water & Light MSCP Case No. U-16619
 Renewable Energy Plan 2011 Biennial Review Lansing Board of Water & Light MSCP Case No. U-16619 This Biennial Review filing by the Lansing Board of Water & Light (LBWL) complies with Public Act 295 of
Towards a sustainable Romanian energy sector: Roadmap to RES in 2030 Deloitte Romania, June 2018
 Towards a sustainable Romanian energy sector: Roadmap to RES in 2030 Deloitte Romania, June 2018 Content Background 03 1. Development scenarios 04 2. Impact & benefits 09 Key messages 12 2 Background Romania
ECE 333 GREEN ELECTRIC ENERGY 15. PV ECONOMICS
 ECE 333 GREEN ELECTRIC ENERGY 15. PV ECONOMICS George Gross Department of Electrical and Computer Engineering University of Illinois at Urbana-Champaign ECE 333 2002 2017 George Gross, University of Illinois
Please see response to Question 9 for information related to final TVA resource estimates.
 SACE Questions 1. A document or documents showing TVA s assumed capital costs in the base case strategy for all storage, solar, and wind resource options for each year of the forecast (2019-2038). Although
Impact of Regional Greenhouse Gas Initiative and Renewable Portfolio Standards on Power System Planning
 Impact of Regional Greenhouse Gas Initiative and Renewable Portfolio Standards on Power System Planning Panel on Impacts of GHG Programs and Markets on the Power Industry PESGM2006 Montreal June 21, 2006
UTILITY-SCALE RENEWABLES: TECHNOLOGY & POLICY
 UTILITY-SCALE RENEWABLES: TECHNOLOGY & POLICY Sarah Cottrell Propst Executive Director Interwest Energy Alliance September 25, 2014 Women in Government Advanced Technology & Innovation Summit About Interwest
Value Proposition of Solar Photovoltaics and Fuel Cells in California
 Value Proposition of Solar Photovoltaics and Fuel Cells in California National Congress of American Indians 65 th Annual Convention Phoenix, Arizona October 21, 2008 Lori Smith Schell, Ph.D. www.empoweredenergy.com
Energy. on this world and elsewhere. Instructor: Gordon D. Cates Office: Physics 106a, Phone: (434)
") Energy on this world and elsewhere Instructor: Gordon D. Cates Office: Physics 106a, Phone: (434) 924-4792 email: cates@virginia.edu Course web site available at www.phys.virginia.edu, click on classes
Energy on this world and elsewhere Instructor: Gordon D. Cates Office: Physics 106a, Phone: (434) 924-4792 email: cates@virginia.edu Course web site available at www.phys.virginia.edu, click on classes
Georgia Power's Solar Overview. Ervan Hancock III Renewable Development and Green Strategy Manager Georgia Power Company
 Georgia Power's Solar Overview Ervan Hancock III Renewable Development and Green Strategy Manager Georgia Power Company GPC is largest of four Southern Company electric utilities $7.2 billion in revenue
Value of DOE Early Stage Research to the Solar Energy Industry
 Value of DOE Early Stage Research to the Solar Energy Industry Written by: Britta Dosch and Stacey Davis October 2017 The electric grid is fundamental to the US economy and our economic competitiveness.
PACIFICORP: PRIVATE GENERATION RESOURCE ASSESSMENT FOR LONG TERM PLANNING
 PACIFICORP: PRIVATE GENERATION RESOURCE ASSESSMENT FOR LONG TERM PLANNING AUGUST 30, 2018 1 DISCLAIMER Notice Regarding Presentation This presentation was prepared by Navigant Consulting, Inc. (Navigant)
FUNDAMENTALS OF SOLAR ENERGY
 Introduction FUNDAMENTALS OF SOLAR ENERGY Energy from the sun is available at every place on the earth. People do not realize that daily life would not be possible without the presence of the sun. In ancient
The economic benefits of wind energy in the Southwest Power Pool
 The economic benefits of wind energy in the Southwest Power Pool November 2014 Introduction Wind energy provides the Southwest Power Pool region (Kansas, Oklahoma, Nebraska, and parts of New Mexico, Texas,