Interpretation of Chemistry Data from Seepage, Observation Well, and Reservoir Water Samples collected at Horsetooth Dam during July 2004
|
|
|
- Jeremy Randall
- 6 years ago
- Views:
Transcription
1 Interpretation of Chemistry Data from Seepage, Observation Well, and Reservoir Water Samples collected at Horsetooth Dam during July 2004 TSC Technical Memorandum No by Doug Craft, Research Chemist USDI - Bureau of Reclamation - Technical Service Center Fisheries Applications Research Group, D-8290 PO Box Denver CO dcraft@do.usbr.gov
2 Introduction This technical memorandum summarizes chemistry data from reservoir, seepage, and observation well water samples collected at Horsetooth Dam on July 13-14, Samples were received by the Denver Environmental Chemistry Laboratory on July 16, 2004, and the final data were reported to me on September 28, These samples are the first set of seepage water samples to be collected after completion of modifications to Horsetooth Dam and re-filling of the reservoir. Seepage, well, and reservoir water were analyzed for the chemical constituents ph, conductivity (EC), calcium (Ca), magnesium (Mg), sodium (Na), potassium (K), bicarbonate, (HCO 3), carbonate (CO 3 ), hydroxide (OH ), sulfate (SO 4 ), chloride (Cl ), and trace elements aluminum (Al), iron (Fe), manganese (Mn), and silicon (Si). Seepage, well, and reservoir water have been sampled and analyzed at intervals since 1951 in response to concerns about seepage at Horsetooth Dam, Ft. Collins, Colorado. Previous geochemical evaluation of seepage data and evaluation of risks resulting from the potential failure modes lead to modification of the four dams that contain Horsetooth Reservoir. Chemical data from seepage and well water at Horsetooth Dam has consistently. suggested that mineral dissolution of calcite (CaCO 3), gypsum (CaSO42H2O), and silica (SiO 2) has been occurring in the foundation and abutments since first filling. The tilted geology of the foundation is composed of brecciated sedimentary claystone deposits with layered beds of limestone (notably the Forelle Limestone) and gypsum (the Blaine gypsum) associated with the Lykins formation. Samples were initially collected from the downstream seep at SM-3 shortly after reservoir filling in 1951, and indications of soluble mineral dissolution have been noted in technical memos for water samples collected since Samples and Locations Samples were collected from several wells and seepage locations. Information about these samples, obtained from Chuck Sullivan (in his travel report dated September 9, 2004), are summarized in Table 1. Samples are organized by abutment and distance from dam axis. Refer to the map in figure 1 for sampling locations. Methodology Samples were analyzed by the Denver Environmental Chemistry Laboratory following established consensus methods (USEPA 1983, 1986, American Public Health Association, 1998). The EPA methods are summarized in the lab report included in the Appendix. In this report, concentrations for major ions are reported in units of milligrams per liter (mg/l) and milliequivalents per liter (meq/l), and trace elements are reported in Horsetooth Seepage Chemistry - 1
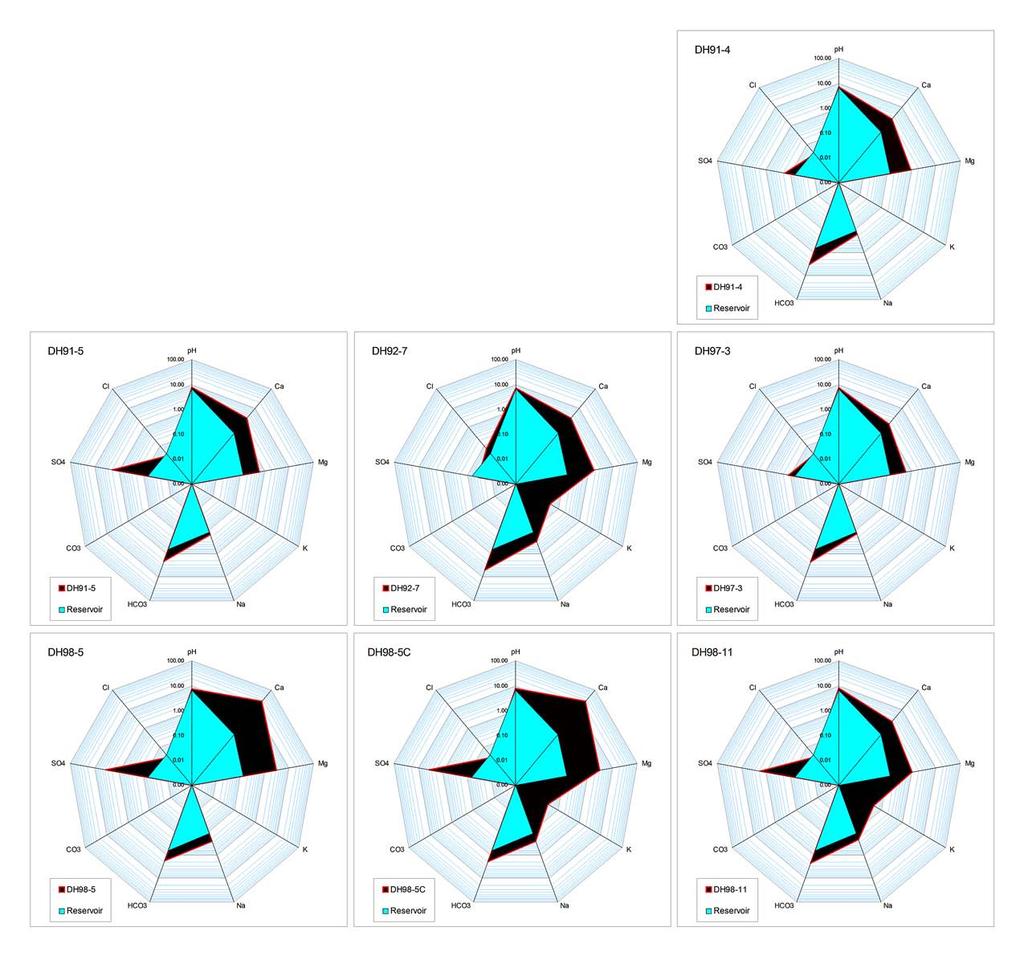
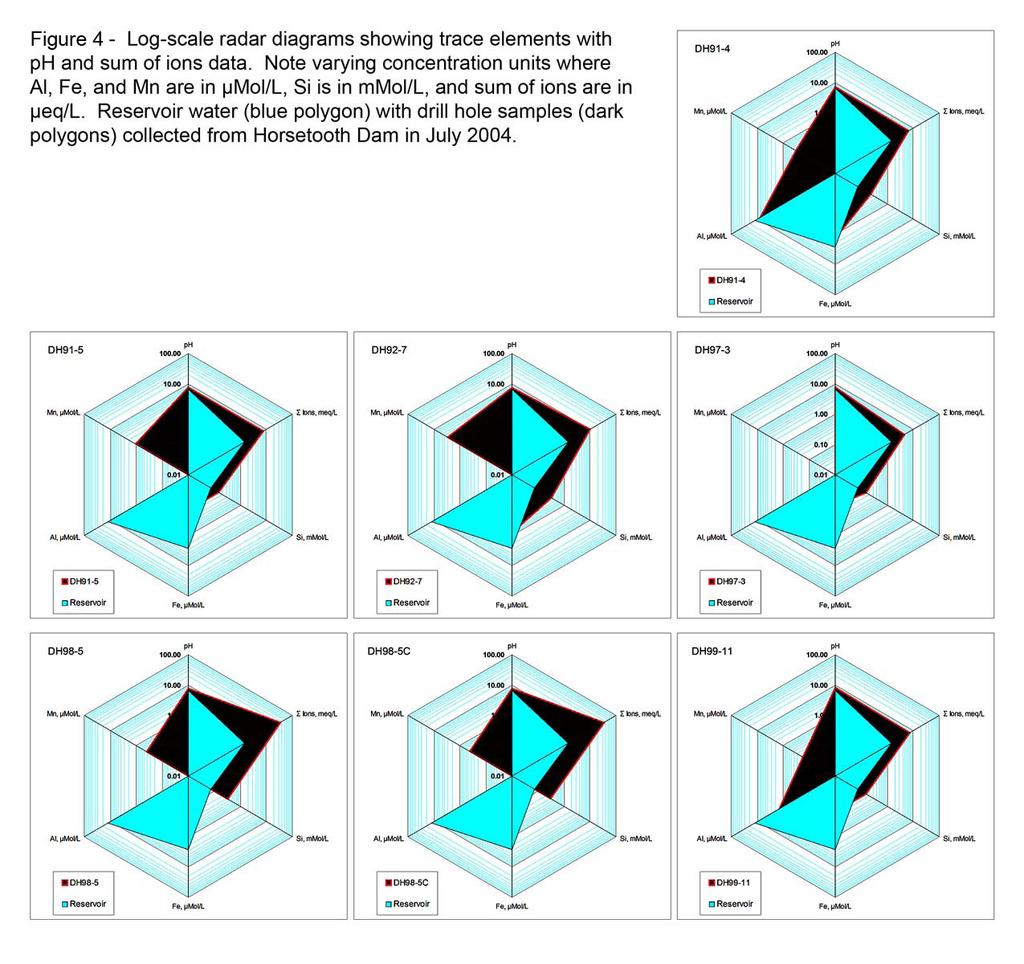
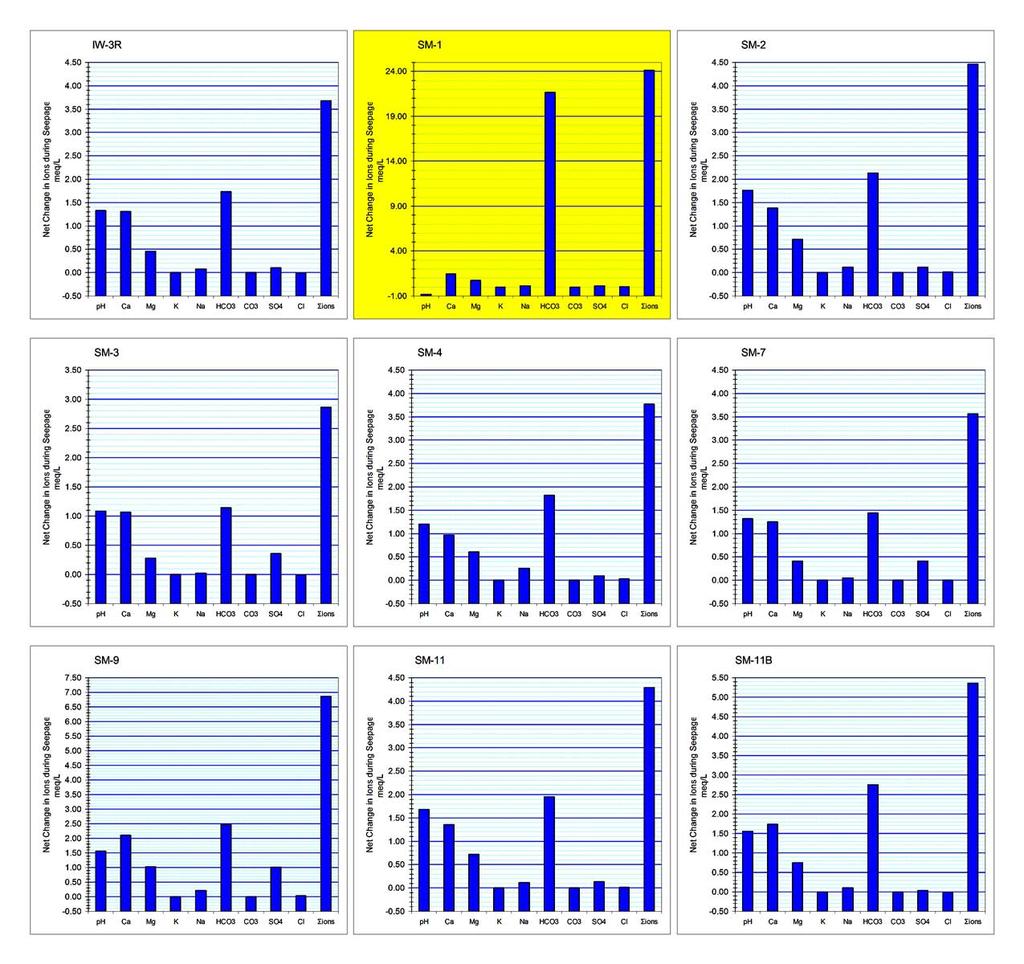
3 millimoles per liter (mmol/l) and micromoles per liter ( Mol/L). For each analyzed constituent, same date reservoir meq/l was subtracted from seepage meq/l to calculate net difference meq/l. Saturation indices (SI) are reported for carbonate-containing minerals (calcite, dolomite, magnesite), gypsum (and amorphous silica (MINTEQA2 compound SIO2(A,PT)) were calculated using the MINTEQA2 model (Allison, et al., 1991) and have been included with the Horsetooth summary data spreadsheet file (transmitted by on ). The SI s were calculated assuming temperature = 10 C and that samples were in equilibrium with atmospheric O 2 and CO 2 at partial pressures for elevation 5,640 ft. Trace elements (Al, Fe, Mn, Si) reported below detection limits were re-coded as one-tenth the reported limit of detection for input into the MINTEQA2 model. Negative SI values suggest under saturation and that the water will dissolve the mineral. Positive SI values suggest over saturation and that the mineral will tend to precipitate. SI values near 0 suggest that the mineral is in equilibrium with the seepage water. Results and Discussion Major ions results are summarized in Table 2, and trace elements in Table 3. Differences in meq/l between reservoir and downstream samples are summarized in table 4, and MINTEQA2-calculated mineral saturation indices are presented in table 5. Figures 2 (wells and piezometers) and 3 (surface seeps) show radar diagrams for major ions in meq/l with the reservoir sample reproduced on each graph (light blue polygon). Trace element data are graphed similarly in figures 4 (wells and piezometers) and 5 (surface seeps). Once again, the reservoir sample polygon is included on each graph. Note that the radar diagrams plot data on a log scale, so any dark polygon visible beyond the reservoir polygons suggest a significant increase in concentration. Figures 6 (wells and piezometers) and 7 (surface seeps) plot difference data in meq/l on bar charts for each sample. Increased sulfate (SO 4) along with Ca relative to the reservoir suggests gypsum dissolution along flow paths, and all seepage and well samples showed elevated Ca and at least some elevated SO 4. DH91-5 (91.2 mg/l), DH98-5 (165 mg/l) and 5C (176 mg/l), and DH99-11 (82.5 mg/l) showed significantly elevated SO 4. These samples show the SO spike clearly in the figure 6 bar charts. 4 Trace element data in Table 3 (and figures 5 and 6) show that no samples contained Fe or Al higher than the reservoir sample (Fe = 148 g/l, Al = 325 g/l). Elevated Mn relative to the reservoir (< 4.00 g/l) was observed in several wells: DH91-4 = 17.9 g/l, DH-91-5 = 59.1 g/l, DH-92-7 = 169 g/l, suggesting some bacterial activity in these wells and either stagnant conditions or very slow seepage flow through these intersection points. All well and surface seepage samples (except for SM-9) show elevated Si, suggesting some weathering of clays or dissolution of amorphous silca along seepage flow paths. Horsetooth Seepage Chemistry - 2
4 Limestone (calcite) also appears to be dissolving along all flow paths sampled in this event. HCO 3 is elevated for all downstream samples; however, some of this increase may be caused by microbial metabolism of organic carbon during seepage transit. Along the well interception flow paths, the largest increases in Ca were observed for DH98-5 (516 mg/l) and 5C (512 mg/l). With surface seeps, highest Ca was observed for SM-9 (51.4 mg/l) and SM-11B (44.1 mg/l). The other SM samples showed very similar results with respect to elevated HCO 3 and Ca. Dolomite (CaMg(CO 3) 2) dissolution is also suggested by the Table 4 increases in Mg for all samples. Another possibility for increased Mg may be that the local limestone contains a proportion of Mg in the calcite. Mineral saturation indices in Table 5 show that all seepage and well samples remain undersaturated with respect to soluble minerals, and that SI values are generally less negative compared to the reservoir water. Except for amorphois silica (SiO 2), reservoir water is an aggressive solvent for all soluble minerals. Water in DH-98-5 appears to be near equilibrium with respect to gypsum (SI = -0.58, SO4 = +3.5 meq/l) suggesting that SO 4 concentration in this well may be regulated by gypsum dissolution. The DH98-5 SI s may also suggest stagnant conditions where near equilibrium conditions are present. Suspended Sediments in Well Samples: Notably high levels of suspended solids were observed in 3 well samples: DH91-4 (243 mg/l), DH92-7 (1,230 mg/l), DH98-5 (222 mg/l), and DH98-5C (272 mg/l). Residue from samples DH-92-7 and DH98-5 were likely caused by stirring of drill hole sediments during hand baling of the wells. The DH-91-4 sample was pumped, but field notes suggest that this well recharges slowly, so pumping may have also stirred and mobilized sediments. The slow recharge of these wells suggest is that sampling turbulence is the likely cause of suspended sediments in these samples. DH-92-7, whose screen intersects the Harriman Shale, contained suspended residue that was mostly clay particles (see memorandum No , from Doug Hurcomb, dated October 22, 2004). Initial samples purged from this well also exhibited an organic odor suggestive of stagnant conditions in the hole. The presence of elevated Mn (169 g/l) also suggests anaerobic reducing conditions in this well. In DH98-5 and 5C, duplicate well samples with a screen in the Blaine Gypsum, the suspended residues were classified as chiefly calcite by petrographic examination. DH98-5 also showed unbalanced ions concentrations, suggesting that low HCO 3 alkalinity and/or elevated Ca and Mg may have been caused by subsampling heterogeneity. For example, a sub sample containing particulate calcite may have been analyzed for Ca (high bias for Ca), but the alkalinity sample did not have suspended materials (potential low bias for HCO 3). Suspended particulates from DH-91-4, with a screen in the Glendo Shale, also contained mostly calcite. Horsetooth Seepage Chemistry - 3
5 Surface Seepage Sample Notes: SM-1 analysis results showed a poor ion balance (- 77 percent), and the culprit for this sample appears to be elevated HCO 3, which appears to be an order of magnitude higher than expected. The unexpectedly low ph (5.77) for this sample also suggests that water emerging at SM-1 is fairly acidic, perhaps from very slow flow conducive to bacterial activity. Surface seeps also show several samples suggesting gypsum dissolution: SM-3, SM-7, and SM-9. Along these flow paths, it appears that seepage is contacting gypsum deposits and some of the subsurface gypsum is continuing to dissolve. Gypsum dissolution on the left abutment below Satanka at SM-9 warrants close scrutiny during future sampling events as gypsum dissolution was not previously noted in surface seeps on this side of the dam. Conclusions and Recommendations: It appears that limestone and gypsum are continuing to be dissolved by underground seepage at Horsetooth Dam. This is not a surprising result given the foundation and abutment geology. However, it is probably too early to determine if these dissolution rates are greater than those observed before repairs. Perhaps some of the increases observed in the July 2004 samples including flushing of increased concentration "stagnant" or remnant seepage water that remained in the abutments and foundation formations during construction. These remnant waters may also be reflected in the well samples. The complete flushing of prior bank storage may take several seasons of reservoir filling. One sampling, however, does not prove the bank storage theory, and I recommend additional sampling events during low and high-water points along with continued surveillance of seepage volume for several more years. If concentrations reach a constant level and seepage flows do not increase with similar hydrostatic heads, then monitoring frequency may be significantly reduced. The suggestion of gypsum dissolution emerging at the left side SM-9 surface seep should be carefully monitored. The next sampling event should also specify analyses on samples filtered through 0.45 m filter media. This should eliminate spurious ion balance problems from acid titration of calcite particles during alkalinity tests, and any spectral artifacts or interferences from analyzing samples with finely-sized suspended mineral solids. Now that the chemistry lab at the TSC is closed, future samples will also need to be contracted. Please contact me well before the next sampling so I can help arrange for a suitable contract lab and analytical request. Horsetooth Seepage Chemistry - 4
6 TABLES Interpretation of Chemistry Data from Seepage, Observation Well, and Reservoir Water Samples collected at Horsetooth Dam during July 2004 TSC Technical Memorandum No by Doug Craft
7 Table 1 Seepage and well samples collected in July 2004 from Horsetooth Dam. Station Abutment Lateral Distance Pump Screen ID L or R from Dam Axis (ft - m) Depth, ft Depth, ft Notes IW-3R L , Right toe drain - inspection well on left side of outlet SM-9 L , Satanka Dike seepage SM-4 L 1, , Seepage Pond, collects all left side seepage DH91-4 L , sediment, static level 128.3', Glendo Shale DH99-11 L , static level 135.1', Lower Lykins (Forelle - Blaine) DH91-5 L , static level 28.2', Forelle Limestone DH92-7 L , sediment, static level 54.6', hand-baled sample, Harriman Shale DH98-5** L , sediment, static level 7.1', hand-baled sample,, Blaine Gypsum DH98-5C** L duplicate of DH98-5 DH97-3 L , static level 24.8', Forelle Formation SM-1 R right side of outlet SM-11 R right side of outlet SM-11B R new right side seepage measurement site SM-2 R 1, , right (east) of Hansen Canal SM-3 R 2, , deeper seepage - Forelle SM-7 R 3,750 1, , all seepage collection point ** Samples DH98-5 and DH98-5C are from the same drill hole. Horsetooth Seepage Chemistry - Tables - 1
8 Table 2 Major ions concentrations for reservoir, well and surface seepage samples collected at Horsetooth Dam July, 13-14, Lab EC TDS TSS Lab Ca Mg Na K HCO3 CO3 SO4 Cl Sample ID µs/cm mg/l mg/l ph mg/l mg/l mg/l mg/l mg/l mg/l mg/l mg/l RESN < < < DH < < DH < < < DH < DH < < < DH < < DH98-5C < DH < IW-3R < < < SM < < SM < < < SM < < < SM < < < SM < < < SM < < < SM < < < SM-11B < < < DH98-5D 4 <10.0 < <0.03 <0.03 < < <0.04 DH91-1B 3 <10.0 < < < <1.0 <0.15 <0.04 Detection limit: Horsetooth Seepage Chemistry - Tables - 2
9 Table 3 Trace element concentrations for reservoir, well and surface seepage samples collected at Horsetooth Dam July 13-14, SiO2 Fe Al Mn Sample ID mg/l µg/l µg/l µg/l RESN <4.00 DH DH < DH < DH <30.0 <4.00 DH <4.00 < DH98-5C 18.2 <4.00 < DH IW-3R 8.67 <4.00 <30.0 <4.00 SM <30.0 <4.00 SM <30.0 <4.00 SM <4.00 SM <4.00 <30.0 <4.00 SM <4.00 SM < SM <4.00 <30.0 <4.00 SM-11B < DH98-5D <0.04 <4.00 <30.0 <4.00 DH91-1B <0.04 <4.00 <30.0 <4.00 Detection limit: Horsetooth Seepage Chemistry - Tables - 3
10 Table 4 Differences ( ion) between seepage and reservoir samples expressed in milliequivalents per liter (meq/l). Sample ID ph Ca Mg K Na HCO3 CO3 SO4 Cl ions DH DH DH DH DH DH98-5C DH IW-3R SM SM SM SM SM SM SM SM-11B Horsetooth Seepage Chemistry - Tables - 4
11 Table 5 Mineral saturation indices for reservoir, well, and seepage water samples from Horsetooth Dam. Positive values suggest oversaturation, negative values suggest undersaturation. Calcite Dolomite Gypsum Magnesite Amorphous Silica RESN DH DH DH DH DH DH98-5C DH IW-3R SM-1 NC NC NC NC NC SM SM SM SM SM SM SM-11B Horsetooth Seepage Chemistry - Tables - 5
12 FIGURES Interpretation of Chemistry Data from Seepage, Observation Well, and Reservoir Water Samples collected at Horsetooth Dam during July 2004 TSC Technical Memorandum No by Doug Craft
13

14
15

16

17
18
Common Well Problems. Common Well Problems. Well Forensics. Difficult Well Problems May Require Well Forensics 12/11/2017
 Difficult Well Problems May Require Well Forensics Roger Miller Water Chemist Water Systems Engineering Inc. rdmiller@h2osystems.com Well Forensics Forensic Science application of science to legal investigations
FilterSorb SP3 Treatment Method: Part II
 FilterSorb SP3 Treatment Method: Part II By Deepak Chopra WatchvWater GmbH Fahrlachstraße 14 68165 Mannheim Germany May 2013 Web: www.watchwater.de email: info@watchwater.de Telefon: +49 (0) 621 87951-0
Adapted from: An original Creek Connections activity. Creek Connections, Box 10, Allegheny College, Meadville, Pennsylvania
 Hardness Comparisons Hardness Adapted from: An original Creek Connections activity. Creek Connections, Box 10, Allegheny College, Meadville, Pennsylvania 16335. Grade Level: all Duration: 50 minutes Setting:
The following is a description of the tasks conducted during the 2010 annual supply well sampling event and the results obtained.
 February 9, 2011 Mr. Jan Alfson California Regional Water Quality Control Board Fresno Branch Office 1685 E Street Fresno, CA 93706 Subject: 2010 Annual Supply Well Sampling Data Transmittal Hilmar Cheese
Alkalinity: An Important Parameter in Assessing Water Chemistry
 Maine Geologic Facts and Localities January, 2009 Alkalinity: An Important Parameter in Assessing Water Chemistry Text by Daniel B. Locke, Department of Agriculture, Conservation & Forestry 1 Introduction
SPECIFICATION NO.1197S Addendum No.4 Attachment D. Appendix L- Ground Water Quality Data and Revised Construction Groundwater Discharge Plan
 SPECIFICATION NO.1197S Addendum No.4 Attachment D Appendix L- Ground Water Quality Data and Revised Construction Groundwater Discharge Plan Page 1 of 2 Specification No. 1197S Addendum No. 4 ATTACHMENT
Hard water. Hard and Soft Water. Hard water. Hard water 4/2/2012
 Hard and Soft Water is the type of water that has high mineral content (in contrast with soft water). minerals primarily consist of calcium (Ca 2+ ), and magnesium (Mg 2+ ) metal cations, and sometimes
SOME CONSIDERATIONS WHEN APPLYING LIMESTONE/ROCK PHOSPHATE MATERIALS ON TO ACID PYRITIC SPOILS
 SOME CONSIDERATIONS WHEN APPLYING LIMESTONE/ROCK PHOSPHATE MATERIALS ON TO ACID PYRITIC SPOILS Bill Evangelou U. M. Sainju E. Portig Agronomy Department University of Kentucky ABSTRACT Published in the
Pebble Project Surface Water Quality Program Streams, Seeps, and Ponds
 Day1_1445_Surface Water Quality_PLP_McCay.mp3 Pebble Project Surface Water Quality Program Streams, Seeps, and Ponds Mark Stelljes SLR International February 1, 2012 Outline Stream Program Overview Results
Total Dissolved Solids
 Total Dissolved Solids LabQuest 12 INTRODUCTION Solids are found in streams in two forms, suspended and dissolved. Suspended solids include silt, stirred-up bottom sediment, decaying plant matter, or sewage-treatment
REMOVAL OF HARDNESS BY PRECIPITATION
 REMOVAL OF HARDNESS BY PRECIPITATION Hardness divalent cations If hardness is too high Ca 2+ + Mg 2+ + Fe 2+ + Mn 2+ + Sr 2+... precipitation of soap, scaling on pipes, boilers, cooling towers, heat exchangers.
Hydrogeologic Monitoring at University of Minnesota Outreach, Research and Educational Park (UMore Park), 2011
, 2011") Hydrogeologic Monitoring at University of Minnesota Outreach, Research and Educational Park (UMore Park), 2011 Joel T. Groten Dr. E. Calvin Alexander, Jr. January 2012 University of Minnesota Twin Cities
Hydrogeologic Monitoring at University of Minnesota Outreach, Research and Educational Park (UMore Park), 2011 Joel T. Groten Dr. E. Calvin Alexander, Jr. January 2012 University of Minnesota Twin Cities
Membrane Technology: From Manufacture to. May Production
 Membrane Technology: From Manufacture to May 2018 Production Osmosis Graphic pulled from https://earthobservatory.nasa.gov/features/water/page2.php Water Sources Surface Waters Ground Water Seawater Lakes
Wastewater Treatment of high total dissolved solids and acidity in Cerro de Pasco mining wastewater
 Wastewater Treatment of high total dissolved solids and acidity in Cerro de Pasco mining wastewater Presented by Melissa Rhodes Golder Associates, Inc. Presentation Outline Project Overview Influent Design
How to Collect Your Water Sample and Interpret the Results for the Irrigation Analytical Package
 How to Collect Your Water Sample and Interpret the Results for the Irrigation Analytical Package Bradley J. Austin, Leo Espinoza, Chris Henry, Mike Daniels, and Brian E. Haggard University of Arkansas
A FIELD DEMONSTRATION OF AN ALTERNATIVE COAL WASTE DISPOSAL TECHNOLOGY GEOCHEMICAL FINDINGS. Paul T. Behum. Liliana Lefticariu. Y.
 A FIELD DEMONSTRATION OF AN ALTERNATIVE COAL WASTE DISPOSAL TECHNOLOGY GEOCHEMICAL FINDINGS Paul T. Behum Office of Surface Mining, Mid-Continent Region, Alton, IL Liliana Lefticariu Department of Geology,
Utilization of Geochemical Parameters in Developing a Conceptual Site Model
 Utilization of Geochemical Parameters in Developing a Conceptual Site Model Annual Risk Assessment & Remediation Seminar MSECA, Indianapolis, IN October 29 2012 µg/l Steven R. Irvin & Jim V. Rouse Acuity
GEOCHEMICAL MODULE FOR AMDTreat
 GEOCHEMICAL MODULE FOR AMDTreat Charles A. Cravotta III and David L. Parkhurst, U.S. Geological Survey Brent P. Means, Robert M. McKenzie, and Bill Arthur, U.S. Office of Surface Mining Reclamation and
How to Collect Your Water Sample and Interpret the Results for the Livestock Analytical Package
 How to Collect Your Water Sample and Interpret the Results for the Livestock Analytical Package Bradley J. Austin, Dirk Philipp, Mike Daniels, and Brian E. Haggard Arkansas Water Resources Center University
Recirculating Hot Water Systems
 Recirculating Hot Water Systems While copper pipe has long been used for the transmission of hot water, the service to which the corroded copper pipe in Kearney, MO was put is a comparatively new application.
CERTIFICATE OF ANALYSIS
 BAY 3, 4500 5TH STREET NE CALGARY, AB CANADA T2L 7C3 MAXXAM JOB #: A814851 Received: 2008/04/02, 13:15 Matrix: Water # s Received: 1 This report supersedes all previous reports with the same Maxxam job
Water Management in Queensland Coal Seam Gas. John Walsh, PhD CETCO Energy Services
 Water Management in Queensland Coal Seam Gas John Walsh, PhD CETCO Energy Services Background: Water Management in the Coal Seam Gas industry in Queensland is a complex and expensive undertaking Huge pipeline
Appendix C: Water Quality Data
 Appendix C: Water Quality Data Your Project #: 111257005 Site: TIM HORTONS SYLVIA LAKE NSD # 16300R Attention: DAVID WHETTER STANTEC CONSULTING LTD 603-386 BROADWAY AVENUE WINNIPEG, MB CANADA R3C
GEOCHEMICAL IDENTIFICATION OF SALINE WATER FROM AN IRRIGATION WELL IN NORTH-CENTRAL STAFFORD COUNTY, KANSAS
 GEOCHEMICAL IDENTIFICATION OF SALINE WATER FROM AN IRRIGATION WELL IN NORTH-CENTRAL STAFFORD COUNTY, KANSAS a report for the Kansas Corporation Commission by Donald O. Whittemore Kansas Geological Survey
Lafayette College Department of Civil and Environmental Engineering
 Lafayette College Department of Civil and Environmental Engineering CE 321: Environmental Engineering and Science Fall 2017 Homework #12 Due Tuesday: 12/12/17 SOLUTIONS The town of Easton is considering
Core Analysis with the Tracer
 BRUKER ELEMENTAL Core Analysis with the Tracer Prepared by: Lee Drake, Senior Application Scientist January 23, 2014 BRUKER ELEMENTAL Key Points OBJECTIVE 3 EXPLORATION 3 DECISION MAKING 3 RECLAMATION
Wilbur-Ellis Company. Carl Bruice - National Nutrition Technical Manager
 Wilbur-Ellis Company Carl Bruice - National Nutrition Technical Manager Potential Effects of Water Chemistry Total salt accumulation Specific ion toxicity (B, Na, Cl) Reduced infiltration (Na and ECw)
1. Scaling. H.O.: H-5/21, KRISHNA NAGAR, DELHI Tel.: , Fax:
 Boiler Water Problems and Its Causes Water is the essential medium for steam generation. Conditioning it properly can increase the efficiency of boiler and as well as extend the boiler s life. Treating
Interpreting Irrigation Water Quality Reports
 Interpreting Irrigation Water Quality Reports By Dara M Park, L. B. McCarty, and Sarah A. White. Clemson University Water Chemistry What? Water is not just H 2O? What else could possibly be in there? As
Chemical Testing of Drinking Water
 Chemical Testing of Drinking Water Adapted from: An original Creek Connections activity. Water Chemistry Grade Level: all Duration: 50 minutes Setting: lab or classroom Summary: Students will conduct chemistry
Florida Aquifer Geology
 Florida Aquifer Geology September 2016 Sampler Training Workshop Thomas Seal, ES III Watershed Monitoring Section (WMS) Water Quality Assessment Program DEAR Tallahassee Aquifer Basics Essential Definitions
CERTIFICATE OF ANALYSIS
 1 CERTIFICATE OF ANALYSIS ATTENTION: Water Purification Solutions DATE: 29 November 2018 1. GENERAL: Table-1: Tierkloof Borehole & Product - Sampled 1 November 2018 Results expressed in parts per million
Florida Aquifer Geology
 Florida Aquifer Geology February 2017 Sampler Training Workshop Thomas Seal, ES III Watershed Monitoring Section (WMS) Water Quality Assessment Program DEAR Tallahassee Aquifer Basics Essential Definitions
PHYSICAL-CHEMICAL TREATMENT OF METALS AND RADIONUCLIDES IN THE SATURATED ZONE USING COLLOIDAL BUFFERS EOS Remediation, LLC.
 PHYSICAL-CHEMICAL TREATMENT OF METALS AND RADIONUCLIDES IN THE SATURATED ZONE USING COLLOIDAL BUFFERS - 12515 Yenjung Lai 1, Robert C. Borden 1, Ed Alperin 2 1 North Carolina State University, Raleigh,
Superintendence Company of India Private Limited, Plot Y-23, Block-EP, Sector-V, Salt Lake City, Kolkata, West Bengal
 Last Amended on - Page 1 of 16 I. WATER 1. Drinking Water ph IS 3025 (Part 2): 2004, Colour APHA (22 nd Edition) 2120 B: Turbidity (NTU) IS 3025 (Part 10): 1984 Residual, Free Chlorine IS 3025 Part 26/1986
Lecture 18. Soil Acidity, Alkalinity, and Socidity
 Lecture 18 Soil Acidity, Alkalinity, and Socidity 1 Questions ow can acidification occur in soils? ow does p affects availability of N, P, K? ow can acidic soils be managed? Define a saline and sodic soil.
Florida Aquifer Geology
 Florida Aquifer Geology September 2017 Sampler Training Workshop Thomas Seal, ES III Watershed Monitoring Section (WMS) Water Quality Assessment Program DEAR Tallahassee Aquifer Basics Essential Definitions
Evaluation copy. Total Dissolved Solids. Computer INTRODUCTION
 Total Dissolved Solids Computer 12 INTRODUCTION Solids are found in streams in two forms, suspended and dissolved. Suspended solids include silt, stirred-up bottom sediment, decaying plant matter, or sewage-treatment
Water Chemistry 4. Use of Chemical Analyses to Interpret Ground Water Systems
 Water Chemistry 4 Use of Chemical Analyses to Interpret Ground Water Systems When groundwater flows through rocks their minerals dissolve gradually rarely reaching their solubility limit So their CONCENTRATION
Lake Huron Water Treatment Plant Mineral Report
 Lake Huron Water Treatment Plant Mineral Report Turbidity NTU 0.40 0.05 0.3/95% (1) Total Solids mg/l 160 155 500 10 Total Dissolved Solids mg/l 101 0 500 10 Aluminum Al mg/l < 0.050 0.060 0.05-0.2 0.005
Water Quality. CE 370 Lecture 1. Global Distribution of Earth s s Water
 Water Quality CE 370 Lecture 1 Global Distribution of Earth s s Water Water Demand and Supply in Saudi Arabia Total Water Consumption = 22 billion m 3 /Year Water Demand Water Supply Industrial Domestic
November 24, Hitmar Cheese Company ( HCC ) Hitmar, Merced County, Catifornia Cleanup and Abatement Order ( Order ) R Dear Mr.
 Hitmar, Merced County, Catifornia Cleanup and Abatement Order ( Order ) R Dear Mr.") November 24, 2014 Mr. Lonnie Wass Supervising Engineer Catifornia Regional Water Quality Control Board Centrat Vattey Region Region 5 Fresno Office 1685 E Street Fresno, Catifornia 93706-2007 RE: Hitmar
November 24, 2014 Mr. Lonnie Wass Supervising Engineer Catifornia Regional Water Quality Control Board Centrat Vattey Region Region 5 Fresno Office 1685 E Street Fresno, Catifornia 93706-2007 RE: Hitmar
Discipline Chemical Testing Issue Date Certificate Number T-3553 Valid Until Last Amended on - Page 1 of 9
 Last Amended on - Page 1 of 9 I. ORES & MINERALS 1. Iron Ore Total Iron IS 1493: 1981 (RA 2006) 10 % to 70 % Silicon IS 1493: 1981 (RA 2006) 0.5 % to 25 % Aluminum IS 1493: 1981 (RA 2006) 0.5 % to 20 %
Streamwater Chemistry
 Streamwater Chemistry 1) Dissolved major ions 2) Suspended and dissolved organic matter 3) Dissolved nutrients and biological transformations 4) Dissolved gases 5) ph 1) Dissolved major ions TDS (Total
Lake Huron Water Treatment Plant Mineral Report
 Lake Huron Water Treatment Plant Mineral Report Turbidity NTU 0.30 0.06 0.3/95% (1) Total Solids mg/l 94 91 500 10 Total Dissolved Solids mg/l 81 51 500 10 Aluminum Al mg/l < 0.050 < 0.050 0.05-0.2 0.005
EPA Primary. (mg/l as CaCO3) (mg/l as CaCO3)
 (mg/l as CaCO3)") NORTH TEXAS MUNICIPAL WATER DISTRICT - Wylie Water Analysis Jan-2018 Mineral Analysis Raw Treated Standards Residue on Evaporation 412 456 500 1000 Silica (SiO2) 3.63 3.41 Iron (Fe) 0.378 0.259 0.3 0.3
NORTH TEXAS MUNICIPAL WATER DISTRICT - Wylie Water Analysis Jan-2018 Mineral Analysis Raw Treated Standards Residue on Evaporation 412 456 500 1000 Silica (SiO2) 3.63 3.41 Iron (Fe) 0.378 0.259 0.3 0.3
Interpretation of geochemical data from wells in the western geothermal field of Romania
 Interpretation of geochemical data from wells in the western geothermal field of Romania Oana Stănăşel, Ludovic Gilău University of Oradea, Romania Email: stanasel@uoradea.ro Abstract The western geothermal
Florida Aquifer Geology
 Florida Aquifer Geology February 2018 Sampler Training Workshop Thomas Seal, ES III Watershed Monitoring Section (WMS) Water Quality Assessment Program DEAR Tallahassee Aquifer Basics Essential Definitions
12 ph. Figure 4. Cumulative plot of ph values from BMU 1. Table 4. Summary of ph values (standard ph units). SMCL: 6.5 to 8.5.
. SMCL: 6.5 to 8.5.") 12 ph Table 4. Summary of ph values (standard ph units). SMCL: 6.5 to 8.5. BMU 1 BMU 2 BMU 5 Values 2,005 778 1,605 Maximum 11.6 8.6 10.4 75th percentile 7.5 7.7 7.4 Median 7.1 7.4 6.9 25th percentile
12 ph Table 4. Summary of ph values (standard ph units). SMCL: 6.5 to 8.5. BMU 1 BMU 2 BMU 5 Values 2,005 778 1,605 Maximum 11.6 8.6 10.4 75th percentile 7.5 7.7 7.4 Median 7.1 7.4 6.9 25th percentile
Supplementary Figure 1: Comparison of Fe(II) oxidation of 0.5 mm dissolved
 oxidation of 0.5 mm dissolved") Supplementary Information Supplementary Figure 1: Comparison of Fe(II) oxidation of 0.5 mm dissolved Fe(II) by Rhodobacter ferrooxidans sp. strain SW2 in the absence (a) and presence (b) of 2.0 mm monomeric
Supplementary Information Supplementary Figure 1: Comparison of Fe(II) oxidation of 0.5 mm dissolved Fe(II) by Rhodobacter ferrooxidans sp. strain SW2 in the absence (a) and presence (b) of 2.0 mm monomeric
INDEX FRESH SEMINAR SERIES
 INDEX FRESH SEMINAR SERIES Acidification & ph Control with SO 2 -Sulfurous Acid Generators By Terry R. Gong Harmon Systems International, LLC We provide solutions that benefit the world 1 Presentation
CHAPTER 6 GROUNDWATER HYDROCHEMISTRY AND HYDROCHEMICAL PROCESSES
 69 CHAPTER 6 GROUNDWATER HYDROCHEMISTRY AND HYDROCHEMICAL PROCESSES 6.1 GENERAL Groundwater contains a wide range of dissolved solids and contain small amount of dissolved organic matter and gases. Groundwater,
An Approach to Using Geochemical Analysis to Evaluate the Potential Presence of Coal Ash Constituents in Drinking Water
 2017 World of Coal Ash (WOCA) Conference in Lexington, KY - May 9-11, 2017 http://www.flyash.info/ An Approach to Using Geochemical Analysis to Evaluate the Potential Presence of Coal Ash Constituents
Product Models & Specifications
 water Treatment Technology for the Upstream Oil & Gas Industry Business Philosophy The AquaTex COG product line is proprietary reclamation, pretreatment, advanced treatment and recycling technology designed
Claudia Cardona, Yelena Katsenovich, Leonel Lagos Applied Research Center Florida International University. Session # 064, Abstract # 14434
 Claudia Cardona, Yelena Katsenovich, Leonel Lagos Applied Research Center Florida International University March 2 March 6, 2014 Phoenix, Arizona Session # 064, Abstract # 14434 Outline Background Objective
WEF Collection Systems Conference Evaluation of High ph Infiltration Water and Recycled Bedding Material
 Evaluation of High ph Infiltration Water and Recycled Bedding Material Keith Hobson, PE, BCEE, FOX Engineering Associates, Inc. ABSTRACT The purpose of this evaluation was to determine the cause and source
Streamwater. 1) Dissolved 2) Dissolved 3) Suspended and dissolved 4) Dissolved 5) 1) Dissolved
 Dissolved 2) Dissolved 3) Suspended and dissolved 4) Dissolved 5) 1) Dissolved") Streamwater 1) Dissolved 2) Dissolved 3) Suspended and dissolved 4) Dissolved 5) 1) Dissolved TDS (Total dissolved solids) = sum of all. A general indicator of. Pass through 2 micrometer filter Much regional
Streamwater 1) Dissolved 2) Dissolved 3) Suspended and dissolved 4) Dissolved 5) 1) Dissolved TDS (Total dissolved solids) = sum of all. A general indicator of. Pass through 2 micrometer filter Much regional
Detroit Water and Sewerage Department Water Quality Division Laboratory Analysis of Water Samples Collected at Lake Huron Plant 10/14/2014
 Lake Huron Plant Turbidity NTU 0.43 0.04 0.3/95% (1) Total Solids mg/l 103 116 500 10 Total Dissolved Solids mg/l 112 142 500 10 Aluminum Al mg/l < 0.050 < 0.050 0.05-0.2 0.005 Iron Fe mg/l 0.053 < 0.050
Concentration mg/l TDS mg/l 10, ,000 Recovery 75% Waste TDS mg/l 44,000 COD mg/l 3,500 0 BOD NTU 1,250 0 Power Used kwh/m3 2.
 1326 North Trinity San Antonio, TX 78207 1 Test Report Frac/Produced Water September 2012 A test was run in 2012 using model P-6 four stages in series. The test was run at 900 LPH (approx 4 GPM, 135 BPD).
Advanced Water Treatment (DESALINATION) PART 1. Instructors : Dr. Yunes Mogheir Dr. Azzam Abu Habeeb. Page 1
 PART 1. Instructors : Dr. Yunes Mogheir Dr. Azzam Abu Habeeb. Page 1") Advanced Water Treatment (DESALINATION) معالجة مياه متقدمة EENV 5330 PART 1 Instructors : Dr. Yunes Mogheir Dr. Azzam Abu Habeeb Page 1 Introduction Global water availability & problems Water availability
Advanced Water Treatment (DESALINATION) معالجة مياه متقدمة EENV 5330 PART 1 Instructors : Dr. Yunes Mogheir Dr. Azzam Abu Habeeb Page 1 Introduction Global water availability & problems Water availability
Lecture 17 Guest Lecturer this week. Prof. Greg Ravizza
 Lecture 17 Guest Lecturer this week. Prof. Greg Ravizza Migrating Reservoirs in the Hydrologic Cycle - Inorganic solubility examples from Rain and River chemistry Migrating Reservoirs in the Hydrologic
Chemical Analysis of Ground Waters in Tabriz Area, Northwestern Iran
 Asian Journal of Chemistry Vol. 21, No. 2 (2009), 1217-1224 Chemical Analysis of Ground Waters in Tabriz Area, Northwestern Iran N. MEHRDADI, A. BAGHVAND, H. ETEMADI, NAVID RAZMKHAH* and M. ESMAEILI BIDHENDI
Detroit Water and Sewerage Department Water Quality Division Laboratory Analysis of Water Samples Collected at Lake Huron Plant 6/9/2015
 Lake Huron Plant Turbidity NTU 0.35 0.05 0.3/95% (1) Total Solids mg/l 136 162 500 10 Total Dissolved Solids mg/l 145 136 500 10 Aluminum Al mg/l 0.510 0.142 0.05-0.2 0.005 Iron Fe mg/l 0.082 0.118 0.3
TEAMS Competition 2017 Scenario # 2. Water Treatment. From Potentially Poisonous to Potable through Purification
 TEAMS Competition 2017 Scenario # 2 Water Treatment From Potentially Poisonous to Potable through Purification Take a moment to picture yourself at the bank of a river; you re absolutely parched, but the
KKB Micro Testing Labs Pvt. Ltd., , 2 nd Floor, Tarun Plaza, NFC Main Road, Krishna Nagar Colony, Moula Ali, Hyderabad, Telangana
 Last Amended on - Page 1 of 7 I. AIR, GASES & ATMOSPHERE 1. Ambient Air Monitoring RSPM ( PM 10) IS 5182 (Part 23): 2006 (RA ) 5 µg/m 3 to 750 µg/m 3 PM 2.5 SOP 11 dated 17.11.2014 12.5 µg/m 3 to 500 µg/m
SWANA 2017 Leachate Basics and Quality Changes with Organics Removal. Steve Johnson M.Eng., P.Eng.
 SWANA 2017 Leachate Basics and Quality Changes with Organics Removal Steve Johnson M.Eng., P.Eng. May 2017 2 Landfills that take over 10,000 tonnes per year? How many of you have leachate collection systems?
Water supplied by Marafiq does not meet the process requirements.
 WATER TREATMENT In Industries Water is used for: a. Drinking b. Cleaning c. Cooling d. Producing Steam e. Process requirement Why we need to treat water? For human consumption a. Water to be purified (Make
Slide 1. Slide 2. Slide 3. Hardness. Concentration is. What s the concentration of red triangles? What s in your pipes? 500 ml
 Slide 1 Hardness What s in your pipes? Slide 2 What s the concentration of red triangles? 500 ml 1 g 1 g 1 g A. 10 B. 10 C. D. 1 g 1 g It s all of the above! Slide 3 Concentration is any statement of the
CERTIFICATE OF ANALYSIS
 Your C.O.C. #: 32531001 Attention: Scott Churko Engineering and Operations Dpt PO Box 1390 Parksville, BC Canada V9P 2H3 CERTIFICATE OF ANALYSIS MAXXAM JOB #: B279455 Received: 2012/09/06, 09:15 Sample
Produced Water Quality Limits for Irrigated Agriculture. Robert Flynn, Ph.D. Extension Plant Sciences, NMSU
 Produced Water Quality Limits for Irrigated Agriculture Robert Flynn, Ph.D. Extension Plant Sciences, NMSU rflynn@nmsu.edu Introduction Water Quality Affects Soil Productivity Crop Performance Poor Water
Lecture 6: Softening
 Islamic University of Gaza Environmental Engineering Department Water Treatment EENV 4331 Lecture 6: Softening Dr. Fahid Rabah 1 6.1 Definition of hardness: A. Hardness is the term often used to characterize
Worldwide Pollution Control Association. August 3-4, 2010
 Worldwide Pollution Control Association IL Regional Technical Seminar August 3-4, 2010 Visit our website at www.wpca.infowpca Troubleshooting Process Problems How To Identify and Correct Gordon Maller
Gas-Water-Rock Interactions in Saline Aquifers Following CO 2 Injection: Results from Frio Formation, Texas, USA
 Gas-Water-Rock Interactions in Saline Aquifers Following CO 2 Injection: Results from Frio Formation, Texas, USA GCCC Digital Publication Series #05-03e Y. K. Kharaka D. R. Cole W. D. Gunter J. J. Thordsen
Fate and Transport of Wheat in the Athabasca River: R&D in the context of a grain derailment response strategy. Karla Graf Loni Waldner, P.Eng.
 Fate and Transport of Wheat in the Athabasca River: R&D in the context of a grain derailment response strategy Karla Graf Loni Waldner, P.Eng. Objectives Provide sustainable remediation by minimizing the
ACIDIZING DOLOMITE RESERVOIRS USING HCL ACID PREPARED WITH SEAWATER: PROBLEMS AND SOLUTIONS. A Thesis DENNIS GEORGE ARENSMAN
 ACIDIZING DOLOMITE RESERVOIRS USING HCL ACID PREPARED WITH SEAWATER: PROBLEMS AND SOLUTIONS A Thesis by DENNIS GEORGE ARENSMAN Submitted to the Office of Graduate and Professional Studies of Texas A&M
REVIEW OF DEEP WAIRAU AQUIFER - GROUNDWATER CHEMISTRY ASPECTS. July 2008
 REVIEW OF DEEP WAIRAU AQUIFER - GROUNDWATER CHEMISTRY ASPECTS July 2008 Client Report CSC0806 REVIEW OF DEEP WAIRAU AQUIFER - GROUNDWATER CHEMISTRY ASPECTS for the Marlborough District Council by Murray
Chemical composition of seawater; Salinity and the major constituents
 Chemical composition of seawater; Salinity and the major constituents OCN 623 Chemical Oceanography Salt dissolved in ocean water alters the properties of water Freezing point of seawater is ~ -1.8 C Density
Technical Memorandum Groundwater Quality Sampling, November 2010 Event
 Kennedy/Jenks Consultants Technical Memorandum Groundwater Quality Sampling, November 2010 Event Date: 10 March 2011 To: From: Subject: Amy Blain City of Longview Steve Misner Kennedy/Jenks Consultants
Laboratory Fee Schedule
 JMLord, Inc. Laboratory Fee Schedule Spring 2011 www.jmlordinc.com 267 N. Fulton St. Fresno CA, 93705 (559) 268-9755 (559) 486-6504 (FAX) Laboratory Services Since 1976, JMLord, Inc. has provided consultants
How to Collect Your Water Sample and Interpret the Results for the Poultry Analytical Package
 How to Collect Your Water Sample and Interpret the Results for the Poultry Analytical Package Bradley J. Austin, Josh B. Payne, Susan E. Watkins, Mike Daniels, and Brian E. Haggard Arkansas Water Resources
DIFFERENTIATION OF WATER SOURCES USING ANALYTICAL WATER CHEMISTRY DATA
 DIFFERENTIATION OF WATER SOURCES USING ANALYTICAL WATER CHEMISTRY DATA PRESENTED TO FOUNDATION PERFORMANCE ASSOCIATION JUNE 8, 2011 BY John Bryant, PH.D., P.G., CPG, P.E. All slides and this presentation
A METHOD FOR PREDICTING THE ALKALINITY GENERATED BY ANOXIC LIMESTONE DRAINS
 A METHOD FOR PREDICTING THE ALKALINITY GENERATED BY ANOXIC LIMESTONE DRAINS ABSTRACT by George R. Watzlaf and Robert S. Hedin U.S. Bureau of Mines Pittsburgh Research Center P.O. Box 18060 Pittsburgh,
Water Chemistry. Water 101
 Water Chemistry Water 101 I. Introduction A. Water is not pure Many different kinds of chemicals dissolved in it Ions, organic chemicals, organic matter, particulate matter, and gases can all be in water
1/21/2019. Where does your water come from? Irrigation Water Testing and Interpretation: Case Studies from the Field
 Where does your water come from? Irrigation Water Testing and Interpretation: Case Studies from the Field DR. JUSTIN QUETONE MOSS, ASSOCIATE PROFESSOR DR. CHARLES FONTANIER, ASSISTANT PROFESSOR HORTICULTURE
Treatability of Organic and Radioactive Emerging Contaminants in Stormwater Runoff
 Treatability of Organic and Radioactive Emerging Contaminants in Stormwater Runoff Robert Pitt, Ph.D., P.E., D.WRE, BCEE, University of Alabama Shirley Clark, Ph.D., P.E., D.WRE, Penn State - Harrisburg
Passive Treatment of Coal-mine Drainage by a Sulfate-reducing Bioreactor in the Illinois Coal Basin 1
 Passive Treatment of Coal-mine Drainage by a Sulfate-reducing Bioreactor in the Illinois Coal Basin 1 Paul T. Behum 2 ; Liliana Lefticariu 3 ; Evan Walter 3 ; and Ron Kiser 4 ; 1 Paper was presented at
Appendix C Groundwater Quality
 Appendix C Groundwater Quality TABLE GW1.1 TABLE C1 Groundwater Quality Results - Field Parameters Monitoring Sample MSI Sample Field Temp Field ph Field EC 25 Field DO% Field Turbidity Well Date Number
ENVIRONMENTAL ENGINEERING LECTURE 3: WATER TREATMENT MISS NOR AIDA YUSOFF
 ENVIRONMENTAL ENGINEERING LECTURE 3: WATER TREATMENT MISS NOR AIDA YUSOFF LEARNING OUTCOMES Define the concept and process of water treatment. Describe the concept of coagulation, flocculation, and sedimentation
2.0 BACKGROUND ON CALCULATED TOTAL DISSOLVED SOLIDS
 DATE April 26, 2013 PROJECT No. 1313490001-5000-5020 TO Alexandra Hood De Beers Canada Inc. CC Lisa Bridges, John Faithful and Peter Chapman FROM Tasha Hall EMAIL thall@golder.com 2012 TOTAL DISSOLVED
GROUND WATER QUALITY FOR IRRIGATION IN BENGHAZI REGION
 Twelfth International Water Technology Conference, IWTC12 2008, Alexandria, Egypt 1735 GROUND WATER QUALITY FOR IRRIGATION IN BENGHAZI REGION Hasan G. Mohamed Department of Civil Engineering, University
Movement and Storage of Groundwater The Hydrosphere
 Movement and Storage of Groundwater The Hydrosphere The water on and in Earth s crust makes up the hydrosphere. About 97 percent of the hydrosphere is contained in the oceans. The water contained by landmasses
Technical Memorandum Groundwater Quality Sampling, First 2010 Semiannual Event
 Kennedy/Jenks Consultants Technical Memorandum Groundwater Quality Sampling, First 2010 Semiannual Event Date: 30 July 2010 To: From: Subject: Amy Blain City of Longview Steve Misner Kennedy/Jenks Consultants
A summary of groundwater elevation monitoring activities conducted during the August 2010 third quarter monitoring event is presented below.
 December 9, 200 Mr. Jan Alfson California Regional Water Quality Control Board Fresno Branch Office 685 E Street Fresno, CA 93706 Subject: 200 Third Quarter Monitoring and Sampling Data Transmittal Hilmar
CHEMICAL COMPOSITION OF NATURAL WATERS
 CHEMICAL COMPOSITION OF NATURAL WATERS DISSOVLED GASES Oxygen (and E h ) Why important? product of photosynthesis needed for aerobic respiration - Much of an aquatic organisms energy budget is devoted
Groundwater Forensics to Evaluate Molybdenum Concentrations Near a CCR Landfill
 15 World of Coal Ash (WOCA) Conference in Nasvhille, TN - May 5-7, 15 http://www.flyash.info/ Groundwater Forensics to Evaluate Molybdenum Concentrations Near a CCR Landfill Bruce R. Hensel 1, Thomas J.
Geochemistry and Inverse Modeling of the Memphis Aquifer in Tennessee, USA. Darin Wilwand Geology 428 Geochemistry Fall 2014
 Geochemistry and Inverse Modeling of the Memphis Aquifer in Tennessee, USA Darin Wilwand Geology 428 Geochemistry Fall 2014 Outline Location The Study Geochemistry of the Memphis aquifer Phreeqc Inverse
THE EFFECTS OF ANOXIC LIMESTONE DRAINS ON MINE WATER CHEMISTRY'
 THE EFFECTS OF ANOXIC LIMESTONE DRAINS ON MINE WATER CHEMISTRY' Robert S. Hedin and George R. Watzlaf' Abstract: Construction and water quality characteristics of21 anoxic limestone drains (ALDs) were
# 538 Environmental and Outdoor Water Sciencefaircenter.com Study Kit
 # 538 Environmental and Outdoor Water Sciencefaircenter.com Study Kit Each water sample is tested for this Set of parameters: ph, Alkalinity, Water Hardness, Total Dissolved Solids (TDS) (4 tests per Set)
Contaminants that may be present in source water before it is treated include:
 Lakeside Elementary School Water Quality Report 2017 California Water System (Santa Clara County) I.D. No. 4300779 *****Este informe contiene informacion muy importante sobre su agua beber. Traduzcalo
ALKALINITY ADDITION: THEORY AND BEST PRACTICE
 ALKALINITY ADDITION: THEORY AND BEST PRACTICE Kuteiba Hussein (Mott MacDonald), Raj Valabh (Mott MacDonald), Simon Flanagan (Xylem Water) ABSTRACT Alkalinity is an often overlooked water quality parameter