Mike Langland USGS PA Agricultural Advisory Board April 28, 2016
|
|
|
- Amice Jemima Jenkins
- 6 years ago
- Views:
Transcription


1 Mike Langland USGS PA Agricultural Advisory Board April 28, 2016
2 Chesapeake Bay Nontidal Monitoring Network - Loads to the Bay (1) How are nitrogen, phosphorus, and suspendedsediment loads responding to restoration activities and changing land use across the bay watershed? (2) What are the trends in nitrogen, phosphorus, and suspended-sediment loads being delivered to the bay from the nontidal portions of the watershed?
3 Multi-agency and State effort Using Monitoring Data To Measure Progress and Explain Change 1. Explain water-quality changes Response to management practices 2. Inform management Mid Point Assessment (2017) 2-yr Progress Watershed Implantation Plans (WIP) 3. Enhance models to explain change CBP WSM and Estuarine models USGS SPARROW 4. Monitor and measure progress toward local and Chesapeake Bay TMDL


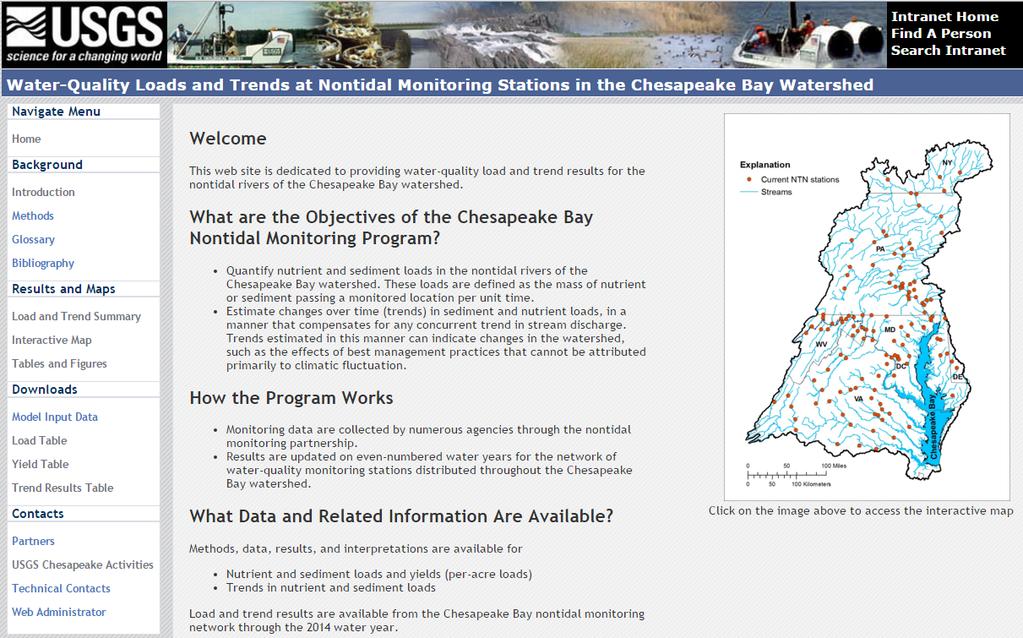
4 USGS Nontidal Web Page
 117 stations (87 > 5 years) Range from 1 to 27,100 mi 2 PA: 36 sites / 41 Susquehanna Nutrient and sediment collected monthly/storms/streamflow Loads and trends")
5 Chesapeake Bay Nontidal Monitoring Network 1985: River-Input Monitoring (9 RIM) and 6 selected upstream sites : agree on comparable methods (added 30 sites) : TMDL and WIP expansion (53 sites) 117 stations (87 > 5 years) Range from 1 to 27,100 mi 2 PA: 36 sites / 41 Susquehanna Nutrient and sediment collected monthly/storms/streamflow Loads and trends computed
6 WHY LOAD and TREND ESTIMATION? Loads Reflects changes in nutrient and sediment inputs and stream flow Compare sites using load per acre (yield) Trends in load Changes due to landuse, input sources, and BMPs Ancillary data to further refine Use statistical package to estimate loads and trends from monitoring data (WRTDS, Hirsch and others, 2010, Moyer and others, 2012) Remove affects of climatic variability
7 Load and Trend Example: Susquehanna River Total Nitrogen Susquehanna River At Marietta, PA 33% reduction Long-term trends 30 sites 13% reduction Short-term trends 87 sites


8 Loads Nontidal Network -Results Per acre loads (yields) Trends Directional change Total mass change

9 Total Nitrogen per Acre Loads Bay watershed Range: 1.19 to 33.4 lbs/ac Average: 7.33 lbs/ac PA results: lbs per acre 11.5 lbs per acre Highest in southern areas

10 Total Nitrogen per Acre Loads and Trends: Chesapeake Watershed Improving Trends: 54% Degrading Trends: 27% No Trend: 19% PA: Majority improving Improving: 14 Degrading: 3 No change: 1


11 Changes in Nitrogen per Acre Loads: Susquehanna Watershed

12 Changes in Nitrogen per Acre Loads: Improvements - WWTP upgrades - Agricultural practices - Land conversion - Less N in rainfall Download figure:


13 PHOSPHORUS - Point sources - Non point sources - Natural sources 13

14 Total Phosphorus per Acre Loads and Trends: Loads per acre: Higher in PA Lower part of basin Bay Watershed trends: Improving Trends : 68% Degrading Trends : 20% No Trend : 12% PA trends: Majority improving Improving: 13 Degrading: 2 No change: 1

15 Changes in Phosphorus per Acre Loads: Susquehanna Watershed

16 Changes in Phosphorus per Acre Loads: Improvements - WWTP upgrades - Agricultural practices - Land conversion - Construction management actions Download figure:


17 Suspended Sediment per Acre Loads and Trends: Watershed: loads per acre Range 18 to 2,206 lbs/ac Average load of 482 lbs/ac PA similar Watershed Trends Improving: 50% Degrading: 30% No Trend : 20% PA: mixed results Improving: 8 Degrading: 3 No change: 6

18 Chesapeake Bay Nontidal Monitoring Network Loads to the Bay (Question #2) What are the trends in nitrogen, phosphorus, and suspendedsediment loads being delivered to the bay from the nontidal portions of the watershed? To answer this question, we look to the loads delivered from the nine River Input Monitoring stations.
19 Changes in Total Nitrogen Delivered to the Bay Estuary from the 9 RIM Stations
20 Less Improvement in nitrogen, phosphorus, and sediment at the RIM sites vs upstream sites. The Susquehanna and Potomac Rivers carry the largest loads. All RIM stations have an influence on their respective estuary.


21 1. What Works Upgrades to WWTPs Reductions in air emissions Some agricultural practices 2. Challenges Response times Continued development and intensified agriculture 3. Future Monitoring Restoration efforts target high loading locations Target storm water management Improve ancillary data From UMCES, USGS, EPA (2014) Watershed Trends

22 PA Highlights High loads per acre in some areas Nitrogen: SE portion of basin Phosphorus: Eastern portion Improving trends Total Nitrogen and Phosphorus Mixed Results for Sediment WWTP, air inputs, selected ag practices Other Challenges: continued development, intensified ag, lag times
23 Acknowledgements Load and Trend Analysis Jeff Chanat Joel Blomquist Mike Mallonee Gavin Yang Ken Hyer Doug Moyer Mike Langland Bob Hirsch Many Others!! USGS Nontidal Web Page ( Cassandra Ladino Scott Phillips Water-Quality Monitoring Partners DE Dept. Natural Resources and Env. Control DC Dept. of the Environment MD Dept. of Natural Resources PA Dept. of Env. Protection NY State Dept. of Env. Conservation VA Dept. of Env. Quality Susquehanna River Basin Comm. WV Dept. of Env. Protection U.S. Environmental Protection Agency WV Dept. of Ag. U.S. Geological Survey (All Bay States)
Full Title of Priority: Enhanced Analysis and Explanation of Water-Quality Data for the TMDL Mid-Point Assessment
 MIDPOINT ASSESSMENT PRIORITY WORK PLAN: ASSESS AND EXPLAIN WATER-QUALITY CHANGES LEAD: SCIENTIFIC, TECHNICAL ANALYSIS, AND REPORT (STAR) TEAM Full Title of Priority: Enhanced Analysis and Explanation of
Prepared by Douglas L. Moyer and Joel D. Blomquist, U.S. Geological Survey, February 3, 2016
 Summary of Nitrogen, Phosphorus, and Suspended-Sediment Loads and Trends Measured at the Chesapeake Bay Nontidal Network Stations: Water Year 2014 Update Prepared by Douglas L. Moyer and Joel D. Blomquist,
Monitoring Data in Support of Mid-Point Assessment
 Monitoring Data in Support of Mid-Point Assessment Doug Moyer Joel Blomquist, Jeni Keisman Based on contributions from dozens of incredibly smart and dedicated scientists 1 Using Monitoring Data To Measure
Full Title of Priority: Enhanced Analysis and Explanation of Water-Quality Data for the TMDL Mid-Point Assessment
 MIDPOINT ASSESSMENT PRIORITY WORK PLAN: MEASURE AND EXPLAIN WATER-QUALITY CHANGES LEAD: SCIENTIFIC, TECHNICAL ANALYSIS, AND REPORT (STAR) TEAM 2016-17 EXPECTATIONS Full Title of Priority: Enhanced Analysis
Restoring the Water-Quality Conditions in the Chesapeake Bay: What is working and what still needs to be done
 Restoring the Water-Quality Conditions in the Chesapeake Bay: What is working and what still needs to be done Scott Phillips, USGS Water-Quality Goal Team January 12, 2015 Many Contributors Authors: Christina
Factoring in the Influence of the Conowingo Reservoir on State Allocations
 Factoring in the Influence of the Conowingo Reservoir on State Allocations Presented to the Water Quality GIT September 26, 2016 Lee Currey and Dave Monatali Director, Science Services Administration Maryland
Chesapeake Bay Program Indicator Analysis and Methods Document Nitrogen, Phosphorus, and Suspended Sediment Loads to the Bay Updated October 9, 2018
 1 Chesapeake Bay Program Indicator Analysis and Methods Document Nitrogen, Phosphorus, and Suspended Sediment Loads to the Bay Updated October 9, 2018 Indicator Title: Nitrogen, Phosphorus, and Suspended
Modeling Quarterly Review Meeting January 14, Bruce Michael Maryland Department of Natural Resources
 Ongoing Conowingo Dam / Lower Susquehanna River Studies Modeling Quarterly Review Meeting January 14, 2015 Bruce Michael Maryland Department of Natural Resources Draft Lower Susquehanna River Watershed
Chesapeake Bay Program in Pennsylvania. Karl G. Brown Executive Secretary PA State Conservation Commission
 Chesapeake Bay Program in Pennsylvania Karl G. Brown Executive Secretary PA State Conservation Commission 1 PA s Chesapeake Basin Over 50 percent of the land in PA drains to the Chesapeake Bay The Susquehanna
Understanding the Influence of the Conowingo Reservoir Infill on Expectations for States Nutrient and Sediment Pollutant Load Reductions
 Understanding the Influence of the Conowingo Reservoir Infill on Expectations for States Nutrient and Sediment Pollutant Load Reductions Presented to the Management Board November 17, 2016 Chesapeake Bay
Factoring in the Influence of the Conowingo Reservoir on State Allocations
 Factoring in the Influence of the Conowingo Reservoir on State Allocations Presented to the Chesapeake Bay Commission on behalf of the Modeling Workgroup September 9, 2016 Lee Currey Director, Science
Critical Period for the Chesapeake Bay TMDL
 Critical Period for the Chesapeake Bay TMDL September 29 th and 30 th, 2009 Presentation C Bob Koroncai and Mike Haire U.S. EPA Region III Water Protection Division and U.S. EPA Office of Water Choosing
Adjustments to the Bay s Assimilative Capacity & Determination of Additional Nitrogen and Phosphorus Loads
 Adjustments to the Bay s Assimilative Capacity & Determination of Additional Nitrogen and Phosphorus Loads Rich Batiuk Associate Director for Science, Analysis and Implementation U.S. EPA Chesapeake Bay
From Coal Country to the Chesapeake:
 From Coal Country to the Chesapeake: USGS Water Science in West Virginia and Virginia John Jastram USGS Virginia & West Virginia Water Science Center What we do Operate streamgages, observation wells,
Understanding the Influence of the Conowingo Reservoir Infill on Expectations for States Nutrient and Sediment Pollutant Load Reductions
 Understanding the Influence of the Conowingo Reservoir Infill on Expectations for States Nutrient and Sediment Pollutant Load Reductions Presented to the Water Quality Goal Implementation Team October
2017 Midpoint Assessment: Year of Decision. October 19, 2017 PA Phase III WIP Steering Committee Meeting
 2017 Midpoint Assessment: Year of Decision October 19, 2017 PA Phase III WIP Steering Committee Meeting Today s Objectives Highlight of key midpoint assessment policy decisions to be considered by the
2025 Chesapeake Bay Climate Change Load Projections
 2025 Chesapeake Bay Climate Change Load Projections Mark Bennett, U.S. Geological Survey CBP Climate Resiliency Workgroup Co-Chair Chesapeake Bay Program Principals Staff Committee March 2, 2018 2 Today
Nutrient Loads: Overview of approaches, and the Chesapeake Bay experience. Robert M. Hirsch, Research Hydrologist US Geological Survey
 Nutrient Loads: Overview of approaches, and the Chesapeake Bay experience Robert M. Hirsch, Research Hydrologist US Geological Survey 2017-04-05 Outline of the presentation 1. Multiple reasons to estimate
Qian Zhang, 1 Robert Hirsch, 2 William Ball 1,3. Acknowledgements Maryland Sea Grant (NOAA) US Geological Survey MD Water Resources Research Center
 US Geological Survey MD Water Resources Research Center") Effects of Reservoir Filling on Sediment and Nutrient Removal in the Lower Susquehanna River Reservoir: An Input-Output Analysis based on Long-Term Monitoring Qian Zhang, 1 Robert Hirsch, 2 William Ball
Effects of Reservoir Filling on Sediment and Nutrient Removal in the Lower Susquehanna River Reservoir: An Input-Output Analysis based on Long-Term Monitoring Qian Zhang, 1 Robert Hirsch, 2 William Ball
Assessment of Chesapeake Assimilation Capacity Application to Phase III Draft Targets
 Assessment of Chesapeake Assimilation Capacity Application to Phase III Draft Targets Water Quality Goal Implementation Team January 22, 2018 Lew Linker, EPA-CBPO, Gary Shenk, USGS and Richard Tian, UMCES
Chesapeake Bay Water Quality Restoration:
 Chesapeake Bay Water Quality Restoration: The Transition to a Regulatory Approach Building on Decades of Cooperative Partnership Rich Batiuk Assoc. Director for Science Chesapeake Bay Program Office U.S.
Results of Latest Phase 6 Conowingo Analysis
 Results of Latest Phase 6 Conowingo Analysis STAC Quarterly Meeting September 13, 2017 Lew Linker, Gopal Bhatt, and the CBP Modeling Team Chesapeake Bay Program Science, Restoration, Partnership 1 Overview
Incorporating monitoring, modeling and trends analyses into management decisions: a Choptank River example
 Incorporating monitoring, modeling and trends analyses into management decisions: a Choptank River example Emily Trentacoste, PhD EPA Chesapeake Bay Program WQGIT Meeting 7/10/2017 DRAFT. DO NOT CITE OR
Pennsylvania s Phase III Watershed Implementation Plan: What are the Expectations?
 Pennsylvania s Phase III Watershed Implementation Plan: What are the Expectations? Phase 3 WIP Steering Committee April 3, 2017 Agenda Progress Made and the Job Ahead of Us Need Your Engagement to Move
The Midpoint Assessment and Phase III WIP
 The Midpoint Assessment and Phase III WIP A Regional Workshop from the Maryland Department of the Environment Generously sponsored by the Harry R. Hughes Center for Agro-Ecology of the University of Maryland
Chesapeake Assessment Scenario Tool CAST
 Chesapeake Assessment Scenario Tool CAST Olivia H. Devereux Interstate Commission on the Potomac River Basin 12/13/2011 GOALS FOR CAST Provide a mechanism for the states to get input and commitment from
CHESAPEAKE BAY TMDL WATERSHED IMPLEMENTATION PLAN (WIP) PHASE III. August 23, 2018 Region 2000 Local Government Council Stakeholder Meeting
 PHASE III. August 23, 2018 Region 2000 Local Government Council Stakeholder Meeting") CHESAPEAKE BAY TMDL WATERSHED IMPLEMENTATION PLAN (WIP) PHASE III August 23, 2018 Region 2000 Local Government Council Stakeholder Meeting Chesapeake Bay TMDL 101 In 2010 the Chesapeake Bay Total Maximum
CHESAPEAKE BAY TMDL WATERSHED IMPLEMENTATION PLAN (WIP) PHASE III August 23, 2018 Region 2000 Local Government Council Stakeholder Meeting Chesapeake Bay TMDL 101 In 2010 the Chesapeake Bay Total Maximum
Reducing Nitrogen, Phosphorus and Sediment Pollution Progress Update. Jeff Corbin, Senior Advisor to the EPA Administrator
 Reducing Nitrogen, Phosphorus and Sediment Pollution Progress Update Jeff Corbin, Senior Advisor to the EPA Administrator Reducing Pollution Briefing Package Overview 1. 29-11 Milestones 2. 211 Progress
SUPPORTING CHESAPEAKE BAY RESTORATION BY MODELING NUTRIENT SOURCES AND TRANSPORT
 SUPPORTING CHESAPEAKE BAY RESTORATION BY MODELING NUTRIENT SOURCES AND TRANSPORT USGS and EPA Applications and Results of SPARROW Models Goals Update on recently released SPARROW models of Nitrogen and
Septic Systems 4% Chemical Fertilizer: Agricultural Land 15%
 Chesapeake Bay Draft TMDL Overview of the Draft TMDL and WIP Evaluations September 2010 Sources of Nitrogen Loads to Bay Municipal & Industrial Wastewater 20% Septic Systems 4% Chemical Fertilizer: Agricultural
Draft CHESAPEAKE BAY TMDL Restoring West Virginia s waterways and Chesapeake Bay Public Meeting Romney, West Virginia November 4, 2010
 Draft CHESAPEAKE BAY TMDL Restoring West Virginia s waterways and Chesapeake Bay Public Meeting Romney, West Virginia November 4, 2010 Today s Agenda EPA presents draft TMDL Rich Batiuk, Chesapeake Bay
An Introduction to Aggregate Air-Water Exchanges
 An Introduction to Aggregate Air-Water Exchanges Air Directors Meeting March 25, 2013 Lewis Linker CBP Modeling Coordinator linker.lewis@epa.gov 1 In the Chesapeake TMDL exchanges of nitrogen are allowed
STAC Review of Chesapeake Bay Program Phase 6 Watershed Model
 STAC Review of Chesapeake Bay Program Phase 6 Watershed Model Gary Shenk USGS - Chesapeake Bay Program 9/14/16 This information is being provided to meet the need for timely best science. The information
So, Is the Chesapeake Bay. Yet After Going on The Bay Pollution Diet?
 So, Is the Chesapeake Bay Watershed Losing Weight Yet After Going on The Bay Pollution Diet? Rich Batiuk Associate Director for Science Chesapeake Bay Program Office U.S. Environmental Protection Agency
Pennsylvania s Phase III Watershed Implementation Plan. Kick-Off & Listening Session June 5, 2017
 Pennsylvania s Phase III Watershed Implementation Plan Kick-Off & Listening Session June 5, 2017 Agenda -- Background to Promote Discussion Today Why Are We Doing This? Pennsylvania Allocations and Progress
MAST Training Webinar for Federal Partners
 MAST Training Webinar for Federal Partners (Maryland s Assessment and Scenario Tool) August 16, 2011 1 Overview of Today s Webinar Introduction: (30 min) Brief background of Phase WIP process Define local
Qian Zhang (UMCES / CBPO) Joel Blomquist (USGS / ITAT)
 Joel Blomquist (USGS / ITAT)") CBP STAC Water Clarity Workshop Solomons, MD, 02/06/2017 Long-term Riverine Inputs from Major Tributaries to Chesapeake Bay Relevant to Water Clarity Qian Zhang (UMCES / CBPO) Joel Blomquist (USGS / ITAT)
CBP STAC Water Clarity Workshop Solomons, MD, 02/06/2017 Long-term Riverine Inputs from Major Tributaries to Chesapeake Bay Relevant to Water Clarity Qian Zhang (UMCES / CBPO) Joel Blomquist (USGS / ITAT)
Chesapeake Bay Program Partnership s Scientific, Technical Assessment and Reporting (STAR) Team Briefing and Options Paper:
 Team Briefing and Options Paper:") Chesapeake Bay Program Partnership s Scientific, Technical Assessment and Reporting (STAR) Team Briefing and Options Paper: Addressing CBP Partnership s and Non-tidal Monitoring Network s 2013 Funding
Chesapeake Bay Program Partnership s Scientific, Technical Assessment and Reporting (STAR) Team Briefing and Options Paper: Addressing CBP Partnership s and Non-tidal Monitoring Network s 2013 Funding
Continuous Monitoring Network Strategy Continued Discussion. Peter Tango November 18, 2015 DIWG-INWG SERC
 Continuous Monitoring Network Strategy Continued Discussion Peter Tango USGS@CBPO November 18, 2015 DIWG-INWG meeting @ SERC Existing Chesapeake Bay Program Continuous Monitoring Programming Shallow water
Understanding the Effect of the Conowingo Dam and Reservoir on Bay Water Quality
 Understanding the Effect of the Conowingo Dam and Reservoir on Bay Water Quality Background The Susquehanna River has a major influence on Chesapeake Bay Water Quality. The Susquehanna watershed is 43%
2014 Chesapeake Bay Watershed Agreement:
 2014 Chesapeake Bay Watershed Agreement: Management Strategy for the 2017 WIP Outcome, 2025 WIP Outcome, and Water Quality Standards Attainment & Monitoring Outcome Introduction Draft February 9, 2015
Chesapeake Bay Program Models:
 Chesapeake Bay Program Models: A Guide to Better Understanding Modeling and Decision Support Tool Forum Penn State Harrisburg August 1, 2011 1 Mark Dubin Agricultural Technical Coordinator University of
Chesapeake Bay Program Watershed Modeling. Gary Shenk, Lewis Linker, Rich Batiuk Presentation to STAC 3/22/2011
 Chesapeake Bay Program Watershed Modeling Gary Shenk, Lewis Linker, Rich Batiuk Presentation to STAC 3/22/2011 1 Chesapeake Bay Partnership Models 2 Recent History of the Chesapeake Bay Program s Watershed
ITAT Workshop on Integrating Findings to Explain Water Quality Change
 ITAT Workshop on Integrating Findings to Explain Water Quality Change December 12-13, 2017 Annapolis, MD STAC publication 18-005 1 Workshop Purpose Interdisciplinary Dialogue To convene research synthesis
Chesapeake Bay 2017 Midpoint Assessment Policy Issues for Partnership Decisions. Water Quality Goal Implementation Team Meeting December 4-5, 2017
 Chesapeake Bay 2017 Midpoint Assessment Policy Issues for Partnership Decisions Water Quality Goal Implementation Team Meeting December 4-5, 2017 PSC Approved Schedule December 19-20, 2017: PSC 2-day retreat
Recommendations for Refinement of a Spatially Representative Non-tidal Water Quality Monitoring Network for the Chesapeake Bay Watershed
 Recommendations for Refinement of a Spatially Representative Non-tidal Water Quality Monitoring Network for the Chesapeake Bay Watershed August 2005 Report of the Task Force on Non-tidal Water Quality
Background What is the Integrated Report (IR)? CWA Background
? CWA Background") Department of the Environment Monday, September 8th, 2014 6:00 pm Montgomery Park, Lobby Conference Rooms Purpose of This Meeting Provide General Information/Updates on 2014 IR Encourage public dialogue,
Department of the Environment Monday, September 8th, 2014 6:00 pm Montgomery Park, Lobby Conference Rooms Purpose of This Meeting Provide General Information/Updates on 2014 IR Encourage public dialogue,
Scientific Investigations Report U.S. Department of the Interior U.S. Geological Survey
 Flux of Nitrogen, Phosphorus, and Suspended Sediment from the Susquehanna River Basin to the Chesapeake Bay during Tropical Storm Lee, September 2011, as an Indicator of the Effects of Reservoir Sedimentation
WIP Development Dashboard
 WIP Development Dashboard Integrating 30 years of Chesapeake Bay data into a new decision support framework for Watershed Implementation Plan development Water Quality GIT Meeting 9/24/2018 Emily Trentacoste,
Appendix E. Summary of Initial Climate Change Impacts on the Chesapeake Bay Watershed Flows and Loads
 Appendix E. Summary of Initial Climate Change Impacts on the Chesapeake Bay Watershed Flows and Loads The potential effects of climate change have not been explicitly accounted for in the current Chesapeake
The Chesapeake Bay TMDL -
 The Chesapeake Bay TMDL - A Driver for New Stormwater Strategies Jane McDonough October 21, 2010 2010 MAFSM Conference, Maritime Institute, Linthicum Heights, Maryland0 Presentation Overview Chesapeake
Understanding Nutrients in the Chesapeake Bay Watershed and Implications for Management and Restoration the EASTERN SHORE
 Understanding Nutrients in the Chesapeake Bay Watershed and Implications for Management and Restoration the EASTERN SHORE Scott W. Ator and Judith M. Denver Guest presented by Joel Blomquist A summary
Modeling the Urban Stormwater (and the rest of the watershed) Katherine Antos, Coordinator Water Quality Team U.S. EPA Chesapeake Bay Program Office
 Katherine Antos, Coordinator Water Quality Team U.S. EPA Chesapeake Bay Program Office") Modeling the Urban Stormwater (and the rest of the watershed) Katherine Antos, Coordinator Water Quality Team U.S. EPA Chesapeake Bay Program Office May 13, 2010 Management Actions Chesapeake Bay Program
Modeling the Urban Stormwater (and the rest of the watershed) Katherine Antos, Coordinator Water Quality Team U.S. EPA Chesapeake Bay Program Office May 13, 2010 Management Actions Chesapeake Bay Program
Conowingo Dam. IAN Image and Video Library
 Decadal-scale Changes in Sediment and Nutrient Delivery from Conowingo Reservoir to Chesapeake Bay: StaJsJcal EvaluaJons of Reservoir Trapping using Long-Term Monitoring Data Conowingo Dam Qian Zhang Monitoring
Proposal for Responsive STAC Workshop: Chesapeake Bay Program Climate Change Modeling 2.0
 Proposal for Responsive STAC Workshop: Chesapeake Bay Program Climate Change Modeling 2.0 Steering Committee *Confirmed Co-Chair: Mark Bennett (USGS)*: CBP Climate Resiliency Workgroup Co-Chair and Director
Water Quality Standards Attainment
 2017 WIP, 2025 WIP and Water Quality Standards Attainment Management Strategy 2015 2025, v.1 I. Introduction For the past 30 years, the Chesapeake Bay Program (CBP) partnership 1 has been committed to
Chesapeake Bay Program Partnership s Investment in the Chesapeake Monitoring Cooperative: What s Different This Time Around
 Chesapeake Bay Program Partnership s Investment in the Chesapeake Monitoring Cooperative: What s Different This Time Around Rich Batiuk Associate Director for Science, Analysis and Implementation Chesapeake
The Chesapeake Bay TMDL Midpoint Assessment What s Changing, What s New, What to Expect in 2017 and 2018
 The Chesapeake Bay TMDL Midpoint Assessment What s Changing, What s New, What to Expect in 2017 and 2018 Russ Baxter, Deputy Secretary of Natural Resources Go Green August 2, 2017 Virginia s Chesapeake
Draft Phase 6 Watershed Model Updates Modeling Workgroup Conference Call May 2017
 05/18/2017 Draft Phase 6 Watershed Model Updates Modeling Workgroup Conference Call May 2017 Gopal Bhatt 1 and Gary Shenk 2 1 Penn State, 2 USGS Presentation Outline Brief overview of the Phase 6 draft
Protecting & Restoring Local Waters and the Chesapeake Bay
 Protecting & Restoring Local Waters and the Chesapeake Bay Restore America s Estuaries National Conference Gregory Barranco Chesapeake Bay Program Office November 2010 The Chesapeake Bay and Watershed
THE CHALLENGE OF NUTRIENT CONTROL IN LARGE SCALE WATERSHEDS: EFFORTS IN THE U.S.
 THE CHALLENGE OF NUTRIENT CONTROL IN LARGE SCALE WATERSHEDS: EFFORTS IN THE U.S. NAE Convocation of the Professional Engineering Societies David Dzombak Carnegie Mellon University May 16, 2011 OUTLINE
The Chesapeake Bay TMDL. How did we get here?
 The Chesapeake Bay TMDL How did we get here? About the Chesapeake Bay The nation s largest estuary worth $1 trillion Covers 64,000 square miles 6 states and the District of Columbia contribute: PA, VA,
Chesapeake Bay TMDL and Maryland s Watershed Implementation Plan. Robert M. Summers, Ph.D. Acting Secretary Maryland Department of the Environment
 Chesapeake Bay TMDL and Maryland s Watershed Implementation Plan Robert M. Summers, Ph.D. Acting Secretary Maryland Department of the Environment TMDL Background TMDL = Total Maximum Daily Load. The maximum
Telling Pennsylvania s Local Stories: A Lancaster Example
 Telling Pennsylvania s Local Stories: A Lancaster Example Emily Trentacoste EPA Chesapeake Bay Program Office Matt Johnston University of Maryland Chesapeake Bay Program Office Agriculture Workgroup Meeting
Anthony Moore Assistant Secretary for Chesapeake Bay Restoration
 Anthony Moore Assistant Secretary for Chesapeake Bay Restoration Chesapeake Bay Program History 1980 Chesapeake Bay Commission 1983 Chesapeake Bay Agreement 1987 Chesapeake Bay Agreement 40% nutrient reduction
Phase 6 Watershed Model Beta 4 Modeling Workgroup Quarterly Meeting Dec 2016
 12/13/2016 Phase 6 Watershed Model Beta 4 Modeling Workgroup Quarterly Meeting Dec 2016 Gopal Bhatt 1 and Gary Shenk 2 1 Penn State University, 2 USGS Presentation Outline A brief summary of input data
for the Chesapeake Bay
 Economic Study of Nutrient Credit Trading PRESENTED BY for the Chesapeake Bay George Van Houtven (RTI International) PRESENTED TO Scientific and Technical Advisory Committee (STAC) Quarterly Meeting Annapolis,
Modeling to Support Management Decisions
 Modeling to Support Management Decisions Presented at the Chesapeake Bay Program Modeling in 2025 and Beyond: A Proactive Visioning Workshop D. Lee Currey, P.E. Co-chair, CBP Modeling Workgroup Director,
How Nutrient Trading Can Help Restore the Chesapeake Bay
 WRI FACT SHEET How Nutrient Trading Can Help Restore the Chesapeake Bay Congress is considering proposals to revise and strengthen the Clean Water Act for the Chesapeake Bay region and improve the health
Pennsylvania s Phase III Watershed Implementation Plan
 Pennsylvania s Phase III Watershed Implementation Plan Informational Meeting Pennsylvania House and Senate Agriculture and Rural Affairs Committees August 16, 2017 Agenda Why Are We Doing This? Progress
2017 Revised Guide for Chesapeake Bay Water Quality Two-year Milestones
 2017 Revised Guide for Chesapeake Bay Water Quality Two-year Milestones Purpose Based upon agreements by the Chesapeake Executive Council beginning in 2008, EPA created an accountability framework that
Use of Market and Voluntary Approaches for Reducing Nonpoint Source Pollution in the Chesapeake Bay Watershed
 Use of Market and Voluntary Approaches for Reducing Nonpoint Source Pollution in the Chesapeake Bay Watershed Dr. Marc Ribaudo Economic Research Service USDA NutriTrade Workshop May 16, 2016 The views
Second Wednesdays 1:00 2:15 pm ET USDA is an equal opportunity provider and employer.
 Second Wednesdays 1:00 2:15 pm ET www.fs.fed.us/research/urban-webinars USDA is an equal opportunity provider and employer. Karen Cappiella Director of Research Center for Watershed Protection kc@cwp.org
Planning Targets. For WQGIT Review Draft November 7, 2017
 Chesapeake Bay Program Partnership Development and Review of the Draft Phase III WIP Planning Targets On December 19-20, 2017, the Water Quality Goal Implementation Team (WQGIT) will be seeking the approval
Protocol for Setting Targets, Planning BMPs and Reporting Progress for Federal Facilities and Lands
 June 22, 2015 Protocol for Setting Targets, Planning BMPs and Reporting Progress for Federal Facilities and Lands Purpose This document describes the process for setting nitrogen, phosphorus and sediment
U.S. Environmental Protection Agency s Interim Expectations for the Phase III Watershed Implementation Plans
 U.S. Environmental Protection Agency s Interim Expectations for the Phase III Watershed Implementation Plans The U.S. Environmental Protection Agency (EPA) provided expectations for the Phase I 1 and Phase
CHESAPEAKE BAY COMPREHENSIVE WATER RESOURCES AND RESTORATION PLAN - UPDATE. Update to Chesapeake Bay Program STAR January 25, 2018
 CHESAPEAKE BAY COMPREHENSIVE WATER RESOURCES AND RESTORATION 255 255 255 237 237 237 0 0 0 217 217 217 163 163 163 200 200 200 PLAN - UPDATE 131 132 122 239 65 53 80 119 27 110 135 120 252 174.59 112 92
Stream and Watershed Restoration Design and Quantitative Benefits. Kelly Gutshall, RLA and Mike LaSala
 Stream and Watershed Restoration Design and Quantitative Benefits Kelly Gutshall, RLA and Mike LaSala Suquehanna Greenway River Towns Workshop September 30, 2013 Benefit Stacking Single Function Multiple
Monday, January 9th, :00 pm. Montgomery Park, Lobby Conference Rooms
 Monday, January 9th, 2016 6:00 pm Montgomery Park, Lobby Conference Rooms Purpose of This Meeting Provide General Information/Updates on 2016 IR and MD s TMDL Prioritization Encourage public dialogue,
Management Approach 1: Phase I WIPs, Phase II WIPs, and Two-year Milestones
 Outcome: 2017 WIP, 2025 WIP and Water Quality Standards Attainment and Monitoring Outcomes Goal: Water Quality Outcome: 2017 WIP, 2025 WIP and Water Quality Standards Attainment and Monitoring Long term
The Chesapeake Bay TMDL
 The Chesapeake Bay TMDL Introduction to a Pollution Diet for 17 Million Chesapeake Bay Watershed Residents Rich Batiuk Associate Director for Science U.S. EPA Region 3 Chesapeake Bay Program Office March
Cost/Benefit Analysis of Stream Restoration as a Nutrient and Sediment Offset
 Cost/Benefit Analysis of Stream Restoration as a Nutrient and Sediment Offset An examination of the monetary impacts that occurs within a range of variables associated with nutrient reduction estimates
Joint Pollutant Reduction Plan
 Paxton Creek Watershed TMDL, Chesapeake Bay PRP, Wildwood Lake PRP, and UNT to Spring Creek PRP August 23, 2017 2018 PAG 13 Regulation NPDES (National Pollutant Discharge Elimination System) Individual
U.S. Environmental Protection Agency s Interim Expectations for the Phase III Watershed Implementation Plans
 U.S. Environmental Protection Agency s Interim Expectations for the Phase III Watershed Implementation Plans The U.S. Environmental Protection Agency (EPA) provided expectations for the Phase I 1 and Phase
Chesapeake Bay WIP Phase II Status in the COG Region
 Chesapeake Bay WIP Phase II Status in the COG Region Presented to Potomac River DWSSP Presented By Karl Berger, Principal Planner Metropolitan Washington Council of Governments Bay TMDL State WIP Summary
Exploring the Environmental Effects of Shale Gas Development in the Chesapeake Bay Watershed
 Exploring the Environmental Effects of Shale Gas Development in the Chesapeake Bay Watershed A Workshop by the Chesapeake Bay Program s Scientific and Technical Advisory Committee April 11-12, 2012 Why
Observations on Nutrient Management and the Chesapeake Bay TMDL
 Observations on Nutrient Management and the Chesapeake Bay TMDL Introduction William J. Rue and Sadie B. Barr EA Engineering, Science & Technology, Inc. 15 Loveton Circle, Sparks, MD 21152 On 29 December
Session I: Introduction
 STAC Workshop M O N I T O R I N G A N D A S S E S S I N G I M P A C T S O F C H A N G E S I N W E A T H E R P A T T E R N S A N D E X T R E M E E V E N T S O N B M P S I T I N G A N D D E S I G N Session
Current Progress and Next Steps in Implementing Maryland s Blueprint for Bay Restoration
 Current Progress and Next Steps in Implementing Maryland s Blueprint for Bay Restoration D. Lee Currey Maryland Department of the Environment Fall 2014 Regional WIP Workshops 1 The Process for Reaching
PCB Facts. >1 million tons produced US largest producer 40% still in use
 PCB Facts >1 million tons produced US largest producer 40% still in use PCBs continue to load into the Chesapeake Bay watershed Stormwater, wastewater and atmospheric deposition Some inadvertent production
Water Quality Resilience and Policy in an Integrated Urban and Agricultural Water Basin
 Water Quality Resilience and Policy in an Integrated Urban and Agricultural Water Basin Linda Fernandez and Daniel McGarvey Virginia Commonwealth University 1 Overview Will pollution be managed by more
Chesapeake Bay Nitrogen Assessments
 Chesapeake Bay Nitrogen Assessments May 20, 2010 Workshop on Nitrogen Assessment Science in the USA Thomas E. Jordan Chesapeake Bay Watershed Area=167,000 km 2 Spans 6 states + DC 6 physiographic provinces
Understanding Nutrients in the Chesapeake Bay Watershed and Implications for Management and Restoration the EASTERN SHORE
 Understanding Nutrients in the Chesapeake Bay Watershed and Implications for Management and Restoration the EASTERN SHORE Scott W. Ator and Judith M. Denver A summary of U.S. Geological Survey Circular
Chesapeake Bay Foundation 101. Robert Jennings
 Chesapeake Bay Foundation 101 Robert Jennings About the Bay Chesapeake Bay Watershed 64,000 square miles 19 major rivers 400 smaller creeks 3,000 species of plants and animals 17 million people How s the
SUPPORTING CHESAPEAKE BAY RESTORATION BY MODELING NUTRIENT AND SEDIMENT SOURCES AND TRANSPORT
 SUPPORTING CHESAPEAKE BAY RESTORATION BY MODELING NUTRIENT AND SEDIMENT SOURCES AND TRANSPORT Applications and Results of SPARROW Models John W. Brakebill jwbrakeb@usgs.gov Scott W. Ator swator@usgs.gov
The Chesapeake Bay TMDL
 The Chesapeake Bay TMDL December 29, 2010 EPA Update on Implementation Progress County Engineers Association of Maryland Fall Conference 2015 Jon M. Capacasa, Water Division Director US EPA Region III
Watershed Model Structure. Dave Montali WV DEP Gary Shenk CBPO WQGIT 10/7/2014
 Watershed Model Structure Dave Montali WV DEP Gary Shenk CBPO WQGIT 10/7/2014 CREATE The Models REVIEW The Models USE The Models 2 A way to think about model updates Model Structure simulating the physical
Climate Change, Marsh Erosion and the Chesapeake Bay TMDL
 Climate Change, Marsh Erosion and the Chesapeake Bay TMDL Rising sea level in Chesapeake Bay is inexorable. One environmental effect associated with sea level rise is marsh erosion. Marsh erosion can impact
Estimated Influence of 2050 Climate Change on Chesapeake Bay Water Quality Standards.
 Estimated Influence of 2050 Climate Change on Chesapeake Bay Water Quality Standards. Water Quality Goal Implementation Team Meeting NCTC Shepherdstown, WV December 14, 2015 Lewis Linker 1, Gopal Bhatt
Land Conservation & Chesapeake Restoration
 Land Conservation & Chesapeake Restoration Peter Claggett Research Geographer, U.S. Geological Survey Coordinator, CBP Land Use Workgroup May 17, 2018 Maryland Land Conservation Conference Linthicum Heights,