Advanced Highway Maintenance and Construction Technology Research Center
|
|
|
- Alexandrina Hoover
- 6 years ago
- Views:
Transcription
1 Advanced Highway Maintenance and Construction Technology Research Center Department of Mechanical and Aerospace Engineering University of California at Davis Evaluation of Methods to Reduce Speeds in Work Zones Bahram Ravani, Principal Investigator and Chao Wang, Wilderich A. White, Dexter Ma, Patricia Fyhrie AHMCT Research Report: UCD-ARR Final Report of Contract: 65A0275, Task ID: 2247 June 28, 2012 California Department of Transportation
2 Division of Research and Innovation Technical Documentation Page 1. Report No. CA Title and Subtitle Evaluation of Methods to Reduce Speed in Work Zones 2. Government Accession No. 3. Recipient s Catalog No. 5. Report Date June 28, Performing Organization Code AHMCT 7. Author(s): Bahram Ravani, Chao Wang, Dexter Ma, Wilderich A. White, and Patricia Fyhrie 9. Performing Organization Name and Address AHMCT Research Center UCD Dept. of Mechanical & Aerospace Engineering Davis, California Sponsoring Agency Name and Address California Department of Transportation PO Box , MS #83 Sacramento, CA Supplementary Notes 8. Performing Organization Report No. UCD-ARR Work Unit No. (TRAIS) 11. Contract or Grant 65A0275, Task ID Type of Report and Period Covered Final Report June 2010 June Sponsoring Agency Code Caltrans 16. Abstract. This study involved an evaluation of the effectiveness of the California Highway Patrol (CHP) combination Radar Detection/Changeable Message Sign (CMS) (CHP-CMS) trailers to manage traffic speeds in highway work zones. The CHP-CMS trailer is a radar-equipped CMS trailer unit outfitted with revolving or flashing lights similar to those used on CHP vehicles. The main objective of this study was to test the following hypothesis: does the CHP-CMS trailer unit provide an effective deterrent to speeding, thereby slowing traffic in the work zones? The results of this study validated this hypothesis with the understanding that the validation was based on limited (a total of three) field tests due to the limited scope and time duration of this study as well as availability of actual work zones for testing. Further testing is recommended in the future. The research developed a repeatable test methodology based on the use of easily deployable speed sensors distributed throughout the work zone. Additional sensors were also used for validation and collection of other pertinent data. Data was also collected on the combined utilization of the CHP-CMS trailer and a CHP vehicle as in MAZEEP (Maintenance Zone Enhanced Enforcement Program) and its effect on traffic speed reduction at work zones. The overall conclusion of this study is that the use of the CHP-CMS system does result in a deterrent to speeding vehicles near work zones and its use can therefore improve work zone safety. 17. Key Words Work Zone Safety, Changeable Message Sign, Highway Safety, Work Zone Signing, Speed Management, Speed Reduction 18. Distribution Statement No restrictions. This document is available to the public through the National Technical Information Service, Springfield, Virginia Security Classif. (of this report) Unclassified Form DOT F (8-72) (PF V2.1, 6/30/92) 20. Security Classif. (of this page) Unclassified Reproduction of completed page authorized 21. No. of Pages Price i
3 ABSTRACT This study involved an evaluation of the effectiveness of the California Highway Patrol (CHP) combination Radar Detection/Changeable Message Sign (CMS) (CHP-CMS) trailers to manage traffic speeds in highway work zones. The CHP-CMS trailer is a radar-equipped CMS trailer unit outfitted with revolving or flashing lights similar to those used on CHP vehicles. The main objective of this study was to test the following hypothesis: does the CHP-CMS trailer unit provide an effective deterrent to speeding, thereby slowing traffic in the work zones? The results of this study validated this hypothesis with the understanding that the validation was based on limited (a total of three) field tests due to the limited scope and time duration of this study as well as availability of actual work zones for testing. Further testing is recommended in the future. The research developed a repeatable test methodology based on the use of easily deployable speed sensors distributed throughout the work zone. Additional sensors were also used for validation and collection of other pertinent data. Data was also collected on the combined utilization of the CHP-CMS trailer and a CHP vehicle as in MAZEEP (Maintenance Zone Enhanced Enforcement Program) and its effect on traffic speed reduction at work zones. The overall conclusion of this study is that the use of the CHP-CMS system does result in a deterrent to speeding vehicles near work zones and its use can therefore improve work zone safety. ii
4 TABLE OF CONTENTS Abstract... ii Table of Contents... iii Disclaimer/Disclosure... iv List of Figures... v List of Tables... vi List of Acronyms and Abbreviations... vii Acknowledgments... viii Executive Summary... ix Background... ix Conclusions, Limitations and Recommendations... x Conclusions... x Limitations and Recommendations... xi 1. Introduction The CHP-CMS Unit Test Plan Development icone Evaluation Accuracy of Speed Measurement Accuracy of Traffic Volume Measurement Sensitivity to Orientation and Placement RTMS Evaluation Traffic Volume Test for RTMS CMS Test Methodology and Set Up Field Testing of CHP-CMS Test Results and Conclusions References Appendix A icone System Appendix B Remote Traffic Microwave Sensor (RTMS) Appendix C icone Placement Shown with Aerial View of Highway Section Appendix D Pictorial Walk Through of the Test Work Zone (Apr 15, 2011) iii
5 DISCLAIMER/DISCLOSURE The research reported herein was performed as part of the Advanced Highway Maintenance and Construction Technology (AHMCT) Research Center, within the Department of Mechanical and Aerospace Engineering at the University of California Davis, and the Division of Research and Innovation at the California Department of Transportation. It is evolutionary and voluntary. It is a cooperative venture of local, State and Federal governments and universities. This document is disseminated in the interest of information exchange. The contents do not necessarily reflect the official views or policies of the AHMCT Research Center, the University of California, the State of California, or the Federal Highway Administration. This document does not constitute a standard, specification, regulation, or imply endorsement of the conclusions or recommendations. The contents of this report only reflect the conclusions arrived by the authors from the data collected at the time of the writing of this report subject to its limitations and the time requirements for the completion of the work. iv
6 LIST OF FIGURES Figure 1: Summary of alternatives to the use of police enforcement (from data in [3], page 8)... 2 Figure 2: The CHP-CMS Trailer... 3 Figure 3: CHP-CMS Trailer Showing Blue and Amber Lights... 4 Figure 4: icone placements in speed accuracy test (not drawn to scale)... 6 Figure 5: Aiming icones Figure 6: icone placement for orientation test... 9 Figure 7: icone placement for position test Figure 8: RTMS Mast for Rapid Deployment (View Looking South, Nov 12, 2010) Figure 9: Proposed Sensor Layout for Work Zone Testing Figure 10: Proposed Sensor Layout for Work Zones on the Left Side of a Highway Figure 11: View Looking Down At the Test Work Zone of April 15, Figure 12: Pictorial Walk Through of the Test Work Zone on April 15, Figure 13: icone data from March 22, 2011 test Figure 14: icone Data from Test 1 (Morning Hours) on April 15, Figure 15: icone Data from Test 2 (Afternoon Hours) on April 15, Figure 16: RTMS Data: Headway Data from All the Three Tests Figure 17: RTMS Data: Percentage of Vehicles Remaining in Closing Lane at the Beginning of Taper from All Three Tests v
7 LIST OF TABLES Table 1: Average Traffic Speed Measured by icone vs Average Traffic Speeds Calculated from LIDAR Measurements... 7 Table 2: icone Counting vs Manual Counting... 8 Table 3: Measured Mean Speed with icones at Different Offset Angle vi
8 LIST OF ACRONYMS AND ABBREVIATIONS Acronym AHMCT Caltrans CHP CMS CHP-CMS COZEEP DRI LED LIDAR LLC MAZEEP MPH MUTCD NCHRP No. OEM RTMS vs Definition Advanced Highway Maintenance and Construction Technology Research Center California Department of Transportation California Highway Patrol Changeable Message Sign California Highway Patrol Changeable Message Sign Construction Zone Enhanced Enforcement Program Caltrans Division of Research and Innovation Light Emitting Diode Light Detection and Ranging Limited Liability Corporation Maintenance Zone Enhanced Enforcement Program Miles per Hour Manual on Uniform Traffic Control Devices National Cooperative Highway Research Program Number Original Equipment Manufacturer Remote Traffic Microwave Sensor versus vii
9 ACKNOWLEDGMENTS The authors thank the California Department of Transportation (Caltrans) for their support, in particular Randy Woolley, Hassan Ghotb, and Homar Noroozi from the Division of Research and Innovation. The authors also thank CHP (California Highway Patrol) in particular John Keller and Mary Uhazi as well as all the members of the Technical Advisory Group for this study. viii
10 EXECUTIVE SUMMARY Background Cars and trucks have been observed to exceed the posted speed limits in construction and maintenance work zones, increasing risk of injury and death to workers and the traveling public as well as property damage to vehicles, equipment and the highway infrastructure. In order to influence driver behavior in reducing traffic speeds and therefore improving safety in highway work zones, the California Department of Transportation (Caltrans) uses COZEEP (Construction Zone Enhanced Enforcement Program) and MAZEEP (MAintenance Zone Enhanced Enforcement Program) which involve employing the California Highway Patrol (CHP) at some work zones to influence the traveling public to observe the speed limits. This study was aimed at developing a test methodology and field testing of a special Changeable Message Sign (CMS) and its effect in speed reduction in highway work zones. The CMS evaluated is a trailer based system that is acquired by CHP and is equipped with radar for speed measurement. It has a changeable message sign for display of messages to the drivers and revolving or flashing lights similar to those that are used in CHP vehicles for prompting or emulating police presence. The units also have a siren system onboard, but at the direction of CHP, the siren was neither activated nor tested during this research. Two types of radar traffic sensing systems were evaluated and tested as part of this study and were incorporated into the test methodology. One was the icone system developed and marketed by icone Products LLC and the other was the Remote Traffic Microwave Sensor (RTMS), developed and marketed by Image Sensing System of Canada. Data from field testing performed in this study indicated that the icone system was more accurate in estimating the average speed of traffic while the RTMS system provided data on per-lane vehicle count and vehicle headway information. The icone system is installed by its equipment manufacturer into a traffic barrel and can therefore be directly used in a work zone. The RTMS system, however, required design of an additional structure for its field utilization that allowed elevating the system at least 17 feet above the roadway surface on the side of the roadway. Field testing was performed to determine the actual performance of the two sensing systems and gain experience in this field utilization prior to conducting field tests with the CMS. A test methodology based on these two sensing systems was then developed with the expectation that it could be modified based on logistics and the directions of the Maintenance Supervisor in charge of the maintenance function or the Residence Engineer in charge of the construction work zone. The basic layout consists of a set of icones for speed measurements and two RTMS systems for measurement of traffic counts. Two cameras were used to collect redundant information. A total of three field tests were performed, all at highway work zones where maintenance functions were being performed. All three tests were performed at the same location in the Stockton area - one in March 2011 and two on the same day in April 2011 (One in the morning hours and one in the afternoon hours). ix
11 Conclusions Conclusions, Limitations and Recommendations The significant findings from analyzing the data from these three tests are summarized below: (It should be noted that speeds are rounded to 0.5 MPH) 1. The lane closure alone without the CMS trailer resulted in a reduction of average traffic speed by approximately 5 to 5.5 MPH. 2. The use of the CHP-CMS trailer by itself resulted in approximately 3 to 7 MPH further reduction of the average traffic speed in the work zone beyond what was observed with the closure alone. 3. Use of a CHP officer in a police vehicle in addition to the CHP-CMS trailer resulted in approximately 5 to 9 MPH further reduction of the average traffic speed in the work zone beyond what was observed with the closure alone. 4. Use of the CHP-CMS trailer by itself reduced car density (number of cars) in the lane being closed at the beginning of taper (location of the Arrow Board) by 0.7 to 2.4 percentage points. 5. Use of a CHP officer in a police vehicle in combination with the CHP-CMS trailer resulted in a further reduction between 0 to 6.3 percentage points in car density in the lane being closed at the arrow board location. 6. Data indicates a trade-off between speed reduction and headway (time between vehicles) in the lane adjacent to the lane being closed. Data from other lanes did not provide for a consistent conclusion. The main result is that the use of the CHP-CMS as configured in this study in combination with a CHP officer unit provides for traffic speed reductions in work zones. In the absence of a CHP officer unit, the CHP-CMS trailer alone still improves the safety in terms of reducing traffic speeds, at least for short duration work zones. This indicates that both methods are effective in improving work zone safety. It should be pointed out however that the testing performed in this study was only done in short duration work zones. Since repeated exposure to the CHP-CMS can allow drivers to become aware of the fact that the system is not used for speed enforcement and is only advisory may reduce its effectiveness due to this memory effect. Such memory effects were not evaluated in this study. x
12 Limitations and Recommendations 1. The results obtained are based on very limited data and does not represent a statistically representative sample. They should, therefore, be used cautiously. 2. The testing was only performed in Maintenance Work Zones which are typically of short duration. More data that can extrapolate the results to long duration construction work zones would be desirable. 3. Testing was only performed in relatively low traffic density metropolitan areas. Additional testing in high traffic density metropolitan areas as well as in rural areas is recommended to supplement the test data provided here. 4. Long term driver response to the non-enforcement nature of the CHP-CMS was not tested. The results presented are more applicable to short time duration work zones. xi
13 1. INTRODUCTION Safety of highway construction and maintenance workers has been a long established concern due to the hazardous working environment in close proximity to fast moving traffic. Traditionally, it is assumed that reduction in speed of traffic through the work zone improves traffic safety by providing drivers more time to react to hazardous situations and avoid collisions. Speed limits and warning signs are simple examples of traffic control devices used to control traffic speeds. In fact, the Manual on Uniform Traffic Control Devices (MUTCD) [1] defines a standard for using such traffic control devices. In an effort to further impact speed reduction in highway work zones as well as improve driver awareness of the work zone, the California Department of Transportation (Caltrans) in cooperation with the California Highway Patrol (CHP) has established the Construction Zone Enhanced Enforcement Program(COZEEP) and the Maintenance Zone Enhanced Enforcement Program (MAZEEP). The effectiveness of such law enforcement programs in work zones have been discussed in an NCHRP (National Cooperative Highway Research Program) report [2]. Although highly desired as an effective method of speed control, COZEEP/MAZEEP operation requires at least one uniformed CHP officer and vehicle to stay at the construction/maintenance work zone during the entire length of the operation, thus consuming a significant number of CHP officers. Therefore, only selected work zones are supplemented with the operation in order to maintain adequate CHP forces elsewhere in the area. The cost of COZEEP/MAZEEP to Caltrans is currently estimated at approximately $25 to $30 million for COZEEP and $8 million for MAZEEP on an annual basis. In times of budget restrictions, these costs can also possibly contribute to reduced deployment of such operations. The CHP has currently acquired combination Radar CMS (Changeable Message Sign) trailer units. These units are equipped with light emitting diode (LED) type display panels that can display advisory and warning messages and onboard Doppler Effect radar units that can measure the speed of on-coming traffic. Blue and amber flashing lights are also mounted on the bottom of the display panels. Since blue and amber are signature flashing lights of CHP; these lights, at a distance, can imply presence of CHP officers and can provide a deterrent to speeders. The entire system is mounted on a self-contained, solar powered trailer which also houses the computer that manages the displayed messages. The units also have a siren system onboard, but at the direction of CHP, the siren was neither activated nor tested during this research. The main objective of this study was to evaluate the effectiveness of these radar-equipped CMStrailer units in a stand-alone mode or in combination with one CHP vehicle for speed reduction in work zones in California. If proven effective, such CMS units can be a candidate to supplement COZEEP/MAZEEP operations in work zones without employing additional dedicated uniformed officers and patrol vehicles on site. This can allow CHP to better use its work force in helping with speed reduction in work zones as well as addressing other highway related law enforcement duties or impacting a larger number of work zones. Alternative methods of using police units on highways for speed reductions have been examined in the past. Many of the previous studies are discussed and summarized in a NCHRP report [2]. A plot of this summary in the form of a bar chart is depicted in Figure 1. 1
14 Speed Reduction (mph) Urba n Summary of Speed Reduction Range of Alternative Methods to Enforcement 0 Figure 1: Summary of alternatives to the use of police enforcement (from data in [3], page 8) It is clear from the data in this figure that use of CMS units with radar results in the largest speed reduction among the alternative enforcement methods considered. This suggests that the introduction of the CMS type device as a candidate to supplement COZEEP/MAZEEP operations in work zones can result in speed reduction without employing additional dedicated uniformed officer(s) and patrol vehicle(s) on site. Evaluating this and developing field experience in using a specific type of CMS unit that is presently used by CHP form the main part of this research. In terms of safety benefits of traffic control devices such as CMS units, prior studies have used a variety of different metrics for such evaluations. These metrics include mean speed [3][4][5][6][7][8][9][10], speed variance [6][9][10], 85 th percentile speed [6], percentage of vehicles above/below the speed limit [3][5], speed of high-speed vehicles [5][6] and lane distribution of traffic [4][7][10]. Jones and Lacey [11] also reported findings on the community wide effect of radar based enforcement as compared to LIDAR (Light Detection And Ranging) enforcement, both with police presence. The radar signal from the CHP-CMS units considered here can potentially have a similar effect of deterring vehicles from moving too fast as discussed in [11]. 2
.")
15 2. THE CHP-CMS UNIT The particular CMS unit used in this study consisted of a display panel approximately eight feet wide and four feet high with an active LED matrix capable of displaying several lines of message. The entire unit was mounted on a trailer that would allow it to be towed to any location on the highway (Figure 2). The entire system is mounted on a self-contained, solar powered trailer which also houses the computer that manages the message displayed. The CMS with radar is an OEM (Original Equipment Manufactured) and all modifications are performed by CHP. The CHP-CMS trailer can be programmed to display messages such as lane closure advisories and reduced work zone speed limits. An onboard Doppler Effect radar unit is used to determine the speed of oncoming traffic and triggers a warning message display if the measured speed exceeds a certain preset threshold value. The programmed messages can be displayed intermittently with the measured speed to remind the oncoming vehicle of its speed. Figure 2: The CHP-CMS Trailer This CMS unit is owned and operated by the CHP and it is equipped with a blue and amber flashing light (standard color light used on CHP vehicles) mounted on the bottom of the display panel. At distance, the flashing light mimics the presence of a CHP patrol vehicle (hence the name CHP-CMS) thus strengthens the CMS s figure of authority. In case of driver being distracted from road condition, the flashing light is intended to captures driver s attention due with its strong visual cue and improves alertness (Figure 3). 3

16 Figure 3: CHP-CMS Trailer Showing Blue and Amber Lights For the purpose of this study, the display for this CMS was configured to have the message board display the speed of the on-coming vehicle which was updated continuously at approximately one second intervals. The radar unit would sense the speeds of vehicles about 200 feet ahead of the trailer. If no vehicle is being tracked, the speed value would go blank. During the tests, the traffic flow was fairly continuous and a speed value was always displayed. Since vehicles were usually passing as a pack moving at the same speed, the value did not typically change more than 1-2 mph every few seconds. When a faster vehicle passed, the value would jump to the higher speed value and maintain that value for the 2-3 seconds while the vehicle was in the radar s field of view. The system was also configured to trigger its flashing lights any time a vehicle was traveling more than the threshold value over the speed limit. The message SLOW DOWN was displayed briefly following the usual speed display. The units also have a siren system onboard, but at the direction of CHP, the siren was neither activated nor tested during this research. 4
17 3. TEST PLAN DEVELOPMENT An important aspect of this research was to develop a test methodology for measuring average traffic speed and vehicle density in a highway work zone. The objective was to develop a methodology that can be easily deployed in short duration highway maintenance operations without adversely influencing driver behavior due to the speed measuring equipment and personnel. Use of speed monitoring devices that would clearly prompt drivers to potential enforcement was therefore not considered. Furthermore, it was desired to monitor speeds at several places along the work zone closure to develop a better understanding of the driver behavior and response to the closure and the CMS displays. All sensors considered also had to satisfy Caltrans requirements as devices that can be placed in a work zone. Two types of traffic sensors were evaluated and used in this research. Both types of sensors were selected due to their non-intrusive data collection nature, ease of deployment, and automated operation. Both types of sensors use radar based technology; however, each uses a different principal of operation. These two sensors are the icone system developed and marketed by icone Products LLC [12] and the Remote Traffic Microwave Sensor (RTMS), developed and marketed by Image Sensing System of Canada [13]. Before actual use in work zones for evaluation of the CHP-CMS effectiveness in speed reduction, the limitations and performance of these two sensors were investigated through experimentation on a local roadway. On the road experiments were conducted to make sure that all important parameters influencing field utilization of these sensors are well understood so that the desired quantities can be accurately measured. The overall descriptions of these two sensing systems are given in Appendix A for the icone and Appendix B for the RTMS system. The experimental evaluations of these two sensing systems are provided in this section before presenting the overall test plan for speed and traffic density measurements at work zones. A side benefit of developing this test methodology in this project was that it could be and was easily adapted for several other work zone safety research projects being conducted at AHMCT icone Evaluation Three aspects of the icone system were tested in a series of experiments: accuracy of speed measurement, accuracy of traffic volume measurement and sensitivity to placement. Accuracy of speed measurement was tested against speed measurement obtained from a handheld LIDAR device, while accuracy of traffic volume measurement was compared to a manual traffic count. The test for sensitivity to placement was split into two parts: sensitivity to orientation and sensitivity to position. Both orientation and position of the icone can affect the severity of the Cosine Effect (see Appendix A for description), which influences the measured speed. The test for orientation addresses concerns about the compromise in data integrity due to coarse aiming of the icone. The test for sensitivity to position addresses similar concerns in the event of nonuniform off-set distances of icones from live traffic lanes. 5
 street with a median approximately the width of one lane and a speed limit of 30 MPH.")
18 Accuracy of Speed Measurement A set of tests were conducted on a north-south segment of La Rue Road near UC Davis on November 12, This road is a two-way, four-lane (two lanes in each direction) street with a median approximately the width of one lane and a speed limit of 30 MPH. Three icones and one LIDAR unit (with an operator) were placed as shown in Figure 4. Figure 4: icone placements in speed accuracy test (not drawn to scale) (Map data 2013 Google) icone 429 was positioned downstream of the measurement location and aimed upstream at the northbound traffic. The icone s specification indicates a detection range of approximately 150 to 200 feet from the icone s location. Therefore, the LIDAR operator was positioned between the icone and measurement location, approximately 130 feet upstream of icone 429. At this location there was a tree that was used to help the operator stay out of sight of the driver s view for as long as possible. In this set up, the LIDAR operator tracked vehicles and obtained a speed reading for vehicles approximately between 20 to 70 feet upstream of his/her location, which would be the segment of roadway where the icone is likely to obtain a speed reading. Only northbound traffic was recorded with the LIDAR gun. In order to determine whether icone measurements are biased towards the lane adjacent to their placements, icones 431 and 433 were placed approximately across from each other, both aiming north, covering approximately five 6


19 lanes (four lanes of traffic and a median). Since average traffic speeds are expected to be different between the north and the southbound lanes, a comparative evaluation of the readings of these two icones can provide an indication of any measurement bias towards the lane adjacent to their placements. In aiming the icones, each icone arrow was initially placed parallel to the road and then the icone was rotated slightly towards the roadway. Figure 5 shows the icone aiming process from the operator s point of view. Figure 5: Aiming icones. A total of three speed measurement tests were conducted. The resulting average speeds from icones and the LIDAR in these tests are summarized in Table 1. Sensor icone 429 icone 431 icone 433 LIDAR Trial Trial Trial Table 1: Average Traffic Speed Measured by icone vs Average Traffic Speeds Calculated from LIDAR Measurements This table clearly shows that the average speed measurements from icone 429 are closest to the data from LIDAR speed measurements. This is to be expected since icone 429 was the one closest to the location of the LIDAR. Furthermore, it is clear that all icone speeds are slightly below the speed data from the LIDAR measurements. The inevitable visibility of the LIDAR operator to the traveling public likely contributes to these lower speed values for icones, as cars travel from LIDAR operator to icones. The differences between the readings of icone 431 and icone 433 suggest that the icones cannot accurately measure speeds across five lanes. One potential reason for the difference can be due to shadowing effects - namely the cars in the closer lanes blocking the icone view of the cars in the farther lanes. This means that one can expect a 7
20 positive bias in the icone s speed measurement accuracy towards the lane most adjacent to the icone placement, especially when cars are traveling in groups across multiple lanes Accuracy of Traffic Volume Measurement Data collected in the tests described earlier was also used to evaluate the accuracy of using icones to determine traffic volume. In each of the three tests described earlier, manual counting of vehicles was also performed and compared. The manual counting was performed for duration of 10 minutes for the first and second tests, and 20 minutes for the third test. The icone traffic volume measurement is based on the number of speed readings recorded.the manual and icone traffic counts are compared in Table 2. Test No icone icone ID Counts (No. of cars) Hand Counts (No. of cars) Table 2: icone Counting vs Manual Counting The test results indicate that the icones used in this manner do not provide accurate measurement of traffic volume. One reason for this may be the fact that the radar inside an icone shuts down for approximately 2.25 seconds between measurements to prevent the icone from making duplicate measurements of the same car. The 2.25 second time interval is chosen such that a vehicle traveling at 65 MPH would clear the icone s detection range within that time frame. In addition, it was observed that vehicles often travel in groups, which further contributed to the problem of missed counts during the radar down time Sensitivity to Orientation and Placement As do all Doppler Effect based radar devices, the icone system suffers from the Cosine Effect (see Appendix A). The Cosine Effect is basically the artificial decrease in measured speed between the observer and the target vehicle when the angle between the observer s line of sight and the target vehicle direction of travel increases from 0 to 90 degrees. In the case of icone deployment, two variables were identified as the cause of the cosine effect: orientation and position of the icone. Orientation is defined by the angular offset of the icone s aim from a line 8

21 parallel to the roadway. Position is defined by the lateral offset distance between the icone s location and the center of the lane where traffic speed is being measured. Due to the aforementioned difficulty in aiming each icone precisely, there are variations in the orientation during deployment of multiple icones.,in work zone testing, icones are typically only allowed to be placed on the shoulder of the roadway. The off-set distance to the nearest live traffic lane (position) may vary depending on the number of lanes between the shoulder and the lane in which speed measurements are being made. Two test scenarios were developed to investigate how each of these two variables (orientation and position) affected the speed measurements from the icones. These tests were performed on December 6, 2010 on Hutchison Road (two way, two-lane road with one lane in each direction) near UC Davis. In the orientation test, three icones were placed the same distance from the lane center, as shown in.figure 6. In this test, icones 433 was placed with an orientation of 0, parallel to the road. icone 431 was oriented at 20 towards the road and icone 429 at 40 towards the road. All icones had the same offset of 16 feet from the center of the nearest lane. The offset of 16 feet was selected to represent placement of the icones outside a 10 foot shoulder. The target of speed measurements was assumed to be at the center of the nearest lane (6 feet for half of the width of the target lane and 10 feet for the width of the shoulder). N icone433 icone431 icone ft From Lane Center Figure 6: icone placement for orientation test (Map data 2013 Google) In the position test, the configuration of the icones is shown in Figure 7. The icones 433, 431 and 429 were placed, respectively, with offsets of 16 feet, 28 feet and 28 feet from the center of the target lane. The 28 feet distance was selected to represent one additional lane of offset. The orientations were set by first aiming all three icones parallel to the roadway. In the attempt to target vehicle speed measurements at approximately the same location on the roadway, the outer two icones were rotated by 5 towards the road. The orientations were as follows: icone 433 at 0 (parallel to the road), icone 431 at 5, and icone 429 also at 5. It was hypothesized that if the icones didn t suffer from a severe cosine effect, then the reported speed readings from icones 429 and 431 should agree with readings of icone 433, since they are 9

22 all measuring traffic in the same lane. The results from this test can also indicate whether icones could be used to report speeds not only in the lanes adjacent to their placement, but also in the next lane over. 12ft 16 ft From Lane Center 0 icone433 5 icone429 5 icone431 Figure 7: icone placement for position test (Map data 2013 Google) Speed data was collected using all three icones positioned as described. The test data results are summarized in Table 3. The data in this table does not show any significant differences in the speeds measured, which indicates that icone speed measurements are not sensitive to their placement in terms of their offset position and orientation. This would make icones ideal for field usage when rapid deployment of the speed sensing system is needed. Sensor icone 429 icone 431 icone 433 Orientation Test Position Test Table 3: Measured Mean Speed with icones at Different Offset Angle Experience with the icones indicated that when deploying icones in the field, it is best to first point the icone parallel to the road and then rotate the barrel slightly towards the center of the road. In field tests the research team rotated the icones between 10 and 20 towards the roadway. Precision aiming is not required, and a clear view of the sky helps the icone s onboard GPS to obtain a location fix faster RTMS Evaluation The RTMS (Remote Traffic Microwave Sensor) G4 was chosen as another traffic measurement device based on its ability to measure individual vehicle speeds (as compared to average traffic speed measured by icones) and per-lane traffic volume. In addition, the RTMS output includes a timestamp for each vehicle detected which is valuable in calculating vehicle headways. Field 10
23 experience confirmed that calibration is required before it is used for accurate speed measurement. The required calibration time experienced in the field was approximately 30 to 45 minutes each time. This makes the system unsuitable for speed measurements when rapid deployment and set up is needed at the work zone. On the other hand, the RTMS offered accurate timestamps for each of the vehicle detection events without the need for in-the-field calibration. The difference between two consecutive timestamps is a good representation of the headway, which is defined in terms of the time lapse between the front bumpers of two consecutive vehicles passing the measurement location. It was therefore decided that the RTMS unit can be used for headway measurements in the rapid deployment environment of work zone testing. In addition, the video footage from the on-board camera of the RTMS can also be used to manually extract the traffic volume/count per lane. This video output is streamed to the laptop computer tethered to the RTMS unit in real time and stored on the laptop s local hard disk. This video is independent of any system calibration. The RTMS accuracy in measuring traffic volume per lane was then tested against manual counting Traffic Volume Test for RTMS In this test, the number of vehicles detected by the RTMS for each lane was used to calculate traffic volume/count and was tested against manual counting of traffic volume/count. The test was performed on November 12 th, 2010 at the same location as the icone test of that date. In order to test the RTMS, an easily deployable mast was designed to mount the RTMS unit at a height. The mast is shown in Figure 8. The mounting height of the RTMS as shown in this figure was 19 feet and during the test on November 12 th 2010, it was placed with an offset of 12 feet to the edge of the road. 11

24 Figure 8: RTMS Mast for Rapid Deployment (View Looking South, Nov 12, 2010) The offset distance of 12 feet was chosen to emulate the scenario where the RTMS is set up beyond the shoulder of the freeway in a work zone evaluation. During the test, manual counting of vehicles passing in the area measured by the RTMS was performed for all lanes of traffic. As shown in Figure 8, there were two northbound lanes and two southbound lanes with a median which was one lane wide. The RTMS unit was placed next to the northbound lanes. The test data was collected for a period of 20 minutes and showed 123 northbound vehicles and 174 southbound vehicles in manual counting versus 120 northbound and 151 southbound vehicles in RTMS counting. This data indicates that the RTMS unit missed the number of vehicles by 2.4% in the near side lanes and by 13.2% in the far side lanes. This can be due to the shadowing effects (See Appendix B). Observation of the RTMS display unit during the testing showed that the system was, sometimes, registering ghost vehicles outside the boundaries of the far side lanes. This effect was mitigated by manually adjusting the lane range assignments on the RTMS. The final conclusion from this test is that RTMS units can provide relatively accurate measurement of traffic volume/count for near side lanes. It is therefore recommended that RTMS units be used in the manner described here for obtaining traffic volume/count in work zone testing for near side lanes. Near side lanes are defined as lanes adjacent to the location of the RTMS mast. Experience in deploying the RTMS indicated that for field use it is best to first make sure that the unit is aimed perpendicular to the roadway for measurements in near side lanes. The web-cam onboard the RTMS unit can aid in aiming by adjusting the aim such that the image of the road is roughly parallel to the frame. The calibration process can determine lane configuration automatically, but will take some time in low traffic volume conditions. The automatically configured lanes aren t always perfect so some manual adjusting of lane width is recommended if the unit appears to miss or over count vehicles. In testing more than two lanes, the video 12
25 footage of the onboard camera on the RTMS is recommended to be used instead of the RTMS sensor to obtain data on vehicle count. This is needed to avoid potential loss in accuracy of vehicle count data. A similar arrangement is also recommended when testing roadways where there is potential for high truck traffic volume. However, obtaining the traffic count using the onboard video camera of the RTMS can be a time consuming task and should only be considered as a back-up method if shadowing is significant CMS Test Methodology and Set Up The results from testing of the two types of sensor systems designated for this project provide the necessary data for their best utilization in CHP-CMS evaluations at work zones. The field testing of the two sensor systems namely the icone and the RTMS unit, indicated that: Accuracy of average speed data from the icone is acceptable within reasonable variations. icone data is not very sensitive to position and orientation (Cosine Effect). icones do not provide accurate data on traffic volume/count. RTMS units have good vehicle counting ability when there s no shadowing. The footage from the onboard camera of RTMS provides accurate data for traffic volume/count under the condition when there s shadowing. In-the-field RTMS calibration can be time consuming and plays a key role in accuracy of speed measurements The RTMS does not provide true per-vehicle speed, but estimates speeds using a proprietary algorithm. The RTMS provides accurate timestamps for each vehicle detected that can be used for accurate estimation of headway. Based on the above conclusions, it is clear that the icones provide a repeatable method of measuring average speed variations and reductions in a highway work zone and are suitable for rapid field set up. Furthermore, these conclusions indicate that when the RTMS units are considered for rapid field deployment, they are best suited for headway calculations and the footage from their onboard cameras can be used for off-line calculation of traffic volume/count. We therefore used a set of icones along the work zone area for average traffic speed measurements. RTMS units provided headway determination for up to two lanes adjacent to the sensor location, and the footage from the RTMS onboard camera provided traffic volume/count determination. In evaluating the effectiveness of the CHP-CMS, it was important to measure average traffic speeds at several areas of the work zone. This was important to properly assess driver behavior and response to the presence of the CHP-CMS. There were a total of six icones and two RTMS units available for this project. A test layout was developed distributing these sensor units as shown in Figure 9. In this figure, the zero reference point is at the beginning of taper. One set of sensing units consisting of one icone and one RTMS system was placed upstream of any signage 13
26 to obtain base-line values for average traffic speed, volume and headway. Discussions with Caltrans field personnel indicated that an approximate distance of two miles upstream of the beginning of taper is the proper location for these first set of sensing units. The next two icones were distributed in-between the first work zone sign (stating: Road Work Ahead ) and the beginning of taper. Data from these two icones can provide information on speed changes due to the advisory signage for the work zone. The next set of icone/rtms pair was positioned at the beginning of taper to measure the number of vehicles remaining in the closing lane. This was also near the location of the CMS sign as recommended by Caltrans field personnel for the first test on March 22 nd, The fifth icone was then positioned at the end of taper which was upstream of where highway workers would be present. This was also the area that the reduction in lane(s) was completed in the work zone. The sixth and last icone was positioned somewhere in the active work area of the work zone preferably approximately in the middle of this area to provide data on the final average traffic speed in the area closest to the highway workers. In the test performed, the work zone was along the fast lane of the highway (left side). The mirror image of this layout as shown in Figure 10 is used. icone #1 icone #2 icone #3-2 mi -1 mi (-5140') -0.5 mi (-2500') -0.2 mi (-1000') 0 mi icone #4 icone #5 icone #6 Beginning of Taper End of Taper Active Work Area -100 ft Active Work Area CMS RT MS RTMS #1 RT MS RTMS #2 CMS Figure 9: Proposed Sensor Layout for Work Zone Testing. 14
27 0 mi RTMS #1-2 mi -100 ft CMS CMS Jersey Barrier/Wall RT MS RT MS Figure 10: Proposed Sensor Layout for Work Zones on the Left Side of a Highway. The sensor layout discussed served as a baseline configuration for field testing. The layout was adjusted to its final configuration based on logistics at a specific work zone and the requirements set forth by the Caltrans personnel in charge of a work zone. 15
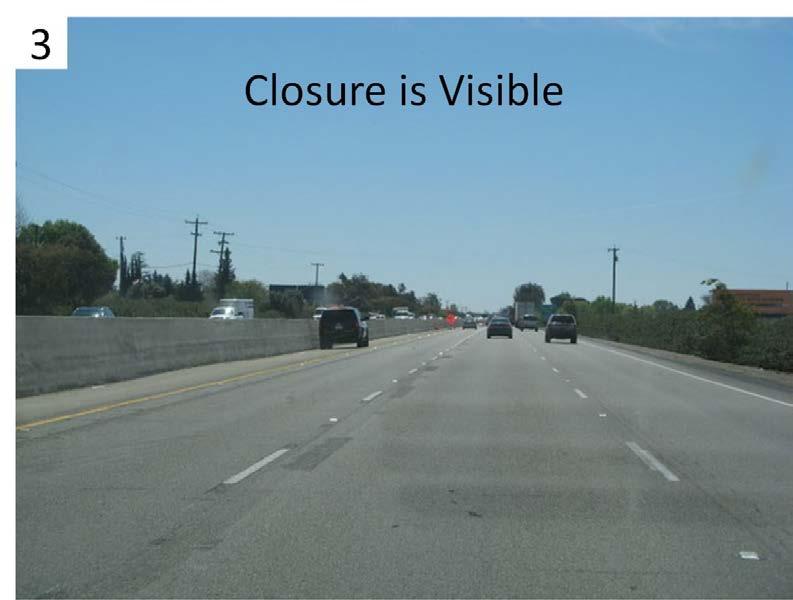
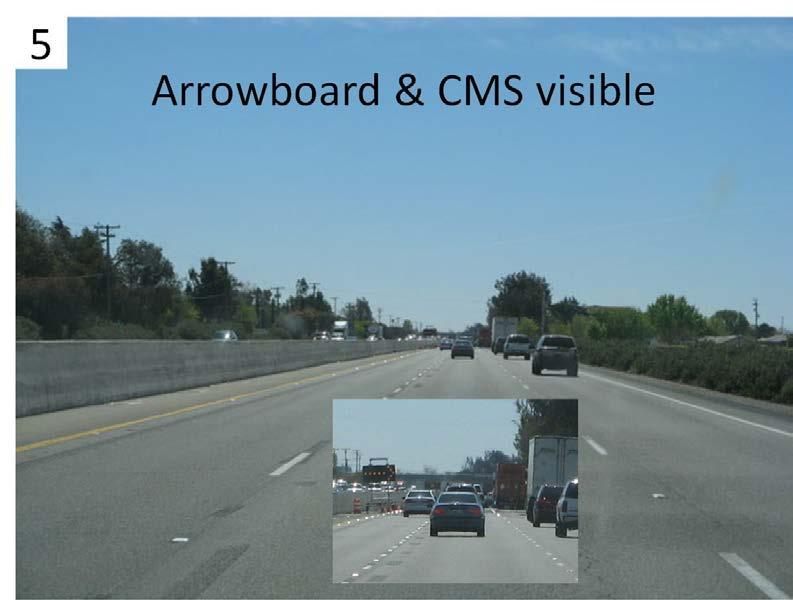
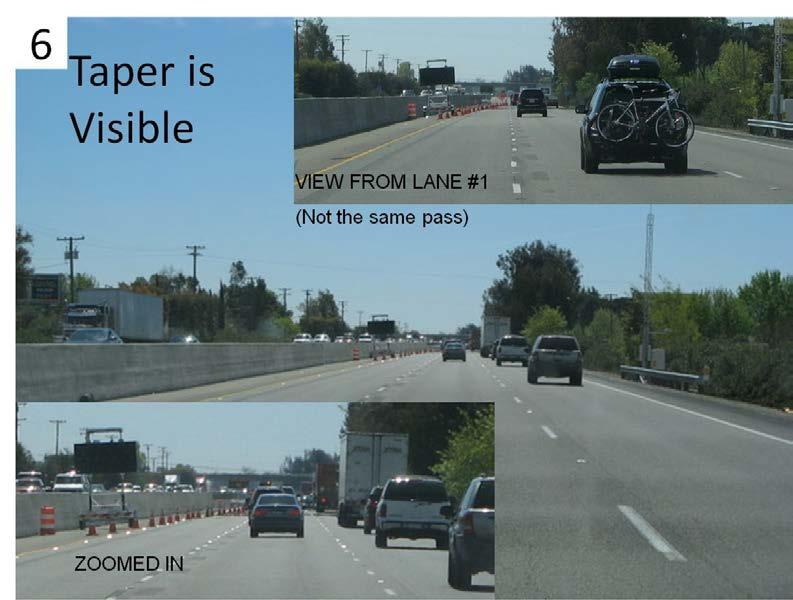
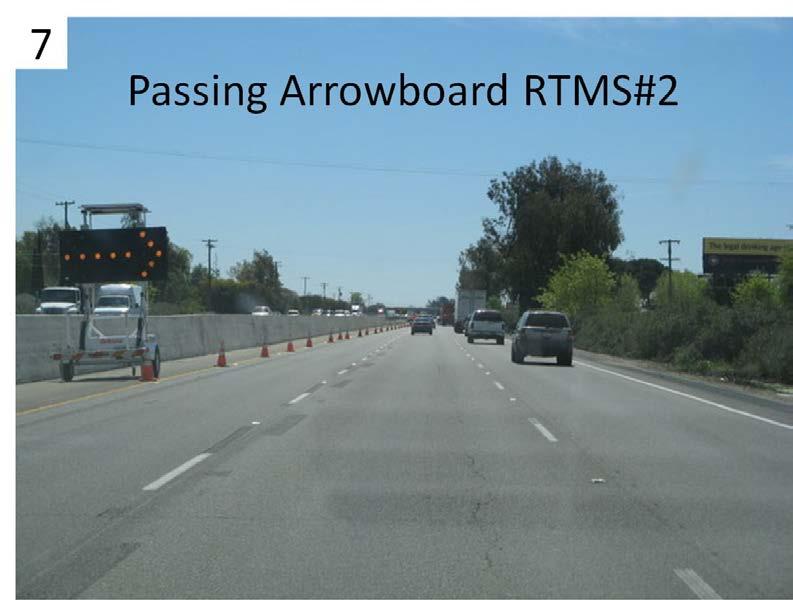
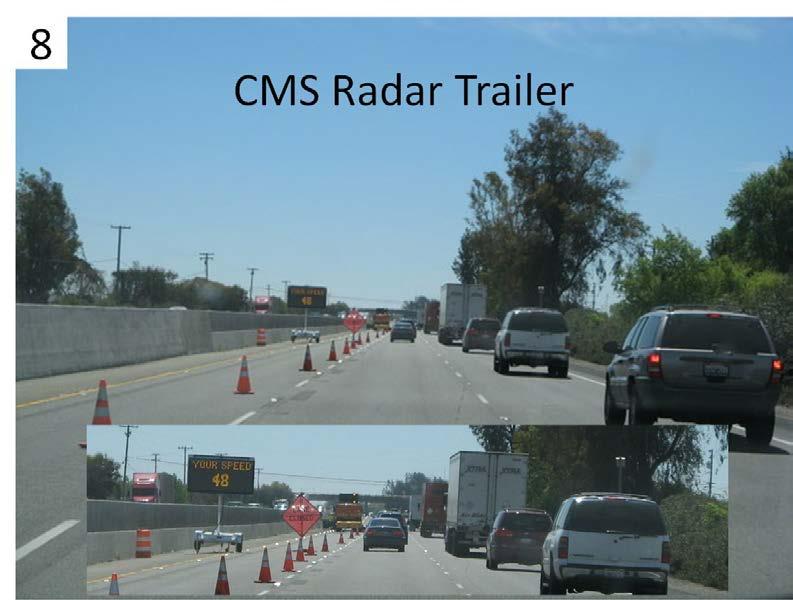
28 4. FIELD TESTING OF CHP-CMS In this research a total of three field tests were performed, all in maintenance work zones at approximately the same location on southbound highway 99 in Stockton, California. One test was performed on March 22 nd 2011, and two tests (one in the morning hours and one in the afternoon hours) were performed on April 15 th, In these tests, the messages as shown in Figure 2 and Figure 3 were programmed to display on the CHP-CMS unit and their effect on driver behavior in terms of speeds, headways, and traffic volume per lane was then evaluated. As previously discussed, the radar speed reading in MPH was updated continuously at approximately a one second interval. The radar unit would sense the speeds of vehicles about 200 feet ahead of the CHP-CMS trailer unit. If no vehicle was being tracked the speed value would go blank. During the tests, the traffic flow was fairly continuous and a speed value was always displayed. Since vehicles were usually passing as a pack moving at the same speed, the value did not typically change more than 1-2 MPH every few seconds. When a faster vehicle passed, the value would jump to the higher speed value and hold that value for the 2-3 seconds while the vehicle was in the radar s field of view. Three different combinations of using the CHP-CMS and a CHP unit were tested in each of the three tests, as follows: a. No CHP. b. CHP-CMS trailer without CHP vehicle presence. c. CHP-CMS trailer with CHP vehicle upstream of the CHP-CMS unit d. CHP-CMS trailer with CHP vehicle downstream of the CHP-CMS Unit. The work zone for the two April 15 th, 2011 tests is shown in Figure 11. The test on March 22 nd, 2011 was performed on the same highway upstream of the depicted location. A visual walk through of the April 15 th work zone as seen from the view of the driver is depicted in Figure

29 Figure 11: View Looking Down At the Test Work Zone of April 15, During all three tests, the CHP-CMS display was observed to be functioning but there was no data to verify how often the blue/amber flashing lights came on. On the March 22 test, these lights were set to come on when there was a vehicle traveling more than 10 MPH over the highway speed limit of 65 MPH. On the April 15 test, the threshold was set to 5 MPH. Overall the icones functioned properly for all the three tests but one of the RTMS units (the one installed upstream) did not function in all of the tests. The data obtained from the icones and the one RTMS unit that was positioned downstream was sufficient to address all the issues that were being investigated in this research. The results and their analysis are given in the next section. 17

30 Figure 12: Pictorial Walk Through of the Test Work Zone on April 15,
31 5. TEST RESULTS AND CONCLUSIONS In this section, the test data from the six icones from the three tests is discussed followed by the data obtained from the downstream RTMS. Figure 13 provides a summary plot of the six icone speed measurements for testing of four different configurations on March 22 nd, The horizontal axis plots the icone location from the zero reference point in miles. The vertical axis is the average speed measured by the icones in MPH. The four configurations consist each of speed measurements with no CHP-CMS and no CHP vehicle (indicated in black), CHP-CMS unit in place (indicated in red), CHP-CMS unit and CHP vehicle upstream (indicated in blue triangle), and CHP-CMS unit and CHP vehicle downstream (indicated in blue square). AVERAGE SPEED - Mar End of Taper Standard Closure w/ CMS 50 w/ CMS, CHP Upstream w/ CMS, CHP Downstream Distance from Arrow Board (mile) Figure 13: icone data from March 22, 2011 test. In the April 15 th series of tests the CHP-CMS unit was positioned at the end of the taper rather than at the beginning due to lack of available shoulder space in the location of the taper. Plots in Figure 14 and Figure 15 represent average traffic speeds for the same configurations described for the March 22 nd test. The plots in these three figures in combination with aerial views of the highway section where the icones were placed are provided in Appendix C. Average Speed (mph) AVERAGE SPEED Test -1 Apr 15, End of Taper Average Speed (mph) Standard Closure 50 w/ CMS w/ CMS, CHP Upstream w/ CMS, CHP in Work Zone Distance from Arrow Board (mile) Figure 14: icone Data from Test 1 (Morning Hours) on April 15,
32 Average Speed (mph) AVERAGE SPEED Test -2 Apr 15, End of Taper 65 Average Speed (mph) Standard Closure 40 w/ CMS w/ CMS, CHP Upstream 35 w/ CMS, CHP in Work Zone Distance from Arrow Board (mile) Figure 15: icone Data from Test 2 (Afternoon Hours) on April 15, The data in these plots clearly show that the CHP-CMS unit is effective (at least in the three tests) in positively influencing the driver behavior resulting in a reduction in average traffic speed from the upstream highway speed of approximately 8.0 to 12.6 MPH at the end of taper (fifth icone or the second to last mark from the right in the plots). Furthermore, the same data indicates that the closure alone may be responsible for approximately 5.1 to 5.7 MPH of this reduction. The data also indicates that when there is a CHP vehicle upstream of CHP-CMS there is a local reduction of speed near the CHP vehicles but the speed at the end of taper is not significantly affected. The same local effect of the CHP vehicle in speed reduction was also observed in Test 2 of the April 15 th test. This is illustrated in Figure 15. During this test, an unusual level of traffic congestion was developed, therefore it was not clear how much of the reduction in speed shown in Figure 15 is from the local effect of the CHP vehicle and how much is from the intrinsic traffic congestion. The main conclusion is that the data clearly indicates that the CHP-CMS trailer can be an effective deterrent for reduction of average traffic speed in a work zone. It should be pointed out, however, that these tests only evaluated the short term effects of using the CHP-CMS unit. The results may not be applicable when drivers become familiar with the non-law-enforcement characteristics of the CHP-CMS unit when it is used in long duration work zones. Until such long term effects can be scientifically evaluated, the recommendation is that the CHP-CMS unit can be most effective in short duration work zones that are typical of some highway maintenance functions. The results from analysis of the RTMS data are discussed next. Since one RTMS unit malfunctioned during the three tests, data from only the unit at the beginning of taper is used in this analysis. The RTMS unit provides accurate timestamp data of each vehicle detected which is used here to calculate headway. Furthermore, the video footage from the RTMS onboard camera was used to calculate traffic count/volume per lane. The percentages of vehicles traveling with headway less than 1 and 2 seconds were calculated from the headway data obtained from the timestamps. The thresholds of 1 and 2 seconds were chosen to represent non ideal and minimally ideal headways, respectively. The data from all three tests is summarized in Figure 16. The percentage data is grouped by sessions of tests where each configuration tested within a session is color coded. The configuration involving the standard lane closure is shown in black. The standard lane closure with the addition of the CHP-CMS unit is shown in red. The CHP-CMS unit with the CHP vehicle upstream of the CHP-CMS location is shown in blue

33 Finally the CHP-CMS unit with the CHP vehicle downstream of the CHP-CMS location is shown in purple. There are a total of four plots, two plots for the number two lane and two plots for the number three lane. Each of the two threshold values for headway is plotted per lane. Figure 16: RTMS Data: Headway Data from All the Three Tests A visual inspection of the data in the plots shows that the addition of the CHP-CMS unit to a standard lane closure produced no consistent effect on the percentage of vehicles with less than ideal and minimally ideal headways. A similar observation can be made for the addition of a CHP vehicle, both upstream and downstream of the CHP-CMS unit. A chi-square (χ 2 ) test using a 2 x 2 contingency table was conducted to determine the statistical significance of the differences between the standard closure and other conditions. A difference is considered significant if χ , indicting a probability level (p-value) of less than The significant differences are denoted with * in Figure 16. The CHP-CMS unit s effect on headway is inconclusive. The existence of significant increases in percentage points in some plots of the CHP-CMS with the CHP vehicle suggests that there may be a risk of causing drivers to follow each other too closely. The other aspect of the RTMS data is the per-lane traffic volume/counts. This data is obtained by manually counting all vehicles in the video footage produced by the onboard camera of the RTMS. The percentage of vehicles remaining in the closing lane (No. 1 lane) is then used as an indicator of late merging behavior. The percentage data is plotted in Figure
34 % of all vehicles Percentge of Vehicles Remaining in The Closing Lane 8.1% 6.2% 2.4%* 5.4% 9.2% 9.2% 8.5% 7.6% 6.8%* Figure 17: RTMS Data: Percentage of Vehicles Remaining in Closing Lane at the Beginning of Taper from All Three Tests The data suggests there are reductions in the percentage of vehicles remaining in the closing lane at the beginning of taper. The Chi-square analysis was also performed for this set of data. The presence of the CHP-CMS unit only resulted in significant reduction for one of the three tests (χ 2 = for Test 1 of April 15 th ). The presence of the CHP-CMS with the addition of the CHP vehicle upstream resulted in significant reduction in all three tests (χ 2 = , , , for March 22 nd, Test 1 of April 15 th and Test 2 of April 15 th, respectively). The presence CHP-CMS unit with the CHP vehicle downstream resulted in no significant reduction of late-merging vehicles. The reductions associated with the CHP vehicle located upstream are consistently significant. Combined with the headway result, it is worth noting that the early merging behavior promoted by the presence of the CHP vehicle upstream could potentially contribute to the decrease in headway in No.2 lane by increasing the spatial density of the traffic in that lane. While the deployment of the CHP-CMS unit and a CHP vehicle seems beneficial in terms of reduced average traffic speed and reduced late-merging, it is important to keep in mind the potential effect of shortened headway caused by these measures. The relative risks associated with the reduction in speed and the increases in percentage of vehicles with unsafe headway are unknown. 3.2%* 2.3%* Mar 22 Apr 15 (Test 1) Apr 15 (Test 2) Standard Closure CMS only CMS w/ CHP Upstream CMS w/ CHP Downstream 7.9% 22
35 REFERENCES [1] Caltrans Division of Traffic Operations, California Manual on Uniform Traffic Control Devices, [2] G. L. Ullman, S. D. Schrock, M. A. Brewer, P. Sankar, J. E. Bryden, M. Corkran and C. W. Hubbs, "Traffic Enforcement Strategies in Work Zones - Interim Report," Transportation Research Board, [3] M. D. Fontaine and P. J. Carlson, "Evaluation of Speed Displays and Rumble Strips at Rural Maintenance Work Zones," Transportation Research Record, vol. 1745, pp , [4] F. Hanscom, "Effectiveness of Changeable Message Signing at Freeway Construction Site Lane Closures," Transportation Research Record, vol. 844, pp , [5] P. T. McCoy, J. A. Bonneson and J. A. Kollbaum, "Speed Reduction Effects of Speed Monitoring Displays with Radar in Work Zones on Interstate Highways," Transportation Research Record, vol. 1509, pp , [6] N. J. Garber and S. T. Patel, "Control of vehicle speeds in temporary traffic control zones (work zones) using changeable message signs with radar," Transportation research record, vol. 1509, [7] J. G. Pigman and K. R. Agent, "Evaluation of I-75 Lane Closures," Transportation Research Record, vol. 1163, pp , [8] S. H. Richards, R. C. Wunderlich and C. L. Dudek, "Field Evaluations of Work Zone Speed Control Techniques," Transportation Research Record, vol. 1035, pp , [9] M. A. Brewer, G. Pesti and W. H. Schneider, "Identification and Testing of Measures to Improve Work Zone Speed Limit Compliance," Transportation Institute, College Station, TX, October [10] C. Wang, K. K. Dixon and D. Jared, "Evaluating Speed-Reduction Strategies for Highway Work Zones," Transportation Research Record, vol. 1824, pp , [11] R. K. Jones and J. H. Lacey, "The Effectiveness of Laser and Radar Based Enforcement Programs for Deterrence of Speeding," [12] icone Products, LLC, "About icone," [Online]. Available: [Accessed Dec 2012]. [13] Image Sensing Systems, Inc, "RTMS G4," [Online]. Available: [Accessed Dec 2012]. 23
36 APPENDIX A ICONE SYSTEM The outer shell of the icone (Figure A - 1) is a standard Manual on Traffic Control Device (MUTCD) traffic control barrel field device. The electronics inside the barrel transmits near real time average traffic speed information to a central web server on the Internet. Users can then view and download the information via a web browser. The product is comprised of a highway lane closure barrel as well as several internal components. These include: Intel process controller board running Microsoft Windows CE operating system. K-band ( GHz) radar detection transducer and controller board. GPRS modem and antenna. Iridium satellite modem and antenna. WAAS (Wide Area Augmentation System) GPS chip and antenna. AGM (Absorbed Glass Mat) dry 12 volt non venting battery. The icone contains a radar module, which includes a transducer and a controller to measure and record the speed of an approaching/receding object. It detects average speed information for multiple lanes of vehicular traffic within approximately 250 ft (76 m) of its position. It then transmits this information via either a cellular or satellite modem over the Internet to the manufacturer s server. Available information includes [12]: Location of the icones that are currently powered on. The current detected average speed, which can be viewed on a map using a web based GUI interface. Historical average speed for selectable time intervals. Location temperature Battery voltage status. The battery typically lasts 2 to 3 weeks on a full charge The radar makes use of the Doppler Effect to measure and record the speed of oncoming vehicles. Processed data (mean, standard deviation and 85th percentile speed) is then uploaded at the end of each recording interval (typically two minutes) and is immediately available for download and manipulation on a PC. Its high portability and non-intrusive, un-tethered operation make the icone system an ideal candidate for discreet traffic monitoring [12]. 24


37 Figure A - 1: Inside/Outside of an icone (Note the switch near the top and charging port on the base). The electronics are located towards the top of the barrel, whereas the battery is fixed to the base of the barrel. The overall appearance of the icone closely resembles that of a regular traffic control barrel, but there are a few subtle differences: there is a switch near the top of the barrel, a charging port on the base, and an arrow sticker on the top of the icone to aid in aiming during deployment. This non-threatening appearance minimizes its influence on the motorists, making the icone system an ideal candidate for recording traffic speed data inconspicuously. A device that catches a driver s attention may cause them to slow down, thus introducing bias in the data collected. User Interface (Software) The icone is generally managed through a web application which can be accessed on most standard web-browsers. The reader can access the web application at The home page (Figure A - 2) of the web site is viewable by the public and provides qualitative access to data that has been designated as public. The site is based upon the Google Maps API and is navigated in a similar manner. Selecting an icone icon brings up details of the icone s settings and the conditions of the traffic that is being monitored. Within there are buttons that allow the user to retrieve the historical speed record as either a plot (*.jpg) or a text file (*.csv) For example, icone 335 was chosen and its location is shown in Figure A - 3 below. 25

38 Figure A - 2: US map with icone locations 26
, etc., to view or download for post processing. The data can be exported to a text file (Figure A - 6) or plotted on an image (Figure A - 7), as shown below.")
39 Figure A - 3: icone 335 was chosen Upon clicking on Get Historical Report, a pop-up window presents the user a selection of items such as the desired time, the time interval (Figure A - 4), the smoothing interval (Figure A - 5), etc., to view or download for post processing. The data can be exported to a text file (Figure A - 6) or plotted on an image (Figure A - 7), as shown below. 27

40 Figure A - 4: Pop up window with time range selections 28


41 Figure A - 5: Pop up window with smoothing interval selections Figure A - 6: Sample *.csv file output opened with Microsoft Excel 29
42 The data includes the icone ID, the time, the average speed and the respective number of reads (vehicles), the standard deviation, the percent speed, and also provides data binning with 5 MPH bin-widths. Figure A - 7: Sample *.jpg plot output The Doppler Effect The physics principal behind the operation of icone is a phenomenon named the Doppler Effect, which is observed when the source and the observer of the same wave are in relative motion. If the source and the observer are moving towards each other, then the wave crest starts bunching up due to the relative motion, since less time is needed for each wave front to cover the distance between the source and the observer. The decrease in time between arrivals of wave crests causes an up-shift of the observed frequency. Conversely, if the source and the observer are moving away from each other, the observed frequency of the wave will appear to decrease. In the case of Doppler Effect radar, a beam consisting of a microwave band wave packet of known frequency is emitted from built in antenna and is directed towards the oncoming traffic. When the beam reaches a car, some of the incident energy is reflected back towards its source and the receiver in the radar unit detects this reflected signal. Due to the velocity of the vehicle (relative motion between radar and the vehicle, assuming the radar is stationary), the reflected beam will have an up-shift in frequency (approaching) or down-shift in frequency (receding). The beam goes through two Doppler Effect process, the first one being the signal traveling from the radar unit to the approaching vehicle and the frequency of the reflected signal is given by the vehicle is given by 30
43 f 1 = 1 + v c c f 0 (1) where v c is the velocity of the vehicle, c is the speed of light in vacuum and f 0 is the frequency of the emitted wave. Equation (1) used speed of light in vacuum as the wave velocity in the traveling medium because the wave emitted by the radar is an electromagnetic wave and travels in air approximately at the speed of light in vacuum. The second process is when the reflected signal reaches the receiver in the radar (observer). In this case the vehicle, which the signal is reflected back from, can be considered as the source emitting a wave with frequency f 1. The receiver in this case is stationary and the observed frequency is given by: f = v c 1 v f 1 = c c 1 v f 0 (2) c c c Once the reflected signal is received, it is combined with the source signal and a beat pattern is generated due to principle of superposition of waves. The frequency of the beat is the same as the difference between received and source frequencies, and can be related to v c via the following equation: f = f 0 f = 2v c f c + v 0 (3) c For highway speeds, v c c is generally and Equation (3) can be simplified and rearranged into v c = c 2 f f 0 (4) which calculates the vehicle speed, v c, as a function of known source frequency and measured beat frequency. Although it is difficult to gauge in precise measurements, the detection zone of the radarunit inside of an icone has a range of roughly 200ft ± 50 ft, and an horizontal beam width between 70 to 80 degrees. The Cosine Effect The radar unit inside the icone detects the relative speed between the observers and the observed based on the Doppler Effect. In the case of traffic monitoring, the line of sight of the radar doesn t always match the target vehicle s direction of travel, as depicted in Figure A - 8. This mismatch causes the measured relative speed between the observer and the target vehicle being different from the actual traveling speed of the vehicle. This phenomenon is called the Cosine Effect. The speed measured by the radar is merely a component of the vehicle s velocity parallel to radar s line of sight and is therefore less than the actual traveling speed of the vehicle. 31
44 Traveling Direction θ Actual Speed, Vt Line of Sight Direction Measured Speed, Vc RADAR Figure A - 8: Radar device on the shoulder, not in line with the car's traveling direction. The relative velocity between the vehicle and the radar was less than the vehicle's actual traveling speed. The relationship between the actual traveling speed and the measured speed can be determined from Figure A - 8 in the following equation: v t = v c cos(θ) where v t is the traveling speed, v c is the measured speed and θ is the angle between the line of sight and the direction of travel, referred to as the offset angle in the rest of the report. In most cases the angle is small such that v t v c with θ 0 is an adequate approximation of the traveling speed of the target vehicle. The opposite extreme case is when the radar s line of sight direction is perpendicular to the traveling direction, i.e. θ = 90. In this case the measured speed will be zero regardless of the traveling speed of the target vehicle. However, this situation assumes the ideal condition where the angular beam width of the radar is infinitely narrow. For practical purposes, it can be assumed that the beam width of the icone s radaris wide enough such that the Cosine Effect is negligible. The sensitivity of to the Cosine Effect is evaluated by placing multiple icones at different angles and comparing the measured speeds on the same section of a road. The evaluation result can be found in the main body of this report. 32
45 APPENDIX B REMOTE TRAFFIC MICROWAVE SENSOR (RTMS) Hardware Description In addition of the icone, the researchers also used the Remote Traffic Microwave Sensor (RTMS) to aid in collecting traffic data. The RTMS is developed and marketed by Image Sensing System, Canada. This device uses an onboard radar module which operates in the microwave spectrum as a traffic sensor. Unlike the icone, the RTMS is designed to operate in two configurations: forward-fire and side-fire modes. In forward-fire mode, the RTMS is mounted directly above the center of the monitored lane facing the approaching traffic. The radar unit measures speed of the oncoming vehicles via Doppler Effect. In the side-fire mode, the RTMS is mounted on the side of the pavement. It projects an elliptical strip of radar signature onto the road surface, and establishes a baseline map of the painted surface. The radar map of the road surface can be partitioned into lanes mimicking the lane layout of the physical roadway surface. This allows each individual measurement to be associated with their respective lanes, providing a more meaningful data set. When a vehicle passes the region painted by the radar, its reflection is received by the RTMS as a disturbance to the baseline map and the time of the disturbance is recorded. User Interface The RTMS unit requires a power source for operation and a computer for field set-up and data storage. Power was provided by a 12V deep cycle battery sized for sustained operation of 24 hours with the tethered computer. The projected durations of test sessions are typically less than 8 hours. The tethered computer runs the software supplied by the vendor for communication with the RTMS. During set-up, the RTMS module is manually adjusted with the help of an onboard web cam such that the road in the view runs parallel with the boarder of the camera s frame. Then the software runs a calibration wizard which guides the user through an automatic calibration routine. The intention of this calibration routine is to establish a baseline average speed to help estimating the speed of each passing vehicle. The routine depends on fairly heavy traffic flow to work well and takes a long time in light traffic conditions. During field set-up, the researchers have decided to forgo the calibration routine due to logistic reasons. Traffic count measurements are inspected visually by comparing the number of passing vehicles with the number of vehicles detected by the sensor for a period of time. The aim of the RTMS is adjusted until the vehicle detection events of the RTMS unit agrees with the visual observation of the passing traffic. As a result of not being able to complete the speed calibration routine, the speed measurement data from the RTMS is ignored and all speed data are obtained exclusively from the icone system. Another reason of not using the speed data is the fact that the RTMS does not directly measure the speed of each individual vehicle when operating in side-fire mode. Instead, a proprietary computational algorithm estimates the vehicle s speed and length using the recorded time of disturbance of the reflected radar signature. Due to its indirect method of estimating speed and vehicle length, its speed measurements are greatly smoothed and transient behaviors in data are lost. Without knowing the exact speed estimation algorithm used by the RTMS, the research team has decided to only use the vehicle count and headway data extracted from the 33
46 RTMS. Headway, in this study, is defined as the time elapsed between the front bumpers of two consecutive vehicles passing the same point on a roadway, and is calculated by taking the difference between the recorded time stamps of each vehicle detection event on the same lane. 34

47 APPENDIX C ICONE PLACEMENT SHOWN WITH AERIAL VIEW OF HIGHWAY SECTION MAR 22, Southbound E 8 Miles Rd, Test 1 Description: Friday 9 AM to 2 PM. CHP Upstream: Between icone 432 and icone 429 CHP Downstrea: 50 ft downstream of CMS LEGEND: - icone - Arrow board - Lane Closed - CHP Conditions: CMS 11:50 12:15 STANDARD CLOSURE 12:25 12:55 CMS 12:55 13:08 CMS AND CHP UPSTREAM 13:08 13:16 CMS AND CHP IN WORKZONE CHP Contact: CHP made no stop during MAZEEP AVERAGE SPEED - Mar End of Taper Standard Closure w/ CMS w/ CMS, CHP Upstream w/ CMS, CHP Downstream Distance from Arrow Board (mile) March 22, 2011 (Map data 2013 Google) 35

48 APR 15, Southbound E 8 Miles Rd, Test 1 Description: Friday 9 AM to 2 PM. CHP Upstream: Between road work ahead and icone 430 CHP Downstrea: At icone 428 Conditions: CMS 10:16 10:47 STANDARD CLOSURE 10:53 11:30 CMS 11:30 12:00 CMS AND CHP UPSTREAM 12:02 12:33 CMS AND CHP IN WORKZONE CHP Contact: CHP made no stop during MAZEEP LEGEND: - icone - Arrow board - Lane Closed - CHP Average Speed (mph) AVERAGE SPEED Test -1 Apr 15, End of Taper Average Speed (mph) Standard Closure 50 w/ CMS w/ CMS, CHP Upstream w/ CMS, CHP in Work Zone Distance from Arrow Board (mile) April 15, 2011 Test 1 (Map data 2013 Google) 36

49 APR 15, Southbound E 8 Miles Rd, Test 2 Description: Friday 9 AM to 2 PM. Speed decresases significantly during the CMS AND CHP IN WORKZONE test due to increased traffic and formation of a que at the taper. CHP Upstream: Between icone 430 and icone 431 CHP Downstrea: At icone 428 Conditions: CMS 10:16 10:47 STANDARD CLOSURE 12:33 12:46 CMS 12:46 13:01 CMS AND CHP UPSTREAM 13:03 13:15 CMS AND CHP IN WORKZONE CHP Contact: CHP made no stop during MAZEEP LEGEND: - icone - Arrow board - Lane Closed - CHP Average Speed (mph) AVERAGE SPEED Test -2 Apr 15, End of Taper 65 Average Speed (mph) Standard Closure 40 w/ CMS w/ CMS, CHP Upstream 35 w/ CMS, CHP in Work Zone Distance from Arrow Board (mile) April 15, 2011 Test 2 (Map data 2013 Google) 37


50 APPENDIX D PICTORIAL WALK THROUGH OF THE TEST WORK ZONE (APR 15, 2011) 38
51 39
52 40
53 41
Evaluation of A Dynamic Late Merge System PART I EVALUATION OF A DYNAMIC LATE MEREGE SYSTEM
 PART I EVALUATION OF A DYNAMIC LATE MEREGE SYSTEM 3 1. Overview of Dynamic Late Merge Systems 1.1 Core concept of Dynamic Late Merge control PCMS 1 PCMS 2 PCMS 3 PCMS 4 TAKE YOUR TURN USE BOTH LANES USE
GENERAL NOTES FOR WORK ZONE SAFETY SET UP GUIDE
 FORWARD It shall be the responsibility of the person in charge to institute the placing of all appropriate cautionary devices and controls as may be required for the particular job. Traffic protection
Concept of Operations
 Concept of Operations Monitoring Traffic in Work Zones: The icone System September 30, 2009 Prepared for: Minnesota Department of Transportation Prepared by: SRF Consulting Group, Inc. Project No. 6845
Portable Changeable Message signs have a wide variety of
 Part 6F (devices) Minnesota MUTCD 2005 with 2007 09 Revisions Part 6F (devices) Federal MUTCD 2009 Part 6F (devices) MN MUTCD Rearranged Sections 6F.55 Portable Changeable Message Signs Portable Changeable
4.0 Method of Measurement. Measurement for Optional Temporary Pavement Marking will be made to the nearest linear foot.
 4.0 Method of Measurement. Measurement for Optional Temporary Pavement Marking will be made to the nearest linear foot. 5.0 Basis of Payment. Payment for OPTIONAL TEMPORARY PAVEMENT MARKING as described
MICHIGAN DEPARTMENT OF TRANSPORTATION SPECIAL PROVISION FOR STOPPED TRAFFIC ADVISORY SYSTEM. OFS:CRB 1 of 8 APPR:JJG:LWB:
 MICHIGAN DEPARTMENT OF TRANSPORTATION SPECIAL PROVISION FOR STOPPED TRAFFIC ADVISORY SYSTEM OFS:CRB 1 of 8 APPR:JJG:LWB:10-30-13 a. Description. This work consists of providing, installing, operating,
NEW JERSEY TURNPIKE AUTHORITY
 NEW JERSEY TURNPIKE AUTHORITY GARDEN STATE PARKWAY NEW JERSEY TURNPIKE GUIDELINE FOR USE OF VMS SYSTEMS FOR CONSTRUCTION WITHIN WORK ZONES Revised March 2017 TABLE OF CONTENTS I. PURPOSE OF GUIDELINE...
Deployment and Evaluation of ITS Technology in Work Zones
 Deployment and Evaluation of ITS Technology in Work Zones Authors: Rob Bushman, P.Eng. University of Saskatchewan Saskatoon, Saskatchewan, Canada e-mail: rjb230@mail.usask.ca phone: (306) 653-6600 fax:
SECTION 616 TEMPORARY TRAFFIC CONTROL
 SECTION 616 TEMPORARY TRAFFIC CONTROL 616.1 Description. This work shall consist of furnishing, installing, operating, maintaining, cleaning, relocating and removing temporary traffic control devices and
Welcome!! Temporary Traffic Control During Maintenance and Short Duration Activities. Training Course 1-1
 Welcome!! Temporary Traffic Control During Maintenance and Short Duration Activities Training Course 1-1 About This Course This material is based upon work supported by the Federal Highway Administration
End of Queue Warning Systems. Systems Requirements
 End of Queue Warning Systems Systems Requirements December 2015, Revised 2/14/2018 Acknowledgements This document was prepared for Minnesota Department of Transportation s (MnDOT) Systems Engineering to
ITS Concept of Operations: End of Queue Warning System for Work Zone
 ITS Concept of Operations: End of Queue Warning System for Work Zone August 2015 Prepared for: The Minnesota Department of Transportation Acknowledgements This document was prepared for Minnesota Department
Monroe Fire Department
 Monroe Fire Department Standard Operating Guidelines Highway Safety Policy Purpose: This procedure identifies parking practices for Fire Department apparatus and vehicles that will provide maximum protection
Deployment and Evaluation of ITS Technology in Work Zones
 Deployment and Evaluation of ITS Technology in Work Zones Rob Bushman, P. Eng. Department of Civil Engineering University of Saskatchewan Saskatoon, SK, Canada Curtis Berthelot, Ph. D., P. Eng. Department
Field Guide on. Safe Maintenance and. Work Zone Operations
 Field Guide on Installation and Removal of Temporary Traffic Control for Safe Maintenance and Work Zone Operations August 2008 Introduction This field guide provides field personnel with introductory guidance
Mobile Work Zones. Traffic Control in Short Duration / Guidelines for M0WING ZONE AHEAD WORK ROAD SHOULDER WORK RIGHT LANE CLOSED AHEAD SIGNAL AHEAD
 M0WING ZONE ROAD WORK AHEAD SHOULDER WORK RIGHT LANE CLOSED AHEAD SIGNAL WORK AHEAD Guidelines for Traffic Control in Short Duration / Mobile Work Zones Guidelines for Traffic Control in Short Duration
Distracted Driving Detection System for Work Zones. Systems Requirements
 Distracted Driving Detection System for Work Zones Systems Requirements December 2015 Acknowledgements This document was prepared for the Minnesota Department of Transportation (MnDOT) Systems Engineering
Scarborough Fire Department Scarborough, Maine Standard Operating Procedures
 Scarborough Fire Department Scarborough, Maine Standard Operating Procedures Book: Emergency Operations Chapter: Alarm & Response Procedures Subject: 3020 - Safe Vehicle Positioning Revision Date: 7/31/2007;
Active Traffic Management in Michigan. Patrick Johnson, P.E. HNTB Michigan Inc.
 Active Traffic Management in Michigan Patrick Johnson, P.E. HNTB Michigan Inc. Active Traffic Management (ATM) Active Traffic Management Strategies: Dynamic Lane Use Dynamic Shoulder Use Queue Warning
Dynamic Early Merge and Dynamic Late Merge at Work Zone Lane Closure
 Dynamic Early Merge and Dynamic Late Merge at Work Zone Lane Closure Essam Radwan and Rami Harb Abstract. Several ITS-based countermeasures are currently being deployed in workzones to enhance both the
USDOT Connected Vehicle Research Program Vehicle-to-Vehicle Safety Application Research Plan
 DOT HS 811 373 October 2011 USDOT Connected Vehicle Research Program Vehicle-to-Vehicle Safety Application Research Plan DISCLAIMER This publication is distributed by the U.S. Department of Transportation,
Smarter Work Zones Webinar Series
 Smarter Work Zones Webinar Series Webinar #12: Integrating Technology Applications Massachusetts DOT Todd Peterson and Neil Boudreau April 26, 2016 1:00-2:30pm EST Efficiency through technology and collaboration
Automating Variable Speeds and Traveler Information with Real-Time Traffic and Weather
 Automating Variable Speeds and Traveler Information with Real-Time Traffic and Weather Joshua Crain, Jim Peters, P.E., PTOE, and Carl S. Olson ABSTRACT The Highway 217 freeway in Portland, Oregon was the
NCUTCD Proposal for Changes to the Manual on Uniform Traffic Control Devices
 1 2 3 4 5 6 7 8 9 10 11 12 13 14 15 16 17 18 19 20 21 22 23 24 25 26 27 28 29 30 31 32 33 34 35 TECHNICAL COMMITTEE: ITEM NUMBER: TOPIC: ORIGIN OF REQUEST: AFFECTED SECTIONS OF MUTCD: NCUTCD Proposal for
2.1 The Contractor shall furnish and maintain this system for measuring and delivering realtime messages for the work zone.
 Work Zone Intelligent Transportation System NJSP-15-32 1.0 General. The Work Zone Intelligent Transportation System (WZITS) shall be a portable, real-time, automated, solar powered system that calculates
APPENDIX B. Public Works and Development Engineering Services Division Guidelines for Traffic Impact Studies
 APPENDIX B Public Works and Development Engineering Services Division Guidelines for Traffic Impact Studies Revised December 7, 2010 via Resolution # 100991 Reformatted March 18, 2011 TABLE OF CONTENTS
Iowa Department of Transportation Intelligent Work Zone Deployments
 Iowa Department of Transportation Intelligent Work Zone Deployments SMARTER WORK ZONES TECHNOLOGY APPLICATIONS CASE STUDY The Every Day Counts Initiative (EDC-3) aims to accelerate the deployment of identified,
Mendocino Forest Products Grading For Industrial Land Improvements
 Mendocino Forest Products Grading For Industrial Land Improvements Technical Memorandum #10 CEQA Evaluation of Environmental Impacts Prepared for: Mendocino Forest Products Company, LLC Consulting Engineers
OKLAHOMA DEPARTMENT OF TRANSPORTATION SPECIAL PROVISIONS FOR SMART WORK ZONE SYSTEM PROJECT NUMBER, JP NO (04), COUNTY
, COUNTY") 882-2(a-j) 09 OKLAHOMA DEPARTMENT OF TRANSPORTATION SPECIAL PROVISIONS FOR SMART WORK ZONE SYSTEM NUMBER, JP NO. 00000(04), COUNTY This special provision amends and where in conflict, supersedes applicable
882-2(a-j) 09 OKLAHOMA DEPARTMENT OF TRANSPORTATION SPECIAL PROVISIONS FOR SMART WORK ZONE SYSTEM NUMBER, JP NO. 00000(04), COUNTY This special provision amends and where in conflict, supersedes applicable
NORTHWEST CORRIDOR PROJECT. NOISE TECHNICAL REPORT 2015 Addendum Phase IV
 Noise Technical Report 2015 Addendum NOISE TECHNICAL REPORT 2015 Addendum PREPARED FOR: Federal Highway Administration and Georgia Department of Transportation PREPARED BY: Parsons Brinckerhoff Project
Transportation Pooled Fund Study TPF-5 (231)
") ENTERPRISE Drafmu Transportation Pooled Fund Study TPF-5 (231) Real-Time Integration of Arrow Board Messages into Traveler Information Systems EVALUATION PLAN Prepared by September 2017 Acknowledgements
ENTERPRISE Drafmu Transportation Pooled Fund Study TPF-5 (231) Real-Time Integration of Arrow Board Messages into Traveler Information Systems EVALUATION PLAN Prepared by September 2017 Acknowledgements
KENTUCKY TRANSPORTATION CENTER
 Research Report KTC-10-16/FR181-10-1F KENTUCKY TRANSPORTATION CENTER KENNEDY INTERCHANGE CRASH STUDY OUR MISSION We provide services to the transportation community through research, technology transfer
Dynamic Lane Merge Systems
 Dynamic Lane Merge Systems Acknowledgements Maryland State Highway Administration University of Maryland, College Park Michigan Department of Transportation Wayne State University Lane Merging Issues Merging
CITY OF FORTUNA, CALIFORNIA
 CITY OF FORTUNA, CALIFORNIA Community Development Department Building and Safety Division 621 11 th street Fortuna, California 95540 Phone: 707-725-7600 - Fax: 707-725-7610 ACCESSIBLE PARKING REQUIREMENTS
Safe Practices for Traffic Incident Responders
 Session No. 653 Safe Practices for Traffic Incident Responders Introduction Kim Johnson, CSP, CFPS Traffic responders work in one of the most hazardous environments the highway. All too frequently, responders
TRAFFIC INCIDENT MANAGEMENT SYSTEM (TIMS)
") TRAFFIC INCIDENT MANAGEMENT SYSTEM (TIMS) GUIDELINES 1. Purpose A. Ensure that an Ohio Turnpike and Infrastructure Commission (OTIC) Guideline exists to manage traffic backups and travel delays. B. Ensure
TRAFFIC INCIDENT MANAGEMENT SYSTEM (TIMS) GUIDELINES 1. Purpose A. Ensure that an Ohio Turnpike and Infrastructure Commission (OTIC) Guideline exists to manage traffic backups and travel delays. B. Ensure
MODULE 10 Road Ranger Work Zones
 MODULE 10 Road Ranger Work Zones Module 10 1 Purpose of the Course To train personnel who may be required to assist motorists and emergency personnel within the highway right-of-way, as part of their Road
Traffic/Mobility Analytics
 Daniel P. Farley Section Chief Traffic Operations Deployment and Maintenance dfarley@pa.gov 717-783-0333 How PennDOT is using large vehicle probe and crowd source information to begin to better plan, design,
FINAL REPORT FHWA-WY-17/02F. Assessment and Evaluations of I-80 Truck Loads and Their Load Effects
 FINAL REPORT State of Wyoming Department of Transportation U.S. Department of Transportation Federal Highway Administration FHWA-WY-17/02F Assessment and Evaluations of I-80 Truck Loads and Their Load
Traffic Safety Measures Using Multiple Streams Real Time Data
 CAIT-UTC-055 Traffic Safety Measures Using Multiple Streams Real Time Data FINAL REPORT January 2017 Submitted by: Mohsen Jafari Professor of Industrial and Systems Engineering Center for Advanced Infrastructure
THE IMPACT OF HIGHWAY SAFETY FLARES ON DRIVER BEHAVIOR
 THE IMPACT OF HIGHWAY SAFETY FLARES ON DRIVER BEHAVIOR Philip M. Garvey Miguel de la Riva Martin T. Pietrucha (2003-2005 presented at TRB 2006) Introduction Crashes Involving Collisions with Parked/disabled
South Portland Fire Dept. Standard Operating Guideline. S.O.G. Number: Date: 6/11/2007 Pages: 7. Title: Fire Incident Traffic Control
 South Portland Fire Dept. Standard Operating Guideline S.O.G. Number: 325.1 Date: 6/11/2007 Pages: 7 Category: Highway Safety Title: Fire Incident Traffic Control Approved: Purpose: To establish guidelines
AN UPDATE OF A STUDY OF THE RELATIONSHIP BETWEEN DIGITAL BILLBOARDS AND TRAFFIC SAFETY IN CUYAHOGA COUNTY, OHIO
 AN UPDATE OF A STUDY OF THE RELATIONSHIP BETWEEN DIGITAL BILLBOARDS AND TRAFFIC SAFETY IN CUYAHOGA COUNTY, OHIO SUBMITTED TO THE FOUNDATION FOR OUTDOOR ADVERTISING RESEARCH AND EDUCATION (FOARE) 1850 M
EXECUTIVE SUMMARY. 1. Introduction
 EXECUTIVE SUMMARY 1. Introduction A safety review of the Highway 2:15 (Deerfoot Trail) corridor was commissioned by Alberta Transportation in conjunction with the City of Calgary (City). The review was
Peterborough County Road Safety Audit Guideline Pilot
 Peterborough County Pilot Table of Contents 1.0 Purpose... 3 2.0 Road Safety Audit Objectives... 3 3.0 Legal Issues... 3 4.0 Road Safety Audit Procedures... 4 4.1 Project Selection Criteria... 5 4.2 Scope...
CENTER STREET PARKING GARAGE Section
 Primary Components The proposal should be provided as a turnkey solution. The minimum components/features required include: Management system including software and servers. Include a UPS for each computer,
Welcome!! Traffic Control Supervisor. Training Course
 Welcome!! Traffic Control Supervisor Training Course Traffic Control Supervisor Training Course Two-day course Begins promptly at 8:00 AM Ends no later than 5:00 PM Flexible schedule!! 0-2 Course Objectives
Concept of Operations prepared for Minnesota Department of Transportation (MnDOT) for Rural Intersection Conflict Warning Systems II Deployment
 for Rural Intersection Conflict Warning Systems II Deployment") Concept of Operations prepared for Minnesota Department of (MnDOT) for Rural Intersection Conflict Warning Systems II Deployment December 22, 2014 Table of Contents 1. Introduction and Concept Overview...1
Concept of Operations prepared for Minnesota Department of (MnDOT) for Rural Intersection Conflict Warning Systems II Deployment December 22, 2014 Table of Contents 1. Introduction and Concept Overview...1
Research Article Evaluating Variable Speed Limits and Dynamic Lane Merging Systems in Work Zones: A Simulation Study
 International Scholarly Research Network ISRN Civil Engineering Volume 212, Article ID 435618, 9 pages doi:1.542/212/435618 Research Article Evaluating Variable Speed Limits and Dynamic Lane Merging Systems
Chapter 1.0 Introduction
 Chapter 1.0 Introduction 1.1 Background Interstate 81 runs from Danbridge, Tennessee to the US/Canada border, connecting the six states of Tennessee, Virginia, West Virginia, Maryland, Pennsylvania, and
Tracy Scriba, FHWA Work Zone Conference March 2009
 Crash Reduction Strategies for Work Zones Tracy Scriba, FHWA Work Zone Conference March 2009 Presentation Outline Work Zone Safety and Mobility Challenges Work Zone Crash Reduction Strategies ITS Effective
CHAPTER 4 GRADE SEPARATIONS AND INTERCHANGES
 CHAPTER 4 GRADE SEPARATIONS AND INTERCHANGES 4.0 INTRODUCTION The ability to accommodate high volumes of intersecting traffic safely and efficiently through the arrangement of one or more interconnecting
North Central Texas Council of Governments 157
 13. Transportation System Safety The goal of the Transportation System Safety Program Area is to improve transportation safety throughout the region by supporting planning efforts to develop safety policies,
A Probabilistic Approach to Defining Freeway Capacity and Breakdown
 A Probabilistic Approach to Defining Freeway Capacity and Breakdown MATT LORENZ LILY ELEFTERIADOU The Pennsylvania Transportation Institute The Pennsylvania State University 201 Transportation Research
Jobs & Transportation Ramping it Up Roadway and Traffic Dan Groh, P.E.
 Jobs & Transportation Ramping it Up Roadway and Traffic Dan Groh, P.E. Ohio DOT Work Zone Process Review Ohio DOT Work Zone Process Review This review was conducted by the Ohio Department of Transportation
Blow Ice Detection and Advanced Warning System
 Blow Ice Detection and Advanced Warning System Concept of Operations Final MnDOT OTST MnDOT District 8 September 2013 SRF No. 8221 Table of Contents Purpose and Scope... 1 Document Purpose... 1 Project
THE EFFECT OF POROUS PAVEMENT ON WAYSIDE TRAFFIC NOISE LEVELS
 Donavan, P. Page 1 THE EFFECT OF POROUS PAVEMENT ON WAYSIDE TRAFFIC NOISE LEVELS Paul R. Donavan, ScD. (Corresponding author) Sr. Scientist Illingworth & Rodkin, Inc 1 Willowbrook Court, Suite 120 Petaluma,
Guidance for the Use of Dynamic Lane Merging Strategies
 Guidance for the Use of Dynamic Lane Merging Strategies November 2012 This material is based upon work supported by the Federal Highway Administration under Grant Agreement No. DTFH61-06-G-00004 American
A VISION-BASED APPROACH TO STUDY DRIVER BEHAVIOR IN WORK ZONE AREAS
 1 2 3 4 5 6 7 8 9 10 11 12 13 14 15 16 17 18 19 20 21 22 23 24 25 26 27 28 29 30 31 32 33 34 35 36 37 38 39 40 41 42 43 44 45 46 A VISION-BASED APPROACH TO STUDY DRIVER BEHAVIOR IN WORK ZONE AREAS Yichang
DIVISION I TRAFFIC IMPACT STUDY GUIDELINES ENGINEERING STANDARDS
 CITY OF ALBANY DEPARTMENT OF PUBLIC WORKS DIVISION I TRAFFIC IMPACT STUDY GUIDELINES ENGINEERING STANDARDS Prepared By PUBLIC WORKS DEPARTMENT ALBANY, OREGON 97321 Telephone: (541) 917-7676 TABLE OF CONTENTS
INTELLIGENT TRANSPORTATION SYSTEMS APPENDIX
 INTELLIGENT TRANSPORTATION SYSTEMS APPENDIX Southern California Association of Governments ADOPTED APRIL 2012 INTELLIGENT TRANSPORTATION SYSTEMS Introduction 1 Existing System Description 1 Existing System
ITS and Work Zones. ARTBA Work Zone Conference November Tracy Scriba FHWA Office of Operations Work Zone Team
 ITS and Work Zones ARTBA Work Zone Conference November 2004 Tracy Scriba FHWA Office of Operations Work Zone Team Presentation Outline What is Work Zone ITS? Why Use It? Examples of Applications FHWA WZ
PROJECT STUDY REPORT. Cal Poly Pomona Senior Project
 06/2014 PROJECT STUDY REPORT (Cal Poly Pomona Senior Project) For Conceptual Approval of an Interchange Improvement And Cooperative Agreement with The City of Lake Elsinore for completion of Project Approval
US-23 Flex Route First Active Traffic Management (ATM) System in Michigan
 System in Michigan") Jennifer Foley Michigan Department of Transportation, Jackson, Michigan 49201 United States of America Karianne Steffen, P.E. PTOE HNTB Michigan, Inc. 3100 West Road Building 2, Suite 202 East Lansing,
Jennifer Foley Michigan Department of Transportation, Jackson, Michigan 49201 United States of America Karianne Steffen, P.E. PTOE HNTB Michigan, Inc. 3100 West Road Building 2, Suite 202 East Lansing,
Traffic Impact Study Requirements
 [TYPE THE COMPANY NAME] Traffic Impact Study Requirements County of San Mateo Department of Public Works Roadway Services 9/1/2013 I. Introduction The County of San Mateo (County), Department of Public
Worksite Safety Update Promoting safety in road construction
 Worksite Safety Update Promoting safety in road construction No 114 December 2011 In this Edition: Mobile Plant Safety Challenges for 2012 Page 1 Truck Mounted Attenuators Recent Developments Page 2 Traffic
BEFORE THE CITY COUNCIL OF THE CITY OF PITTSBURG ) ) ) ) The City Council of the City of Pittsburg DOES ORDAIN as follows:
 ) ) ) The City Council of the City of Pittsburg DOES ORDAIN as follows:") In the Matter of: BEFORE THE CITY COUNCIL OF THE CITY OF PITTSBURG Ordinance Amending Pittsburg Municipal Code Title 19 (Signs, to Remove the Prohibition on Installation of Billboards and Allow Billboards
In the Matter of: BEFORE THE CITY COUNCIL OF THE CITY OF PITTSBURG Ordinance Amending Pittsburg Municipal Code Title 19 (Signs, to Remove the Prohibition on Installation of Billboards and Allow Billboards
Lesson 3 4-Hour Version Slide: 4H-45
 Lesson 3 4-Hour Version Slide: 4H-45 Lesson Objectives 4-Hour Version Slide: 4H-46 Lesson Objectives: 3.1 and 3.2 4-Hour Version Slide: 4H-47 The first step of the TIM process is detection, a term used
IMPROVING THE SAFETY OF MOVING LANE CLOSURES PHASE II
 CIVIL ENGINEERING STUDIES Illinois Center for Transportation Series No. 10-072 UILU-ENG-2010-2013 ISSN: 0197-9191 IMPROVING THE SAFETY OF MOVING LANE CLOSURES PHASE II Prepared By Douglas Steele William
COMPANY OFFICER SAFE VEHICLE PRACTICES DURING ON-HIGHWAY INCIDENTS. 3 hours TIME FRAME: LEVEL OF INSTRUCTION: AUTHORITY: BEHAVIORAL OBJECTIVE:
 TOPIC: TIME FRAME: LEVEL OF INSTRUCTION: SAFE VEHICLE PRACTICES DURING ON-HIGHWAY INCIDENTS 3 hours II AUTHORITY: BEHAVIORAL OBJECTIVE: Condition: Behavior: Standard: A written quiz The student will confirm
SAFETY ASSESSMENTS FOR LOCAL TRANSPORTATION FACILITIES IN NEW YORK STATE
 SAFETY ASSESSMENTS FOR LOCAL TRANSPORTATION FACILITIES IN NEW YORK STATE Quick Reference Guide Safety Assessments can save lives in New York State. They have been proven effective in practice, easy to
FHWA-NJ July 2006
 TURNING PROBLEMS INTO SOLUTIONS Need a solution? Think Jersey DOT Project 2003-27: Identification of Traffic Control Devices for Mobile and Short Duration Work Operations FHWA-NJ-2006-006 July 2006 SUMMARY
TxDOT S SAFETY CULTURE: MISSION ZERO
 TxDOT S SAFETY CULTURE: MISSION ZERO Jerral W. Wyer Director, Occupational Safety Division 2 8 TxDOT Employee on the Job Fatalities FY1984-FY2015 7 6 5 4 Fatalities 3 2 1 0 3 Number of Personal Injuries
CITY OF VALLEJO PUBLIC WORKS DEPARTMENT TRAFFIC IMPACT Analysis/Study GUIDELINES
 The City Engineer, under the authority of the Public Works Director and recommendations from the Traffic Engineer, will make the final decision on the need for a traffic study. The purpose of the traffic
Local Technical Assistance Program (LTAP) / Tribal Technical Assistance Program (TTAP) Every Day Counts (EDC) Initiatives. Chad Pendley, P.E.
 / Tribal Technical Assistance Program (TTAP) Every Day Counts (EDC) Initiatives. Chad Pendley, P.E.") Local Technical Assistance Program (LTAP) / Tribal Technical Assistance Program (TTAP) Every Day Counts (EDC) Initiatives Chad Pendley, P.E. June 23, 2016 Stillwater, Oklahoma All Work Zones MUST follow
Local Technical Assistance Program (LTAP) / Tribal Technical Assistance Program (TTAP) Every Day Counts (EDC) Initiatives Chad Pendley, P.E. June 23, 2016 Stillwater, Oklahoma All Work Zones MUST follow
Developed by the Ohio Lane Closure Protocol Committee:
 Developed by the Ohio Lane Closure Protocol Committee: AAA Ohio Buckeye State Sheriffs Association Ohio Association of Chiefs of Police Ohio Department of Public Safety Ohio Department of Transportation
Analysis of Queue Estimation Methods Using Wireless Magnetic Sensors
 Analysis of Queue Estimation Methods Using Wireless Magnetic Sensors Rene O. Sanchez, Roberto Horowitz, and Pravin Varaiya Four queue estimation methodologies were studied with wireless magnetic sensors
Great Plains Waste Management Conference April 18, 2013 MUTCD MUTCD. Why Do We Install Signs? MUTCD
 Great Plains Waste Management Conference April 18, 2013 Retroreflectivity Assessment and Management Methods Presented by Don Neary Nebraska LTAP Starting at age 20, the amount of light needed to see an
Combined Transit and Freeway Real-Time Information for Smarter Modal Choices
 Combined Transit and Freeway Real-Time Information for Smarter Modal Choices Joerg Nu Rosenbohm Rockville, MD Dan van Kley Suwanee, GA Bryan Mulligan Suwanee, GA Transit Commuter Information System Project
Portable Positive Protection:
 Portable Positive Protection: A Guide for Short Duration and Short Term Work Zones June 2016 Updated by Mobile Barriers LLC Based on Material Developed by ATSSA for the FHWA Work Zone Safety Grant Program
OKLAHOMA DEPARTMENT OF TRANSPORTATION SPECIAL PROVISION FOR PAVEMENT AND BRIDGE DECK SMOOTHNESS
 430-2QA(a-i) 09 OKLAHOMA DEPARTMENT OF TRANSPORTATION SPECIAL PROVISION FOR PAVEMENT AND BRIDGE DECK SMOOTHNESS These Special Provisions amend and where in conflict, supersede applicable sections of the
SECTION 12 - CONSTRUCTION AREA TRAFFIC CONTROL TABLE OF CONTENTS
 SECTION 12 - CONSTRUCTION AREA TRAFFIC CONTROL TABLE OF CONTENTS Section Page 12-1 GENERAL... 12.1 12-2 FLAGGING... 12.1 12-2.01 Flaggers... 12.1 12-2.02 Flagging Costs... 12.1 12-3 TRAFFIC-HANDLING EQUIPMENT
Transit Applications and the EMTRAC System
 EMTRAC Systems STC, Inc. 1201 W. Randolph St. McLeansboro, IL 62859 Ph. (618) 648-2555 www.emtracsystems.com Transit Applications and the EMTRAC System It s 7:45 in the morning, and the number 10 bus is
USING A SIMULATION ENVIRONMENT FOR DYNAMIC TOLL ANALYSIS
 USING A SIMULATION ENVIRONMENT FOR DYNAMIC TOLL ANALYSIS ABSTRACT Robert Kerns and Darryn Paterson Transurban, USA 1421 Prince Street, Suite 200 Alexandria, Virginia 22314 571-527-2050; rkerns@transurban.com;
ODOT Transportation Systems Management & Operations Plan
 ODOT Plan Performance Measures Prepared for: Prepared by: May 2017 Updated December 2017 This page intentionally left blank Table of Contents List of Tables Introduction 1 ODOT s TSMO Performance Measures
11. Contract or Grant No. Austin, TX
 Technical Report Documentation Page 1. Report No. 2. Government Accession No. 3. Recipient's Catalog No. FHW AffX-99/1468-S 4. Title and Subtitle 5. Report Date INTEGRA TED ARTERIAL AND FREEWAY OPERATION
Watch out behind you! Responder Safety on the Roadway
 Watch out behind you! Original Incident Squad 2 reports no injuries and cancels the ambulance. Ladder 2 personnel remain in the truck while in blocking position. Midwest City Fire Department, OK Incident
This module discusses the types of available crash data and identifies their uses in highway safety in order to improve safety management and
 This module discusses the types of available crash data and identifies their uses in highway safety in order to improve safety management and decision making. It also provides an overview of data deficiencies
Special Specification 6348 Temporary Incident Detection and Surveillance System
 Special Specification Temporary Incident Detection and Surveillance System 1. DESCRIPTION 2. MATERIALS 3. EQUIPMENT Furnish, install, relocate, operate, maintain, and remove various components of an automated,
EVALUATION OF THIRD-PARTY TRAVEL TIME DATA IN TALLAHASSEE, FL
 EVALUATION OF THIRD-PARTY TRAVEL TIME DATA IN TALLAHASSEE, FL Charles R. Lattimer, PE, PMP Group Manager, Atkins North America 482 S. Keller Rd. Orlando FL 32810 (407) 806-4287, charles.lattimer@atkinsglobal.com
Technical Report Documentation Page 2. Government Accession No. 3. Recipient's Catalog No.
 1. Report No. FHWA/TX-15/5-9049-03-7 4. Title and Subtitle INSTALLATION OF DYNAMIC TRAVEL TIME SIGNS AND EFFORTS TO OBTAIN AND TEST A GRAPHICAL ROUTE INFORMATION PANEL (GRIP) SIGN IN AUSTIN Technical Report
Texas Transportation Institute The Texas A&M University System College Station, Texas
 1. Report No. FHWA/TX-01/4190-4 4. Title and Subtitle EMISSIONS DUE TO CONSTRUCTION EQUIPMENT AND TRAFFIC DELAYS TASK 6: CONTRIBUTION OF VEHICULAR EMISSIONS CAUSED BY REDUCTION IN CAPACITY DURING ROADWAY
Noise Study Bristol Park Redevelopment Area
 Noise Study Bristol Park Redevelopment Area Distribution No. of Copies Sent To 3 Ms. Susan K. Jones Environmental Coordinator City of Champaign 102 N. Neil Street Champaign, IL 61820 X:\CH\IE\2013\13C018.00\10000
Table of Contents. List of Appendices
 Table of Contents Page Executive Summary 3 Description of Project 3 TMP Roles and Responsibilities 3 Area Engineer 3 Communications Office 4 TMP Monitoring 4 Existing and Future Conditions 4 Traffic Counts
Work Zone Inspection Process
 Work Zone Inspection Process 2013 Louisiana Transportation Conference Barry L. Lacy, P.E. Work Zone/Claims/Audit Engineer Louisiana State Motto Why is Temporary Traffic Control Important? www.workzonesafety.org
STATE HIGHWAY ADMINISTRATION RESEARCH REPORT
 MD-09-SP708B4B Martin O Malley, Governor Anthony G. Brown, Lt. Governor Beverley K. Swaim-Staley, Secretary Neil J. Pedersen, Administrator STATE HIGHWAY ADMINISTRATION RESEARCH REPORT AN INTEGRATED WORK-ZONE
Missouri Work Zone Capacity: Results of Field Data Analysis
 University of Nebraska - Lincoln DigitalCommons@University of Nebraska - Lincoln Final Reports & Technical Briefs from Mid-America Transportation Center Mid-America Transportation Center 2011 Missouri
SR 99 Incident Response After- Action Plan
 SR 99 Incident Response After- Action Plan Background On June 10, 2014 at 1:52 PM, a pickup truck and a passenger car collided on southbound SR 99 (E Marginal Way S), just south of S Spokane St. The SDOT
Traffic Solutions. MUTCD Compliance Dates & Systematic Upgrades. John Nisbet State Traffic Engineer. Lynn Peterson Secretary of Transportation
 Traffic Solutions MUTCD Compliance Dates & Systematic Upgrades Rick Mowlds State Sign Engineer Lynn Peterson Secretary of Transportation John Nisbet State Traffic Engineer Road & Street Maintenance Supervisors
Guidelines for the Submission of a Transportation Study Level 2
 Guidelines for the Submission of a Transportation Study Level 2 For Site Development Applications in the City of North Vancouver Transportation Group, City of North Vancouver Engineering, Parks & Environment