An Introduction to The Ecology of Lakes, Ponds and Reservoirs. Developing a Management Plan
|
|
|
- Phoebe Newton
- 6 years ago
- Views:
Transcription
1 An Introduction to The Ecology of Lakes, Ponds and Reservoirs Developing a Management Plan Stephen J. Souza, Ph.D. Princeton Hydro, LLC 1108 Old York Road Ringoes, NJ ssouza@princetonhydro.com
2 Objective of Presentation Introduce standard limnological terms Discuss process of eutrophication Discuss multi-parameter approach to the management and restoration of lakes Introduce importance of management plan Discuss basic elements of a management plan
3 The Need For Lake Management Lakes and ponds susceptible to host of problems that impact water quality, aesthetics, recreational use. Most of these problems are directly linked to the natural process of eutrophication. The eutrophication of lakes, ponds and reservoirs is accelerated by watershed development activities. The most commonly observed symptoms of eutrophication are excessive productivity, sediment infilling, loss of clarity and decline in ecological functions and services.

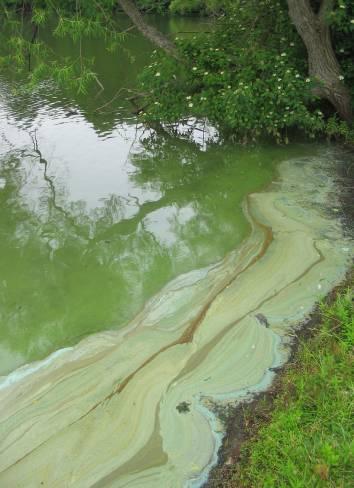
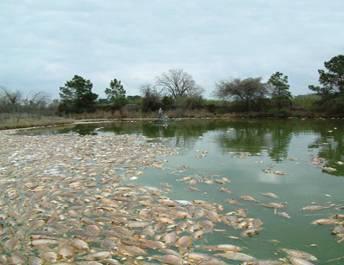
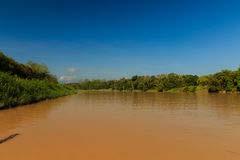
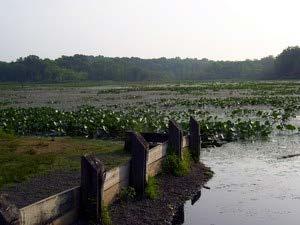
4 Common Lake Problems
5 What s Eutrophication and Why Should I Care? Increased rate of organic carbon production. Increased primary productivity Primary producers = plants. In lakes = weeds and algae. Result of introducing increasing amounts of nutrients.
6 Eutrophication of Lakes & Ponds Increase in organic carbon translates to more weeds and algae. Phosphorus is the fertilizer of concern...but nitrogen important too! Takes very little phosphorus to stimulate too much productivity 1lb phosphorus can create 1,000 lbs of algae! Most eutrophic lakes need to be on a diet!
7 Eutrophication Oligotrophic Low Productivity Mesotrophic Accelerated by Watershed Development Eutrophic High Productivity
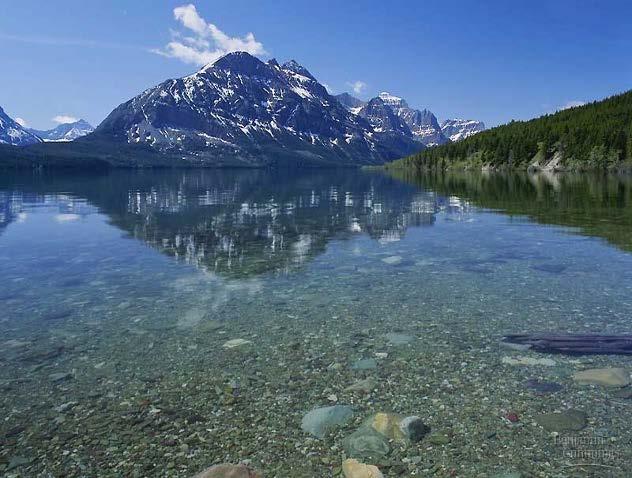
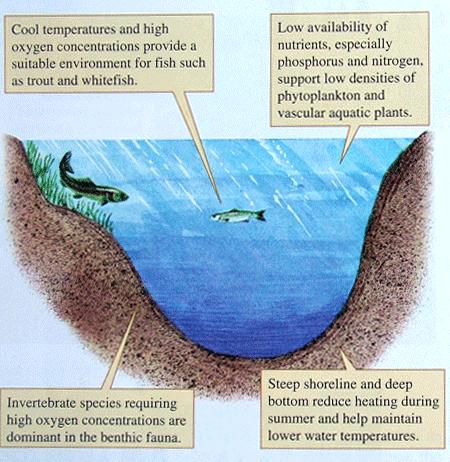
8 Oligotrophic Lake

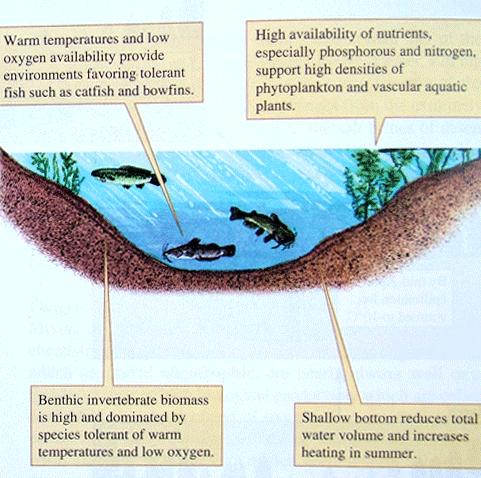
9 Eutrophic Lake
10 Oligotrophic Vs Eutrophic Water Quality Variable Secchi Depth Clarity Chlorophyll a (mg/m 3) Total Phosphorus (mg/l) EPA Clean Lakes Eutrophic Criteria Average <1m 20 moderate bloom 30 excessive bloom 0.03 enough for bloom, >0.10 hypereutrophic EPA Clean Lakes Oligotrophic Criteria Ave >4 m Less than 2, no significant blooms or less, very little algal productivity
11 Eutrophication Not Linear Productivity Phosphorus Lag effect. Though accelerated by cultural impacts, can take decades to observe. But once tipping point exceeded, changes happen rapidly.

12 Eutrophic Lake - A Not Too Bad

13 Eutrophic Lake - B Not Too Good

14 Don t Just Treat The Symptom Correct the Cause
15 Controlling Eutrophication To successfully identify and address the causes of eutrophication requires... Detailed study of the biological, chemical and physical interactions that define a lake ecosystem. A long-term management plan. Commitment to the plan.
16 Keys To A Successful Plan Clearly defined, realistic goals and objectives. Robust data...foundation of management and restoration decisions. Support...backing of stakeholders. Flexibility...use on-going data collection to objectively assess success of management and restoration efforts; revise management goals and objectives accordingly. Patience...takes time to control eutrophication


17 Lake and Pond Management Plan Flow Chart Data Collection Phase Diagnostic Study Analysis Phase Watershed Mgmt Restoration Action Phase Prevent it! Stop It! Manage it! Fix it! Improve it!

18 Dynamics of Eutrophication Hydrologic Physical
19 Data Collection In-lake data collection In-situ water quality Lab analysis of water samples Biological data Bathymetry Hydrologic data Modeling Watershed loading Hydrology Internal processes Trophic state response Accurate representation Comparable to standards etc Time Consuming Expensive Annual and seasonal variability Saves time Accounts for variability Multi-dimensional Data only as good as model Expensive Must validate
20 Fundamental Lake Interactions Physical Area Depth Shape Size of watershed Thermal properties Chemical Nutrients Dissolved oxygen ph Redox Biological Fish Phytoplankton Macroalgae Zooplankton Hydrologic Inflow Outflow Retention time Flushing Rate
21 Physical Attributes - Morphometry Maximum depth Average depth Must know physical attributes Area of lake/pond Volume Shape of lake Watershed area Watershed area: Lake area ratio Shoreline length

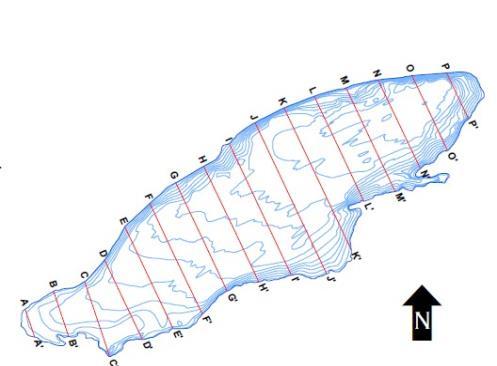
22 Bathymetry - Existing Water Depths

23 Bathymetry - Sediment Thickness
24


25 Water Elevation Top of Muck Original Lake Bottom Dredgable Sediment / Added Water Depth
26 Hydrology Extremely important but often overlooked lake attribute Controls rate and amount of external nutrient and sediment loading Affects nutrient assimilation (uptake) Affects mixing, circulation and stratification Water inflow and outflow can be complex Varies seasonally


27 The Importance of Hydrology The more inflow the greater potential for added sediment / nutrient loading But more inflow increases flushing rate This reduces ability for nutrients to be assimilated or sediments to settle.
28 Hydrologic Cycle Water In - Rainfall Runoff Stream baseflow and storm flow Groundwater Permitted discharges Septic systems Water Out - Evaporation Discharge Seepage - gaining Recharge - losing Consumption and use (irrigation, drinking water, etc.)
29 Hydrologic Residence Time Average time to fill lake Affects lake trophic dynamics Can vary seasonally Short res time rapid flow through Long res time - slow flow through Lake Vol (gal) / Outflow Rate (gal/t x ) Very simplified way to compute hydraulic flushing rate

30 Seasonal Effects Note how discharge declines dramatically in summer

31 Impact On Flushing Rate
32 Water Chemistry The water quality of a lake is most accurately defined through the analysis of key parameters Water chemistry varies seasonally affected by Hydrology Water temperature Biological activity Need a technically sound and comprehensive database to truly understand the chemistry of a lake
33 Important Water Quality Parameters ph Alkalinity/Hardness Dissolved oxygen Phosphorus (TP, SRP, DOP, DIP) Nitrogen (NO 3, NH 4 ) Clarity Temperature Chlorophyll a Susp. Sediment Dissolved solids Petro Chemicals Toxins (pesticides) Heavy metals (Cu, Pb) Color (humic acid) E. coli bacteria
34 Phosphorus Loading The more phosphorus, the more algae and weed growth. Phosphorus inputs will vary seasonally and may originate from both internal and external sources. A detailed analysis & quantification of Phosphorus load is the corner stone of a successful diagnostic study.
35 Phosphorus & Nitrogen Sources In-lake (internal) Sediment release and recycling Decomposition of organic material (algae, weeds, fish, etc.) External Stormwater runoff (direct and indirect) Septic systems and wastewater Rainfall Waterfowl
36 Stormwater Sources Residential Road runoff Lawn fertilizer Pet Waste Agricultural Active construction sites Stream bed and bank (erosion)

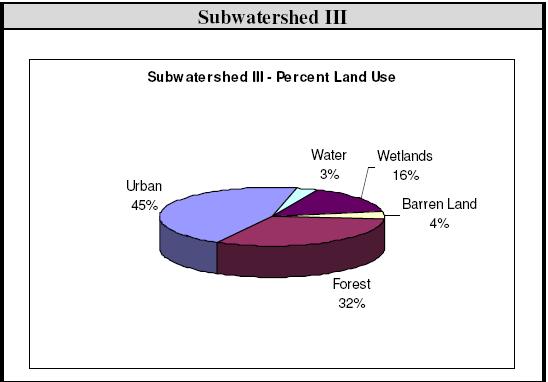
37 P Loading By Land Use
38 Phosphorus Load By Source Loading Source Load Kg/Yr) % of Total Stormwater (Watershed-Based) % Atmospheric % Septic % Internal regeneration Oxic load % Internal regeneration Anoxic load % Total %
39 Internal Phosphorus Loading Highly affected by Water s thermal properties and stability of water column Oxygen depletion Nutrient and mineral content of sediment
40 Thermal Attributes of Water Its an excellent solvent; many gases, minerals and organics readily are dissolved and are soluble in water. Water has high specific heat, it therefore heats slowly when cold and cools slowly when warm, therefore crating a fairly stable environment.
41 Water s Thermal Properties Temperature/density relationship is unique. Most liquids increase in density as they cool. Water attains maximum density at 4 o C, and then decreases in density as it approaches freezing or becomes warmer than 4 o C. This temperature/density relationship greatly affects the internal mixing properties of lakes, ponds and reservoirs.
42 Thermal Interactions Water column temperature is fairly uniform from surface to bottom Spring Density differences are nominal Lake can freely circulate from top to bottom
43 Thermal Interactions Sun heats upper layers Water temperatures differ from surface to bottom Density differences become significant Thermocline Lake can not freely circulate from top to bottom Summer
44 Thermal Interactions Epiliminion Upper warm layer of lake Metaliminion Transition layer of lake Hypoliminion Deep cold layer of lake Summer
45 Thermal Interactions Water column cool and surface and bottom temperatures are similar Fall Density differences dissipate Lake turns over as it can freely circulate from top to bottom once again
46 Internal Phosphorus Recycling High D.O. Algae Thermocline No D.O. Phosphorus, Fe, SO 4, Mg, Released Sediment Bound Phosphorus, Metals and Minerals
47 Biological Interactions A healthy lake is a complex, biologically balanced ecosystem Phytoplankton and Algae Zooplankton Macrophytes Benthic Invertebrates Vertebrates Decomposers (bacteria) All work together to process and channel energy defines productivity and trophic state
 exert control over lake")
48 Biological Interactions Bottom / Up - Primary producers (weeds and/or algae) exert control over lake conditions Top/Down Consumers (fish) exert control over lake conditions
49 Simoplified Food Web Interactions Phytoplankton Zooplankton Piscivorous Fish Zooplanktivorous Fish Bacteria and Decomposers


50 Classic Top Down Biological Effect A healthy zooplankton community decrease phytoplankton densities via grazing Excessive feeding decreases zooplankton grazing pressure on phytoplankton
51 Weeds and Algae Important, integral part of a lake s ecosystem Base of food chain Source of oxygen Weeds provide habitat for fish and wildlife Weeds help maintain a stable shoreline Weeds can intercept and filter pollutants and sediments Weeds add to the overall aesthetics
52 Alternative Stable States Lakes dominated by either submerged macrophytes (weeds) or by phytoplankton algae. Weed dominated = clear water Algae dominated = turbid water Stable state a function of annual nutrient load. The turbid phytoplankton state tends to exist under high nutrient concentrations, clear water macrophyte state tends to exist under low nutrient concentrations.
53 Summary Lake eutrophication is driven by nutrient loading However, trophic state is defined by various interactions Need to understand all interactions. Physical Hydrological Biological Chemical These data are the foundation of a successful management plan
54 Water Chemistry Is Important, But Hydrology can be a driving factor...often inadequately studied or quantified. Even in relatively shallow lakes, thermal effects can influence productivity and water quality. Biological interactions can greatly alter a lake s water quality top/down and bottom/up effects. Aquatic plants and algae are an important, positive attribute of a healthy lake they need to be controlled but not eradicated.

55 Sources of Information NALMS.ORG NYSFOLA.ORG Diet for Small Lake DEC.NY.GOV CSLAP
56 Thank You
57 Questions. Stephen J. Souza, Ph.D. Princeton Hydro, LLC 1108 Old York Rd., Suite 1 P.O. Box 720 Ringoes, NJ Ssouza@princetonhydro.com
EUTROPHICATION. Student Lab Workbook
 EUTROPHICATION Student Lab Workbook THE SCIENTIFIC METHOD 1. Research Background literature research about a topic of interest 2. Identification of a problem Determine a problem (with regards to the topic)
Long-Term Volunteer Lake Monitoring in the Upper Woonasquatucket Watershed
 Long-Term Volunteer Lake Monitoring in the Upper Woonasquatucket Watershed Linda Green URI Watershed Watch 1-87-95, lgreen@uri.edu WATER QUALITY IS A REFLECTION OF THE ACTIVITIES IN THE LANDS AND WATERS
2016 Summit Lake Water Quality Report Prepared by Thurston County Environmental Health Division
 ! 216 Summit Lake Water Quality Report Prepared by Thurston County Environmental Health Division PART OF TOTTEN INLET WATERSHED LENGTH OF LAKE: 2.2 miles SHORELINE LENGTH: 5.6 miles LAKE SIZE: 53 acres
Understanding the Basics of Limnology
 Understanding the Basics of Limnology Outline Watershed Processes Lake Formation Physical Features of Lakes Lake Processes Lake Chemistry Lake Biology Lake Management WATERSHED PROCESSES A Lake is a Reflection
Envirothon Aquatics. Mike Archer, NE Dept. of Environmental Quality. Katie Pekarek, Nebraska Extension Jeff Blaser, Nebraska Game and Parks
 Envirothon Aquatics Mike Archer, NE Dept. of Environmental Quality Katie Pekarek, Nebraska Extension Jeff Blaser, Nebraska Game and Parks Lake Watersheds Watershed = area contributing water to pond Surface
Lecture 5 CE 433. Excerpts from Lecture notes of Professor M. Ashraf Ali, BUET.
 Lecture 5 CE 433 Excerpts from Lecture notes of Professor M. Ashraf Ali, BUET. Surface Water Quality: Lakes and Reservoirs Lakes can be classified according to the degree of enrichment of nutrient and
White Lake 2017 Water Quality Report
 Introduction Watersheds Canada believes that every person has the right to access clean and healthy lakes and rivers in Canada. We work to keep these precious places naturally clean and healthy for people
Phosphorus Goal Setting Process Questions and Answers 2010
 Lake Winnipesaukee Watershed Management Plan Phase I: Meredith, Paugus, Saunders Bays 1. What is phosphorus? Phosphorus (P) is a naturally occurring element and a major nutrient required for biological
Interpreting Lake Data
 Interpreting Lake Data Indiana Clean Lakes Program The Indiana Clean Lakes Program was created in 1989 as a program within the Indiana Department of Environmental Management's (IDEM) Office of Water Management.
Proactive Management of Harmful Algae Blooms
 Proactive Management of Harmful Algae Blooms Stephen J. Souza, Ph.D. Princeton Hydro, LLC 1108 Old York Road Suite 1, P.O. Box 720 Ringoes, NJ 08551 New Jersey Agricultural Experiment Station - Office
Hydrology and Water Quality. Water. Water 9/13/2016. Molecular Water a great solvent. Molecular Water
 Hydrology and Water Quality Water Molecular Water Exists as an equilibrium But equilibrium altered by what is dissolved in it Water Molecular Water a great solvent In reality, water in the environment
Smithville Lake 2000 Water Quality Report
 Smithville Lake 2 Water Quality Report 1. General. a. Project location. The dam is located at river mile 12.9 on the Little Platte River, a tributary of the Platte River. The drainage area above the dam
Hydrology and Water Quality. Water. Water 9/11/2018. Molecular Water a great solvent. Molecular Water
 Hydrology and Water Quality Water Molecular Water Exists as an equilibrium But equilibrium altered by what is dissolved in it Water Molecular Water a great solvent In reality, water in the environment
Impacts to Aquatic Habitats from Land-Use or Is It Polluted?
 Impacts to Aquatic Habitats from Land-Use or Is It Polluted? Water Pollution is: The addition of excessive carbon to a system The addition of large amounts of materials to water that causes adverse changes
Interpreting Lake Data
 Interpreting Lake Data Indiana Clean Lakes Program The Indiana Clean Lakes Program was created in 1989 as a program within the Indiana Department of Environmental Management's (IDEM) Office of Water Management.
SECTION 1 FRESHWATER SYSTEMS UNIT 4: AQUATIC ECOLOGY
 SECTION 1 FRESHWATER SYSTEMS UNIT 4: AQUATIC ECOLOGY CENTRAL CASE STUDY: STARVING THE LOUISIANA COAST OF SEDIMENT LOUISIANA IS LOSING 25MI2 OF COASTAL WETLANDS ANNUALLY WETLANDS SUPPORT A DIVERSITY OF
Primer on Pond & Lake Ecology & Watershed Dynamics
 Primer on Pond & Lake Ecology & Watershed Dynamics The water quality of a lake is often described as a reflection of its surrounding watershed. The term lake collectively refers to reservoirs (man-made
Silver Lake Watershed Management Plan. F. X. Browne, Inc.
 Silver Lake Watershed Management Plan F. X. Browne, Inc. Eutrophication Trophic means food or energy level Oligotrophic ecologically young lake with low nutrients, low populations of algae and macrophytes
Appendix A. General Concepts in Lake Water Quality. Black Dog WMO Watershed Management Plan P:\23\19\513\plan\Black Dog WMO adopted plan.
 Appendix A General Concepts in Lake Water Quality Black Dog WMO Watershed Management Plan P:\23\19\513\plan\Black Dog WMO adopted plan.doc General Concepts in Lake Water Quality There are a number of concepts
Wakefield Lake TMDL Public Meeting 3/17/2014. Jen Koehler, PE Barr Engineering
 Wakefield Lake TMDL Public Meeting 3/17/2014 Jen Koehler, PE Barr Engineering Outline Project Contacts Introduction to Wakefield Lake Thoughts/Questions/Concerns About TMDL Studies Lake Water Quality and
Limnology 101. PA AWWA SE District & Eastern Section WWOAP Joint Technical Conference October 13, 2016
 Limnology 1 PA AWWA SE District & Eastern Section WWOAP Joint Technical Conference October, 2 Kristen Bowman Kavanagh, P.E. Flow Science Incorporated Limnology is the study of the biological, chemical,
Lake & Watershed Resource Management Associates P O Box 65; Turner, ME
 Lake & Watershed Resource Management Associates P O Box 65; Turner, ME 207-336-2980 LWRMA@megalink.net 2008 Baseline Water Quality Monitoring and Assessment of Pemaquid and Biscay Ponds At the request
Management of Water Quality Issues in Urban Stormwater Ponds
 Management of Water Quality Issues in Urban Stormwater Ponds Ryan Xu and Ricky Kwan Storm Consulting October 2018 Bringing engineering to life Presentation Outline 1.0 Background 2.0 Project Description
Water Quality in Stormwater Ponds
 Water Quality in Stormwater Ponds Linking Nutrients, Algae and Dissolved Oxygen Erik M. Smith University of South Carolina, Baruch Marine Field Laboratory North Inlet - Winyah Bay National Estuarine Research
Lake Washington. Water Quality Assessment Report. Copyright 2012 PLM Lake & Land Management Corp.
 Lake Washington 2012 Water Quality Assessment Report Copyright 2012 PLM Lake & Land Management Corp. Water Quality Report On May 22nd, June 18th, July 30th, August 29th, and September 27 th, 2012, PLM
Acidity and Alkalinity:
 Evaluation of Pollution Sources to Lake Glenville Quarterly Report December 2018 Kimberlee K Hall, PhD Environmental Health Program, Western Carolina University Summary Chemical and microbial analysis
Lake & Watershed Resource Management Associates P O Box 65; Turner, ME
 Lake & Watershed Resource Management Associates P O Box 65; Turner, ME 207-336-2980 LWRMA @megalink.net 2009 Baseline Water Quality Monitoring and Assessment of McCurdy Pond At the request of the Pemaquid
Kill the Weeds, Not the Fish!
 Kill the Weeds, Not the Fish! Dr. Chuck Cichra University of Florida / IFAS School of Forest Resources & Conservation Program in Fisheries & Aquatic Sciences My goal is for you to have a better understanding
Fact Sheet. Chesapeake Bay Water Quality
 Fact Sheet Chesapeake Bay Water Quality Water quality is a critical measure of the Chesapeake Bay s health. For the Bay to be healthy and productive, the water must be safe for people and must support
Ponds: Careful of the Fish!
 Ponds: Careful of the Fish! Dr. Chuck Cichra Extension Fisheries Specialist University of Florida / IFAS SFRC - Program of Fisheries & Aquatic Sciences All Plants Need Water, Light, and Nutrients Aquatic
EUTROPHICATION. Teacher s Manual
 EUTROPHICATION Teacher s Manual Preface The following is a, hands on, and inquiry based lesson plan developed by COSEE Mid-Atlantic for teaching eutrophication. The National Education Science Standards
Stormwater Management in Your Backyard: Stormwater 101
 Stormwater Management in Your Backyard: Stormwater 101 Gregory Rusciano Program Associate, Water Resources Rutgers Cooperative Extension New Jersey Sea Grant Extension Program How much water do we have?
DATA ANALYSIS SUMMARY
 Introduction The following data analysis summary is the result of a project funded by the Massachusetts Environmental Trust. The overall goal of this project is to develop a transferable process of cost-effective
Results from the 2017 Water Quality Monitoring Program
 Results from the 217 Water Quality Monitoring Program As part of a larger project, this summer the BWC conducted water sampling throughout the Belleisle Bay to get a baseline of data and determine the
Hydrology: Sources of Water and Nutrients
 Hydrology: Sources of Water and Nutrients 37 Hydrology: Sources of Water and Nutrients Study results indicate that Silver Lake is colimited by both phosphorus and nitrogen, at the time when the bioassay
Suspended Sediments. A lgae. Factors that Affect Water Clarity
 Factors that Affect Water Clarity Water clarity is a measure of the amount of particles in the water, or the extent to which light can travel through the water. There are many ways to express water clarity,
2017 Data Report for Rogers Pond, Mecosta County
 Michigan Lakes Ours to Protect 2017 Data Report for 43.6175478 N, 85.4718313 W The CLMP is brought to you by: 1 About this report: This report is a summary of the data that have been collected through
Lakes, Primary Production, Budgets and Cycling
 OCN 401-Biogeochemical Systems Lecture #10 (9.22.11) Lakes, Primary Production, Budgets and Cycling (Schlesinger: Chapter 7) 1. Primary Production and Nutrient Cycling in Lakes Physical aspects and nomenclature
2018 Data Report for Pickerel Lake, Kalkaska County
 Michigan Lakes Ours to Protect 2018 Data Report for Pickerel Lake, Kalkaska County Site ID: 400035 44.800559 N, 84.97667 W The CLMP is brought to you by: 1 About this report: This report is a summary of
Jackson Lake Analysis
 Jackson Lake Analysis Lake Zones Lake Zones Limnetic Zone- open water far from shore Light penetrates shallow, allowing photosynthesis Supports phytoplankton (algae, protists, cyanobacteria) which then
AP Environmental Science
 AP Environmental Science Types of aquatic life zones MARINE Estuaries coral reefs mangrove swamps neritic zone pelagic zone FRESHWATER lakes and ponds streams and rivers wetlands Distribution of aquatic
What s Happening in Lake Whatcom?
 What s Happening in Lake Whatcom? Dr. Robin A. Matthews, Director Institute for Watershed Studies Huxley College of the Environment Western Washington University June 6, 2011 Site 2 Basin 2 Lake Whatcom
2017 Data Report for Fern Lake, Grand Traverse County
 Michigan Lakes Ours to Protect 2017 Data Report for Site ID: 280438 44.73475 N, 85.73409 W The CLMP is brought to you by: 1 About this report: This report is a summary of the data that have been collected
Cultural accelerated by anthropogenic activities
 EUTROPHICATION IMPLICATIONS OF N & P Intent of this lecture? Link our discussions of terrestrial N & P dynamics with its influences on receiving water bodies How the relative amounts of N & P can influence
Hadlock Pond, Washington Co., Lake Hadlock Association, Inc.
 Hadlock Pond, Washington Co., Lake Hadlock Association, Inc. Lake Characteristics Watershed Characteristics Surface Area (ac/ha) Max Depth (ft/m) Mean Depth (ft/m) Retention Time (years) Water Class Dam
CHEMICAL: NITROGEN AND PHOSPHORUS (read pp in Dodson)
") BIOE 155, Fall 010 BACKGROUND CHEMICAL: NITROGEN AND PHOSPHORUS (read pp39-50 in Dodson) Lakes are often classified according to trophic status, specifically how much energy or food is available for the
BIOE 155, Fall 010 BACKGROUND CHEMICAL: NITROGEN AND PHOSPHORUS (read pp39-50 in Dodson) Lakes are often classified according to trophic status, specifically how much energy or food is available for the
2017 Data Report for Loon Lake, Iosco County
 Michigan Lakes Ours to Protect 2017 Data Report for Loon Lake, Iosco County Site ID: 350078 The CLMP is brought to you by: 1 About this report: This report is a summary of the data that have been collected
Use of Vollenweider-OECD Modeling to Evaluate Aquatic Ecosystem Functioning
 R. Anne Jones 1 and G. Fred Lee 1 Use of Vollenweider-OECD Modeling to Evaluate Aquatic Ecosystem Functioning REFERENCE: Jones, R. A. and Lee, G. F., Use of Vollenweider-OECD Modeling to Evaluate Aquatic
2017 Data Report for Portage Lake, Washtenaw County
 Michigan Lakes Ours to Protect 2017 Data Report for Portage Lake, Washtenaw County Site ID: 810248 42.420559 N, 83.921392 W The CLMP is brought to you by: 1 About this report: This report is a summary
2017 Data Report for Little Paw Paw Lake, Berrien County
 Michigan Lakes Ours to Protect 2017 Data Report for Site ID: 110765 42.21899 N, 86.29072 W The CLMP is brought to you by: 1 About this report: This report is a summary of the data that have been collected
2017 Data Report for Shingle Lake, Clare County
 Michigan Lakes Ours to Protect 217 Data Report for Shingle Lake, Clare County Site ID: 1818 43.96359 N, 84.95282 W The CLMP is brought to you by: 1 About this report: This report is a summary of the data
2017 Data Report for Silver Lake, Van Buren County
 Michigan Lakes Ours to Protect 2017 Data Report for Silver Lake, Van Buren County Site ID: 800534 42.3891 N, 86.0599 W The CLMP is brought to you by: 1 About this report: This report is a summary of the
2017 Data Report for Hoags Lake, Mason County
 Michigan Lakes Ours to Protect 17 Data Report for Hoags Lake, Mason County.171 N,.19575 W The CLMP is brought to you by: 1 About this report: This report is a summary of the data that have been collected
Welcome. Thank you for joining us! Lower Mississippi River Watershed Management Organization
 Welcome. Thank you for joining us! Lower Mississippi River Watershed Management Organization Lower Mississippi River Watershed Management Organization Watershed Restoration and Protection (WRAP) Study
Climate Change Water Implications for Michigan Communities, Landsystems and Agriculture
 Climate Change Water Implications for Michigan Communities, Landsystems and Agriculture Distinguished Senior Research Specialist Department of Geography Institute of Water Research Climate Change Summary
2017 Data Report for Deer Lake, Alger County
 Michigan Lakes Ours to Protect 2017 Data Report for Deer Lake, Alger County Site ID: 020127 46.48016 N, 86.98277 W The CLMP is brought to you by: 1 About this report: This report is a summary of the data
Physics, Chemistry, and Biology in Ponds and Lakes
 Physics, Chemistry, and Biology in Ponds and Lakes Ponds and Lakes Dominated by Heterotrophic Processes Example. A well mixed lake with V = 5x10 8 L is fed by a stream flowing at Q=2.4x10 7 L/d that contains
2017 Data Report for Arbutus Lake, Grand Traverse County
 Michigan Lakes Ours to Protect 217 Data Report for Arbutus Lake, Grand Traverse County Site ID: 2819 44.65917 N, 85.519726 W The CLMP is brought to you by: 1 About this report: This report is a summary
Potato Lake 2010 Project Results and APM Plan. Saturday May 28, 2011 Dave Blumer, Jake Macholl SEH Lake Scientists
 Potato Lake 2010 Project Results and APM Plan Saturday May 28, 2011 Dave Blumer, Jake Macholl SEH Lake Scientists Lake and Aquatic Plant Management Planning Goal: To maintain or improve the overall condition
2017 Data Report for Pleasant Lake, Wexford County
 Michigan Lakes Ours to Protect 2017 Data Report for Pleasant Lake, Wexford County Site ID: 830183 44.3 N, 85.4775 W The CLMP is brought to you by: 1 About this report: This report is a summary of the data
Physics, Chemistry, and Biology in Ponds and Lakes
 11//1 Physics, Chemistry, and Biology in Ponds and Lakes Ponds and Lakes Dominated by Heterotrophic Processes Example. A well mixed lake with V = x1 8 L is fed by a stream flowing at Q=.x1 7 L/d that contains
2017 Data Report for Oxbow Lake, Oakland County
 Michigan Lakes Ours to Protect 2017 Data Report for Oxbow Lake, Oakland County Site ID: 630666 42.64167 N, 83.477226 W The CLMP is brought to you by: 1 About this report: This report is a summary of the
Ecosystem Consulting Service, Inc. July 15, P a g e
 Prepared for: Normanoch Association Prepared by: Robert W. Kortmann, Ph.D. Ecosystem Consulting Service, Inc. July 17, 2014 Culver Lake Status 2014 (a brief mid-summer report) Cold water fish need water
Josette M. La Hée, Ph.D. Limnologist Research and Development
 Aeration: A key tool in aquatic system restoration and management Josette M. La Hée, Ph.D. Limnologist Research and Development http://www.vertexwaterfeatures.com Aeration Aeration the process by which
CLMP+ Report on Grass Lake (Anoka County) Lake ID# CLMP+ Data Summary
 Lake ID# CLMP+ Data Summary") CLMP+ Report on Grass Lake (Anoka County) Lake ID# 02-0113-00 2012-2013 CLMP+ Data Summary October 2014 Authors Shannon Martin, MPCA Editing and graphic design Public Information Office Staff The (MPCA)
CLMP+ Report on Grass Lake (Anoka County) Lake ID# 02-0113-00 2012-2013 CLMP+ Data Summary October 2014 Authors Shannon Martin, MPCA Editing and graphic design Public Information Office Staff The (MPCA)
Little Bay Water Quality Report Card Spring 2014
 Little Bay Water Quality Report Card Spring 2014 Little Bay is a small, semi-enclosed estuary located in the heart of Rockport, Texas. Estuaries, where freshwater from rivers and streams mixes with salt
2018 Data Report for. Crystal Lake, Montcalm County
 Michigan Lakes Ours to Protect 218 Data Report for Crystal Lake, Montcalm County Site ID: 5915 43.25584 N, 84.93362 W The CLMP is brought to you by: 1 About this report: This report is a summary of the
Portage Lake CASS COUNTY
 Portage Lake 11-0204-00 CASS COUNTY Summary Portage Lake is located near Bena, MN in Cass County. It covers 1,539 acres, which places it in the upper 10% of lakes in Minnesota in terms of size. Portage
Boy Lake CASS COUNTY
 Boy Lake 11-143- CASS COUNTY Summary Boy Lake is located near Remer, MN in Cass County. It covers 3,452 acres, which places it in the upper 1% of lakes in Minnesota in terms of size. Boy Lake has two main
Laurel Lake water quality, nutrients, and algae, summer
 Laurel Lake water quality, nutrients, and algae, summer 2011 1 H.A. Waterfield, W.N. Harman and M.F. Albright SAMPLING ACTIVITIES Site visits to Laurel Lake were made on 16 June and 25 July 2011; water
Freshwater Responses to Nitrogen and Phosphorus Pollution and a Case Study of Cutler and Dingle Marsh Wetlands
 Utah State University DigitalCommons@USU Watershed Sciences Faculty Publications Watershed Sciences 2009 Freshwater Responses to Nitrogen and Phosphorus Pollution and a Case Study of Cutler and Dingle
Continuous records for the Chariton River indicate that 2004 was an average water year, with total flow approximately equal to the average annual
 2004 Rathbun Report Iowa State University Limnology Laboratory John A. Downing, Ph.D. George Antoniou, Assistant Scientist For Rathbun Land and Water Alliance August 31, 2005 A. Tributaries Personnel of
2017 Data Report for Painter Lake, Cass County
 Michigan Lakes Ours to Protect 217 Data Report for Painter Lake, Cass County Site ID: 1418 41.81667 N, 85.99194 W The CLMP is brought to you by: 1 About this report: This report is a summary of the data
U.S. Geological Survey s Update on the Water Quality of Delavan Lake
 Memo to: Town of Delavan Lake Committee Date: February 2, 2013 From: Ryan Simons, Town of Delavan Lake Committee Chairman Subject: U.S. Geological Survey s Update on the Water Quality of Delavan Lake On
2017 Data Report for Big Maggie Lake, Iron County
 Michigan Lakes Ours to Protect 2017 Data Report for Big Maggie Lake, Iron County Site ID: 360173 46.01 N, 88.4626 W The CLMP is brought to you by: 1 About this report: This report is a summary of the data
2017 Data Report for Earl Lake, Livingston County
 Michigan Lakes Ours to Protect 217 Data Report for Earl Lake, Livingston County Site ID: 755 2.191 N, 3.95 W The CLMP is brought to you by: 1 About this report: This report is a summary of the data that
WASA Quiz Review. Chapter 2
 WASA Quiz Review Chapter 2 Question#1 What is surface runoff? part of the water cycle that flows over land as surface water instead of being absorbed into groundwater or evaporating Question #2 What are
2017 Data Report for Ottawa Lake, Iron County
 Michigan Lakes Ours to Protect 2017 Data Report for Site ID: 360033 46.08484 N, 88.76419 W The CLMP is brought to you by: 1 About this report: This report is a summary of the data that have been collected
2017 Data Report for Lake Tahoe, Oceana County
 Michigan Lakes Ours to Protect 17 Data Report for Lake Tahoe, Oceana County Site ID: 33 3.1 N,.3 W The CLMP is brought to you by: 1 About this report: This report is a summary of the data that have been
CHAPTER 15 WATER POLLUTION. INTO THE GULF Researchers try to pin down what s choking the Gulf of Mexico
 CHAPTER 15 WATER POLLUTION INTO THE GULF Researchers try to pin down what s choking the Gulf of Mexico SAVING THE BAY Teams of researchers try to pin down what s choking the Chesapeake Water pollution
State of the Lake Environment Report December Mackavoy Lake
 State of the Lake Environment Report December 2003 Mackavoy Lake Mackavoy Lake Mackavoy Lake is located in the Township of Addington Highlands. Mackavoy Lake is a headwater lake of the Mississippi River
Lake Yale Hydrologic/Nutrient Budgets and Water Quality Management Plans
 Lake Yale Hydrologic/Nutrient Budgets and Water Quality Management Plans Presentation to the Harris Chain Restoration Council June 2018 Michael J. Perry Lake County Water Authority Scope of Work The primary
ALMY POND TMDL MANAGEMENT PLAN
 ALMY POND TMDL MANAGEMENT PLAN PUBLIC WORKSHOP Presented by: City of Newport Department of Utilities And Pare Corporation May 7, 2014 Presentation Overview Introduction to Almy Pond Project Introduction
Glossary. hefreediction ary.com/algae. hefreediction ary.com/anth
 Algae noun Any of various chiefly aquatic, eukaryotic, photosynthetic organisms, ranging in size from single-celled forms to the giant kelp. Algae were once considered to be plants but are now classified
Spanaway Lake Management Plan
 Spanaway Lake Management Plan Background Spanaway Lake is a valuable Pierce County resource. The lake is threatened by a variety of water quality problems including excess algae and weed growth and elevated
Lakes, Primary Production, Budgets and Cycling Schlesinger and Bernhardt (2013): Chapter 8, p
: Chapter 8, p") OCN 401-Biogeochemical Systems Lecture #12 (10.8.13) Angelos Hannides, hannides@hawaii.edu Lakes, Primary Production, Budgets and Cycling Schlesinger and Bernhardt (2013): Chapter 8, p. 288-308 1. Physical
OCN 401-Biogeochemical Systems Lecture #12 (10.8.13) Angelos Hannides, hannides@hawaii.edu Lakes, Primary Production, Budgets and Cycling Schlesinger and Bernhardt (2013): Chapter 8, p. 288-308 1. Physical
After reviewing data collected from ISLAND POND, STODDARD, the program coordinators have made the following observations and recommendations.
 OBSERVATIONS & RECOMMENDATIONS After reviewing data collected from ISLAND POND, STODDARD, the program coordinators have made the following observations and recommendations. Thank you for your continued
Water Quality Analysis of Lakewood Lakes
 Water Quality Analysis of Lakewood Lakes December 2016 Prepared by WEST Consultants, Inc. Bellevue, Washington With support from HDR, Inc., Olympia, Washington TABLE OF CONTENTS EXECUTIVE SUMMARY... V
Lakes: Primary Production, Budgets and Cycling
 OCN 401-Biogeochemical Systems (9.28.17) Lakes: Primary Production, Budgets and Cycling Reading: Schlesinger, Chapter 8 Lecture Outline 1. Seasonal cycle of lake stratification Temperature / density relationship
Big Chetac Lake Getting Rid of the Green Phase 3. Nutrient Budget and Management Data Analysis Report
 Big Chetac Lake Getting Rid of the Green Phase 3 Nutrient Budget and Management Data Analysis Report Prepared for: Big Chetac Chain Lake Association and Wisconsin Department of Natural Resources Prepared
Streamside Management. How the area around your pond effects the water.
 Streamside Management Zones and Water Quality How the area around your pond effects the water. Stream(pond)side Management Zone A streamside management zone (SMZ) is a strip of land immediately adjacent
USGS LAKE STUDIES CASE STUDY: SILVER LAKE (OCEANA COUNTY, MI) Angela Brennan, Hydrologist - US Geological Survey Upper Midwest Water Science Center,
 Angela Brennan, Hydrologist - US Geological Survey Upper Midwest Water Science Center,") USGS LAKE STUDIES CASE STUDY: SILVER LAKE (OCEANA COUNTY, MI) Angela Brennan, Hydrologist - US Geological Survey Upper Midwest Water Science Center, Lansing, MI October 18, 2017 USGS Inland lake studies
USGS LAKE STUDIES CASE STUDY: SILVER LAKE (OCEANA COUNTY, MI) Angela Brennan, Hydrologist - US Geological Survey Upper Midwest Water Science Center, Lansing, MI October 18, 2017 USGS Inland lake studies
Water Quality Monitoring:
 Water Quality Monitoring: Lesson Plan for Exploring Time Series Data Presenters: Janet Vail, Fallon Januska, Dirk Koopmans Lake Michigan Center in Muskegon, Michigan Home of Annis Water Resources Institute
Dissociation of Orthophosphoric Acid
 { Phosphorus General Essential for all living things Component of DNA, RNA, ADP, ATP, and bone Usually the most limiting nutrient in phytoplankton productivity Many forms Soluble inorganic, soluble organic,
Okanagan Large Lakes Water Quality Monitoring Program Ellison Lake Wood Lake Kalamalka Lake Okanagan Lake Skaha Lake Osoyoos Lake
 Okanagan Large Lakes Water Quality Monitoring Program Ellison Lake Wood Lake Kalamalka Lake Okanagan Lake Skaha Lake Osoyoos Lake 1 Table of Contents Goals & Objectives... Trophic Status... Data Collection...
2017 Data Report for Duck Lake, Muskegon County
 Michigan Lakes Ours to Protect 217 Data Report for Duck Lake, Muskegon County Site ID: 61778 43.33785 N, 86.39258 W The CLMP is brought to you by: 1 About this report: This report is a summary of the data
2017 Data Report for Perch Lake, Iron County
 Michigan Lakes Ours to Protect 217 Data Report for Perch Lake, Iron County Site ID: 3646 46.361392 N, 88.658338 W The CLMP is brought to you by: 1 About this report: This report is a summary of the data
Factsheet: City of West Haven Water Quality and Stormwater Summary
 79 Elm Street Hartford, CT 06106-5127 www.ct.gov/deep Affirmative Action/Equal Opportunity Employer Factsheet: City of West Haven Water Quality and Stormwater Summary This document was created for each
Figure 1. Platte River Sub-Watersheds and Monitoring Locations.
 Figure 1. Platte River Sub-Watersheds and Monitoring Locations. 10 2 1 9 7 BL Pond 8 Hatchery 6 3 5 4 1 Platte River at Fewins Rd 6 B. Creek to Hatchery Spring 2 Platte River at Stone Bridge 7 Platte River
State of the Lake Environment Report December Clayton Lake
 State of the Lake Environment Report December 2002 Clayton Lake Clayton Lake Clayton Lake is situated in the Townships of Lanark Highlands and Mississippi Mills in Lanark County. Clayton Lake is at an