Te Kauwhata Catchment Management Plan
|
|
|
- Rafe Juniper Harvey
- 6 years ago
- Views:
Transcription
1 Report Te Kauwhata Catchment Management Plan Prepared for Waikato District Council By Beca Infrastructure Ltd (Beca) 22 July 2009 Beca 2009 (unless Beca has expressly agreed otherwise with the Client in writing). This report has been prepared by Beca on the specific instructions of our Client. It is solely for our Client s use for the purpose for which it is intended in accordance with the agreed scope of work. Any use or reliance by any person contrary to the above, to which Beca has not given its prior written consent, is at that person's own risk.
2
3 Table of Contents 1 Introduction Site Introduction CMP Objectives Stakeholder Consultation Catchment Hydrology Classification of Receiving Waters Catchment Ecology Rainfall Data Flow and Water Level Data Groundwater and Aquifer Data Conclusion Catchment Assessment Statutory Planning Framework Site Visit Existing Structure Plan Review Review of WDC Road Design Review of Landscape Design Principals Planning Conclusions Existing Stormwater Effects Existing Resource Consents Flood Defence Scheme Known Flood Risk Areas Hydraulic Modelling Rainfall Data Hydraulic Model Build Model Verification Sensitivity Analyses Model Results - Travers Road Catchment Model Results Te Kauwhata Village Conclusion Anticipated Future Stormwater Effects Identification of Urban Growth Future Scenario Hydraulic Model Change in Runoff Volumes Future Effects on the Travers Road Stream Future Pipe Network Capacity Conclusion...30 Beca // 22 July 2009 // Page ii // NZ
4 8 Stormwater Management Options Options for Management of the Travers Road Stream Corridor Urban Stormwater Management Options Conclusion Implementation Effectiveness of the District Plan Catchment Management Implementation Conclusions Recommendations...37 Appendices Appendix A - Site Visit Photos Appendix B - Catchment Maps Appendix C Statutory Framework Documents Appendix D Existing Stormwater Consents Appendix E Hydraulic Model Results Appendix F Structure Plan Catchment Maps Beca // 22 July 2009 // Page iii // NZ

5 1 Introduction Beca Infrastructure (Beca) have been commissioned by Waikato District Council (WDC) to develop a Catchment Management Plan (CMP) for the village of Te Kauwhata, located in the Waikato District. The CMP has been developed to support the Te Kauwhata Structure Plan, which is due for completion in June The structure plan is being developed by WDC to help manage current and future growth in the Te Kauwhata village and surrounding areas. The structure plan will help guide appropriate growth and development of the area through to 2061, with the objectives of allowing growth as well as protecting and enhancing the natural environment. The structure plan area is bounded by the Whangamarino wetland to the north, Lake Waikare to the south, Wayside, Moorfield and Te Kauwhata Roads to the west and Swan Road to the east. 1.1 Site Introduction The village of Te Kauwhata is located in the northern (lower) Waikato catchment. The village is two kilometres to the east of State Highway one the Waikato River. Te Kauwhata is north of Huntly and the North Island Main Trunk Line (NIMT) railway line runs through the village. The current population is approximately 1,200 although further development is planned, and is likely to rise in the near future. Figure 1: Location map of Te Kauwhata (source: Google maps) Land use in the village is predominantly low density residential with areas of rural residential to the west and north-east. There is a light industrial area to the south of the village. This area includes the Te Kauwhata wastewater treatment plant, which discharges to Lake Waikare. New subdivisions are proposed for the village, which would see an expansion to the north-west (towards Beca // 22 July 2009 // Page // NZ
6 SH1) into the Travers Road area, which is currently a mixture of open pasture and horticulture (vineyards and olive plantations). Some residential growth is also proposed to the north of the village along Blunt Road towards the Whangamarino wetland. The total area for new development will be approximately 200 hectares. The topography of the area is gently rolling hills, with a high point of 60mRL at the western boundary and a low point of 7mRL at the wetland margin. Soils in the area are generally volcanic loamy clay, which are well structured and moderately well draining, however because of a clay base layer they can sometimes impede drainage and cause high volumes of runoff. In the lower Travers Road catchment soils are similar to the peat material found in the Whangamarino wetland (DJ Scott, 2009). Immediately to the north of the village is the Whangamarino wetland. The wetland is internationally recognised as a RAMSAR site (one of only six in New Zealand and the only one in the North Island) for its ecological value and relatively pristine ecosystem. The wetland covers an area of 7,300 hectares. Immediately to the south of the village is Lake Waikare. This is the largest lake in the Waikato, but has become degraded and the water quality is poor. The lake has a surface area of 3,442 hectares. The lake receives both stormwater and wastewater discharges from the village. Existing floodplain areas make up a small but significant part of the structure plan area, including the Travers Road catchment and land adjacent to the lake and wetland. The village straddles an east-west spur along Waerenga Road. This spur separates two catchments, with land to the north draining to the Whangamarino wetland and land to the south draining to Lake Waikare. The Travers Road catchment to the west drains to a small stream which discharges into the Whangamarino wetland. 1.2 CMP Objectives Based on existing statutory policy documents (see Appendix C) the following objectives have been adopted for the preparation of the Te Kauwhata catchment management plan Social: Stormwater treatment and collection areas shall retain and where possible enhance the rural village look and feel. Area of new commercial growth be restricted to areas near the existing town centre where existing stormwater reticulation can be utilised. Promote the use of Low Impact Design elements and features for areas where social interaction is intended as part of the recreation network or to maximise the use of green open space areas Economic Where possible existing contours shall be used to reduce the amount of earthworks required. Encourage the use of a treatment train, including the use of at source stormwater retention to reduce first flush downstream flow volumes Minimise areas of flood inundation on private property by recommending alternative disposal systems, or identify current restrictions in the catchment that have direct impacts on the level of ponding. Beca // 22 July 2009 // Page // NZ
7 1.2.3 Ecological Maintenance and enhancement of ecological corridors and buffer areas, including the use of riparian margins and planted areas in conjunction with stormwater management features as appropriate. Ensure that the adverse effects of land use (new development) on water quality and aquatic habitats are avoided, remedied, or mitigated. Ensure that the natural character and water quality of significant wetlands are protected and enhanced Amenity Encourage the use of Low Impact Design methods to achieve amenity enhancement in areas adjoining urban growth. Utilise soft edge concepts to retain and enhance amenity associated with wet ponds and created wetlands that are necessary for stormwater detention and treatment within the lower catchment, near the point of discharge Cultural Establish methods to improve water quality of the stormwater discharge into the Whangamarino Wetland and Lake Waikare to recognise and maintain the cultural significance of the wetland and lake. Acknowledge relationship that tangata whenua as Kaitiaki have with water and their identified taonga such as waahi tapu. 2 Stakeholder Consultation Effective stakeholder consultation is considered as being an interactive two way process between project proponents and government bodies, organisations and people with an interest in a project. Consultation facilitates understanding between parties, it provides a forum for sharing ideas and concerns and effective consultation should enhance decision making. With respect to the Te Kauwhata catchment management plan, consultation should be undertaken in a coordinated way with the structure plan process. The CMP will produce a model of the current catchment and the areas where improvements to stormwater detention are required. Consultation therefore requires a staged approach in order to achieve the best possible outcomes. Included below is a suggested consultation strategy for the Te Kauwhata CMP. Phase 1: Completion of the Draft CMP Assess background information and establish the Key Organisational Stakeholders within the Te Kauwhata catchment area. These stakeholders will have an interest in stormwater disposal and water quality either from a regulatory or management perspective. Once established, initial consultation is then undertaken to inform the relevant organisations that the study is active. In the initial consultation an opportunity to feed back on the study in later consultation rounds should be established. Phase 2: High level conceptual development Consideration of the draft CMP with representatives of WDC with respect to the key elements of the WDC structure plan, i.e. allowing for increased growth whilst retaining the community look and feel and how the CMP fits with the greater development framework. In this phase consideration of Beca // 22 July 2009 // Page // NZ
8 approaches and options should be developed and consideration given to how the enabling policy framework may be addressed, so that consultation with landowners or community groups as identified in Phase 3 is agreed and is meaningful and effective. Phase 3: Completion of catchment modelling / mapping of areas Undertake consultation (possibly in conjunction with WDC representatives and the structure plan) with those parties identified as being directly affected landowners or community groups to identify any concerns or inconsistencies, particularly in areas within the lower catchment where the risk of inundation is greater. Consultation with key organisational stakeholders should also be undertaken to establish realistic outcomes. The results of the consultation are then feed back into the framework and methodologies finalised and adopted. Phase 4: CMP integration with structure plan principles Following consultation with landowners, community groups and key stakeholders, advise preferred approach for integration of principles established by the CMP and how these will influence or be integrated with the structure plan frameworks. Stages 1-3 are considered to be the core of the consultation in relation to the CMP. Stage 4 could be timed to coincide with the period preceding the notification period associated with the structure plan or proposed plan change if this was considered appropriate. The consultation process will enable various issues and options to be explored by Beca, the Council, landowners, community groups and stakeholders in a transparent manner. The results of the consultation can be carefully considered in the decision making. If through the process of the structure plan to date, consultation has addressed issues which arise from the CMP, the consultation framework could be adjusted in discussion with WDC to reflect or concentrate on specific aspects identified. Initial informative consultation has been undertaken with the following organisations as part of Phase 1 above: Department of Conservation Environment Waikato Nga Muka Development Trust 3 Catchment Hydrology The CMP for Te Kauwhata covers the four small catchments surrounding the village. These are: The northern catchment draining the village from Waerenga Road north to the Whangamerino wetland The southern catchment, draining from Waerenga Road south to Lake Waikare The eastern catchment, draining to the Whangamarino wetland The Travers Road catchment, draining from SH1 to the Whangamarino wetland Of these four catchments, the northern and southern are both wholly within the village and are drained predominantly by a piped stormwater network with some open drains. The Travers Road catchment to the west is rural and drains to a small stream which crosses Travers Road and the main north-south railway line before discharging into the Whangamarino wetland. This catchment has been marked for future development but currently experiences flooding. Beca // 22 July 2009 // Page // NZ
9 This section is intended to provide a broad overview of the catchment hydrology. Rainfall and water levels analyses have been done to provide inputs to the hydraulic modelling and there is a further discussion of rainfall and water levels in the hydraulic modelling section. 3.1 Classification of Receiving Waters The Te Kauwhata catchments have three main receiving waters for stormwater discharge, these being the Whangamarino wetland, Lake Waikare and the stream running through the Travers Road catchment. These receiving waters have been classified below based on the WRP. Information in this section has been sourced from Environment Waikato 1 and the Boffa Miskell ecological report. Surface waters class The surface water class covers general water bodies with the intent of maintaining quality both for aesthetic reasons, human utilization purposes and minimization of impact on the ecosystem. Fisheries Class Fisheries class is applied to water bodies to maintain or enhance existing water quality and aquatic habitat in areas that specifically support a range of fish species for conservation, recreational, traditional or commercial fisheries. Contact Recreation class This class is defined to provide a safe water quality environment for contact recreation in all rivers, streams and lakes with significant contact recreational use. Natural State waters class Natural State class waters are assigned to outstanding largely unmodified water bodies. The definition instructs that these are places where the flow regime must be protected and riparian and aquatic habitat maintained to protect aesthetic and intrinsic values Whangamarino wetland The Whangamarino wetland is the second largest bog and swamp complex in the North Island and is listed as a wetland of international importance under the RAMSAR convention. The wetland is contained within three large shallow basins drained by the Maramarua and Whangamarino Rivers and the Reao Stream. In non-flood conditions the wetland is fed by a catchment of 48,900 hectares, but during flood conditions the wetland also receives overflows from the Waikato River. Water levels can vary by between 2.0 to 2.5 metres during a year. The wetland is considered a almost pristine environment and has a high ecological value. Although it receives treated high quality effluent from the Lake, this has little effect on the character of the wetland. Several endangered species of aquatic bird are present. The predominant soils in the wetland are organic peats, which form in the low lying flats where the water table is permanently high and anaerobic conditions have led to the accumulation of organic matter. The majority of waterways in the wetland are highly turbid due to high silt levels from Lake Waikare and the leaching of humic materials from peat areas. The Maramarua arm carries high silt loads from the eastern hills and an adjoining open cast coal mining overburden dump. 1 Environment Waikato Beca // 22 July 2009 // Page // NZ
10 The most significant geological factor in relation to management of the wetland is the presence of coal. The coal has a potentially significant commercial value and extraction would have serious effects on the integrity of the wetland Lake Waikare Lake Waikare is the largest lake in the lower Waikato catchment, with a surface area of 3,442 hectares and an average depth of 1.5 metres. Lake Waikare discharges into the Whangamarino wetland via the artificial Pungarehu canal and is regulated for flood control, with a strict seasonal fluctuation in lake level of approximately 0.3 metres. The flood control works were comissioned in 1965 and resulted in a lake level reduction of one metre. Since 1963 the wetlands surrounding the lake have been reduced by two-thirds. The lake is considered to have very low water quality, with high turbidity and low light penetration. Water quality monitoring carried out by Environment Waikato (from February 1993 to December 2004) has shown that the lake is hypertrophic and has extremely high levels of inorganic suspended sediments, which contributes to low light penetration and limits the amount of plant life in the lake. There are currently no submerged aquatic plants (macrophytes) in the lake. Although turbidity has been noticeable since the 1940s the lake was historically clear and had high light penetration up to the 1970s. The current low water quality is considered to be due to erosion in the Matahuru catchment, the lowering of the lake level, re-suspension of lakebed sediments by wave action and the collapse of submerged aquatic plants between 1977 and In addition the lake is a receiving water for treated wastewater flows and agricultural non-point source pollution Travers Road Catchment Stream The stream running through the Travers Road catchment has elevated nutrient levels due to the presence of agriculture in the upper catchment, which generate non-point source pollution. Common stormwater contaminant levels are also high. The stream is overgrown throughout its length. Analysis of historical and present day aerial photographs of the Travers Road catchment indicate that 90% of the site has been utilised for agricultural or horticultural activities at one time or another. Of this area approximately 60% is likely to contain contaminant levels exceeding residential acceptance criteria. These horticultural contaminants may include DDT, copper, lead, arsenic and possibly fuel such as petrol or diesel. It is worth noting that the majority of these contaminants are usually confined to the top 0.5m of soil, raising the possibility that increased runoff could lead to their liberation as sediment which would be able to enter the wetland. Area Classification Priority State Whangamarino wetland Natural state class Priority 1: Livestock exclusion Lake Waikare Surface water class Priority 1: Livestock exclusion Travers Road stream Surface water class Priority 1: Livestock exclusion Table 1: Receiving environment classifications Good Degraded Degraded Beca // 22 July 2009 // Page // NZ
11 3.2 Catchment Ecology In October 2008 Boffa Miskell carried out an ecological survey of the structure plan area, the Whangamarino wetland and adjacent land. A report was produced in March 2009 to accompany the structure plan documents; the ecology report is summarised below, with particular emphasis on sections relevant to stormwater. The ecological surveys included both field surveys and a review of available information. Field methods included the following:: Vegetation surveys (focused on areas of indigenous vegetation, but other areas were also observed); Marsh bird call soliciting; General bird surveys; Electric fishing and fish trapping; Macroinvertebrate sampling; Water and sediment quality sampling (for the Travers Road stream and two outlet drains into Lake Waikare); Physical habitat descriptions for selected waterways. The structure plan area is located within the Meremere ecological district. Within the ecological district most native vegetation has been cleared and converted to pasture, although the Whangamarino wetland is still present. The wetland became RAMSAR listed in 1989 and is one of only six RAMSAR sites in New Zealand. The wetland is the second largest bog / swamp complex in the North Island and contains a mosaic of plant communities. In central areas of wetland major tree species include Sledges, while Willow and Manuka are present on the fringes. The wetland supports the largest breeding population of the acutely threatened Australasian Bittern and is also a habitat for the acutely threatened orchid Anzybas Carsei, which is only found in the Whangamarino wetland. There are some small forest remnants near the structure plan area on the edges of Lake Waikare. The closest large native forests are approximately 20km away to the south and east. The structure plan area is dominated by agricultural and urban vegetation types. Indigenous vegetation is limited to the edges of the Whangamarino wetland and Lake Waikare; there are small areas of wetland (containing indigenous plant communities) present on the shore of Lake Waikare north of the wastewater treatment ponds. The wetlands around the lake have been highly modified by stock pugging and browse and there are numerous weeds, however their potential for ecological restoration is excellent. Approximately 6km of the Whangamarino wetland edge is within the structure plan area, which includes a moderately large peninsula extending into the wetland. The majority of the wetland margin is grazed with small areas of cropping and residential land. The wetland edge is not fenced and stock have free access to the wetland. The structure plan area is dominated by agricultural and urban land cover, including orchards, vineyards, pasture, gardens, lawns and parks. Native plant species are very uncommon and are restricted to aquatic species in farm drains and waterlogged pasture on wetland edges. The water quality sampling found that common stormwater contaminants are well below the Australian and New Zealand Environment and Conservation Council (ANZECC) guidelines for ecosystem protection and that minor nutrient enhancement is occurring. The highest concentrations of contaminants were found in the Travers Road stream, which was expected due to Beca // 22 July 2009 // Page // NZ
12 the rural-residential development in the catchment. Nutrient levels in waterways in the structure plan area slightly exceed Ministry for the Environment guidelines for stream environments with regard to Periphyton proliferation. Stormwater treatment in the structure plan area should employ low impact design (LID) principals, but should go well beyond current best practice for stormwater treatment. The discharge of urban stormwater into a RAMSAR wetland is unprecedented in New Zealand and the Whangamarino wetland is a pristine environment that demands a high level of treatment. The contaminant profile into the wetland should be below the ANZECC (2000) threshold for protection of 99% of species. The report recommends treatment of stormwater as close to source as possible (using techniques such as rain tanks, rain gardens, swales etc) and the use of a treatment train approach, which would include constructed wetlands (or other detention device) as the final downstream treatment. Riparian buffers can be used to improve water quality and ecological health. Native restoration plantings can be used and combined with grass filter strips. Given the agricultural nature of the structure plan area, grass strips could be used initially with a gradual transition to buffers of native planting. The Travers Road stream would benefit from a riparian buffer, even in the ephemeral upper reaches. Drains and wetland edges could also benefit. Planting in riparian buffers should provide dappled shade along the stream but should not totally shade the stream this would result in a loss of macrophyte beds, which provide important water treatment and habitat functions. Conclusions Within the modified structure plan area ecological value was determined to be low as native vegetation is scarce in favour of urban and agricultural vegetation, and disturbance tolerant animal, fish and macro invertebrate species dominate. Water quality was also considered moderate which reflects the urban and agricultural landforms and highly modified streams and banks. Conversely the ecology of the Whangamarino wetland was rated very high due to the presence of several threatened species and native vegetation, which as well as being contained in the wetland also border the edge of the structure plan area. 3.3 Rainfall Data Although there are no rainfall gauges located within the catchment, there are others close by that can be used. As is shown in Table 2, the Whatawhata gauge receives approximately 25% more rainfall than the other local gauges. The mean annual rainfall at Te Kauwhata is estimated to be 1200mm. Rain Gauge Mean Annual Rainfall (mm) Complete Years of Record Distance to Te Kauwhata (km) Maramaura Forest Huntly Whatawhata Maramaura Maungakawa Table 2: Mean annual rainfall figures 3.4 Flow and Water Level Data Environment Waikato operate four water level gauges around the structure plan area. These record water levels in the Whangamarino wetland and Lake Waikare and are listed in Table 3. There are Beca // 22 July 2009 // Page // NZ
13 no stage-discharge relationships available for any of these gauges so no flow records could be calculated. The only flow gauge in the area is Slackline (1967 to 1992), but this is located on a tributary of the Whangamarino River downstream of Lake Waikare, so was not useful in this report. Environment Waikato are attempting to generate a stage-discharge curve for the Ropeway site, but so far there isn t enough data. Site No. Grid Ref. Site Name Record Period S12: Whangamarino Control Structure U/S 22/04/ /05/ S13: Whangamarino Off Falls Rd 24/06/ /05/ S12: Whangamarino Ropeway Recorder 31/10/ /05/ S13: Lake NOCG 14/03/ /06/2005 Table 3: Environment Waikato water level sites Because there is no suitable data, base flows in the Whangamarino River could not be estimated. There is also no flow data available for the Travers Road stream. The outlet of Lake Waikare is controlled by the flood control gates and the water level is regulated within the range 5.50 to 5.65mRL. Prior to its regulation the normal Lake level was 6.50mRL. The water level in the Whangamarino wetland is gauged at the three sites shown in Table 3. There is no gauged record at the upstream extent of the wetland near Te Kauwhata and the nearest gauge is at Falls Road. The full gauged record at this gauge is shown in Figure 3 and mean monthly water levels are shown in Figure Mean water level (m RL) J F M A M J J A S O N D Month Falls Road Control Structure Figure 2: Mean monthly water levels in the Whangamarino wetland Beca // 22 July 2009 // Page // NZ
14 Water Level (m RL) /06/ /06/ /06/ /06/ /06/ /06/ /06/ /06/ /06/ /06/ /06/ /06/ /06/ /06/ /06/ /06/ /06/ /06/ /06/ /06/ /06/ /06/ /06/2008 Date Figure 3: Full gauged record for the Whangamarino wetland at Falls Road Water Level (m RL) /04/ /10/ /04/ /10/ /04/ /10/ /04/ /10/ /04/ /10/ /04/ /10/ /04/ /10/ /04/ /10/ /04/ /10/ /04/ /10/ /04/ /10/ /04/ /10/ /04/ /10/ /04/ /10/ /04/ /10/ /04/ /10/ /04/ /10/ /04/2009 Date Figure 4: Full gauged record for the Whangamarino wetland at the Control Structure Based on this data the mean water level in the wetland is 3.28mRL at Falls Road and 2.57mRL at the control structure. At Falls Road the 100 year ARI flood level is 6.69mRL. It needs to be remembered that the wetland water level is controlled so this 100 year level may not be reached, indeed during the 1998 flood event the maximum water level was 5.74mRL. As part of the structure plan, design flood levels for the wetland were surveyed by Bloxham Burnett and Oliver in December Personal communication with Bernie Milne (surveyor, BBO) indicates the water level was 7.20mRL at the time of survey. The flood scheme design (100 year ARI) water level at Te Kauwhata is 7.50mRL. 3.5 Groundwater and Aquifer Data No aquifer or groundwater data is available for the catchment as there are no recording boreholes. There are some existing groundwater abstraction consents shown on the Environment Waikato website, but the consented abstraction rates are small. Because of the presence of the Whangamarino wetland, it can be assumed that groundwater levels are high to the north of Te Kauwhata. 3.6 Conclusion There are four sub-catchments of interest in this CMP. The receiving waters they drain to are generally degraded and have limited ecological value. The causes of this degradation include urban development, agriculture and development of the flood control system. In contrast, the Whangamarino wetland is a relatively pristine environment with high ecological value, although Beca // 22 July 2009 // Page // NZ
15 future development will require best-practice stormwater management techniques to ensure this remains the case. 4 Catchment Assessment Most of the existing drainage in the Te Kauwhata village is via kerb and channel. There is a piped stormwater system that drains to both the Whangamarino wetland and Lake Waikare. The direction of drainage is determined by the ridge that runs through the centre of the village. There is little in the way of existing stormwater treatment a large stormwater pond has been developed to the north of the village as part of the Blunt Road residential subdivision and there is also a dry detention pond on Roto Street to the south of the village, but otherwise there is little in the way of stormwater treatment. The existing piped stormwater system currently discharges to open drains that convey stormwater to either Lake Waikare or the Whangamarino wetland. Some of the piped system is known to be under capacity and there are some parts of the village that are regularly inundated as a result. Some of the open channels also pass through culverts; although these may act as flow constrictions, non are located near known flood areas so are unlikely to be the cause of flood risk. In the Travers Road catchment the existing 1200mm diameter culvert under Travers Road is thought to act as a major flow constriction. The Travers Road culvert is smaller than the stream and may cause a backwater effect (and subsequent flooding) upstream. The natural channel is narrow and overgrown so the current hydraulic capacity is thought to be low. Anecdotal evidence suggests that the culvert has been overtopped several times (flood levels for these events have been surveyed by BBO). Flood levels in the lower reaches of the Travers Road catchment (and likely, the Blunt Road development) will be influenced by water levels in the Whangamarino wetland. 4.1 Statutory Planning Framework An investigation of the relevant statutory framework has been undertaken. The documents which have been considered include the Resource Management Act 1991, the Waikato Regional Policy Statement, the Waikato Regional Plan and the objectives and policies of the Proposed Waikato District Plan. A summary of the relevant provisions is included for reference in Appendix C of this report. 4.2 Site Visit A site visit was undertaken on 5 th May The purpose of the site visit was to gain an understanding of the hydrology of the catchment, assess the likely drainage paths during flood events and identify any hydraulic constrictions in the Travers Road area. Some photos from the site visit (along with descriptions) are included in Appendix A. Photograph 1 shows the upper Travers Road catchment. The topography here is gently rolling hills with a mixed land use of pasture, horticulture and some rural-residential development. The catchment is largely rural. Photograph 2 shows a stormwater treatment device located on the Roto Street sub-division. This is thought to be a dry detention pond, but could equally be a rain garden had vegetation been used instead of stones. This detention system is the type of stormwater management that could be applied throughout the structure plan area. Beca // 22 July 2009 // Page // NZ
16 Photograph 4 shows the stormwater pond on Blunt Road. This pond looks to be oversized given the current level of development and imperviousness, however it may be an option to divert stormwater from future development in the area into this pond. Photograph 6 shows the property on the corner of Mahi Road and Saleyard Road, which is frequently inundated. As can be seen, the property is not located in a depression that might collect stormwater, so it is thought that a lack of capacity in the piped system is responsible for flooding here. Photograph 7 shows the outlet of the railway bridge in the Travers Road catchment. The outlet and downstream channel are heavily overgrown and vegetation clearance is recommended. Photograph 10 shows fields to the west of the railway line adjacent to Te Kauwhata Road. This area is regularly inundated and this is through to be from upstream runoff collecting in the natural depression. At present this area is not developed and there are no plans for development, as such flood risk mitigation here is not a priority. Photographs 11 and 12 show the Travers Road stream up and downstream of the road bridge. The stream is narrow and incised with considerable vegetation growth. The stream looks to have a low hydraulic capacity and it is not surprising that it regularly exceeds bank full level. 4.3 Existing Structure Plan Review The Proposed Structure Plan for Te Kawhata represents a change of approach from a predominately ad- hoc subdivision led development to more of a comprehensive framework and approach to growth and future development. The structure plan is focused around allowing urban and rural growth whilst retaining the character and feel of the Te Kawhata village. By focussing on the form of development in a holistic way, expansion of urban areas can be achieved without sacrificing amenity, open space, connectivity or key landscape features such as the Whangamarino Wetland. The structure plan provides a robust opportunity to use a regulatory framework and codes of practice in conjunction with non regulatory tools such as guidelines to require the inclusion of key infrastructure in an integrated way. If these tools are used well, source (rain tanks, porous pavements & rain gardens), centralised (convenience channels & drainage networks) and end of train stormwater management processes(dry ponds, ponds & wetlands) can be integrated with elements that enhance the amenity of developments. This approach promotes a shift in the thinking away from stormwater management facilities being relegated to the left over spaces and instead considered as integral components of a development. Linkages between stormwater management facilities, natural areas, ecological areas, open space areas, road networks and off road trails provide a cohesive system that adds value to the community. The outcome achieves more than simply a collection of fragmented, isolated and disjointed components. A well executed open space network that includes stormwater management facilities and landscaping, can assist with the marketing of a development and provides the wider community with a high level of amenity and enhances the urban environment. The use of terrestrial and aquatic vegetation in these areas in a controlled functional way can provide for infiltration areas, stream margins, increased biodiversity, improved aquatic habitat and enhanced recreational facilities. Beca // 22 July 2009 // Page // NZ
17 The proposed structure plan is comprehensive in so far as it includes the existing built environment with areas of proposed growth and seeks to integrate design elements as far as practicable into the existing township. This provides an opportunity for concepts such as the use of a stormwater treatment train and low impact design features to be used to improve the water shed and quality of stormwater from the piped network and existing discharges. 4.4 Review of WDC Road Design As part of the structure plan Waikato District Council have developed a series of design principals for new roads. These principals outline the four types of roads, including example cross sections, minimum required road reserve width and stormwater collection and treatment. The document is summarised below, with particular emphasis on the stormwater principals Road types The structure plan document identifies a hierarchy of four different road types, these being: Level 1 - Heavy traffic bypass Level one on the hierarchy is the heavy traffic bypass, which will be constructed around the south and east of the village from Waerenga Road to Te Kauwhata Road. This road will be constructed so large vehicles do not need to use Warenga Road, thinking particularly of large trucks that will be accessing the quarry north of Te Kauwhata from State Highway one. The road will have a reservation width of 20 to 22.5m. Level 2 Collector Level two on the hierarchy are the collector roads, which are defined as roads carrying more than 1,500 vehicles per day. The road will be two sealed traffic lanes with parking bays separated by a central grass swale. The road camber will be formed so stormwater from both lanes drains to the central swale. Collector roads will have a reservation width of 25.5m. Level 3 Local Type A Level three on the hierarchy are local type A roads, which are defined as roads carrying more than 500 but less than 1,500 vehicles per day. The pavement widths will be for two 3.5m wide lanes and 2.5m wide parking bays on each side. The total reservation width will be 22.0m. Level 4 Local Type B Level four on the hierarchy are local type B roads, which are defined as roads carrying less than 500 vehicles per day. They will consist of two 3.0m wide lanes and 2.5m wide parking bays on each side. The total reservation width will be 21.0m. Stormwater Principles Road drainage in the existing urban area is mainly via kerb and channel to the piped stormwater system. WDC are proposing to move away from this system of road drainage and instead make use of swales where possible and detention ponds. Where swales are not feasible (for example, in areas of steep longitudinal gradient or where there is insufficient road reservation width) standard kerb and channel will be used. According to the road design document the proposed drainage system will use swales to remove pollutants from the stormwater and polish the runoff, as well as attenuating the first flush volume. The swales will have catchpits located at regular interval connected to a piped system that will discharge to detention ponds. Beca // 22 July 2009 // Page // NZ
18 It is important to note that if swales are used as a preliminary treatment and conveyance system, they will remove some pollutants and sediment but they will not polish the runoff. If used as part of a stormwater treatment train (as is proposed) then the downstream detention pond will provide the polishing treatment. Although the local soils do not allow for infiltration to be used, the swales should still provide a flow attenuation benefit because flow velocities and downstream times of concentration will be lower than in a fully piped system. This attenuation would only really be required for stormwater draining to the Travers Road stream; there will be no downstream flood risk for discharges to either the Whangamarino wetland or Lake Waikare. For the swales to provide a water quality benefit the spacing of catchpits will need to be considered carefully. The guidelines in ARC TP10 recommend that swales have a minimum residence time of nine minutes; this could be achieved in a number of ways, including increasing the spacing between catchpits, reducing the longitudinal gradient and increasing the length of grass in the swale (which will increase hydraulic roughness and reduce peak velocities). If swales are used as preliminary treatment as part of a treatment train then the nine minute treatment time may be reduced. The guidelines state that kerb and channel will still be used where either the longitudinal gradient could result in scour of the swale base or where there is insufficient road reservation width. In the case of longitudinal gradient, slopes of greater than 5% can make use of check dams, which will reduce flow velocities and scour potential. However, in the Travers Road catchment it is likely there will still be some roads that have too large a gradient for swales to be used. Where driveway entrances are required to cross swales, 225mm diameter culverts will be installed to provide a longitudinal connection between swales. This diameter pipe shouldn t cause any flow constriction as long as there is no blockage. The gradient of the pipes will be an important consideration; flow velocities in the pipe will be greater than in the swale due to lesser hydraulic roughness so to prevent any scour downstream of the culvert either some erosion protection (such as a small check dam) or a lower pipe gradient may be required. The design principals propose the use of semi-permeable pavement for the surface of the car parking bays on the sides of roads. Using such porous paving will provide an initial filtration mechanism for stormwater runoff and provide a water quality and flow attenuation benefit. Based on Figure 1-2 in the design principal memorandum, the pavement subgrade material may be either permeable or impermeable. If the material is impermeable either an under drain (such as a 150mm diameter perforated PVC pipe wrapped in geotextile) will be required, or the entire pavement will need to be graded so there is throughflow from the basecourse material into the swale. As the design principals state the soil type is unsuitable for infiltration the use of an under-drain seems the best option. 4.5 Review of Landscape Design Principals Also included as part of the structure plan is a document outlining urban design concepts and guidelines for future growth in the village. The document has been prepared to assist Resource Consent applications and contains information detailing how urban design issues will be assessed in future. The document includes some urban guidelines that relate to stormwater management; these particular guidelines have been reviewed, although the document as a whole is not reviewed here. It is important to note that although integrating stormwater management and treatment devices within an urban design framework is the desired outcome, it may not always be possible and the sensitive nature of the receiving environment (particularly the Whangamarino wetland) means effective stormwater treatment must take precedence over urban design. Beca // 22 July 2009 // Page // NZ
19 Document Review While discussing the natural environment of the area, the guidelines refer to the drain that runs through the Travers Road catchment and proposes that repairs be done. What these repairs entail are not discussed and the subject is not elaborated on. It is likely that some work will be required in the watercourse to mitigate flooding (such as vegetation clearance) but the use of the word repair implies that the drain (which is actually as stream) somehow isn t functioning. In the section on stormwater, the guidelines outline a preference for drainage to incorporate blue and green corridors, which may include constructed wetlands, ponds, rain gardens and swales. This fits within the overall low impact design concept for the catchment as well as the road design guidelines. However, the urban design guidelines state that such stormwater infrastructure should be located beside neighbourhood reserves or collector roads in order to form a public open space and that they will not be permitted to locate them behind houses. Indeed, the assessment criteria state that at least 75% of constructed wetlands or ponds be bound by public open space. While this may be desirable from an urban design perspective, it needs to be remembered that the primary function of stormwater ponds and other such devices is the treatment of stormwater and removal of contaminants. As such, if functioning correctly they may be unpleasant to look at and public interaction should be avoided. It is important to consider the functional aspects of the stormwater management devices in relation to the visual integration with open space. If stormwater devices are to be incorporated into reserves or public open space, it may be more appropriate to use dry detention ponds or wetlands. Constructed wetlands could be built adjacent to the Whangamarino wetland. Dry detention ponds may be more suitable in the Travers Road catchment and could be contoured into the natural landscape. If used as the downstream element of a stormwater treatment train, detained stormwater shouldn t cause such a public heath risk. With regard to the street network, the use of different pavement types for the carriageway and parking areas is proposed. Again, this fits well with the overall low impact design concept for the catchment and the road design principals. For collector roads, the urban design guidelines propose planting in the median swale. The diagrams included in the guidelines suggest that this planting would include large trees; from a stormwater treatment perspective this is less than ideal. Having large vegetation planted in the swale may lead to reduced grass growth in the swale (due to lack of light), which will impact on the effectiveness of stormwater treatment. Large vegetation may also result in an uneven bed surface due to root growth; coupled with the obstruction in the swale this would severely impact on stormwater conveyance. Small shrubs could be planted on the side slopes of swales, but having large or extensive vegetation in the base is undesirable. If vegetation in the median strip is required, it would be better to make use of rain gardens rather than swales. These are designed to incorporate vegetation, but it is still unlikely they would function with large trees. Stream Margins and Wetland Edge Road The guidelines outline a desire to integrate the stream and wetland with the perimeter street frontage, including walkways. The only point to note with regard to stormwater is the need to have kerb and channel drainage for roads adjacent to any waterways. This is to ensure that there is no direct untreated runoff from the road to the receiving water body. There is little discussion on plans for the linear reserve running along the Travers Road stream as this is dependant on the floodplain extents. The plan to use the floodplain as a open space reserve is a good one. Beca // 22 July 2009 // Page // NZ
20 4.6 Planning The policies relevant to the structure plan that will form part of any subsequent variation to the proposed district plan, were not finalised at the time of this report being written. The themes around which policies have been drafted however, are considered to be strong and will assist with achieving a positive outcome for the Te Kawhata area. The key elements in relation to stormwater management within the catchments are included in brief below. Integration of the built form with private and public open space Avoiding extensive earthworks during subdivision Maintaining hydrological characteristics of an area during subdivision Staging of infrastructure to allow links and efficiencies for development Management of stormwater as close to source as possible Riparian planting of key drainage networks Use of eco corridors which enhance landscape and amenity and integrate stormwater management with public access Use of low impact design principles for stormwater management Protection of the Ecological value and water quality of key areas being the Whangamarino Wetland and Lake Waikare Use of maximum values for impervious surface areas and site coverage provisions to reduce runoff from new development These elements are considered to be integral to stormwater management and will reduce the effects of subdivision and future development. Stormwater management as close as practical to its source, reducing the impervious catchment area and attenuating the flow of stormwater into the lower catchment can all avoid adverse effects from ponding and flooding. Using a variety of low impact design methods can also result in improved water quality which will have a positive effect on the Whangamarino wetland and Lake Waikare. The policy framework will allow the effects of growth and development on the hydrology of the area to be effectively managed at the time of development and provide opportunities for improvements in the overall amenity of Te Kauwhata. 4.7 Conclusions The key are for the CMP is the Travers Road area, particularly the existing floodplain and the determination of design flood levels, which will allow further urban planning to proceed. There is little existing stormwater treatment in the catchment and the inclusion of a stormwater treatment train will be important for new developments. The WDC road design guidelines include stormwater treatment and have good potential for integration of road runoff within a more comprehensive treatment train. It is important to consider urban landscaping and amenity values when designing stormwater treatment, so the adoption of the Travers Road floodplain as a open space reserve should be welcomed. 5 Existing Stormwater Effects 5.1 Existing Resource Consents A list of the existing stormwater discharge consents in the structure area is included in Appendix D. Beca // 22 July 2009 // Page // NZ

21 5.2 Flood Defence Scheme Lake Waikare and the Whangamarino wetland are part of the lower Waikato Waipa flood defence scheme. During large floods in the Waikato catchment flood water will spill from the river into Lake Waikare and then into the Whangamarino wetland. The Waikare-Whangamarino flood control system was constructed between 1961 and 1982 and has a total storage volume of 98Mm3. The system provides a low cost flood storage alternative to building stopbanks along the lower reaches of the Waikato River. During a design flood the use of flood storage should reduce peak water levels in the Waikato River by between 40 and 60cm. The key trigger water levels are shown in the schematic on Figure 5. Because wetland water levels of 7.20mRL have been surveyed at Te Kauwhata, it is thought that the Waikare gate will close when the Whangamarino water level is 4.00mRL at the Whangamarino control gate. Figure 5: The flood control system (source: Environment Waikato) Lake Waikare has a normal water range of 5.50 to 5.65m RL and a design flood level of 7.37mRL for the 100 year ARI event, which initiates operation of the Waikare spillway. This gives the lake a flood storage range of between 1.87 and 1.72m. The highest recorded lake level is 8.38mRL in Since the Waikare gates were constructed in 1965 the highest recorded lake level is 6.29mRL, which is 0.21m lower than the pre-construction water level of 6.50mRL. This peak water level occurred during the July 1998 Waikato floods and 1.7km 2 of land surrounding the lake was inundated. During this flood event peak discharge over the Rangiriri spillway (from the Waikato River into Lake Waikare) peaked at 200m 3 /s. During the July 1998 flood the recorded peak water levels in the Whangamarino wetland were 5.74mRL at Falls Road and 5.61mRL at the Whangamarino control gate. The extent of the wetland Beca // 22 July 2009 // Page // NZ
22 swelled from 17km 2 to 67km 2. A report by Environment Waikato 2 suggests that without the control gates the water level in the wetland (presumed to be at the Whangamarino control gate) would have been equivalent to that in the Waikato River 6.11mRL, which would have inundated an additional 73km Known Flood Risk Areas Anecdotal evidence suggests that during flood events the Travers Road culvert has been overtopped on several occasions. This anecdotal evidence gives flood levels of 10.80m and 9.00mRL for storms events in June 2005 and August 2008 respectively (immediately upstream of the Travers Road culvert). A flood level of 10.80mRL would be sufficient to overtop the railway culvert but not the road culvert, which has a road elevation of 10.94mRL. Because the Waikare Whangamarino system is used for flood storage during large floods in the Waikato River, land adjacent to both the lake and wetland is at risk of inundation, as discussed in Section 5.2. The area to the west of the railway line, adjacent to Te Kauwhata Road and Eccles Avenue collects runoff from the upper catchment and regularly floods. The property on the corner of Mahi Road and Saleyard Road (see photograph 6) is regularly flooded. This may be due to the pipe network having insufficient capacity, but may also be because of its location at the foot of the ridge that runs through the village. 6 Hydraulic Modelling A MIKE Urban hydraulic model has been developed to assess the current effects of stormwater in the catchment. The model has been developed to include both the piped stormwater drainage network in the village and the currently undeveloped Travers Road catchment to the west of the village. The assessment of stormwater effects has been limited to stormwater quantity; there has been no assessment of stormwater quality, although later sections in this report discuss options that could be used in the future to improve stormwater quality. These are focused around low impact design (LID). The main focus of interest is in the Travers Road catchment. This area is planned for sub-division development and flood levels for the 100 year average recurrence interval (ARI) event are required so that minimum building floor levels can be specified in the structure plan. The area included in the hydraulic model is shown in Figure 6, along with the pipe network and surveyed cross sections through the Travers Road stream. As well as determining flood levels in the Travers Road stream the model has been used to identify any capacity problems with the piped network in the village. 2 Munro (1998), The Waikato Regional Flood Event of 9-20 th July 1998, in The Australasian Journal of Disaster and Trauma Studies, Volume Beca // 22 July 2009 // Page // NZ
.")
23 Figure 6: Te Kauwhata catchment hydraulic model 6.1 Rainfall Data The hydraulic model uses input rainfall data representing a 24 hour duration storm event for the 2, 10 and 100 year ARI events. The total 24 hour rainfall depth for these events was estimated based on data obtained from four local rain gauges and the HIRDS rainfall database (version 2.0). Gauged rainfall data was obtained from the NIWA climate database 3 website and from Environment Waikato. The following gauged data was used in the rainfall analysis: Site 2075 at Maramaura Forrest, covering the years (46 complete years) Site 2086 at Huntly, covering the years (41 complete years) Site 2103 at Whatawhata, covering the years (51 complete years) Site at Maramaura, covering the years (6 complete years) Site at Maungakawa, covering the years 1993 to 2008 (16 complete years) All of the above data was obtained from daily records and was corrected for 24 hour durations using the Meteorological Service methodology 4. A Generalised Extreme Value (GEV) statistical analysis was performed on all the gauged data (except for site which doesn t have a long enough record) to obtain return period rainfall depths. These rainfall depths are shown in Table 4, along with the values obtained from the HIRDS database for Te Kauwhata. 3 NIWA online climate database for New Zealand The Frequency of High Intensity Rainfalls in New Zealand, Coulter and Hessell, 1980 Beca // 22 July 2009 // Page // NZ
24 ARI Event (yrs) Rainfall Gauge HIRDS Table 4: 24hr statistical rainfall depths (mm) Of the three rainfall gauges analysed, Huntly (site 2086) is the closest to the Te Kauwhata catchment, being only 20km away. Despite this, the rainfall depths obtained from the HIRDS database were used in the modelling. This was mainly due to the wide variation in design rainfall depths at the other sites Storm Hyetograph A Chicago style nested hyetograph was used to develop the design storm shapes. Using a nested 24 hour hyetograph has the advantage that a range of critical duration storm events, ranging from 10 minutes through to 24 hours, can be analysed using a single storm event. The nested hyetograph is taken from ARC TP An example 1mm 24 hour storm hyetograph is shown in Figure 7. This shows rainfall at ten minute increments normalised against the overall 24 hour intensity for a 1mm storm event Normalised Intensity (I / I24) :00 0:50 1:40 2:30 3:20 4:10 5:00 5:50 6:40 7:30 8:20 9:10 10:00 10:50 11:40 Figure 7: 24 hour 1mm nested storm hyetograph 12:30 Time 13:20 14:10 15:00 15:50 16:40 17:30 18:20 19:10 20:00 20:50 21:40 22:30 23:20 5 Guidelines for stormwater runoff modeling in the Auckland Region, Auckland Regional Council, 1999 Beca // 22 July 2009 // Page // NZ
25 6.1.2 Effects of climate change The possible effects of climate change on design rainfall have been assessed with reference to the Ministry of the Environment guidelines 6. Because the primary objective of the hydraulic modelling is the derivation of a 100 year ARI flood contour for the Travers Road catchment, a 2080 climate change scenario was assessed, using a mid-emissions, 3.8 degree Celsius temperature increase. The effect on the HIRDS rainfall figures is shown in Table 5. ARI Event (yrs) Percentage Rainfall Increase Existing HIRDS Rainfall Depths (mm) HIRDS Rainfall with Climate Change Uplift (mm) % % % % % Table 5: Climate change rainfall uplift for the HIRDS rainfall data 6.2 Hydraulic Model Build Source data for the hydraulic model came from WDC s GIS data, including pipe networks, land use types, DTM (derived from 20m contours) data and surveyed cross sections on the Travers Road stream. The survey in the Travers Road catchment was collected for this study and was surveyed in May The GIS data included pipe diameters but invert and manhole crest levels were missing; these have since been surveyed at the major intersections. As the WDC Stormwater pipe network data was incomplete, the MIKE network was simplified to single nodes and links in areas where pipe-manhole connections were unclear. Where survey data showing multiple pipe branches was obtained for manholes the largest diameter was used as it was unclear in what direction the flow would be taking. The Travers Road stream was represented using the surveyed cross sections (a plan showing the locations of the sections is shown in Appendix F). The culverts under Travers Road and the railway were represented as piped sections using survey data supplied by BBO (surveyed February 2009). In some areas the stormwater network data supplied by WDC was not connected to any outlets. In these cases overland flow was assumed from the surrounding catchments, represented by rectangular channels where flooding was not known to be an issue Hydrological Inputs Runoff catchments were delineated based on the contour data supplied by WDC. The catchment hydrology is based on the US Soil Conservation Society (SCS) methodology as outlined in the Auckland Regional Council document TP108. The SCS method makes use of initial abstraction (Ia) depths and runoff curve numbers (CN) to represent storm runoff. 6 Preparing for climate change: A guide for local government in New Zealand, Ministry for the Environment, 2004 Beca // 22 July 2009 // Page // NZ
26 Curve numbers were adopted based on soil and land use types in the catchment. Impervious areas are typically represented using a CN of 98, while heavy clay soils such as those in the Travers Road catchment can be represented using CN values between 70 and 80. The parameters used in the model are shown in Table 6. Because there are no flow gauges anywhere in the catchment hydrological calibration was not possible. However, a sensitivity analysis was conducted, looking at the effect of increasing the CN from 75 to 80 and comparing the peak flows at the railway bridge. These results are shown in Appendix E. Catchment Parameter Value Impervious area Pervious areas (including Travers Road catchment) Table 6: SCS parameters used in the hydrological model CN 98 Ia CN 75 Ia 1mm 5mm Time of concentration for the piped network was taken to be 10 minutes. For the Travers Road catchment times of concentration were calculated for the upstream cross section using several methods including Ramser-Kirpich, Bransby-Williams and US SCS. The Bransby Williams result (Tc of 24mins) was adopted because a Tc of 10mins (as calculated with the other two methods) is considered too short for a predominantly undeveloped catchment. The estimated Tc values are shown in Table 7. The Travers Road catchment area is approximately 1km 2. Method Ramser-Kirpich 0.19 Bransby Williams 0.40 US SCS 0.19 Table 7: Estimated Tc values for the Travers Road stream Time of Concentration (hours) ARI Event SCS Method Peak Runoff (m 3 /s) Regional Method 2 year year year Table 8: Peak runoff flows for the Travers Road catchment through the Railway Culvert Because no calibration or flow verification data is available for the Travers Road catchment, the modelled SCS flows have been checked against peak flows modelled using the Regional Method 7. As can be seen in Table 8 there are significant differences in the modelled flows, with the SCS results being considerably higher. Despite this, the modelled flows are believed. Large flows have been witnessed through the Travers Road stream and the road culvert has been overtopped. Although it is suspected the road culvert will have been partially blocked at the time, this would still 7 Flood Frequency in new Zealand A Regional Method, McKercher and Pearson, 1989 Beca // 22 July 2009 // Page // NZ
27 have required a large runoff volume (there is a depth of 3.6m between the stream invert and the road culvert). Reviewing the Regional Method maps, it doesn t appear to have used any catchments near the study area and was derived with data from large catchments, it therefore might not be applicable to the small Travers Road catchment Impervious Area The impervious area in each sub-catchment was estimated by approximating the number of standard residential and commercial sections and applying a fixed impervious percentage per section. An impervious value of 40% of each section area was used. This is considered to be conservative because housing and commercial areas in the village have extensive grounds. The total impervious area per sub-catchment was calculated by multiplying the total section area by the impervious percentage. This was represented as a separate runoff sub-catchment connected to the appropriate manhole. Item Value Total Road Length 9,133m Road Width Assumed 6m Approx. Number of Sections 310 Percent of each section as impervious 40% Average section Size 950m 2 Total Impervious Road Area 54,798m 2 Total Impervious Section Area 117,800m 2 Sum of the Total Impervious Area Table 9: Impervious Area Data ha Whangarmarino wetland Water levels in the Whangamarino wetland will have a backwater effect on flood levels in the Travers Road stream. The water level in the wetland was surveyed by BBO in December 2008, giving a water level at Te Kauwhata of being 7.20m RL. In light of any more detailed information on the water level this has been used as static downstream boundary condition. Because of this uncertainty over the wetland water level, a sensitivity analysis has been conducted, using static boundary conditions of 6.00, 7.50 and 8.00mRL. The results are outlined in Section Lake Waikare In the village, stormwater collected from south of the main ridge will drain south to Lake Waikare, as such a water level was needed as a downstream boundary condition for these stormwater pipes. A static water level boundary condition of 5.65mRL was used, this being at the maximum end of the normal operating range. It was decided not to use the 100 year flood level for the lake as a downstream boundary condition as the probability of a 100 year ARI lake level and 100 year ARI storm event occurring in coincidence is very low (0.0001%). Although the runoff from a 100 year storm across the Beca // 22 July 2009 // Page // NZ
28 catchment draining to Lake Waikare may induce a 100 year ARI water level, there would be a significant lag between peak discharge from the Te Kauwhata catchment and the peak lake level. 6.3 Model Verification No calibration data is available so the model has been verified against previous flood events. These events have been reported anecdotally approximate flood levels (which have been surveyed by BBO) are available, but not the peak flows. The verification events occurred in June 2005 and August 2008, so hourly rainfall from the Maungakawa rain gauge for these two months has been run through the model. Because of the very low amounts of rainfall in these months, the modelled runoff volumes and peak flows are low and the Travers Road culvert does not overtop. The peak water levels at the culvert for the two events are 8.18mRL for the June 2005 event and 9.09mRL for the August 2008 event. There are two possibilities why the large flood events could not be replicated; either there was some major blockage of the Travers Road culvert or there was more rainfall in Te Kauwhata than at Maungakawa. Culvert blockage is possible; during the site visit the culvert was heavily overgrown and in need of vegetation clearing. Anecdotal evidence suggests the railway culvert has also been overtopped. This seems unlikely. Although flood levels surveyed by BBO are high enough that the culvert could have been overtopped, the culvert has a large capacity and a very wide floodplain immediately upstream. None of the model runs (not even the future 100 year event with climate change) show the railway culvert overtopping. Because of the wide floodplain the change in flood level at the culvert between different return period events is small. During the site visit this culvert was also heavily overgrown (see photo 7, Appendix A) so blockage may have been a possibility, but is considered unlikely. Areas of known flood risk in the village have been identified by WDC. Although we have used a simplistic modelling approach and are not considering overland flow or flood depths, these known flood areas can be used to verify where the pipe network is under capacity. 6.4 Sensitivity Analyses Because of the lack of suitable calibration or verification data, a series of sensitivity analyses were done. These looked at the sensitivity of the model to runoff curve number, hydraulic roughness (representing vegetation growth in the Travers Road stream) and water level in the Whangamarino wetland Hydraulic Roughness These model runs looked at the sensitivity of the model results to changes in the Manning s roughness coefficient in the Travers Road stream. In places the stream is heavily overgrown and regular vegetation clearance will be necessary in future to maximise conveyance in the channel. The analysis considered roughness coefficients in the stream of (representing current conditions) and (representing the channel being overgrown). The analysis was run for the 100 year ARI current land use scenario using a pervious curve number of 75. The modelled water levels upstream of the culvert are shown in Table 10. This shows that the change in hydraulic roughness would have a significant effect on flood depths and peak water levels. Beca // 22 July 2009 // Page // NZ
29 Roughness coefficient Peak Water Level (mrl) Peak Flood Depth (m) Table 10: Roughness sensitivity analysis - water levels at Travers Road culvert Wetland Water Level These model runs looked at the sensitivity of water level and flow in the Travers Road stream to changes in water level in the Whangamarino wetland. These runs were necessary because of the uncertainty surrounding both the normal and design flood levels in the wetland. The main model runs used 7.20mRL as the boundary condition as this was the level surveyed by BBO. The model was run for water levels both higher and lower with results shown in Table 11. The analysis shows that the wetland water level has an effect on flood levels in the lower part of the Travers Road catchment, but this does not extend as far as the Travers Road culvert. Cross Section Ground Level (mrl) Peak Water Level (mrl) Peak Flow (m 3 /s) 6.0m 7.2m 7.5m 8.0m 6.0m 7.2m 7.5m 8.0m Section B Section C Section D Section E Table 11: Wetland water level sensitivity analysis Note: The water level at section D for the 8.0m water level model run is above the culvert soffit, resulting in a reduced peak discharge through the culvert 6.5 Model Results - Travers Road Catchment The key design event in the Travers Road catchment is the 100 year ARI storm and resulting flood levels. This flood level is needed to set minimum floor levels for future development in the catchment, but other ARI events have also been modelled. Peak water levels are shown in Table 12. Important locations are cross sections B and B2, which are located immediately up and downstream of the Travers Road culvert respectively. Sections D and D2 are located immediately up and downstream of the railway culvert respectively. The results confirm that the Travers Road culvert acts as a major constriction to flood flows in the catchment, with the backwater effect upstream of the culvert causing significant ponding on the floodplain. Model Chainage (m) Ground Level (mrl) 2 Year ARI (mrl) 5 Year ARI (mrl) 10 Year ARI (mrl) 50 Year ARI (mrl) 100 Year ARI (mrl) Cross Section Section A Section B Section B Section C Section D Beca // 22 July 2009 // Page // NZ
30 Model Chainage (m) Ground Level (mrl) 2 Year ARI (mrl) 5 Year ARI (mrl) 10 Year ARI (mrl) 50 Year ARI (mrl) 100 Year ARI (mrl) Cross Section Section D Section E Table 12: Modelled Water Levels in the Travers Road Catchment Ponding is occurring upstream of the Travers Road culvert for all modelled storm events, with a peak 100 year ARI water level of 10.41mRL. The road crest level is 10.94mRL so the road is not overtopped during any of the design events, despite anecdotal reports that this has happened in the past. The modelled water levels at the railway culvert are not as high as those that have been reported, indeed the peak water level during a 100 year ARI event is significantly lower than the crest of the railway embankment and only just surcharges the culvert. This is likely due to the large size of the culvert (approximately 5x2m), which give sufficient capacity to pass the design event even with the presence of vegetation. From these results it would appear that the Travers Road culvert is undersized for large events, and although the road is not overtopped it is worth noting that the floodplain would be inundated up and downstream for a 10 year event and above. The peak modelled flows through the Travers Road and railway culverts are shown in Table 13. The 100 yr ARI flood outline is shown in Appendix B. Culvert Peak Discharge (m 3 /s) 2yr ARI 5yr ARI 10yr ARI 50yr ARI 100yr ARI Travers Road Railway Table 13: Modelled flows through the culverts, Travers Road catchment 6.6 Model Results Te Kauwhata Village The existing piped system in the village has been assessed against a 5 year ARI design event to assess the current level of service. As specified by WDC, the design capacity for stormwater reticulation should be the 5 year ARI storm for residential areas and 10 year ARI storm for rural areas. Despite simplifications to the model (removal of small diameter pipes, etc) it appears there are several areas where the piped system is under capacity. Of the manholes surveyed the model predicted that manhole 22, 19, 11, 15, 16, 18, 2, 3, 6, 7 and 8 would have their ground levels exceeded during a 5 Year event. The WDC indicated that flooding was prone in the areas around manhole 6, 14 and 11, and this is likely correct as they deal with large volumes of impervious flow from multiple catchments. All catchments were assumed to connect directly to nodes through kerb and channel drainage however it must be noted that the existing stormwater network shown in the provided GIS data is more complex than that replicated in the model. This combined with the exclusion of unknown overland flow paths has likely overestimated the volume of water entering the Stormwater network and therefore exaggerated the number of manholes suffering from overtopping. Beca // 22 July 2009 // Page // NZ
31 An example of this is on Eccles Avenue where the model features a 300mm pipe draining the area through manholes 1, 2 and 3. The pipe size appears to cause the flooding of manholes 2 and 3 however in reality the gradient of this sub-catchment is likely to encourage overland flow. 6.7 Conclusion A MIKE Urban hydraulic model was developed to assess the Travers Road area floodplain extent and the level of service of the piped stormwater network. The model was run for the 2, 5, 10, 50 and 100 year ARI storm events with a nested 24hr duration storm. Due to a lack of suitable data the model could not be calibrated, although verification against two flood events in the Travers Road area was attempted. Two months of hourly data from the Mangakawa rain gauge were run through the model, but the overtopping of the Travers Road culvert could not be replicated. It is assumed that if this culvert overtops it will be due to partial blockage. Modelling of the urban centre has shown the pipe system is under capacity in a number of places. Because of the uncertainty surrounding several model inputs (particularly wetland water levels) several sensitivity analyses have been done. These have shown the model (in the Travers Road area) to be sensitive to hydraulic roughness but not water level in the wetland. 7 Anticipated Future Stormwater Effects The hydraulic model has also been used to look at the effects of future urban development and climate change on the catchment, particularly flood levels in the Travers Road catchment and pipe capacities in the village. 7.1 Identification of Urban Growth Future urban development has been identified using the Te Kauwhata structure plan and in consultation with WDC staff. Maps showing the current and future land use (including urban growth) are included in Appendix B. The main area for future development is the Travers Road catchment, where residential development is planned for 80% of the catchment. A light industrial zone to the south of the current urban centre is also planned, as are residential developments in the Blunt Road peninsula to the north of the village and to the west near the golf course. Expansion of the commercial area in the urban centre, adjacent to the railway line is also planned. All of these developments will results in increased impervious extents, with subsequent impacts on stormwater quality and quantity. In the hydraulic model only stormwater quantity has been considered. 7.2 Future Scenario Hydraulic Model The future scenario hydraulic model is essentially the same as the existing scenario, but includes additional impervious surfaces to represent future urban growth. These have been included by changing the relative pervious and impervious areas for the Travers Road runoff sub-catchments and including new sub-catchments representing the Blunt Road sub-division and light industrial development. As such the total catchment area has increased (the Blunt Road and industrial areas were not included in the current scenario model because they currently have no development or stormwater infrastructure). The future scenario model has been run using both current and climate change rainfall. Derivation of the climate change rainfall is outlined in Section Future impervious coverage was estimated based on the land use types and impervious coverage shown in Table 14. As the road layout has not yet been defined, an additional 5% impervious area Beca // 22 July 2009 // Page // NZ
32 was added onto the amount estimated for each land use type (this additional 5% is included in the figures given in Table 14). Zone Impervious % Future Light Industrial Zone 85% Rural Lifestyle Block 40% Future Residential Area 20% Table 14: Impervious coverage used in the future hydrological model The model was reconfigured to include the new areas of development such as the country living zone, future residential and light industrial areas. Where these were present close to either the Wetland or the Lake they were connected directly to the model outlets rather than the Travers Road stream or piped network. Area (ha) Pervious Impervious Total Existing Future Figure 8: Comparison of total pervious and impervious areas between the existing and future scenario models for the Travers Road Catchment Although the future development scenario increases the overall catchment size due to the additional development on the peninsular and to the west below the Travers Road Catchment, the overall amount of imperviousness increases with the conversion of parts of the urban centre to light industrial. The Travers Road Catchment sees a large increase in impervious area with a corresponding decrease in pervious area. This will result in increased discharge to the Travers Road Stream along with decreased time of concentration. 7.3 Change in Runoff Volumes These proposed land use changes to the north, west and south are likely to generate significant additional runoff. However as these areas will discharge to the wetland and the lake they will have less impact (in terms of required attenuation) than the changes to the Travers Road catchment, where the presence of the Travers Road stream as the receiving environment will require flow attenuation. No flow attenuation has been included in the model. Beca // 22 July 2009 // Page // NZ
33 Because of the significant increase in impervious surfaces shown in Figure 8 total runoff volumes from the catchment can be expected to increase significantly. This increase in runoff is shown in the model, with Figure 9 and Table 15 showing the runoff changes for both the future land use and future land use with climate change rainfall scenarios. The inclusion of climate change rainfall has a significant effect on runoff because design rainfall depths increase by up to 25%. The changes in land use have the greatest effect on the small storm events with the 2 Year seeing a 74% increase in runoff over the existing. With the inclusion of climate change this grows to 144% 900, ,000 Cummulative Runoff (m3) 700, , , , , , , Year ARI 5 Year ARI 10 Year ARI Storm Events 50 Year ARI 100 Year ARI Existing Landuse Future Landuse Future Landuse with Climate Change Figure 9: Increase in total runoff volumes for the future scenario models Model Scenario Increase in Total Runoff Relative to the Current Scenario (%) Future land use Future land use and climate change rainfall yr ARI 5yr ARI Table 15: Percentage increase in total runoff for future scenarios 10yr ARI 50yr ARI 100yr ARI 7.4 Future Effects on the Travers Road Stream The future development model for the Travers Road catchment indicates that the water levels will increase along the length of the stream, and at Travers Road itself the levels will exceed the road level when they reach 10.94mRL. The breadth of flooding in the cross sections will increase substantially upstream of the Travers Road Culvert with ponding increasing the water level to Beca // 22 July 2009 // Page // NZ
34 11.14mRL under the climate change scenario. Conversely downstream flood levels only increase by a few centimetres as the Railway Culvert is able to remove large flows. It is worth noting that Section C, D and E are relatively flat so even small increases may increase the flooded area substantially. The total discharge also increases for the future scenario, with the greatest change being an increase of 3m 3 /s being just downstream of the Railway Culvert Cross Section Ground Level (mrl) Peak Water Level (mrl) Existing Future Future CC Peak Discharge (m 3 /s) Existing Future Future CC A B B C D D E Table 16: Comparison of existing and future model results for Travers Road (100yr ARI only) 7.5 Future Pipe Network Capacity As the capacity of the pipe network is currently exceeded in several place by a 5 Year ARI event it is likely that without modification the risk of flooding will increase substantially. This is illustrated by the difference in cumulative water volume falling in the catchment. The key areas requiring expanded capacity above what is already required are likely to be around the industrial zones within the urban centre. Without an increase in capacity the flooding in the urban centre is likely to become more frequent even if only minor development occurs. The future network results can be found in Appendix E. 7.6 Conclusion The anticipated future stormwater effects have been analysed using the MIKE Urban hydraulic model developed for the existing situation, but with the inclusion of anticipated urban growth and possible climate change rainfall. The extent of urban growth was assessed using the structure plan documents with climate change rainfall based on the Ministry of the Environment guidelines. As would be expected, the model shows significant increases in both peak and total stormwater runoff when compared to the existing situation. No stormwater attenuation devices have been included in the model so the future results have not been mapped, but they do illustrate the need for stormwater management in the future. 8 Stormwater Management Options The previous sections have outlined how the catchment is likely to change in the future and the potential effects on stormwater quantity. This section outlines ways in which the additional stormwater (that will be generated through increased imperviousness and potentially greater rainfall) can be managed, both for a quality and quantity perspective. Beca // 22 July 2009 // Page // NZ
35 Management option in both the Travers Road catchment and the current urban centre are discussed. 8.1 Options for Management of the Travers Road Stream Corridor The hydraulic modelling has indicated that the Travers Road floodplain is approximately 95m wide at Travers Road. This is an extensive floodplain which could be developed entirely as open space and for recreation. The future floodplain has not been mapped, but with the increased imperviousness in the catchment, it will be more extensive than it is at present. Council have expressed a desire to minimise the floodplain extent where possible, while still retaining open space. The following options could be investigated for reduction of the floodplain extent. Vegetation clearance in the channel At present the stream channel is heavily overgrown, which impacts on the channel capacity and conveyance. The hydraulic model sensitivity runs have shown that channel and floodplain roughness will have a significant effect on water levels, so one option to consider would be regular maintenance (e.g. vegetation clearance) of the channel. If the floodplain is to be developed as public open space, it would be preferable (from a flooding perspective) to make sure the site is easily maintainable, which could mean including areas of short grass. To maximise floodplain conveyance, it would also be preferable to avoid, or at least minimise the extent of large trees within the floodplain. This would also have amenity benefits, such as allowing kite flying in the area. Upgrade of the Travers Road Culvert The hydraulic modelling has shown that the Travers Road culvert acts as a major constriction point during both regular as well as extreme flood events, causing a significant backwater effect upstream. The culvert does not have sufficient capacity and could be upgraded, either to a single larger diameter pipe or with the inclusion of a second 1200mm diameter pipe. The effect of changing the culvert size has not been investigated using the hydraulic model. Inclusion of Attenuation Storage Regular maintenance of the channel and floodplain, along with an upgrade of the Travers Road culvert would likely reduce the extent of the existing 100 year ARI floodplain. However, with future development in the catchment and additional runoff, further measures may be needed. Section outlines general stormwater management options for the catchment, which could include the use of storage in the upper catchment. Dry stormwater attenuation ponds could be developed along the floodplain margin, which would attenuate peak flow in the stream. These could be landscaped into any open space or public reserve that is designated along the stream margin. 8.2 Urban Stormwater Management Options The structure plan documents include a report by DJ Scott and Associates 8 outlining stormwater mitigation options. The purpose of this report is to provide a background on available stormwater management techniques, establish a framework for low impact design in the structure plan and outline design principals and considerations. There is some overlap between the DJ Scott report and the options analysis contained in this report, although the objective here is to build on the options put forward by DJ Scott and apply them to the structure plan area. 8 Te Kauwhata Structure Plan: Low Impact Stormwater Design and Management Framework, DJ Scott and Associates, April 2009 Beca // 22 July 2009 // Page // NZ
36 Water sensitive and low impact urban design is outlined as a requirement of future development in the Waikato sub-regional development plan Future Proof. There is a preference that stormwater runoff be managed at source wherever possible; this implicitly favours management options such as rain tanks, swales and rain gardens above detentions ponds or wetlands, which are typically downstream options. In the structure plan area there are both point and diffuse (non-point) sources of stormwater pollutants; diffuse pollutant sources include agricultural runoff, but diffuse pollutants can also originate from urban areas, for example roads. Pollutant concentrations are highest following the first few millimetres of rain, when accumulated pollutants are washed off impervious surfaces. Stormwater treatment devices are designed to treat this so called first flush of pollutants, but because of the sensitivity of the receiving environment around Te Kauwhata a higher level of treatment will be required. In this case a stormwater treatment train including several stages of treatment should be used. Waikato District Council want to adopt a set of stormwater design guidelines and treatment standard for the Te Kauwhata structure plan area. Environment Waikato is in the process of adopting ARC TP10 as it s formal design guideline and this is the most obvious standard for WDC to consider. However thought should be given to other guidelines and standards. ARC TP10 is frequently used outside of Auckland, but it needs to be remembered that it is a toolbox of options and does not prescribe one treatment method over another. The guidelines were designed for the Auckland Region where the primary stormwater concern is discharge of sediment into the Waitamata Harbour; the management options given in TP10 can be used to remove other contaminants, particularly if a series of management options are used in sequence (the treatment train option). Sediment removal will be important in the structure plan area but the removal of other pollutants (such as heavy metals) will also be important and should not be overlooked. Christchurch City have also produced a stormwater design guideline; this outlines methods of estimating pollutant loads and designing suitable treatment. It is important that WDC confirm the primary concern of stormwater treatment and what pollutants are to be removed; the adoption of TP10 and specifying that 75% of suspended sediment be removed is unlikely to meet the beyond best practice management required for the wetland. The use of ARC TP10 in the design of a treatment train may be the way forward, but the selection of management options will need to be carefully chosen General Stormwater Options The DJ Scott stormwater report outlines the advantages and disadvantages of a range of low impact design and stormwater treatment options. Some of these options are applicable to the structure plan area, while others may not be so appropriate. Reducing the total impervious area of a development is a planning tool for reducing the volume of stormwater runoff. This would favour higher intensity development that would reduce the total footprint of the development. In the structure plan area this may not be an option; impervious limits for given development types (i.e. residential, rural residential etc) have been set and land has been zoned, although it may still be feasible to specify in the structure plan a maximum impervious percentage per sub-division lot (for example, this could reduce the extent of paving in gardens and be used to maintain a rural character). Because of the heavy clay soils in the area and high groundwater levels around the wetland, soakage may not be a feasible stormwater management option in the structure plan area, although it is recommended that their use be investigated. It may be possible to use soakage for residential developments in the upper Travers Road catchment; housing densities in this area will be low as will the total impervious runoff volume. This option could be used in conjunction with rainwater harvesting. Beca // 22 July 2009 // Page // NZ
37 8.2.2 Travers Road Stormwater Options Because of the existing flood risk in the Travers Road catchment, it is important that stormwater management be considered from both a water quality and quantity perspective. A treatment train solution should still be implemented, but more detention will be required than in the Blunt Road area. At the head of the treatment train, it is recommended that new developments consider installing (or the structure plan be worded to specify the use of) rain water storage tanks. Storage tanks can be used to collect runoff from rooftops and other raised impervious surfaces and will have the effect of reducing the effective impervious area for each site. The main benefit from using tanks will be a reduction in stormwater flows downstream, both for flood peaks and total runoff volume. The use of tanks will also fit within the Future Proof preference for environmentally sensitive design, as they can reduce the potable water demand by providing a water source for toilet flushing, garden watering etc. The storage volume of the tank will need to be carefully considered during the design process and will need to take account of the potable water demand and likely recharge volume; for them to provide effective flow attenuation tank overflows (excluding the design first flush overflow) should be minimised. Tanks do not provide much benefit with regard to water quality as they are designed so the first flush bypasses the tank so usable water is not contaminated. There will also be times when the tanks are full and they provide no flow attenuation, so they will need to be used in conjunction with other stormwater management options. The WDC road design principals recommend the use of swales for road drainage. They should be used where possible, although gradients in some parts of the catchment may prevent their use. Raingardens can be used in the lower catchment where there are likely to be wider roads. They could also be used in the centre of sub-divisions as has already been done in the south of town (Photograph 2). These could either be constructed of rock and gravel, which would provide an attenuation benefit and provide filtration, or could include vegetation and be designed as rain gardens. Dry ponds could be included in any open space or reserve. The contours of the reserve could be designed so that the purpose of the dry pond is not obvious. Because of the likely build up over time of contaminants in the base of the dry pond, they are not recommended for frequent use in amenity areas. It may be a better solution to use dry ponds as the downstream treatment option and develop them adjacent to the Travers Road stream they could then be incorporated into the stream landscape plan. Beca // 22 July 2009 // Page // NZ
38 Figure 10: Proposed stormwater treatment train for the Travers Road catchment Blunt Road Stormwater Options Stormwater from the Blunt Road developments will drain directly to the Whangamarino wetland without passing through any other waterways. Unlike the Travers Road catchment there won t therefore be any need for flow attenuation; all the focus for stormwater management will be on stormwater quality. Constructed wetlands are recommended as the final stage in the treatment train for this area. As stormwater will be discharged to the Whangamarino wetland, they could be constructed around the wetland margin in the small inlets of the Blunt Road peninsula, where they could form extensions of the wetland, while being physically separated. The wetlands could be constructed so they have an overflow weir to the wetland, this would avoid the need for a piped outlet that could become clogged and may need erosion protection. The high groundwater levels in the area would maintain a suitable water level for the wetlands and they could be landscaped so they fit the natural environment. The required number and sizes of the wetlands is beyond the scope of this study and will be dependant upon the final residential density, impervious cover and sub-division layout; this will all be determined by the sub-division developer. It is recommended that the feasibility of using soakage in the Blunt Road area be investigated. This will be dependant on groundwater levels in the area, which may be too high given the proximity to the Whangamarino wetland. There is an existing stormwater pond on Blunt Road. This was inspected during the site visit and looks to have excess capacity given the size and impervious cover of the catchment it is treating, although this has not been confirmed. Depending on ground levels, it may be an option to utilise any excess capacity in this pond so as to centralise treatment in the area. The feasibility of this option would be dependant on final ground levels (which will determine if swales can be used to drain to the pond) and pipe costs. Beca // 22 July 2009 // Page // NZ
39 Figure 11: Proposed stormwater treatment train for the Blunt Road area Industrial Area Stormwater Options Some development is planned for the south of the structure plan area, around the light industrial area (this development will include the bypass road). Because of the higher impervious extent and subsequent pollutant generation, low impact design techniques may not be appropriate. Downstream treatment options such as sand filters would provide better treatment. It is recommended that swales still be used for road drainage in this area. 8.3 Conclusion It is important that future stormwater management make use of a treatment train type approach. This is essential because of the sensitivity of the Whangamarino wetland, which will be the receiving environment for most new developments. Although a treatment train approach should be used through the structure plan area, the techniques will need to differ between the Travers and Blunt Road areas. In the Travers Road area both water quality and quantity will need to be considered, whereas around Blunt Road water quality will be more important. With future development the Travers Road stream floodplain can be expected to increase. Options that could be used to maintain or minimise the current extent include vegetation clearance in the channel and increasing the capacity of the Travers Road culvert. These options are additional to the stormwater treatment train. 9 Implementation 9.1 Effectiveness of the District Plan The proposed district plan provides, at present, a minimum level of site specific controls at the time of subdivision. These controls generally require the subdivision to be in accordance with the engineering standards included in Appendix C which in turn links in the Hamilton City Design Manual. The district plan also adopts controls around the use and development of sites, restricting the total area of coverage and imperviousness to a percentage of the area of the individual site. Traditionally developers have adopted hard engineering solutions to stormwater management. Whilst these solutions have their place and meet the necessary requirements for the detention of stormwater associated with the subdivision; amenity often gives way to functionality. It is expected Beca // 22 July 2009 // Page // NZ
40 that the structure plan will provide an improved policy framework. The framework will provide guidance with respect to stormwater management not only to the developers, but will also allow for a larger scale planning assessment to be undertaken by Council planners. This planning assessment will ensure that there is clear integration with the key community attributes such as open space and the Whangamarino wetland margins. The provisions of the plan need to allow sufficient flexibility in design to provide an opportunity to implement innovative solutions to stormwater management whilst retaining sound engineering principles. It is recommended that consideration be given to a specific zone or policy overlay, which could take the form of a GIS layer on the structure plan maps showing potential blue/ green corridors or integrated open space. This will allow strategic links through the catchment to be achieved and taken into account during subdivision and development. These areas should have a specific set of rules around the use of the area including stormwater management, recreation, walking, cycling, and vegetative enhancement. This process has been adopted successfully by Manakau City Council for the Flat Bush growth area and in the Built Environmental strategy for Western Bay of Plenty District Council. Consideration could also be given to the social implications such as public health, crime reduction from open space areas. 9.2 Catchment Management Implementation The implementation of Stormwater management could be carried out as follows: Clearing of the Travers Road Culvert and Railway Culvert to reduce the culvert roughness and increase overall size. Digging out and weeding of the Travers Road Stream to increase carrying capacity and reduce roughness Implementation of the Wetland protection zone on Blunt Road before development occurs Assessment of the entire existing Stormwater network to determine its current state Upgrading of the existing urban Stormwater network Installation of detention ponds so development occurs around them in pre-defined areas to maximise the aesthetic values and prevent encroachment if the installation was carried out after development. Upgrading the Travers Road Culvert to a larger diameter pipe 10 Conclusions The Whangamarino wetland is a pristine environment and will require careful planning and management of stormwater discharges to ensure it remains that way in the future. The other stormwater receiving environments in the structure plan area (Lake Waikare and the Travers Road stream) are degraded but there is the possibility that their ecological value could be improved, this is particularly the case with the stream, which could be developed into a landscaped reserve. The catchment management plan and hydraulic modelling has confirmed there is a flood risk in the Travers Road catchment. Anecdotal evidence suggests that the Travers Road culvert acts as a major constriction on flow and causes a backwater effect upstream. Although overtopping of the Beca // 22 July 2009 // Page // NZ
41 culvert could not be replicated with hydraulic modelling, the study has confirmed that the lack of capacity through the culvert is a major cause of flooding in the upper catchment. With future development in the structure plan area and the possibility of climate change affecting rainfall patterns, the volume of stormwater runoff is expected to increase. Urban development will likely also see an increase in stormwater contaminants. It is therefore essential that an integrated approach is taken to stormwater management, such as the development of a stormwater treatment train, treating stormwater at source and improving the water quality prior to discharge. In the Travers Road area water quantity will also need to be managed to help minimise the extent of the 100 year ARI floodplain. Stormwater management will also need to consider amenity and community issues. This may require stormwater management devices to be landscaped into open spaces or reserves 11 Recommendations We recommend the following actions in the Te Kauwhata and Travers Road catchments: Adoption of a treatment train stormwater management approach, which takes account of stormwater quantity and quality in the Travers Road catchment and stormwater quality in the Blunt Road area. The treatment train should seek to manage stormwater as close to source as possible, with dry ponds and constructed wetlands used for final polishing prior to discharge; Regular maintenance of the Travers Road stream, including clearance of vegetation. This will maintain the hydraulic capacity of the channel and should help reduce the floodplain width; Regular maintenance of the railway culvert, including vegetation clearance; Replacement of the Travers Road culvert with either a single larger diameter culvert or the addition of a second 1200mm diameter pipe. This should reduce the flow constriction at Travers Road and reduce the peak flood levels upstream of the road. Beca // 22 July 2009 // Page // NZ
42 References Auckland Regional Council (1999), Technical Publication Guidelines for Stormwater Runoff Modelling in the Auckland Region Auckland Regional Council (2000), Technical Publication 124 Low Impact Design Manual for the Auckland Region Auckland Regional Council (2003), Technical Publication 10 - Stormwater Management Devices: Design Guidelines Manual Boffa Miskell (2009), Te Kauwhata Structure Plan Assessment of Ecological Values Christchurch City Council (2003), Waterways, Wetlands and Drainage Guide, Part B: Design Coulter and Hessell (1980), The Frequency of High Intensity Rainfalls in New Zealand, New Zealand Meteorological Service Department of Conservation (1992), Whangamarino wetland factsheet Department of Conservation (2007), The Economic Values of the Whangamarino Wetland DJ Scott Associates Limited (2009), Low Impact Stormwater Design and Management Framework, Te Kauwhata Structure Plan Manakau City Council (2004), Flat Bush Catchment Management Implementation Plan Version A6 McKercher and Pearson (1989), Flood Frequency in New Zealand A Regional Approach Ministry for the Environment (2004), Preparing for Climate Change, A Guide for Local Government in New Zealand Ministry for the Environment (2006), Incorporating Climate Change Predictions into Engineering Design Munro (1998), The Waikato Regional Flood Event of July 9-20 th July 1998, in The Australasian Journal of Disaster and Trauma Studies, Volume: NIWA (2000), Technical Report 73 Index to Hydrological Recording Sites in New Zealand Tonkin and Taylor (2009), Te Kauwhata rezoning and ground contamination desktop study Waikato District Council (2009), Te Kauwhata Structure Plan Draft Road Design Principals Waikato District Council (2003), Te Kauwhata Community Plan Our Village, Our Future Western Bay of Plenty District Council (2007), Interim Built Environment Strategy Phase 1 Beca // 22 July 2009 // Page // NZ
43 Appendix A Site Visit Photos
44 Photograph 1: The upper Travers Road catchment, looking east towards Te Kauwhata and the Whangarmerino wetland Photograph 2: Stormwater treatment device located on Roto Street
45 Photograph 3: Looking west from Swan Road across open fields to the north of Te Kauwhata (the golf course is to the right of the photo) Photograph 4: The stormwater treatment pond located at the recent Blunt Road sub-division
46 Photograph 5: The southern stormwater piped outlet and open drain to Lake Waikare Photograph 6: The property located on the corner of Mahi Road and Saleyard Road; this property is regularly inundated
47 Photograph 7: The outlet of the railway bridge, Travers Road catchment Photograph 8: The inlet of the railway bridge, Travers Road catchment
48 Photograph 9: Travers Stream immediately upstream of the railway bridge, looking west Photograph 10: Open fields adjacent to the intersection of Te Kauwhata Road and Eccles Avenue; this area is regularly inundated
49 Photograph 11: Travers Stream immediately upstream of the Travers Road culvert, looking west Photograph 12: Travers Stream immediately downstream of the Travers Road culvert, looking east
50 Appendix B Catchment Maps
51 Job # : Whangamerino Wetland Legend SUB-CATCHMENT FLOW DIRECTION RAIL NETWORK ROAD NETWORK SUB-CATCHMENT BOUNDARY PARCEL BOUNDARY WATER COURSE GIS@BECA.COM Northern Catchment P:\325\ \100\TGI\55_Workspaces\01_mxd\Catchment_Boundary_Map_FigureB1.mxd Created: 21/05/09 Printed: 05/06/09 Author: AR Travers Road Stream Travers Road Catchment NORTH ISLAND MAIN TRUNK Southern Catchment Lake Waikare Contains Crown Copyright Data. Crown Copyright Reserved. ± This map contains data derived in part or wholly from sources other than Beca, and therefore, no representations or warranties are made by Beca as to the accuracy or completeness of this information. Data displayed on this map is indicative only and may require confirmation by other means. Map intended for distribution as PDF document. Scale may be incorrect when printed. Te Kauwhata CMP Figure B1 : Catchment Boundaries and Stormwater Receiving Environments Scale 1:15,000 at A3
52 SWAN ROAD Job # : PADDY ROAD HAWKE ROAD Legend 20m CONTOUR SUB-CATCHMENT BOUNDARY RAIL NETWORK VINEYARD ROAD Northern Catchment GIS@BECA.COM P:\325\ \100\TGI\55_Workspaces\01_mxd\Catchment_Topography_Map_FigureB2.mxd Created: 26/05/09 Printed: 05/06/09 Author: AR RODDA ROAD WAYSIDE ROAD PLANTATION ROAD SH 1 40 HOHERIA PLACE ORCHARD ROAD MOORFIELD ROAD TE KAUWHATA ROAD TRAVERS ROAD Travers Road Catchment NORTH ISLAND MAIN TRUNK ECCLES AVENUE SALEYARD ROAD MAIN ROAD APARANGI DRIVE WIRA STREET EASTFIELD WAERENGA ROAD SCOTT ROAD BLUNT ROAD MAHI ROAD 20 KOWHAI PLACE RIMU STREET MERLOT PLACE RATA STREET Southern Catchment 20 ROTO STREET 20 Lake Waikare This map contains data derived in part or wholly from sources other than Beca, and therefore, no representations or warranties are made by Beca as to the accuracy or completeness of this information. Data displayed on this map is indicative only and may require confirmation by other means. Contours generated from data supplied by Waikato District Council. Contains Crown Copyright Data. Crown Copyright Reserved. Map intended for distribution as PDF document. Scale may be incorrect when printed. ± Te Kauwhata CMP Figure B2 : Catchment Topography Scale 1:15,000 at A3
53 SWAN ROAD Job # : PADDY ROAD Whangamerino Wetland HAWKE ROAD Legend LIVING ZONE FUTURE LIVING ZONE COUNTRY LIVING ZONE COMMUNITY FACILITY RECREATION ZONE LANDSCAPE PROTECTION AREA RURAL ZONE GIS@BECA.COM VINEYARD ROAD LIGHT INDUSTRIAL ZONE RAIL NETWORK BLUNT ROAD RODDA ROAD P:\325\ \100\TGI\55_Workspaces\01_mxd\Existing_Land_Use_Map_FigureB3.mxd Created: 22/05/09 Printed: 05/06/09 Author: AR WAYSIDE ROAD PLANTATION ROAD SH 1 HOHERIA PLACE ORCHARD ROAD MOORFIELD ROAD TE KAUWHATA ROAD TRAVERS ROAD NORTH ISLAND MAIN TRUNK ECCLES AVENUE SALEYARD ROAD MAIN ROAD APARANGI DRIVE WIRA STREET EASTFIELD WAERENGA ROAD SCOTT ROAD MAHI ROAD KOWHAI PLACE RIMU STREET MERLOT PLACE RATA STREET ROTO STREET Lake Waikare This map contains data derived in part or wholly from sources other than Beca, and therefore, no representations or warranties are made by Beca as to the accuracy or completeness of this information. Data displayed on this map is indicative only and may require confirmation by other means. Land use data supplied by Brewer Davidson Ltd. Contains Crown Copyright Data. Crown Copyright Reserved. Map intended for distribution as PDF document. Scale may be incorrect when printed. ± Te Kauwhata CMP Figure B3 : Existing Land Use Scale 1:15,000 at A3
54 SWAN ROAD Job # : PADDY ROAD Whangamerino Wetland HAWKE ROAD Legend LIVING ZONE FUTURE LIVING ZONE COUNTRY LIVING ZONE BUSINESS ZONE RECREATION ZONE LANDSCAPE PROTECTION ZONE RURAL ZONE GIS@BECA.COM VINEYARD ROAD MIXED USED ZONE EXISTING LIGHT INDUSTRIAL ZONE NEW LIGHT INDUSTRIAL ZONE RAIL NETWORK RODDA ROAD P:\325\ \100\TGI\55_Workspaces\01_mxd\Proposed_Land_Use_Map_FigureB4.mxd Created: 26/05/09 Printed: 29/06/09 Author: AR WAYSIDE ROAD PLANTATION ROAD SH 1 HOHERIA PLACE ORCHARD ROAD MOORFIELD ROAD TE KAUWHATA ROAD TRAVERS ROAD NORTH ISLAND MAIN TRUNK ECCLES AVENUE SALEYARD ROAD MAIN ROAD APARANGI DRIVE WIRA STREET EASTFIELD WAERENGA ROAD SCOTT ROAD BLUNT ROAD MAHI ROAD KOWHAI PLACE RIMU STREET MERLOT PLACE RATA STREET ROTO STREET Lake Waikare This map contains data derived in part or wholly from sources other than Beca, and therefore, no representations or warranties are made by Beca as to the accuracy or completeness of this information. Data displayed on this map is indicative only and may require confirmation by other means. Land use data supplied by Brewer Davidson Ltd. Contains Crown Copyright Data. Crown Copyright Reserved. Map intended for distribution as PDF document. Scale may be incorrect when printed. ± Te Kauwhata CMP Figure B4 : Proposed Land Use Scale 1:15,000 at A3

55 Job # : Disclaimer: Contains Crown Copyright Data. Crown Copyright Reserved. Due to lack of suitable elevation data, flood levels and floodplain extents have been interpolated between cross sections. The floodplain extent between cross sections is indicative only and has been drawn using spot height survey data. This map contains data derived in part or wholly from sources other than Beca, and therefore, no representations or warranties are made by Beca as to the accuracy or completeness of this information. Data displayed on this map is indicative only and may require confirmation by other means. Map intended for distribution as PDF document. Scale may be incorrect when printed. BLUNT ROAD Section D Qmax 6.06m3/s Hmax 7.82mRL GIS@BECA.COM ORCHARD ROAD MOORFIELD ROAD SECTION D SECTION E P:\325\ \100\TGI\55_Workspaces\01_mxd\Flood_Contour_Map_FigureB5.mxd Created: 04/06/09 Printed: 24/06/09 Author: AR Section A Qmax 4.94m3/s Hmax 10.84mRL SECTION A TRAVERS ROAD Section B Qmax 7.63m3/s Hmax 10.41mRL SECTION B1 SECTION B Section B1 Qmax 4.39m3/s Hmax 8.91mRL SECTION C Section C Qmax 5.40m3/s Hmax 8.52mRL JACKWAY RISE ECCLES AVENUE Section E Qmax 11.64m3/s Hmax 7.81mRL TOTARA PLACE NORTH ISLAND MAIN TRUNK TE KAUWHATA ROAD SALEYARD ROAD MAIN ROAD BAIRD AVENUE SCOTT ROAD PILGRIM PLACE WIRA STREET WAERENGA ROAD MAHI ROAD AMO STREET Scale 1:5,000 at A3 ± Te Kauwhata CMP Figure B5 : Travers Road 100 Year ARI Flood Extent Legend FLOOD CONTOUR m 100 YEAR FLOODPLAIN
56 Job # : Whangamerino Wetland # # # Legend RAIL NETWORK # OUTLETS!(!( R NODE - NO FLOODING NODE - FLOODING IN EXISTING MODEL SWAN ROAD NODE - FLOODING IN FUTURE LANDUSE MODEL LINKS GIS@BECA.COM!(!(!( RIBBONWOOD CLOSE!( GREEN ACRES DRIVE MOORFIELD ROAD TRAVERS ROAD NORTH ISLAND MAIN TRUNK LAKE WAIKARE P:\325\ \100\TGI\55_Workspaces\01_mxd\Existing_Services_Map_FigureB6.mxd Created: 20/07/09 Printed: 21/07/09 Author: AR!( ARKLE AVENUE ECCLES AVENUE 2!(!(!( 50 63!( TOTARA PLACE 3 TE KAUWHATA ROAD SALEYARD ROAD!(!( BAIRD AVENUE MAIN ROAD 7 6!(!(!(!( SCOTT ROAD WIRA STREET 8 11 AMO STREET!( BLUNT ROAD MAHI ROAD!( 14 R RATA STREET 16!( 15!( 58!( WAERENGA ROAD 18 RIMU STREET!(!(!(!(!( # MERLOT PLACE 22 ROTO STREET!( # 98 Lake Waikare Scale 1:7,500 at A3 Contains Crown Copyright Data. Crown Copyright Reserved. ± This map contains data derived in part or wholly from sources other than Beca, and therefore, no representations or warranties are made by Beca as to the accuracy or completeness of this information. Data displayed on this map is indicative only and may require confirmation by other means. Map intended for distribution as PDF document. Scale may be incorrect when printed. Te Kauwhata CMP Figure B6 : Manhole Flooding During 5 yr Storm Events for all Model Scenarios
57 Appendix C Statutory Framework Documents
58 Statutory Frame work The following statutory documents have an influence on the planning relation stormwater management requirements, these documents establish the over arching frameworks for stormwater management. The Resource Management Act 1991 The Resource Management Act (RMA) has been in effect since 1991, and is an effects- based legislation, that superseded a number of previous statutes governing water management. Section 5 of the RMA outlines the purpose of the Act, which is to promote the sustainable management of natural and physical resources. In this Act, sustainable management means managing the use, development, and protection of natural and physical resources in a way, or at a rate, which enables people and communities to provide for their social, economic, and cultural wellbeing and for their health and safety while (a) Sustaining the potential of natural and physical resources (excluding minerals) to meet the reasonably foreseeable needs of future generations; and (b) Safeguarding the life-supporting capacity of air, water, soil, and ecosystems; and (c) Avoiding, remedying, or mitigating any adverse effects of activities on the environment Section 6 outlines matters of national importance, which includes (a) The preservation of the natural character of the coastal environment (including the coastal marine area), wetlands, and lakes and rivers and their margins, and the protection of them from inappropriate subdivision, use, and development. Section 15 of the RMA places restrictions on the discharge of contaminants into the environment. Those parts of Section 15 which relate are included below: 15 Discharge of Contaminants into the environment - (1) No person may discharge any (a) Contaminant or water into water; or (b) Contaminant onto or into land in circumstances which may result in that contaminant (or any other contaminant emanating as a result of natural processes from that contaminant) entering water; In relation to stormwater, the Act therefore deals with: The control of the use of land for the purpose of the maintenance and enhancement of the quality of water in water bodies and coastal water; The control of discharges, contaminants, and water into water 19 May 2009 // Page 1, Appendix C
59 The control of taking, use, damming and diversion of water, and the control of the quantity, level and flow of water in any water body, including: - The setting of any maximum or minimum levels or flows of water, - The control of the range, or rate of change, of levels and flow of water. Waikato Regional Policy Statement The following is an overview of the relevant aspects in relation to water management within Section 3.4 of the Waikato Regional Policy Statement: There is potential for the reduction of water quality from: - the cumulative effects of point source and non-point source discharges of contaminants - land uses which affect the margins and beds of water bodies - Wetlands are an important resource within the Region. Human activities in and around wetlands have the potential to further adversely affect their natural character. - Maori consider that the disposal of contaminants to water has the potential to diminish the mauri of that water From these key issues objectives and policies which are considered appropriate are Objective: Net improvement of water quality across the Region. Policy : Ensure the protection of significant characteristics of the quality of outstanding water bodies. Policy Determine the characteristics for which other water bodies are valued and manage those water bodies to ensure that any adverse effects on those characteristics are avoided, remedied or mitigated. Policy Ensure that the adverse effects of land use on water quality and aquatic habitats are avoided, remedied, or mitigated. Objective: An increase in the quantity and quality of the Region s wetlands. Policy Ensure that the natural character of significant wetlands are protected. 19 May 2009 // Page 2, Appendix C
60 Policy Allow the use and development of other wetland areas while avoiding, remedying or mitigating any adverse effects on the wetland characteristics in the Region. Objective: Tangata whenua concerns relating to the mauri of the water recognised and provided for. Policy Ensure that decisions about the discharge of contaminants associated with the use, development and protection of natural and physical resources are made in a way that recognises and provides for the mauri of water. Waikato Regional Plan The following aspects of the Waikato Regional plan which became partially operative on the 28 th of September 2007 are considered relevant to the Management of Stormwater. Objectives and Policies Objective - The management of water bodies in a way which ensures: -net improvement of water quality across the Region -the avoidance of significant adverse effects on aquatic ecosystems -the characteristics of flow regimes are enhanced where practicable and justified by the ecological benefits -the range of uses of water reliant on the characteristics of flow regimes are maintained or enhanced -an increase in the extent and quality of the Region s wetlands -that significant adverse effects on the relationship tangata whenua as Kaitiaki have with water and their identified taonga such as waahi tapu, and native flora and fauna that have customary and traditional uses in or on the margins of water bodies, are remedied or mitigated -the cumulative adverse effects on the relationship tangata whenua as Kaitiaki have with water their identified taonga such as waahi tapu, and native flora and fauna that have customary and traditional uses that are in or on the margins of water bodies are remedied or mitigated -the natural character of the coastal environment, wetlands and lakes and rivers and their margins (including caves), is preserved and protected from inappropriate use and development -that the positive effects of water resource use activities and associated existing lawfully established infrastructure are recognised, whilst avoiding, remedying or mitigating adverse effects on the environment. 19 May 2009 // Page 3, Appendix C
61 Policy 1: Enabling Discharges to Water that will have only Minor Adverse Effects Enable through permitted and controlled activity rules, discharges to water that due to their nature, scale and location will: a. avoid adverse effects on surface water bodies that are inconsistent with policies in Section3.2.3 of this Plan b. not increase the adverse effects of flooding or erosion on neighbouring properties c. ensure that any adverse effects of sediment on aquatic habitats are confined to a small area relative to the habitat as a whole or are temporary, and the area will naturally re-establish habitat values comparable with those prevailing before commencement of the activity d. not result in significant effects on the Coastal Marine Area as identified in the Waikato Regional Coastal Plan, wetlands 1 that are areas of significant indigenous vegetation and/or significant habitats of indigenous fauna, cave ecosystems or lakes e. not have adverse effects that are inconsistent with the policies for air quality provided in Section of this Plan. Policy 2: Managing Discharges to Water with More than Minor Adverse Effects Control, through resource consents, discharges to water that are likely to have more than minor adverse effects so that: a. adverse effects on surface water bodies that are inconsistent with the policies in Section3.2.3 of this Plan are avoided as far as practicable and otherwise remedied or mitigated b. the discharge causes no significant adverse effects from flooding or erosion c. there are no significant adverse effects from downstream siltation d. there are no significant adverse effects on the Coastal Marine Area, wetlands that are areas of significant indigenous vegetation and/or significant habitats of indigenous fauna, cave ecosystems or lakes e. any subsequent discharges to air do not have adverse effects that are inconsistent with the policies for air quality provided in Section of this Plan. Policy 3: Alternatives to Direct Discharge to Water Land-based treatment systems will be promoted where soil type and drainage will allow and where adverse effects are minor or are less than those from a direct discharge to water. If the economic burden of adopting land treatment is unacceptable, provision will be made for a phased introduction of land treatment over an agreed period of time. Policy 4: Discharges to Land Ensure that the discharge of contaminants onto or into land maximises the reuse of nutrients and water contained in the discharge Advisory Note: The adverse effects of discharges of contaminants onto or into land and soil and subsequent adverse effects on water quality and air are addressed in the policies in Section of the Plan. 19 May 2009 // Page 4, Appendix C
62 Policy 6: Tangata Whenua Uses and Values Ensure that the relationship of tangata whenua as Kaitiaki with water is recognised and provided for to avoid significant adverse effects and remedy or mitigate cumulative adverse effects on: a. the mauri of water b. waahi tapu sites c. other identified taonga. Policy 7: Stormwater Discharges Encourage at-source management and treatment of stormwater discharges to reduce water quality and water quantity effects of discharges on receiving waters. Implementation Methods Including Rules - Stormwater Discharges Explanation regards to Policy 7 refers to statutory and non-statutory means which Environment Waikato can use to encourage methods of managing stormwater at its source and treating stormwater prior to its discharge to receiving waters. These include the resource consent process and the development and implementation of stormwater management plans. These detail the way in which stormwater networks are operated and include methods to avoid, remedy or mitigate the adverse effects of stormwater discharge Good Practice Environment Waikato will, in conjunction with territorial authorities, organisations, industry groups and individuals discharging stormwater, provide guidance to develop and implement good practices or appropriate codes of practice Integration with Territorial Authorities Environment Waikato will work with territorial authorities to ensure the integrated management of stormwater in the Region by: Ensuring territorial authorities inform Environment Waikato of significant resource consent applications that are likely to adversely affect the quality of stormwater discharges. Ensuring Environment Waikato has input into district plan development and reviews. Working with territorial authorities to identify and manage contaminated sites Stormwater Management Environment Waikato will work with resources users (including territorial authorities) to: Find ways to mitigate adverse effects of existing stormwater discharges; Promote the development of stormwater management plans which record the way in which the stormwater network is operated, including methods to avoid, remedy or mitigate the adverse effects of stormwater discharge; and Promote alternative methods for the treatment and disposal of stormwater from existing and new subdivisions and development. 19 May 2009 // Page 5, Appendix C
63 Permitted Activity Rule - Discharge of Stormwater to Water The discharge of stormwater to surface water (including geothermal water) is a permitted activity subject to the following conditions: (a) The discharge shall not originate from a catchment that includes any high risk facility 1, contaminated land*, operating quarry or mineral extraction site unless there is an interceptor system* in place. (b) Any erosion occurring as a result of the discharge shall be remedied as soon as practicable. (c) The catchment shall not exceed one hectare for discharges that originate from urban areas. (d) There shall be no adverse increase in water levels downstream of the discharge point which causes flooding on neighbouring properties, as a result of the discharge. (e) The discharge shall comply with the suspended solids standards in Section (f) The discharge shall not contain any material which will cause the production of conspicuous oil or grease films, scums or foams, or floatable suspended materials at any point downstream that is a distance greater than three times the width of the stream at the point of discharge. (g) The discharge shall not contain concentrations of hazardous substances that may cause significant adverse effects on aquatic life or the suitability of the water for human consumption after treatment. (h) There shall be no discharge to any Significant Geothermal Feature. For the purposes of conditions a) and g) levels of hazardous substances in stormwater or sediments that comply with the following guidelines and standards, in relation to the substances that they address will be deemed to be complying with the conditions: Licences under the Hazardous Substances and New Organisms Act 1996 for the use of the substance in New Zealand specifying discharge and receiving water standards for the substance. Health and Environmental Guidelines for Selected Timber Treatment Chemicals (Ministry for the Environment, Ministry of Health, 1997). Environmental Guidelines for Water Discharges from Petroleum Industry Sites in New Zealand (Ministry for the Environment, 1998). Guidelines for Assessing and Managing Contaminated Gasworks Sites in New Zealand (Ministry for the Environment, August 1997). Australian/New Zealand Water Quality Guidelines For Fresh And Marine Waters, (Australian & New Zealand Environment & Conservation Council, 2001). For the purposes of this Rule, urban area includes the inner city or town and built up environments, irrespective of local body administrative boundaries, that are serviced by roads where the speed limit is 80 kilometres an hour or less. 19 May 2009 // Page 6, Appendix C
64 Advisory Note: Rules controlling discharge structures are set out in Section Significant Geothermal Features are defined in the Glossary, and in Development and Limited Development Geothermal Systems, identified on maps in Section 7.10 of this Plan Permitted Activity Rule - Discharge of Stormwater Onto or Into Land The discharge of stormwater (including geothermal water) onto or into land is a permitted activity subject to the following conditions: (a) The discharge shall not originate from a catchment that includes any high risk facility 2 or contaminated land* unless there is and interceptor system* in place. (b) The discharge shall be below a rate that would cause flooding outside the design discharge soakage area, except in rain events equivalent to the 10% Annual Exceedence Probability design storm or greater. Any exceedence shall go into designated overland flow paths. (c) There shall not be any overland flow resulting in a discharge to surface water, except in rain events equivalent to the 10% Annual Exceedence Probability design storm or greater; then there shall be no adverse surface water effects as a result of the discharge. (d) Any erosion occurring as a result of the discharge shall be remedied as soon as practicable. (e) The discharge shall not contain concentrations of hazardous substances that may cause significant adverse effects on aquatic life or the suitability of the water for human consumption after treatment. For the purposes of conditions a) and e) of this rule, the levels of hazardous substances in stormwater or sediments that comply with the following guidelines and standards, in relation to the substances that they address will be deemed to be complying with the condition: Licences under the Hazardous Substances and New Organisms Act 1996 for the use of the substance in New Zealand specifying discharge and receiving water standards for the substance. Health and Environmental Guidelines for Selected Timber Treatment Chemicals (Ministry for the Environment, Ministry of Health,1997). Environmental Guidelines for Water Discharges from Petroleum Industry Sites in New Zealand (Ministry for the Environment, 1998). Guidelines for Assessing and Managing Contaminated Gasworks Sites in New Zealand (Ministry for the Environment, August 1997). Australian/New Zealand Water Quality Guidelines For Fresh And Marine Water, (Australian & New Zealand Environment & Conservation Council, 2001) Controlled Activity Rule - Discharge of Stormwater Onto or Into Land 19 May 2009 // Page 7, Appendix C
65 The discharge of stormwater (including geothermal water) onto or into land that does not comply with Rule is a controlled activity (requiring resource consent) subject to the following standards and terms: (a) The discharge shall be below a rate that would cause overland flow leading to a discharge to surface water, except in rain events equivalent to the 10% Annual Exceedence Probability design storm or greater. Any exceedence shall go into designated overland flow paths. (b) Waikato Regional Council reserves control over the following matters: - Measures used to control erosion or flooding. - Measures to avoid, remedy or mitigate the effects of the discharge on groundwater quality. - Measures (including contaminant loading rates) to ensure that the soil at the site is not contaminated by the discharge to a level that will affect the range of existing and foreseeable uses of the site. - Measures for avoiding, remedying or mitigating the effects of maintaining stormwater treatment systems. - Information and monitoring requirements. - Measures to avoid, remedy or mitigate the effects of the discharge on surface water bodies. - Measures to avoid, remedy or mitigate adverse effects on neighbouring property Controlled Activity Rule - Discharge of Stormwater Into Water The discharge of stormwater to surface water (including geothermal water) that is lawfully established at the time of notification of this Plan (28 September 1998) and does not comply with Rule is a controlled activity (requiring resource consent) subject to the following standards and terms: (a) The discharge shall not contain concentrations of hazardous substances that are causing significant adverse effects on aquatic life or the suitability of the water for human consumption after treatment. (b) Waikato Regional Council reserves control over the following matters: - Measures used to control erosion or flooding. - Measures to avoid, remedy or mitigate the effects of the discharge on the receiving water bodies. - Measures for avoiding, remedying or mitigating the effects of maintaining stormwater treatment systems. - Information and monitoring requirements. 19 May 2009 // Page 8, Appendix C
66 - The degree of compliance with discharge or receiving water standards for any hazardous substance in relevant New Zealand Standards, Guidelines or licences issued under the Hazardous Substances and New Organisms Act Discretionary Activity Rule - Discharge of Stormwater The discharge of stormwater into water, and/or into or onto land which does not comply with Rules , , and is a discretionary activity (requiring resource consent). Advisory Notes: Information requirements to enable the assessment of any application under this Rule are set out in Section of this Plan. In addition, assessment shall also take into account the matters identified in the policies of Section of this Plan. Rules controlling discharge structures are set out in Section of this Plan. Proposed Waikato District Plan Overview The vision for the future of the towns and villages of the district is that: (a) the amenity, quality of life and wellbeing of the residents and their communities will be maintained and improved (b) the environment will be safeguarded as development proceeds (c) existing towns and villages will be consolidated in preference to new towns being created (d) services will be provided for new residential development (e) a sense of place will be fostered, with urban design that complements both human scale and physical setting (f) business, industrial, and residential uses will be separated, except occupations that are carried out from home, which have acceptable effects on residential amenity (g) town centres will retain their social and commercial focus (h) historic heritage is protected from inappropriate subdivision, use and development Te Kauwhata will grow in response to demand for housing within commuting and day trip distance of Auckland, while retaining its rural village atmosphere. Population growth is also expected to arise from growth in the wine industry, tourist industry, and arts and crafts. Business activity may expand to service the surrounding population. Residential development will offer a variety of allotment sizes while retaining rural views, trees and open space. Low-density residential development will be favoured over infill. Objectives and Policies 19 May 2009 // Page 9, Appendix C
67 The following objectives and policies are considered relevant as the proposed Waikato District Plan is an effects based planning document which regulates activities by the nature of effects which they may have. Whilst stormwater is not specifically referred to it is necessary to consider stormwater in the context of the overall environment. Please note that some of the relevant objectives and policies are subject to appeals these have been indicated by inclusion of the bracketed appeal number adjacent to point which is appealed Indigenous Vegetation and Habitat Objective Indigenous biodiversity and the life-supporting capacity of indigenous ecosystems are maintained or enhanced. Policy Areas of indigenous vegetation and habitats of indigenous fauna, and the life-supporting capacity of indigenous ecosystems should be maintained or enhanced through on-site works, and the creation of ecological buffers and linkages using eco-sourced plants. Policy Priority should be given to protecting and restoring threatened habitats and habitats of threatened species such as coastal and lowland forest, riparian areas, wetlands, dunes and peatlands. Policy Areas of significant indigenous vegetation and significant habitats of indigenous fauna should be managed in a way that protects their long-term ecological functioning and biodiversity through such means as: (a) excluding stock (b) undertaking plant and animal pest control (c) retaining and enhancing vegetation cover (d) maintaining wetland hydrology (e) avoiding physical and legal fragmentation (ea) avoiding housing development close to such areas. Policy Subdivision, use and development should be located and designed to avoid, remedy or mitigate adverse effects on indigenous biodiversity. This will include adverse effects on the ecological functioning and values of significant indigenous vegetation and significant habitats of indigenous fauna, in-stream values, riparian margins and gullies. Policy [1183] When avoiding, remedying or mitigating adverse effects on indigenous biodiversity, regard should be had to: (a) the need for species to continue to have access to their required range of food sources and habitats during their life cycle (b) the need for species to have access to refuges from predators and disturbances (c) the maintenance of natural isolation (d) the need to prevent invasion by exotic species 19 May 2009 // Page 10, Appendix C
68 (e) the need to maintain vegetation structure, such as a continuous closed-forest canopy and understorey, and the compactness of an area s shape to limit edge effects such as wind damage (f) the need to replace or restore habitats (g) retaining and restoring the natural character and landscape values of the area [0075] (ga) maintenance and enhancement of ecological corridors and buffer areas. Policy [0075] The features and values that characterise areas of indigenous vegetation and habitats of indigenous fauna and that contribute to biodiversity should be protected from inappropriate subdivision, use and development Natural features and landscape Objective Outstanding natural features and landscapes are recognised and protected. Policy [0021] Outstanding natural features and landscapes, identified in Schedule 3A, should be recognised and protected from the adverse effects of inappropriate subdivision, use and development. Policy Cultural and spiritual relationships of Maori with outstanding natural features and landscapes should be recognised and provided for in the course of subdivision, use and development. Built Environment Objective [0010] Network utilities are provided in a manner that does not compromise qualities and characteristics of surrounding environments. Policy [0010] Utilities should be designed and located to avoid, remedy or mitigate any adverse effects from their structures on the environment, community health and amenity. Policy Compatible utilities should, where technically and practicably feasible, share locations or facilities where advantages are achieved in terms of visual, landscape or other positive effects. Social, Cultural and Economic Objective Valued social and cultural characteristics of communities are retained. Policy May 2009 // Page 11, Appendix C
69 Activities should meet the needs of individuals and groups and be sensitive to the existing social and cultural characteristics of communities. Policy Activities in Te Kauwhata should contribute to the evolving social and cultural characteristics derived from diverse traditional and emerging primary industries and servicing of them, the town s setting near to Whangamarino Wetland and Lake Waikare, its low density large lot residential character and its proximity to Auckland. Policy Subdivision, use and development should enhance the existing social character of rural localities and communities, which is derived from interaction between individuals and groups, and their relationships with the productive use of the surrounding land or the efficient use of local infrastructure. Objective Cultural practices and beliefs of Tangata whenua are respected. Policy Subdivision, use and development should not compromise the cultural and spiritual significance of areas, including waahi tapu, urupa, maunga and other landforms, mahinga kai, and indigenous flora and fauna. Policy The cultural significance of the Waikato River, Raglan Harbour (Whaingaroa), coastal areas, wetlands and other water bodies should be recognised and maintained. Objective People and communities are able to access resources so that they can provide for their economic wellbeing Policy Community economic wellbeing should be enabled through activities that use and develop natural and physical resources without adverse effects on the local environment. Policy Activities in Te Kauwhata should utilise local natural and physical resources to provide for the economic wellbeing of an evolving and growing community. Policy [0045] Subdivision, use and development in rural areas should not compromise access to resources needed for economic activity, especially resources of a fixed or finite nature, including land, (particularly that used for productive agricultural and farming activities), soil, water, minerals, and the open space that provides separation from sensitive activities. Amenity Values 19 May 2009 // Page 12, Appendix C
70 Objective Amenity values of sites and localities maintained or enhanced by subdivision, building and development Policy Subdivision, building and development should be located and designed to: (a) be sympathetic to and reflect the natural and physical qualities and characteristics of the area (b) ensure buildings have bulk and location that is consistent with buildings in the neighbourhood and the locality [0024] (c) avoid buildings and structures dominating adjoining land or public places, the coast, or water bodies (d) retain private open space and access to public open space (e) encourage retention and provision of trees, vegetation and landscaping (f) arrange allotments and buildings in ways that allow for view sharing, whereappropriate (g) provide adequate vehicle manoeuvring and parking space on site (h) provide vehicle, cycling and pedestrian connection to transport networks, including roads, cycleways and walkways, and facilitate public transport (i) promote security and safety of public land and buildings, and places (j) mitigate foreseeable effects (including reverse sensitivity effects) on, and from, nearby land use, particularly existing lawfully established activities (k) mitigate foreseeable effects on water bodies (l) maintain adequate daylight and direct sunlight to buildings, outdoor living areas and public places (m) maintain privacy (n) avoid glare and light spill. Recreation Objective Public green open space and recreational facilities are available to meet the needs of the community. Policy Subdivision and development must contribute to the provision of public green open space and recreational facilities. Policy Public access to and along the coast, rivers, lakes and wetlands should be provided. Policy An integrated network of local, regional and national walkways or cycleways should be developed and should ensure: (a) convenient and practical public access to and along the route (b) safety and security for neighbours and walkway users (c) protection and restoration of conservation values 19 May 2009 // Page 13, Appendix C
71 (d) integration with the transport network, including cycleways where appropriate. Policy Recreation and reserve use and development should be consistent with the nature and character of the local environment, including protection of landforms, and protection and restoration of indigenous vegetation, wildlife and linking of habitats. Objective Lack of reserves and recreational space (a) Provision for and maintenance of public reserves throughout the district, including: - major recreational facilities located in urban areas, and - reserves in villages and rural areas associated with community facilities such as halls and schools - reserves adjacent to major water bodies and the coast - recreation facilities in areas where the adverse effects on roads and traffic, network utilities, and local amenity and character are avoided or mitigated. (b) Provision for and maintenance of convenient, safe, legal and practical public access: - to and along major water bodies and the coast, and - to a network of recreation reserves, facilities and green open space. (c) Establishment of a network of walkway routes and cycleways available for public use. 19 May 2009 // Page 14, Appendix C
72 Appendix D Existing Stormwater Consents
73 Current Stormwater discharge consents with Regional Council (EW) - Te Kauwhata area (3 km radius from coordinate NZMS S13: ) NZMS S13:004165, New Zealand Transport Agency (Regional Office) S13: RC Rangiriri to South of Ohinewai 4 Laning Discharge stormwater into water and into or onto land, including temporary discharges during construction, associated with SH 1, Expressway construction at Te Onetea, Rangiriri NZMS S13: RC Waikato District Council Te Kauwhata Urban Area Divert & discharge urban stormwater & associated contaminants at multiple locations to the Reao Stream, Pungarehu Stream, Lake Waikare & land, & use discharge structures, within the vicinity of Te Kauwhata urban area NZMS S13: RC Waikato District Council Rangiriri Urban Area Divert & discharge urban stormwater & associated contaminants at multiple locations to the Rangiriri Stream, Lake Waikare & land, & use discharge structures, within the vicinity of Rangiriri urban area NZMS S13: , New Zealand Transport Agency (Regional Office) S13: RC SH 1 - Longswamp to Rangiriri Discharge stormwater and water containing contaminants from the carriage way, into water or onto land, both during construction and long term in association with road widening of SH 1 between Foster Rd & Rangiriri NZMS S13: RC Te Kauwhata Retirement Trust Waerenga Rd - Te Kauwhata Divert and discharge stormwater from a subdivision development to the Whangamarino Wetland at Waerenga Road, Te Kauwhata NZMS S13: RC Silverstone Developments Ltd Blunt Rd - Te Kauwhata Discharge stormwater into the Whangamarino Wetland from a subdivision NZMS S13: RC Silverstone Wayside Ltd Wayside Rd - Te Kauwhata Discharge treated urban stormwater from a 29-lot subdivision to an ephemeral farm drain NZMS S13: RC Jetco Waikato Ltd Travers Rd - Te Kauwhata Discharge up to cubic metres per second of urban stormwater from a 21-lot residential subdivision onto land and into an unnamed tributary of the Whangamarino Stream NZMS S13: RC Manwa Group Te Kauwhata Road - Te Kauwhata Divert and discharge stormwater from a 69 lot subdivision and associated upstream catchment area to the existing open drains via a stormwater detention pond
74 Appendix E Hydraulic Model Results
75 Existing Land use scenario peak water levels Colour indicates Exceedance Ground 100yr 2yr ARI 5yr ARI 10yr ARI 50yr ARI Level ARI Flooding Indicated [m] [m] [m] [m] [m] [m] by WDC? Catchpit Manhole Manhole Yes Manhole Manhole Yes Manhole Manhole Manhole Manhole Manhole Manhole Manhole Possible Contributes Manhole Yes Manhole Manhole Node_ Node_ Node_ Node_ Node_ Node_ Node_ Node_ Node_ Node_ Node_ Node_ Node_ Node_ Section A Section B Section B Section C Section D Section D Section E
76 Future Land use scenario peak water levels Colour indicates Exceedance Ground Level 2yr ARI 5yr ARI 10yr ARI 50yr ARI 100yr ARI [m] [m] [m] [m] [m] [m] Catchpit Manhole Manhole Manhole Manhole Manhole Manhole Manhole Manhole Manhole Manhole Manhole Manhole Manhole Manhole Node_ Node_ Node_ Node_ Node_ Node_ Node_ Node_ Node_ Node_ Node_ Node_ Node_ Node_ Section A Section B Section B Section C Section D Section D Section E
77 Future Land use scenario with climate change peak water levels Colour indicates Exceedance Ground 100yr 2yr ARI 5yr ARI 10yr ARI 50yr ARI Level ARI [m] [m] [m] [m] [m] [m] Catchpit Manhole Manhole Manhole Manhole Manhole Manhole Manhole Manhole Manhole Manhole Manhole Manhole Manhole Manhole Node_ Node_ Node_ Node_ Node_ Node_ Node_ Node_ Node_ Node_ Node_ Node_ Node_ Node_ Section A Section B Section B Section C Section D Section D Section E
78 Existing Land use scenario peak discharge Link Upstream Node Downstream Node 2yr ARI 5yr ARI 10yr ARI 50yr ARI 100yr ARI [m3/s] [m3/s] [m3/s] [m3/s] [m3/s] Link_41 Manhole 13 Node_ Link_42 Node_46 Node_ Link_43 Node_47 Node_ Link_44 Manhole 2 Manhole Link_45 Manhole 3 Node_ Link_46 Node_63 Node_ Link_47 Node_50 Manhole Link_49 Node_81 Manhole Link_50 Manhole 6 Manhole Link_51 Manhole 11 Manhole Link_52 Manhole 15 Manhole Link_53 Manhole 14 Manhole Link_54 Manhole 19 Manhole Link_56 Node_58 Lake (a) Link_57 Manhole 22 Node_ Link_58 Node_61 Node_ Link_59 Node_60 Node_ Link_64 Manhole 8 Manhole Link_65 Manhole 1 Section D Link_67 Manhole 18 Manhole Link_69 Node_76 Node_ Link_70 Manhole 7 Catchpit Peninsular Link_76 Surrounding Area Wetland (d) Link_77 Node_95 Lake (b) Railway Culvert Section D Section D Section A - Traver Road Stream Node_89 Section A Section B - Travers Road Stream Section A Node_ Section B2 - Travers Road Stream Node_88 Section B Section C - Travers Road Stream Section B2 Section C Section D - Travers Road Stream Section C Section D Section E Section D2 Section E Shallow Channel Node_48 Wetland (c) To Lake Manhole 16 Node_
79 Link Upstream Node Downstream Node 2yr ARI 5yr ARI 10yr ARI 50yr ARI 100yr ARI [m3/s] [m3/s] [m3/s] [m3/s] [m3/s] To Wetland Section E Wetland (a) Traver Road Culvert Section B Section B Unknown Overland Channel Catchpit 5 Wetland (b)
80 Future Land use scenario peak discharge Link Upstream node Downstream node 2yr ARI 5yr ARI 10yr ARI 50yr ARI 100yr ARI [m3/s] [m3/s] [m3/s] [m3/s] [m3/s] Link_41 Manhole 13 Node_ Link_42 Node_46 Node_ Link_43 Node_47 Node_ Link_44 Manhole 2 Manhole Link_45 Manhole 3 Node_ Link_46 Node_63 Node_ Link_47 Node_50 Manhole Link_49 Node_81 Manhole Link_50 Manhole 6 Manhole Link_51 Manhole 11 Manhole Link_52 Manhole 15 Manhole Link_53 Manhole 14 Manhole Link_54 Manhole 19 Manhole Link_56 Node_58 Lake (a) Link_57 Manhole 22 Node_ Link_58 Node_61 Node_ Link_59 Node_60 Node_ Link_64 Manhole 8 Manhole Link_65 Manhole 1 Section D Link_67 Manhole 18 Manhole Link_69 Node_76 Node_ Link_70 Manhole 7 Catchpit Peninsular Link_76 Surrounding Area Wetland (d) Link_77 Node_95 Lake (b) Link_82 NLIZ to lake Lake (c) Railway Culvert Section D Section D Section A - Travers Road Stream Node_89 Section A Section B - Travers Road Stream Section A Node_ Section B2 - Travers Road Stream Node_88 Section B Section C - Travers Road Stream Section B2 Section C Section D - Travers Road Stream Section C Section D Section E Section D2 Section E Shallow Channel Node_48 Wetland (c) To Lake Manhole 16 Node_ To Wetland Section E Wetland (a) Traver Road Culvert Section B Section B
81 Link Upstream node Downstream node 2yr ARI 5yr ARI [m3/s] [m3/s] [m3/s] [m3/s] [m3/s] Unknown Overland Channel Catchpit 5 Wetland (b) yr ARI 50yr ARI 100yr ARI
82 Future Land use scenario with climate change peak discharge Link Upstream Node Downstream Node 2yr ARI 5yr ARI 10yr ARI 50yr ARI 100yr ARI [m3/s] [m3/s] [m3/s] [m3/s] [m3/s] Link_41 Manhole 13 Node_ Link_42 Node_46 Node_ Link_43 Node_47 Node_ Link_44 Manhole 2 Manhole Link_45 Manhole 3 Node_ Link_46 Node_63 Node_ Link_47 Node_50 Manhole Link_49 Node_81 Manhole Link_50 Manhole 6 Manhole Link_51 Manhole 11 Manhole Link_52 Manhole 15 Manhole Link_53 Manhole 14 Manhole Link_54 Manhole 19 Manhole Link_56 Node_58 Lake (a) Link_57 Manhole 22 Node_ Link_58 Node_61 Node_ Link_59 Node_60 Node_ Link_64 Manhole 8 Manhole Link_65 Manhole 1 Section D Link_67 Manhole 18 Manhole Link_69 Node_76 Node_ Link_70 Manhole 7 Catchpit Peninsular Link_76 Surrounding Area Wetland (d) Link_77 Node_95 Lake (b) Link_82 NLIZ to lake Lake (c) Railway Culvert Section D Section D Section A - Traver Road Stream Node_89 Section A Section B - Travers Road Stream Section A Node_ Section B2 - Travers Road Stream Node_88 Section B Section C - Travers Road Stream Section B2 Section C Section D - Travers Road Stream Section C Section D Section E Section D2 Section E Shallow Channel Node_48 Wetland (c) To Lake Manhole 16 Node_ To Wetland Section E Wetland (a) Traver Road Culvert Section B Section B
83 Link Upstream Node Downstream Node 2yr ARI 5yr ARI [m3/s] [m3/s] [m3/s] [m3/s] [m3/s] Unknown Overland Channel Catchpit 5 Wetland (b) yr ARI 50yr ARI 100yr ARI
84 Longitudinal Section of the Travers Road Stream (at Time = 0)
85 Longitudinal Section of Eccles Ave (at Time = 0)
86 Discharge Hydrographs at the Travers Road culvert Flow (m3/s) Minutes Existing 100 Year Event Future 100 Year Event Future 100 Year Event With Climate Change
87 Discharge Hydrographs at the Railway culvert Flow (m3/s) Minutes Existing 100 Year Event Future 100 Year Event Future 100 Year Event With Climate Change
88 Appendix F Structure Plan Catchment Maps
89
90
91

92
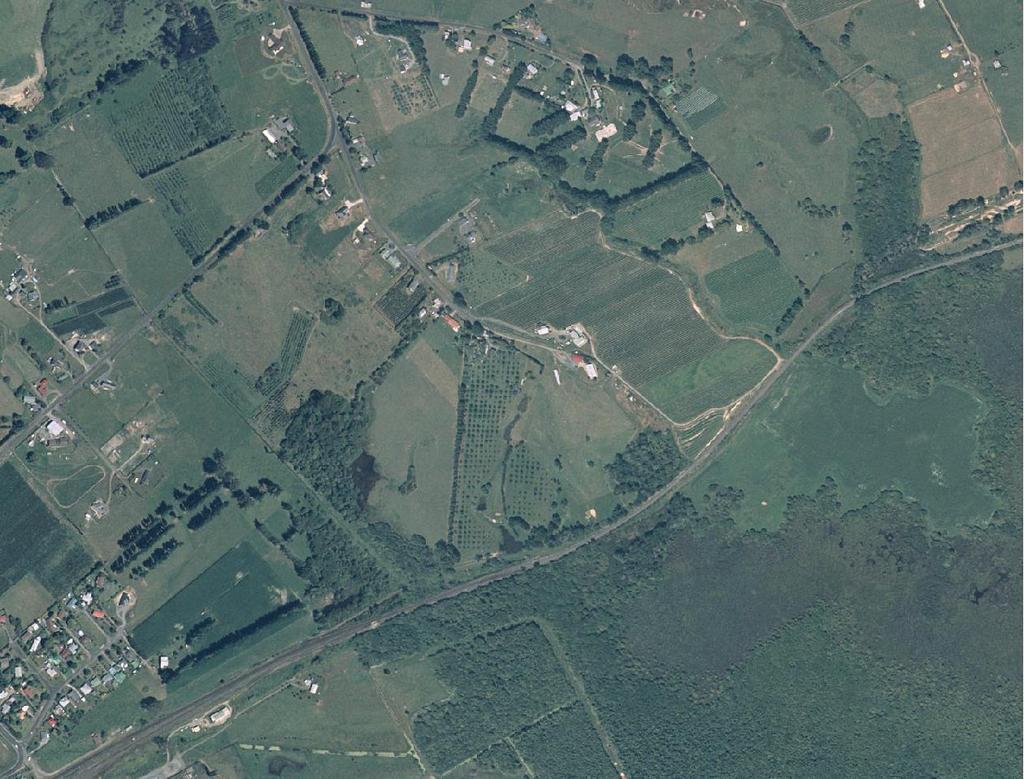
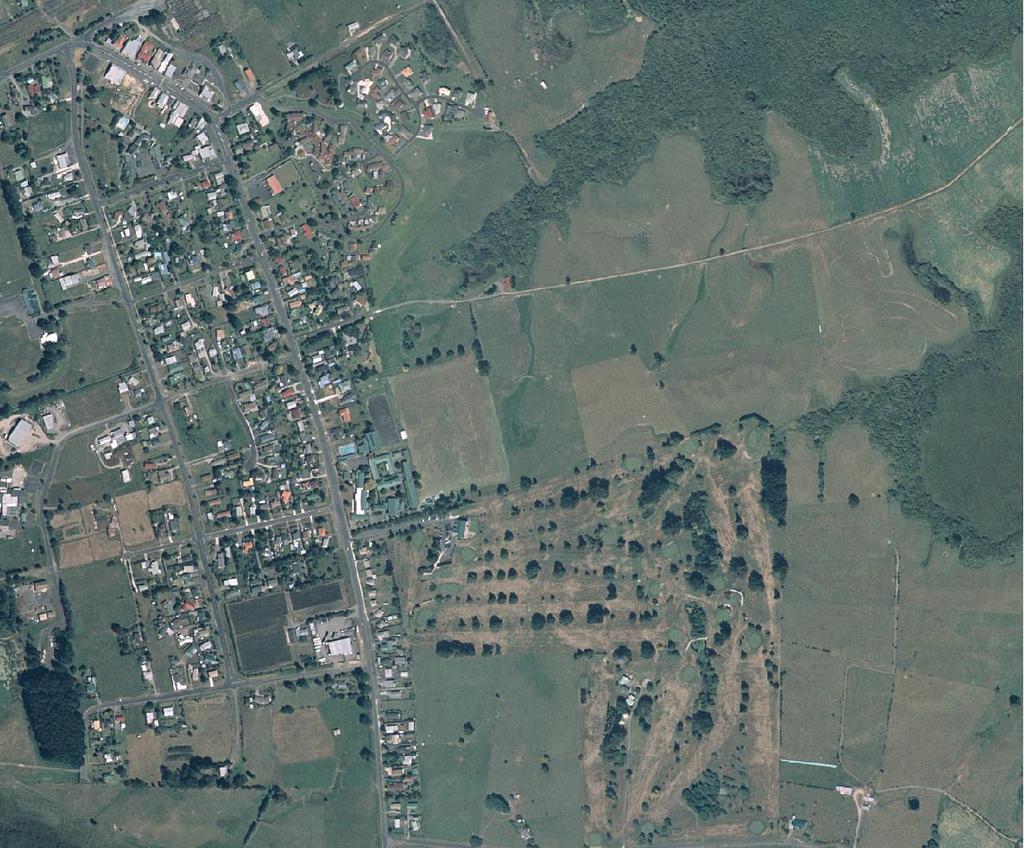

93 8 7
1 General questions on zone and catchment management plans
 1 General questions on zone and catchment management plans 1.1 What is a zone plan? The Waikato region is divided into eight zones. There is a separate, non statutory, zone plan for each one. The key purpose
subdivision BUSH LIVING ENVIRONMENT ASSESSMENT CRITERIA RULES
 RULES 10.0 General The following rules apply to Subdivision of land within the Bush Living Environment except that area identified as Titirangi Subdivision Area 1 and Titirangi-Laingholm Subdivision Area
S e c t i o n B i o d i ve r s i t y
 S e c t i o n 2. 2 - B i o d i ve r s i t y The District has a wealth of ecosystems which support indigenous vegetation and habitats of indigenous fauna. Many of these ecosystems are the remnants of the
Section 1 - Introduction
 VERSION 1.0 Stormwater Solutions for Residential Sites Section 1 - Introduction Prepared for EcoWater Solutions A Department of Waitakere City Council 113 Central Park Drive Henderson WAITAKERE CITY November
subdivision INFILL SUBDIVISION ASSESSMENT CRITERIA RULES
 Safety and Heritage RULES 3.0 General The following rules shall apply to the of land situated in the Living Environment where the is of existing sites either up to 1ha in net site area or which creates
14 NATURAL HAZARDS Background Resource Management Issues
 14 NATURAL HAZARDS 14.1 Background The particular geology, hydrology and topography of the Hutt Valley make Upper Hutt vulnerable to a variety of natural hazards. Earthquakes and flooding are the most
Appendix E : Guidelines for Riparian Buffer Areas
 Appendix E : Guidelines for Riparian Buffer Areas This document should be read in conjunction with the CRCA Planning Policy. 1.0 PURPOSE The purpose of this document is to summarize the recommendations
subdivision WORKING ENVIRONMENT AND COMMUNITY ENVIRONMENT RULES ASSESSMENT CRITERIA
 Character, Mauri, Amenity Values, Neighbourhood Character, Health & Safety and Heritage RULES ASSESSMENT CRITERIA 5.0 General The following rules shall apply to the of land situated in the Community Environment
Te Mania Sub-Catchment Action Plan
 Te Mania Sub-Catchment Action Plan 2012 The Te Mania Sub-Catchment Action Plan is one of a series produced for the sub-catchments surrounding the Tauranga Harbour. The aim of this action plan is to provide
The Role of Pervious Paving in Meeting the Requirements of the Auckland Unitary Plan
 The Role of Pervious Paving in Meeting the Requirements of the Auckland Unitary Plan Nick Vigar Waterways Planning Team Manager Auckland Council Healthy Waters Outline Stormwater management under the Air,
DRAINAGE REVIEW: Berwick Health and Education Precinct. for. Victorian Planning Authority
 DRAINAGE REVIEW: Berwick Health and Education Precinct for Victorian Planning Authority April 2017 Document history Revision: Revision no. 03 Author/s Jonathon McLean Approved Jonathon McLean Distribution:
Temporary Watercourse Crossing: Culverts
 Temporary Watercourse Crossing: Culverts DRAINAGE CONTROL TECHNIQUE Low Gradient Velocity Control Short Term Steep Gradient Channel Lining Medium-Long Term Outlet Control Soil Treatment Permanent Symbol
Prepared by Christchurch City Council, P.O. Box 73013, Christchurch. Submission by Avon-Ōtākaro Network, 9 Stable Way, Christchurch 8051
 Christchurch City Council Christchurch October 2013 Submission to the Draft South New Brighton Reserves Management Plan, 2013 Draft South New Brighton Reserves Development Plan, 2013 For Bligh s Garden,
Stormwater Management System Project Review
 TRANSIT NEW ZEALAND SH1 AVALON DRIVE BYPASS Project Review TRANSIT NEW ZEALAND TRANSIT NEW ZEALAND SH1 AVALON DRIVE BYPASS Project Review Prepared By Emma Innocente Environmental Engineer Cedric Malaval
DESIGN BULLETIN #16/2003 (Revised July 2007) Drainage Guidelines for Highways Under Provincial Jurisdiction in Urban Areas.
 Drainage Guidelines for Highways Under Provincial Jurisdiction in Urban Areas.") Drainage Guidelines for Highways Under Provincial Jurisdiction in Urban Areas. July 2007 Update to Design Bulletin #16/2003: Added under Design Criteria Culverts of 600mm diameter are commonly used to
Drainage Guidelines for Highways Under Provincial Jurisdiction in Urban Areas. July 2007 Update to Design Bulletin #16/2003: Added under Design Criteria Culverts of 600mm diameter are commonly used to
Stormwater Erosion Control & Post-Construction Plans (Stormwater Quality Plans)
") Stormwater Erosion Control & Post-Construction Plans (Stormwater Quality Plans) Allen County Stormwater Plan Submittal Checklist The following items must be provided when applying for an Allen County Stormwater
Stormwater Erosion Control & Post-Construction Plans (Stormwater Quality Plans) Allen County Stormwater Plan Submittal Checklist The following items must be provided when applying for an Allen County Stormwater
BMP 5.4.2: Protect /Conserve/Enhance Riparian Areas
 BMP 5.4.2: Protect /Conserve/Enhance Riparian Areas The Executive Council of the Chesapeake Bay Program defines a Riparian Forest Buffer as "an area of trees, usually accompanied by shrubs and other vegetation,
14 NATURAL HAZARDS Background Resource Management Issues
 14 NATURAL HAZARDS 14.1 Background The particular geology, hydrology and topography of the Hutt Valley make Upper Hutt vulnerable to a variety of natural hazards. Earthquakes and flooding are the most
Morton West, Dacland. Hydrology / Stormwater Management Report Permit Application
 Morton West, Dacland Hydrology / Stormwater Management Report Permit Application February 2014 Document history Revision: Revision no. Author/s R01 Jonathon McLean Approved Jonathon McLean Distribution:
Appendix A Stormwater Site Plan Report Short Form
 Appendix A Stormwater Site Plan Report Short Form The Stormwater Site Plan Report Short Form may be used for projects that trigger only Minimum Requirements #1-#5. These projects typically fall within
E1. Water quality and integrated management
 E1. Water quality and integrated management E1.1. Introduction The National Policy Statement for Freshwater Management, the New Zealand Coastal Policy Statement and this Plan seek to improve the integrated
Ayrburn Farm Development Infrastructure Assessment Report
 Ayrburn Farm Development Infrastructure Assessment Report 1 EXECUTIVE SUMMARY Further to Clark Fortune McDonald & Associates correspondence dated 12 February 2015 please find below the assessment of foul
4. Ponds and infiltration BMPs can achieve 60 to 100% removal efficiencies for sediment.
 Landscape BMPs For the purposes of this project, preventive measures have been categorized into two categories: landscape BMPs and source prevention BMPs. Landscape BMPs includes both vegetative practices
Public Information Centre No. 2 June 15, :00 8:00 pm. Valley Park Community Centre (GYM B) 970 Paramount Drive Stoney Creek
 970 Paramount Drive Stoney Creek") Public Information Centre No. 2 June 15, 2017 6:00 8:00 pm Valley Park Community Centre (GYM B) 970 Paramount Drive Stoney Creek Please complete the sign-in sheet and review display materials. The project
Public Information Centre No. 2 June 15, 2017 6:00 8:00 pm Valley Park Community Centre (GYM B) 970 Paramount Drive Stoney Creek Please complete the sign-in sheet and review display materials. The project
FORM B: DAMMING AND DIVERSION OF WATER
 APPLICATION FOR RESOURCE CONSENT FORM B: DAMMING AND DIVERSION OF WATER NOTES Resource use activities must meet all the conditions of any relevant Permitted Activity Rules in the Waikato Regional Plan
Highway Drainage 1- Storm Frequency and Runoff 1.1- Runoff Determination
 Highway Drainage Proper drainage is a very important consideration in design of a highway. Inadequate drainage facilities can lead to premature deterioration of the highway and the development of adverse
Welcome Bay Sub-Catchment Action Plan
 Welcome Bay Sub-Catchment Action Plan 2012 The Welcome Bay Sub-Catchment Action Plan is one of a series produced for the sub-catchments surrounding Tauranga Harbour. The aim of this action plan is to provide
Storm water Catchment Analysis
 Storm water Catchment Analysis Analysis index 1. Storm water attenuation tank sizing method 2. Consent notices for storm water attenuation tanks 3. Summary of sub catchments 4. Hydrological Analysis for
CLEARWATER TOWNSHIP WATER QUALITY ACTION PLAN
 CLEARWATER TOWNSHIP WATER QUALITY ACTION PLAN Elk-River-Chain-of-Lakes Gaps Analysis Project The Watershed Center Grand Traverse Bay Michigan Department of Environmental Quality July 2011 Purpose The Grand
TOWN OF SMYRNA Water Quality Buffer Zone Policy
 TOWN OF SMYRNA Water Quality Buffer Zone Policy Section I - Description A water quality buffer zone (a.k.a. a riparian zone) is a strip of undisturbed native (indigenous) vegetation, either original or
E. STORMWATER MANAGEMENT
 E. STORMWATER MANAGEMENT 1. Existing Conditions The Project Site is located within the Lower Hudson Watershed. According to the New York State Department of Environmental Conservation (NYSDEC), Lower Hudson
CATEGORY a protection of the natural environment, its ecosystems and biodiversity.
 29. ENVIRONMENTAL DEVELOPMENT PERMIT AREA CATEGORY a protection of the natural environment, its ecosystems and biodiversity. The requirement to obtain an environmental development permit is cited in Section
4.0 STORMWATER CONTENTS. Section 4 Stormwater
 4.0 STORMWATER CONTENTS 4.0 STORMWATER... I 4.1 Introduction... 4-1 4.1.1 Objectives... 4-1 4.1.2 Stormwater Management Hierarchy... 4-1 4.1.3 Level of Service... 4-2 4.1.4 Alteration to Existing Infrastructure...
Temporary Watercourse Crossing: Fords
 Temporary Watercourse Crossing: Fords DRAINAGE CONTROL TECHNIQUE Low Gradient Velocity Control Short Term Steep Gradient Channel Lining Medium-Long Term Outlet Control Soil Treatment Permanent [1] [1]
SECTION 6 STORMWATER AND LAND DRAINAGE
 SECTION 6 STORMWATER AND LAND DRAINAGE Final Version, Approved September 2003 Section 6 and Land Drainage Contents 6.1 PERFORMANCE STANDARDS... 2 6.1.1 General... 2 6.2 MEANS OF COMPLIANCE... 3 6.2.1 General...
Schedule A DISTRICT OF MAPLE RIDGE Watercourse Protection Bylaw
 Schedule A DISTRICT OF MAPLE RIDGE Watercourse Protection Bylaw 6410 2006 The Erosion and Sediment Control plan should seek (i) to protect the soil surface from erosion where possible and (ii) capture
Application for resource consent Form B Damming and diversion of water
 Application for resource consent Form B Damming and diversion of water Notes Resource use activities must meet all the conditions of any relevant Permitted Activity Rules in the Waikato Regional Plan or
H28. Special Purpose Quarry Zone
 H28. Special Purpose Quarry Zone H28.1. Zone description Mineral resources are important to Auckland s economy and development. The Special Purpose Quarry Zone provides for significant mineral extraction
SCRCA SECTION 28 WETLAND POLICY
 April 21, 2016 SCRCA SECTION 28 WETLAND POLICY SCRCA Policies and Procedures of Administration of Section 28 Regulations Wetland Policies Definitions section (Source: Section 28 CA Act) Development means:
The Proposed Auckland Unitary Plan (notified 30 September 2013)
") ART 3 REGIONAL AND DISTRICT RULES»Chapter H: Auckland wide rules»4 Natural resources» 4.14 Stormwater management Introduction The roposed Auckland Unitary lan (notified 30 September 2013) This section
ART 3 REGIONAL AND DISTRICT RULES»Chapter H: Auckland wide rules»4 Natural resources» 4.14 Stormwater management Introduction The roposed Auckland Unitary lan (notified 30 September 2013) This section
Stormwater Local Design Manual For Houston County, Georgia
 Stormwater Local Design Manual For Houston County, Georgia Adopted November 15, 2005 TABLE OF CONTENTS 1. FORWARD... 1 2. GENERAL LEVEL OF SERVICE STANDARDS... 2 2.1. DETENTION REQUIREMENTS... 2 2.1.1.
The MASMA and Sustainable Drainage Systems
 RLD 512 LANDSCAPE HYDROLOGY The MASMA and Sustainable Drainage Systems Dr Naser Ghani PhD, P.Eng, MIEM, MASCE, MACEM anaser@usm.my www.hbp.usm.my/naser ROOM 104 E49 MASMA The main focus of Urban Storm
Rising Sun. Scaffold Hill. Flood Risk Assessment
 Rising Sun Scaffold Hill Flood Risk Assessment August 2010 Contents 1.0 Introduction... 4 2.0 Site Description... 5 3.0 Legislative Framework... 6 4.0 Flood Risk... 10 5.0 Surface Water Drainage... 11
Last amended 3 May 2011 Earthworks Operative 27/07/2000
 29 Earthworks 29.1 Introduction Earthworks are essential to the development of the City. They create the areas of level land used for living, business and recreation, and the even gradients for paths and
Chapter 10 Natural Environment
 Chapter 10 Natural Environment Existing Conditions The Natural Environment Element addresses the protection, conservation, preservation, and restoration of the natural resources the Bayview Ridge Subarea,
3 Objectives 3 Ob jec tives
 3 Objectives 3 Objectives 3 Objectives 3 Objectives contents Objective number Page 3.1 Ki uta ki tai: mountains to the sea O1-O5 37 3.2 Beneficial use and development O6-O13 38 3.3 Māori relationships
CHAPTER 3 Environmental Guidelines for WATERCOURSE CROSSINGS GOVERNMENT OF NEWFOUNDLAND AND LABRADOR DEPARTMENT OF ENVIRONMENT AND LABOUR
 GOVERNMENT OF NEWFOUNDLAND AND LABRADOR DEPARTMENT OF ENVIRONMENT AND LABOUR CHAPTER 3 Environmental Guidelines for WATERCOURSE CROSSINGS WATER RESOURCES MANAGEMENT DIVISION Water Investigations Section
Appendix E: Bridge Site Information Summary
 BRIDGE MANUAL E - 1 APPENDIX E: BRIDGE SITE INFORMATION SUMMARY Appendix E: Bridge Site Information Summary Table of Contents Notes..E 3 Section 1: Basic Information..E 4 Section 2: River Data..E 8 Section
Report to COUNCIL for information
 18 149 Title: Section: Prepared by: Draft Regional Target for Swimmable Lakes and Rivers Transformation & Relationships Janic Slupski (Senior Policy Advisor) Meeting Date: 5 April 2018 Legal Financial
Network utilities, subject to compliance with Part 6 (Infrastructure) A.3 Existing vegetation cover.
 A.3 Existing vegetation cover.") 5.3.2. Rural Zone 5.3.2.1. Permitted Activities 5.3.2.1.1. Residential, recreational, agricultural, exotic forestry or tourist related activities which comply with the standards for permitted activities
5.3.2. Rural Zone 5.3.2.1. Permitted Activities 5.3.2.1.1. Residential, recreational, agricultural, exotic forestry or tourist related activities which comply with the standards for permitted activities
ORDINANCE # 854. Stormwater Management / Operation and Maintenance Requirements
 ORDINANCE # 854 Stormwater Management / Operation and Maintenance Requirements Section 1. Purpose and Authority In accordance with the provisions of Chapters 98, 124, 126, 440, 444, and 446h of the General
5.3 CONSERVATION (WETLAND) ZONE
 ZONE") 5.3 CONSERVATION (WETLAND) ZONE 5.3.1 ZONE PURPOSE (1) The purpose of the Conservation (Wetland) Zone is one of conservation, protection and enhancement (including values of importance to tangata whenua)
5.3 CONSERVATION (WETLAND) ZONE 5.3.1 ZONE PURPOSE (1) The purpose of the Conservation (Wetland) Zone is one of conservation, protection and enhancement (including values of importance to tangata whenua)
THE WATERSHED The watershed is an area of land that drains into a stream. This includes both the surface runoff and groundwater. Because a stream is m
 Understanding Streams A stream is the product of its watershed. Good land use in the watershed will be reflected in the stream. MOST PEOPLE enjoy the captivating qualities of flowing water. But streams
general natural area GUIDELINES TO THE RULES This section updated September 2015
 This section updated September 2015 GUIDELINES TO THE RULES 2 The General Natural Area Rules apply to activities on land within the General Natural Area as shown on the Natural Areas Maps. This includes
Maitland Valley WATERSHED
 Maitland Valley WATERSHED Report Card 2018 Maitland Conservation has prepared this report card as a summary of the state of your forests, wetlands, and water resources. WHERE ARE WE? We are one of 36 Conservation
The discharge shall include stormwater generated during the construction phase of the subdivision.
 Limits The discharge shall be only stormwater generated from: (a) Roofs, roads, hardstand areas, and pervious areas; and (b) Exposed areas during construction (optional); associated with the proposed [residential
Refer to Chapter 3.0 (Description of Development) for a detailed site and development description.
 for a detailed site and development description.") 7. WATER: HYDROGEOLOGY & HYDROLOGY 7.1 Introduction This chapter of the EIAR comprises of an assessment of the likely impact of the proposed development on the surrounding surface water and hydrogeological
7. WATER: HYDROGEOLOGY & HYDROLOGY 7.1 Introduction This chapter of the EIAR comprises of an assessment of the likely impact of the proposed development on the surrounding surface water and hydrogeological
The aims of the Kaipara River Catchment Water Allocation Strategy are:
 A Introduction 1 1 Background 1.1 Introduction The Kaipara River catchment is the third largest river system in the Auckland Region. In places, there are competing demands for the water resources of the
Whangamarino wetland - Outline for Collaborative Stakeholder Group discussion
 Whangamarino wetland - Outline for Collaborative Stakeholder Group discussion File No: 23 10 12 Date: 18 February 2016 To: From: Subject: Collaborative Stakeholder Group Technical Leader Group and Justine
Surface Water Guidance for Developers
 Surface Water Guidance for Developers Contents Overview of Sustainable Drainage Systems (SuDS)... 2 Information Required in a Flood Risk Assessment or Drainage Strategy... 3 Outline Planning Applications...
Municipal Stormwater Management Plan Prepared For The Borough of Cape May Point By Van Note-Harvey Associates VNH File No.
 Municipal Stormwater Management Plan Prepared For The Borough of Cape May Point By Van Note-Harvey Associates 2005 VNH File No. 35317-210-21 Table of Contents Introduction... 3 Goals... 3 Storm water Discussion...
S e c t i o n S u b d i vision
 S e c t i o n 2. 6 - S u b d i vision Subdivision is a process of defining and redefining land parcel boundaries and can provide a framework for future land use and development. Integrated, well planned
E2. Water quantity, allocation and use
 E2. Water quantity, allocation and use E2.1. Introduction E2 Water quantity, allocation and use Demand for water already equals or exceeds availability in some surface waterbodies and aquifers. Future
3.5 Hydrology & Hydraulics
 3.5 Hydrology & Hydraulics 3.5.1 Purpose The purpose of this section is to provide results from the analysis and assessment of the impact of the proposed Carmichael Rail Alignment (Option 11 Revision 1)
DETERMINATION OF LAND SUITABILITY FOR WASTEWATER IRRIGATION USING MULTI-LAYERED GIS APPROACH
 Lane, A., Beecroft, K., & Cass, S., 2018. Determination of land suitability for wastewater irrigation using a multilayered GIS approach. In: Farm environmental planning Science, policy and practice.. (Eds
Draft Greater Sydney Region Plan
 Draft Greater Sydney Region Plan Submission_id: 31236 Date of Lodgment: 13 Dec 2017 Origin of Submission: Online Organisation name: HARC Organisation type: Industry First name: Russell Last name: Beatty
MODEL Stormwater Local Design Manual. City of Centerville
 MODEL Stormwater Local Design Manual City of Centerville Adopted December 6, 2005 TABLE OF CONTENTS 1. FORWARD... 1 2. GENERAL LEVEL OF SERVICE STANDARDS... 1 2.1. DETENTION REQUIREMENTS... 1 2.1.1. Discharge
SECTION 3: Water, Wetlands and Waterways
 SECTION 3: Water, Wetlands and Waterways KEY PRIORITY To ensure protection of water quality and quantity for use by residents, the commercial sector and ecosystems, through integrated consultation, planning,
I433. Pukekohe Hill Precinct
 I433. Pukekohe Hill Precinct I433.1. Precinct Description The Pukekohe Hill Precinct covers approximately 196 hectares of land and is located at the southern urban edge of Pukekohe. Land use, development
Contents. LM Land Management 1. Issues 1. Objectives 4. Policies 4. Methods of Implementation 5. Rules 8. Land Management 14 September 2017
 Land Management 14 September 2017 Contents LM Land Management 1 Issues 1 Objectives 4 Policies 4 Methods of Implementation 5 Rules 8 BAY OF PLENTY REGIONAL COUNCIL TOI MOANA Land Management 14 September
PART 5D - NATURAL HAZARDS
 CONTENTS...PAGE 5D.1 CONTENT AND STRUCTURE...3 5D.2 RESOURCE MANAGEMENT ISSUES...3 5D.3 RESOURCE MANAGEMENT OBJECTIVE AND POLICIES...4 5D.4 RESOURCE MANAGEMENT STRATEGY...4 5D.5 IMPLEMENTATION...4 5D.6.RULES
Contents LM Land Management... 1
 Land Management 14 September 2017 Contents LM Land Management... 1 Issues... 1 Objectives... 4 Policies... 4 Methods of Implementation... 5 Rules... 8 BAY OF PLENTY REGIONAL COUNCIL TOI MOANA Land Management
B7. Toitū te whenua, toitū te taiao Natural resources
 B7. Toitū te whenua, toitū te taiao Natural resources Ngā ariki o te rangi, ngā ariki o te whenua, ngā ariki o te moana, ngā ariki o te taiao The chiefly deities of the sky, of the earth, of the sea, the
Storm Water Management
 Storm Water Management Policy September 2014 2 Sustainable drainage feature designed to control and manage flows through a series of check dams 3 Document Name: Storm Water Management Controlled Copy No:
CITY OF NEW WESTMINSTER. Bylaw No. 7033, 2005 RIPARIAN AREAS PROTECTION BYLAW
 CITY OF NEW WESTMINSTER Bylaw No. 7033, 2005 RIPARIAN AREAS PROTECTION BYLAW WHEREAS the City may preserve, protect, restore and enhance the natural environment near streams that support fish habitat from
Rural Living Environment
 1 RLE.1 Rural Living Environment RLE.1.1 Description & Expectations The Rural Living Environment (RLE) covers rural areas within the District that are either already characterised by lifestyle activities
Issues... 1 Objectives... 3 Policies... 4 Methods of Implementation... 5 Rules... 8
 Wetlands 14 September 2017 Contents WT Wetlands...1 Issues... 1 Objectives... 3 Policies... 4 Methods of Implementation... 5 Rules... 8 BAY OF PLENTY REGIONAL COUNCIL TOI MOANA 1 Wetlands 14 September
TABLE OF CONTENTS PART III - MINIMUM DESIGN STANDARDS Section 105 DRAINAGE SYSTEM DESIGN SPECIFICATIONS AND SCOPE 105.1
 TABLE OF CONTENTS PART III - MINIMUM DESIGN STANDARDS Section 105 DRAINAGE SYSTEM DESIGN SECTION TITLE PAGE 105.1. SPECIFICATIONS AND SCOPE 105.1 105.2. METHODS OF ANALYSIS 105.1 105.2.1. Rational Method
RPE.3.4. Rural Production Environment. Index. RPE.1.1 Description and Expectations
 RPE.1 Index RPE.1 RPE.1.1 RPE.1.2 RPE.1.3 RPE.1.4 RPE.2 RPE.2.1 RPE.2.2 RPE.2.3 RPE.3 Landuse Description and Expectations Objectives Policies Guidance Note Eligibility Rules Notification Rules Discretionary
LAKE COUNTY HYDROLOGY DESIGN STANDARDS
 LAKE COUNTY HYDROLOGY DESIGN STANDARDS Lake County Department of Public Works Water Resources Division 255 N. Forbes Street Lakeport, CA 95453 (707)263-2341 Adopted June 22, 1999 These Standards provide
IMPLEMENTATION GUIDELINE NO. 19 Vegetation Retention
 IMPLEMENTATION GUIDELINE NO. 19 Vegetation Retention Date of Council Resolution This guideline was adopted by Council on 12 December 2007 and takes effect on 19 December 2007, in accordance with section
ELK RAPIDS TOWNSHIP WATER QUALITY ACTION PLAN
 ELK RAPIDS TOWNSHIP WATER QUALITY ACTION PLAN Elk-River-Chain-of-Lakes Gaps Analysis Project The Watershed Center Grand Traverse Bay Tip of the Mitt Watershed Council Michigan Department of Natural Resources
CITY OF SPRING HILL Water Quality Buffer Zone Policy (Adopted April 22, 2008)
") Section I - Description CITY OF SPRING HILL Water Quality Buffer Zone Policy (Adopted April 22, 2008) A water quality buffer zone (a.k.a. a riparian zone) is a strip of undisturbed native (indigenous)
Section I - Description CITY OF SPRING HILL Water Quality Buffer Zone Policy (Adopted April 22, 2008) A water quality buffer zone (a.k.a. a riparian zone) is a strip of undisturbed native (indigenous)
Chapter 3 Dispersion BMPs
 Chapter 3 Dispersion BMPs 3.1 BMP L611 Concentrated Flow Dispersion 3.1.1 Purpose and Definition Dispersion of concentrated flows from driveways or other pavement through a vegetated pervious area attenuates
Planning Considerations for Stormwater Management in Alberta. R. D. (Rick) Carnduff, M. Eng., P. Eng. February 20, 2013.
 Carnduff, M. Eng., P. Eng. February 20, 2013.") Planning Considerations for Stormwater Management in Alberta R. D. (Rick) Carnduff, M. Eng., P. Eng. February 20, 2013 Photo Optional Purpose The purpose of urban stormwater management is to provide solutions
Planning Considerations for Stormwater Management in Alberta R. D. (Rick) Carnduff, M. Eng., P. Eng. February 20, 2013 Photo Optional Purpose The purpose of urban stormwater management is to provide solutions
Appendix 9 - Engineering Performance Standards
 Appendix 9 - Engineering Performance Standards A9.1 Introduction A9.1.1 This Appendix contains standards that apply to the subdivision of land. It is referred to in the Subdivision Rules for the Living,
Thinking about developing or building on land with ponding or drainage issues?
 Thinking about developing or building on land with ponding or drainage issues? Much of the Kāpiti Coast is low-lying and subject to flooding, ponding or drainage issues. We need to pay careful attention
Nuriootpa (Sturt Highway Service Centre) DPA The Barossa Council Appendices. Appendix C - Herriot Consulting Engineering Assessment
 DPA The Barossa Council Appendices. Appendix C - Herriot Consulting Engineering Assessment") Nuriootpa (Sturt Highway Service Centre) DPA The Barossa Council Appendices Appendix C - Herriot Consulting Engineering Assessment 4th May 2018 C1803-002 Rocland Estate Lot 147 Sturt Highway, Nuriootpa
Nuriootpa (Sturt Highway Service Centre) DPA The Barossa Council Appendices Appendix C - Herriot Consulting Engineering Assessment 4th May 2018 C1803-002 Rocland Estate Lot 147 Sturt Highway, Nuriootpa
13 Land Use Activities and Indigenous Biological Diversity
 13 Land Use Activities and Indigenous Biological Diversity 13.1 Land Use Activities 13.1.1 Objectives Objective 13-1: Accelerated erosion* - regulation of vegetation clearance*, land disturbance*, forestry*
DRAINAGE & DESIGN OF DRAINAGE SYSTEM
 Drainage on Highways DRAINAGE & DESIGN OF DRAINAGE SYSTEM P. R.D. Fernando Chartered Engineer B.Sc.(Hons), M.Eng. C.Eng., MIE(SL) Drainage Requirement of Highway Drainage System Introduction Drainage means
The Process for Designing for Shallow Groundwater. and Small Rainfall Event Management in Urban. Developments
 The Process for Designing for Shallow Groundwater and Small Rainfall Event Management in Urban Developments Bill Till* and Emma Monk *Presenting Author The Decision process for stormwater management in
Sustainable management of Christchurch's waterways and wetlands using stormwater soakage disposal
 Impacts of Urban Growth on Surface Water and Groundwater Quality (Proceedings of IUGG 99 Symposium HS5, Birmingham, July 1999). IAHS Publ. no. 259, 1999. 365 Sustainable management of Christchurch's waterways
ILLINOIS URBAN MANUAL PRACTICE STANDARD TEMPORARY STREAM CROSSING (no.) CODE 975. Source: Hey and Associates, Inc.
 CODE 975. Source: Hey and Associates, Inc.") ILLINOIS URBAN MANUAL PRACTICE STANDARD TEMPORARY STREAM CROSSING (no.) CODE 975 Source: Hey and Associates, Inc. DEFINITION A bridge or culvert crossing installed across a stream or watercourse for short-term
ILLINOIS URBAN MANUAL PRACTICE STANDARD TEMPORARY STREAM CROSSING (no.) CODE 975 Source: Hey and Associates, Inc. DEFINITION A bridge or culvert crossing installed across a stream or watercourse for short-term
Operative Ashburton District Plan
 Operative Ashburton District Plan Rural B Zone Map R62 Designations D53 and D65 RDR and MHIS infrastructure A49 Lower Rangitata River identified as site of Significant Nature Conservation Value G21 Geoconservation
RIPARIAN AREAS REGULATION
 Definitions and interpretation RIPARIAN AREAS REGULATION 1 (1) In this regulation: Act means the Fish Protection Act; active floodplain means an area of land that supports floodplain plant species and
WELCOME. Eastern Subwatersheds Stormwater Management Retrofit Study. Online Information Session
 WELCOME Eastern Subwatersheds Stormwater Management Retrofit Study Online Information Session July 31 to Septemberember 19, 2014 1 Eastern Subwatersheds Stormwater Management Retrofit Study This study
16.0 Water Quality Management Criteria for Developed Land
 October 2003, Revised February 2005 Criteria for Developed Land Page 1 16.1 Introduction 16.0 Water Quality Management Criteria for Developed Land Stormwater quality control is an integral part of any
Appendix P. P1 - BPO Device Selection P2 - BPO Assessment Alternatives Considered. Document No. NCI-3PRE-2ENV-RPT-0029 Project No.
 Appendix P P1 - BPO Device Selection P2 - BPO Assessment Alternatives Considered This page has been intentionally left blank. Appendix P1 BPO Device Selection Stormwater Management Devices Selection The
Warner Robins Stormwater Local Design Manual
 Warner Robins Stormwater Local Design Manual Prepared for Houston County City of Warner Robins City of Perry City of Centerville May 17, 2005 Version 4 (As presented with adopted Stormwater Ordinance)
The SuDS Manual Frequently asked questions
 The SuDS Manual Frequently asked questions 1. Is source control still a requirement of the new SuDS Manual? Yes. Source control components are fundamental elements of a SuDS scheme. The benefits of source